


Características


¿Tienes alguna pregunta?
Recomendar


6 diapositivas
Dashboard Project Infographic
A dashboard project is a visual representation of important data and key performance indicators presented in a single, easy-to-understand display. This infographic template provides real-time insights and allows users to monitor, analyze, and make data-driven decisions efficiently. This template is perfect for project managers, team leaders, and stakeholders looking to present project progress, key performance indicators, and other important metrics. The visuals display the progress of the project over time, using charts and graphs to show completed tasks, ongoing activities, and upcoming deadlines. Compatible with Powerpoint, Keynote, and Google Slides.


5 diapositivas
Innovative Concept Pitch Presentation
Present your big ideas with impact using this lightbulb puzzle infographic. Perfect for concept development, product ideation, or startup pitches. The layered segments help structure your content clearly. Fully customizable in PowerPoint, Keynote, and Google Slides—ideal for innovation roadmaps, creative planning, or visualizing business concepts.


6 diapositivas
Social Science Infographics
The "Social Science" infographic template is an intellectually stimulating and visually engaging tool, thoughtfully designed for PowerPoint, Keynote, and Google Slides. This template is a brilliant resource for educators, researchers, and students who seek to present the multifaceted aspects of social sciences in a clear and compelling manner. This template skillfully encompasses various disciplines within social science, such as anthropology, sociology, psychology, and political science. It presents key theories, methodologies, and findings in an organized and digestible format. This makes it an invaluable aid for academic presentations, research proposals, or educational discussions, facilitating a deeper understanding of human society and social relationships. The design is as thought-provoking as the subject it represents, with a color scheme that stimulates intellectual curiosity while maintaining clarity and focus. This not only enhances the visual appeal of the presentation but also complements the analytical and reflective nature of social science. Whether used in a lecture hall, a conference, or a study group, this template ensures that the complex world of "Social Science" is presented in an engaging, informative, and visually captivating manner.


7 diapositivas
RACI Matrix Manufacturing Infographic
The RACI matrix, an essential tool for defining roles and responsibilities, finds vital applications in the realm of manufacturing. Our RACI matrix manufacturing infographic, bathed in shades of blue against a clean white canvas with tasteful black accents, simplifies the complex choreography of tasks, roles, and accountabilities in manufacturing processes. Designed particularly for manufacturing managers, team leaders, and project coordinators, this template vividly illustrates how tasks are assigned and to whom, ensuring clarity and streamlining operations. Ready-to-use, it integrates seamlessly with PowerPoint, Keynote, and Google Slides.


6 diapositivas
Ishikawa Diagram Analysis Presentation
Break down complex problems and identify root causes with this Ishikawa Diagram Analysis template. Ideal for quality control, project management, and strategic planning. Clean, editable design allows easy customization to fit your needs. Compatible with PowerPoint, Keynote, and Google Slides for seamless workflow integration.


21 diapositivas
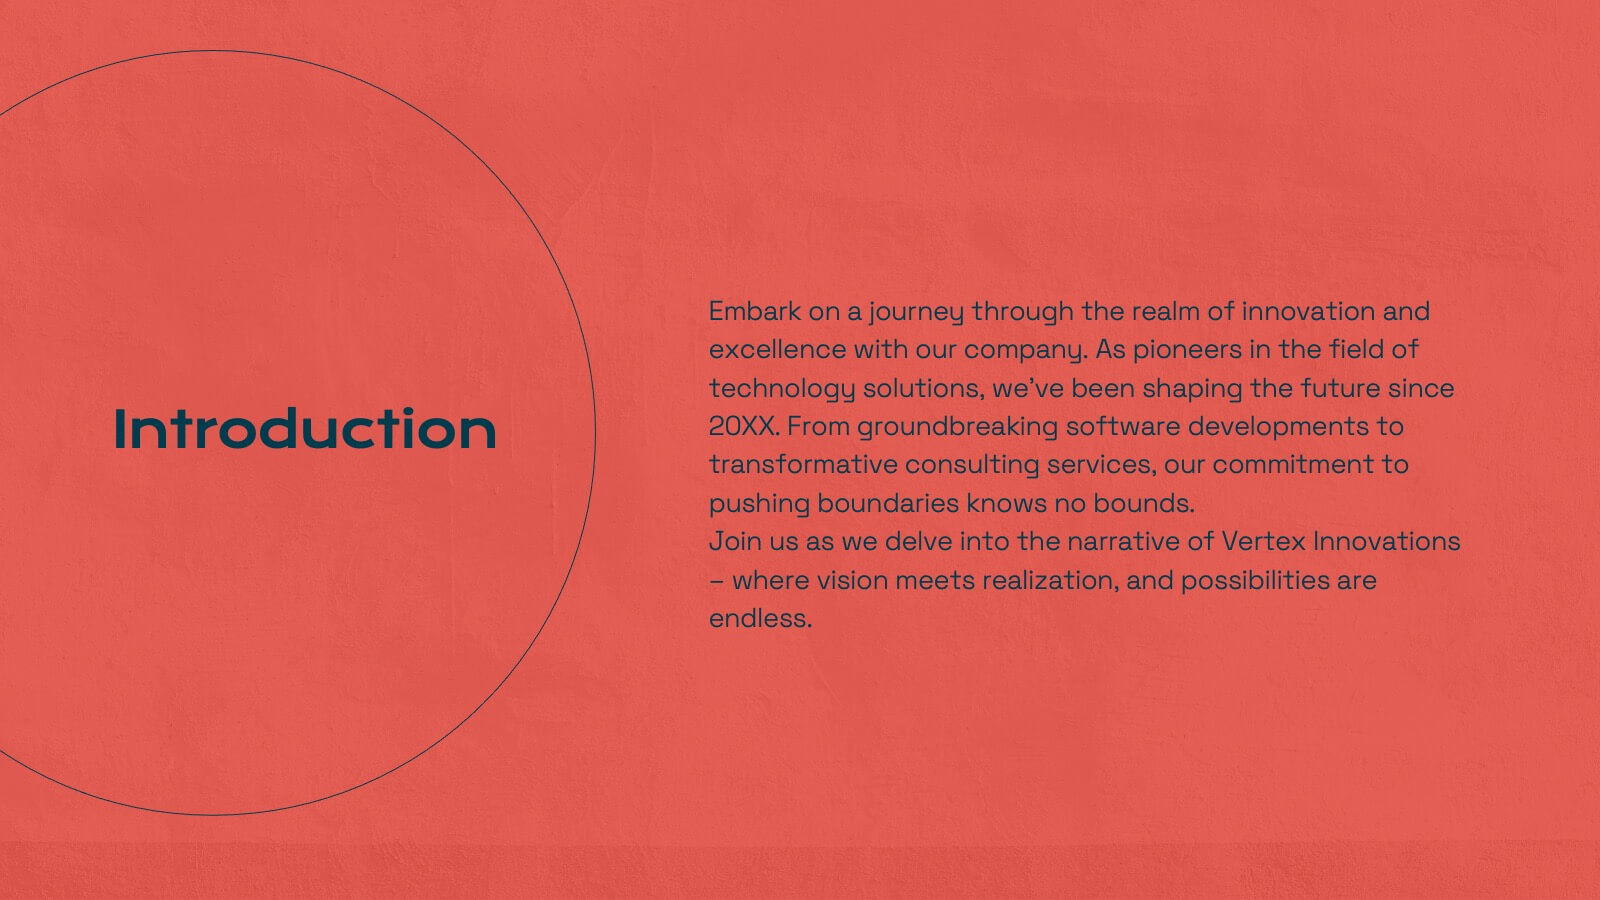
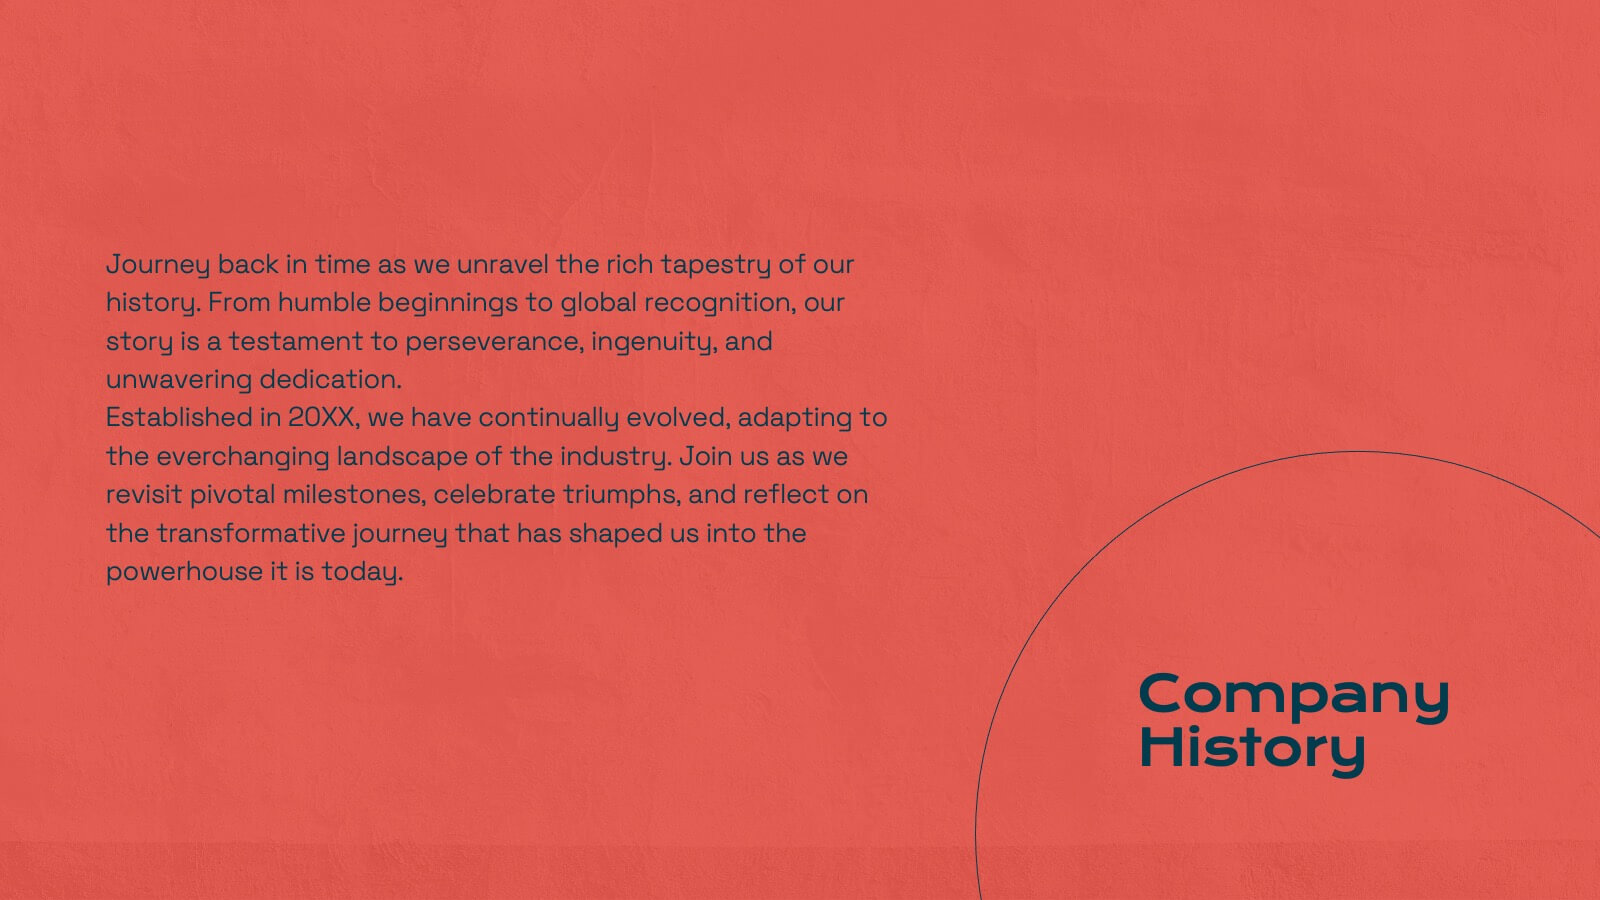
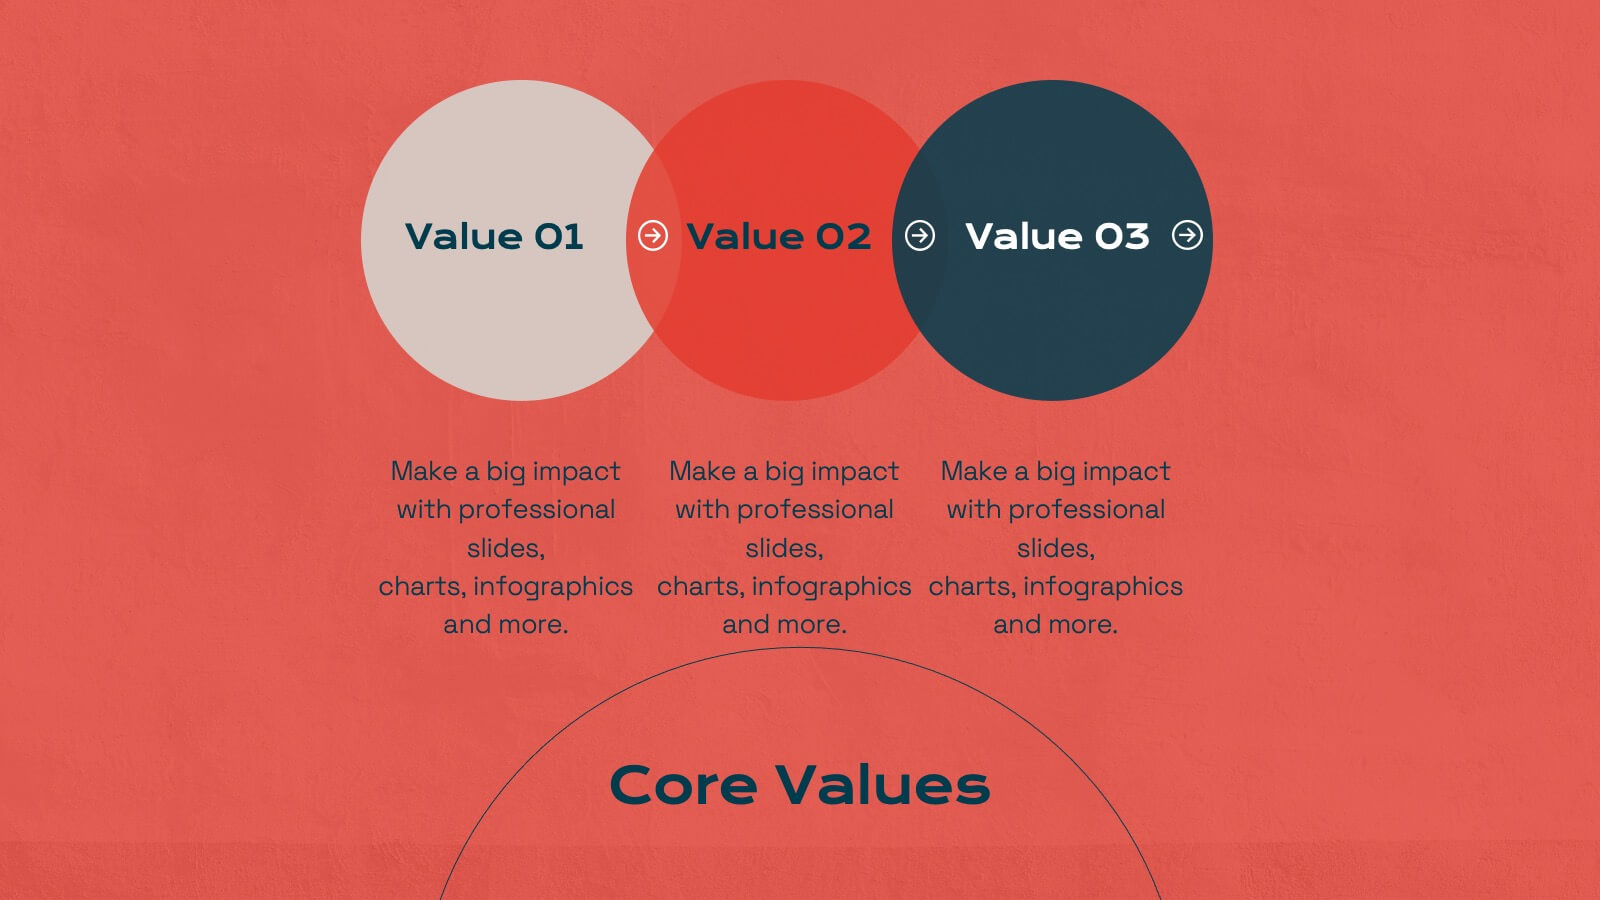
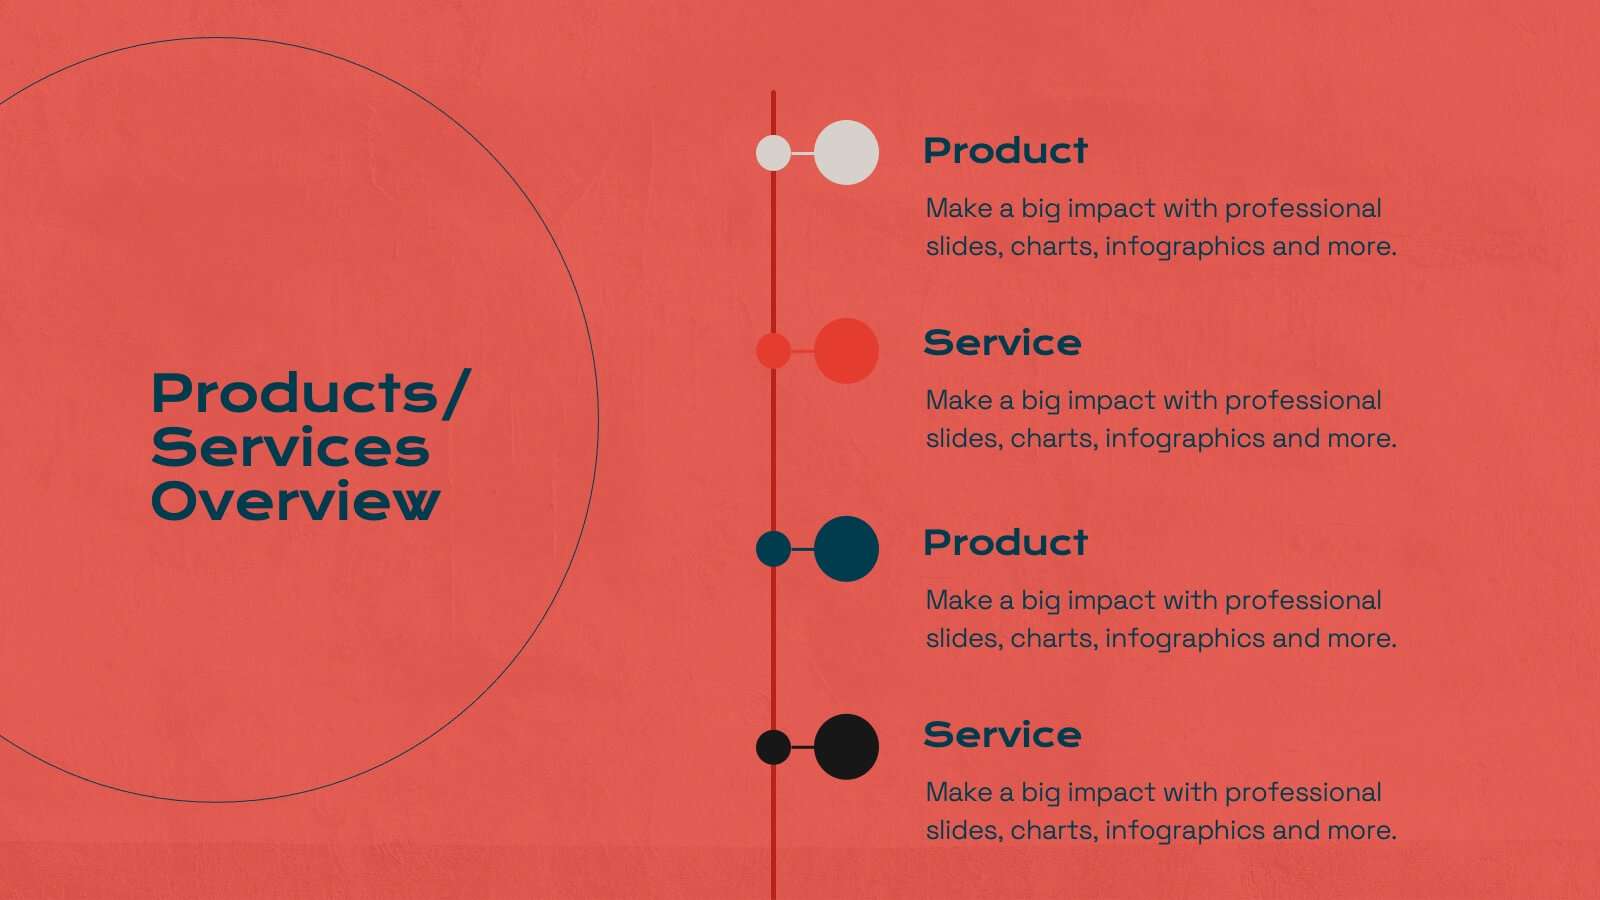
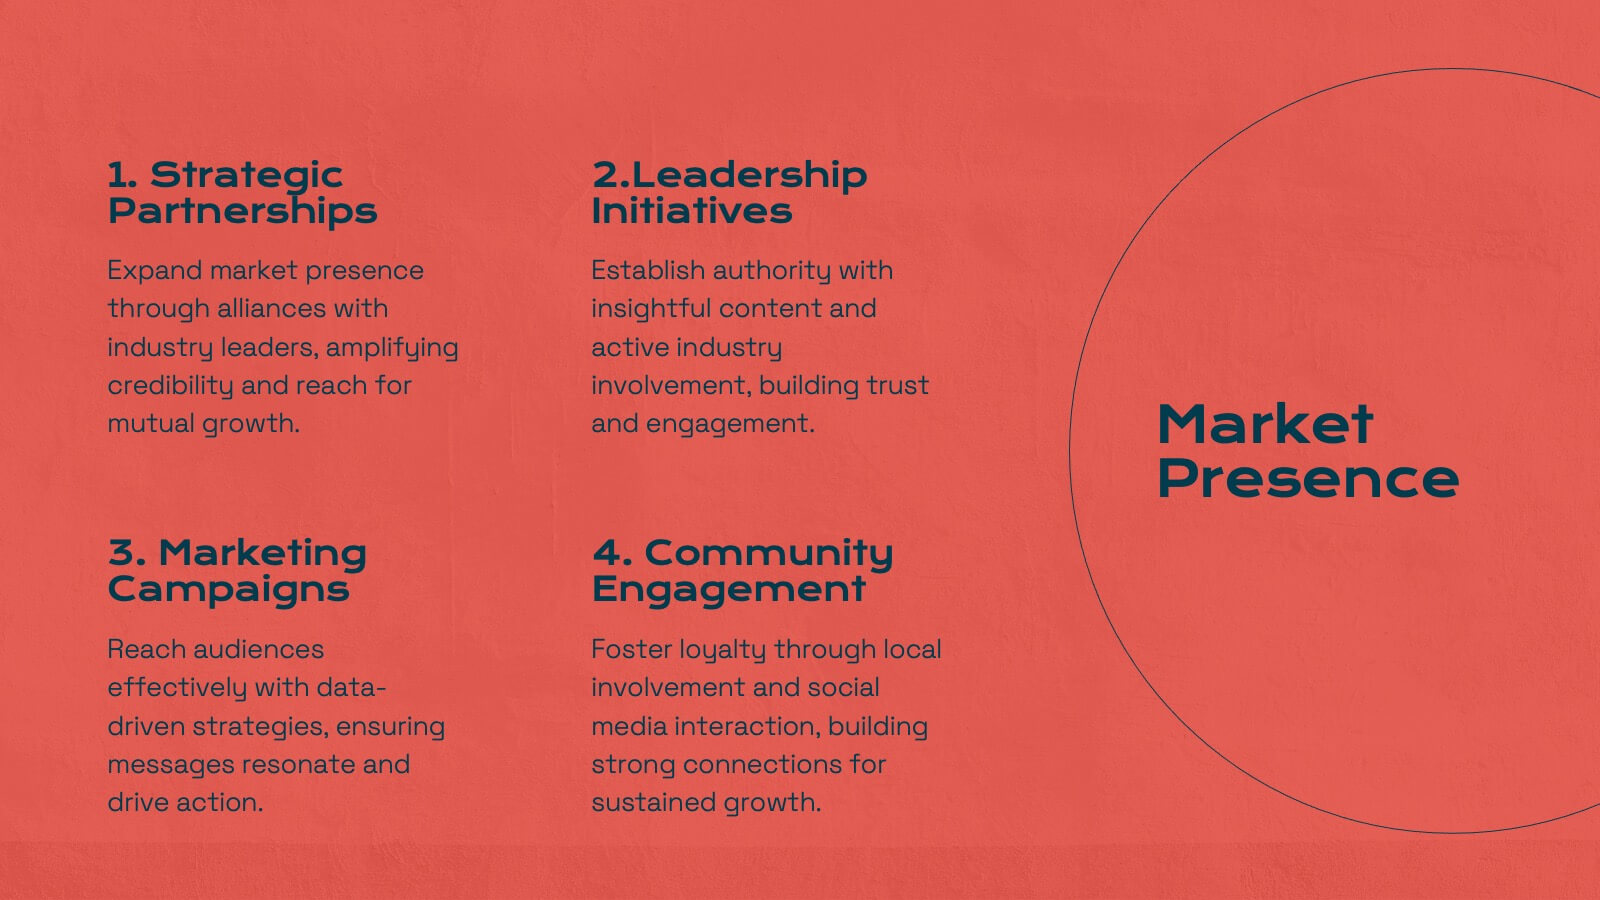
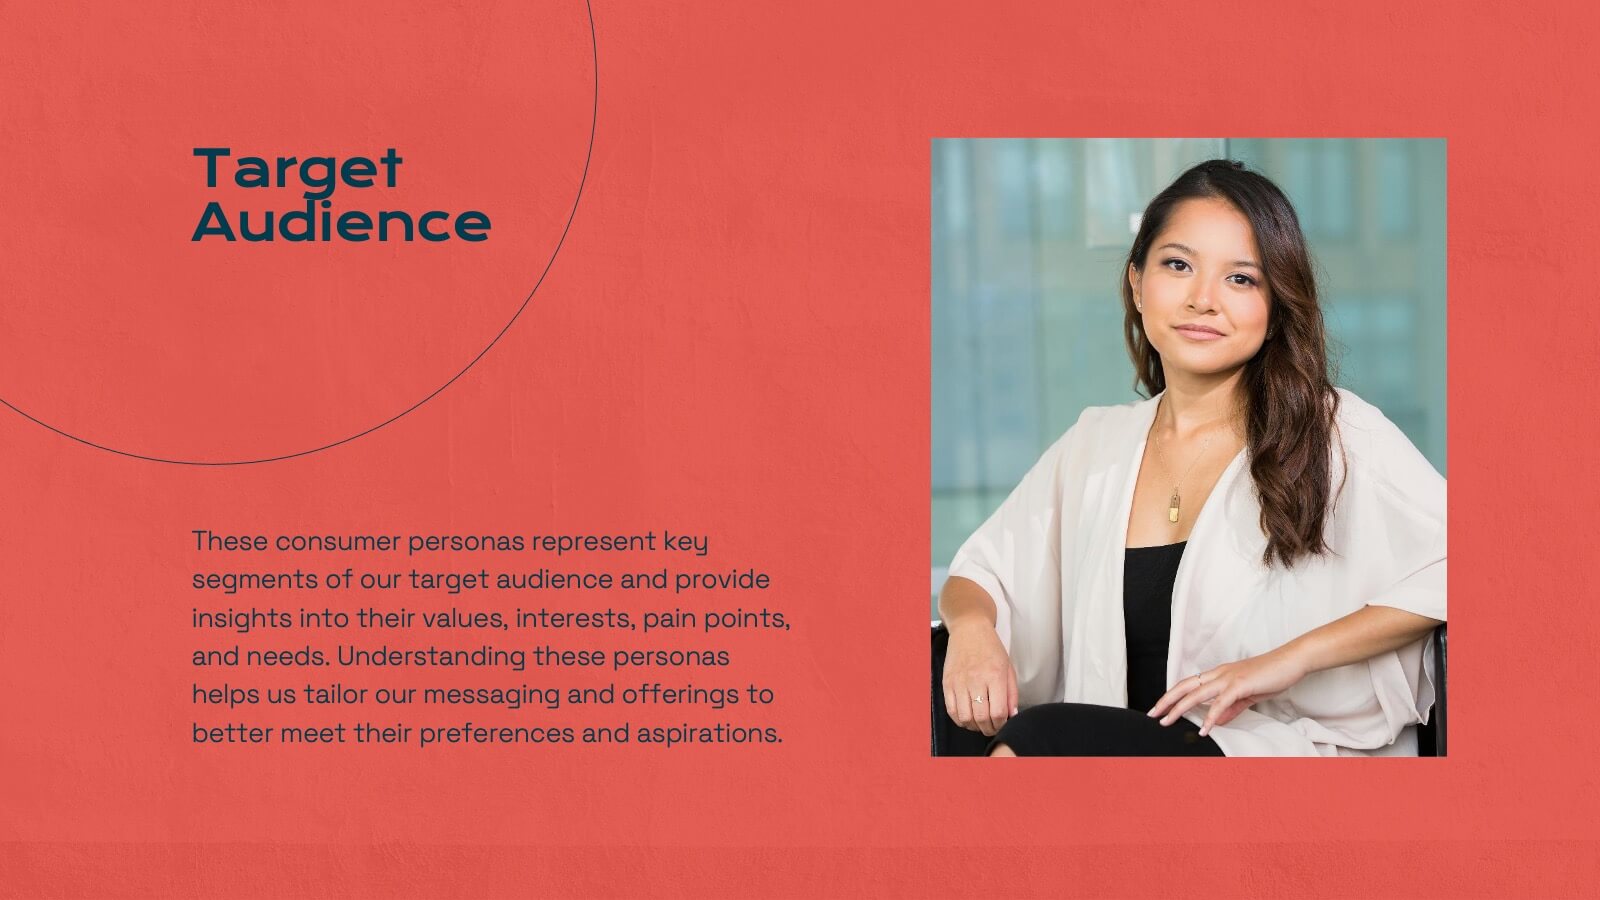
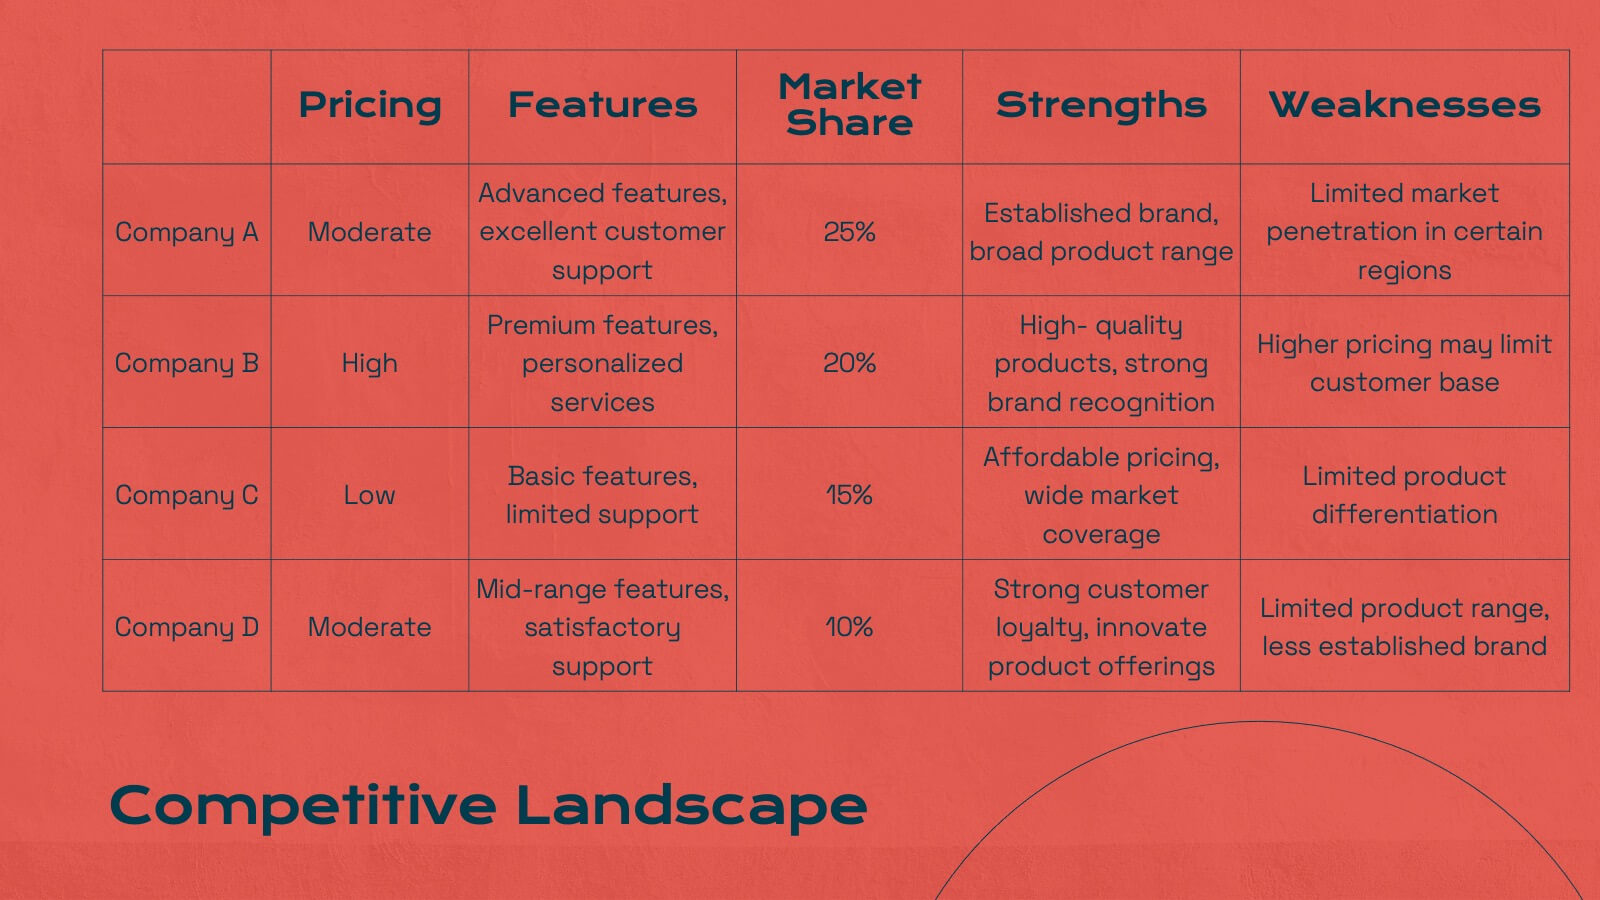
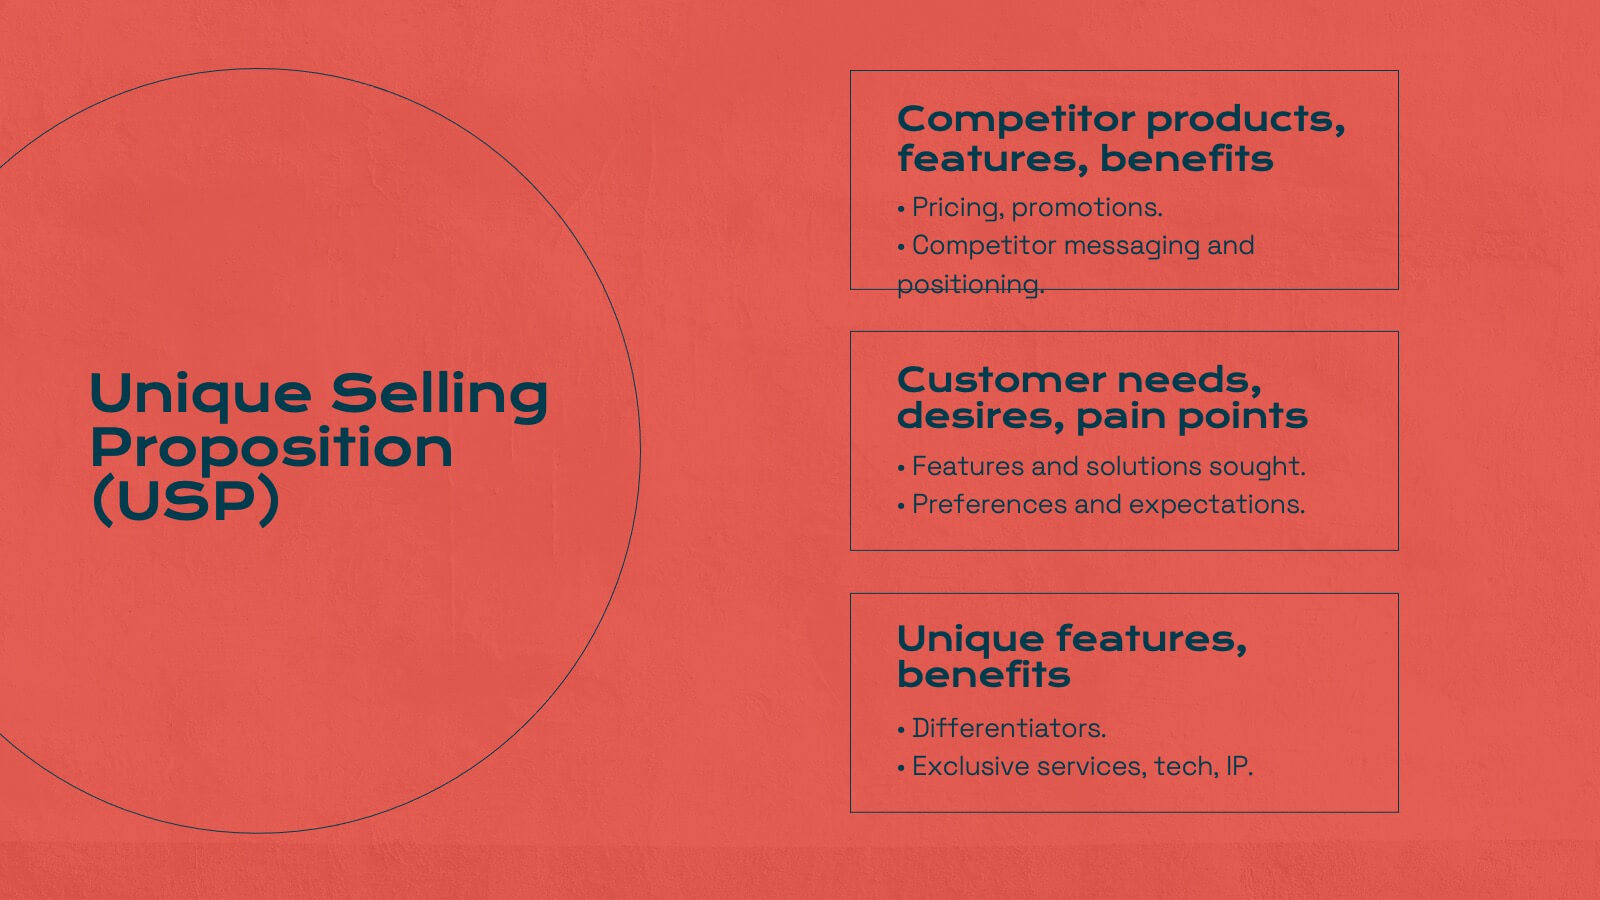
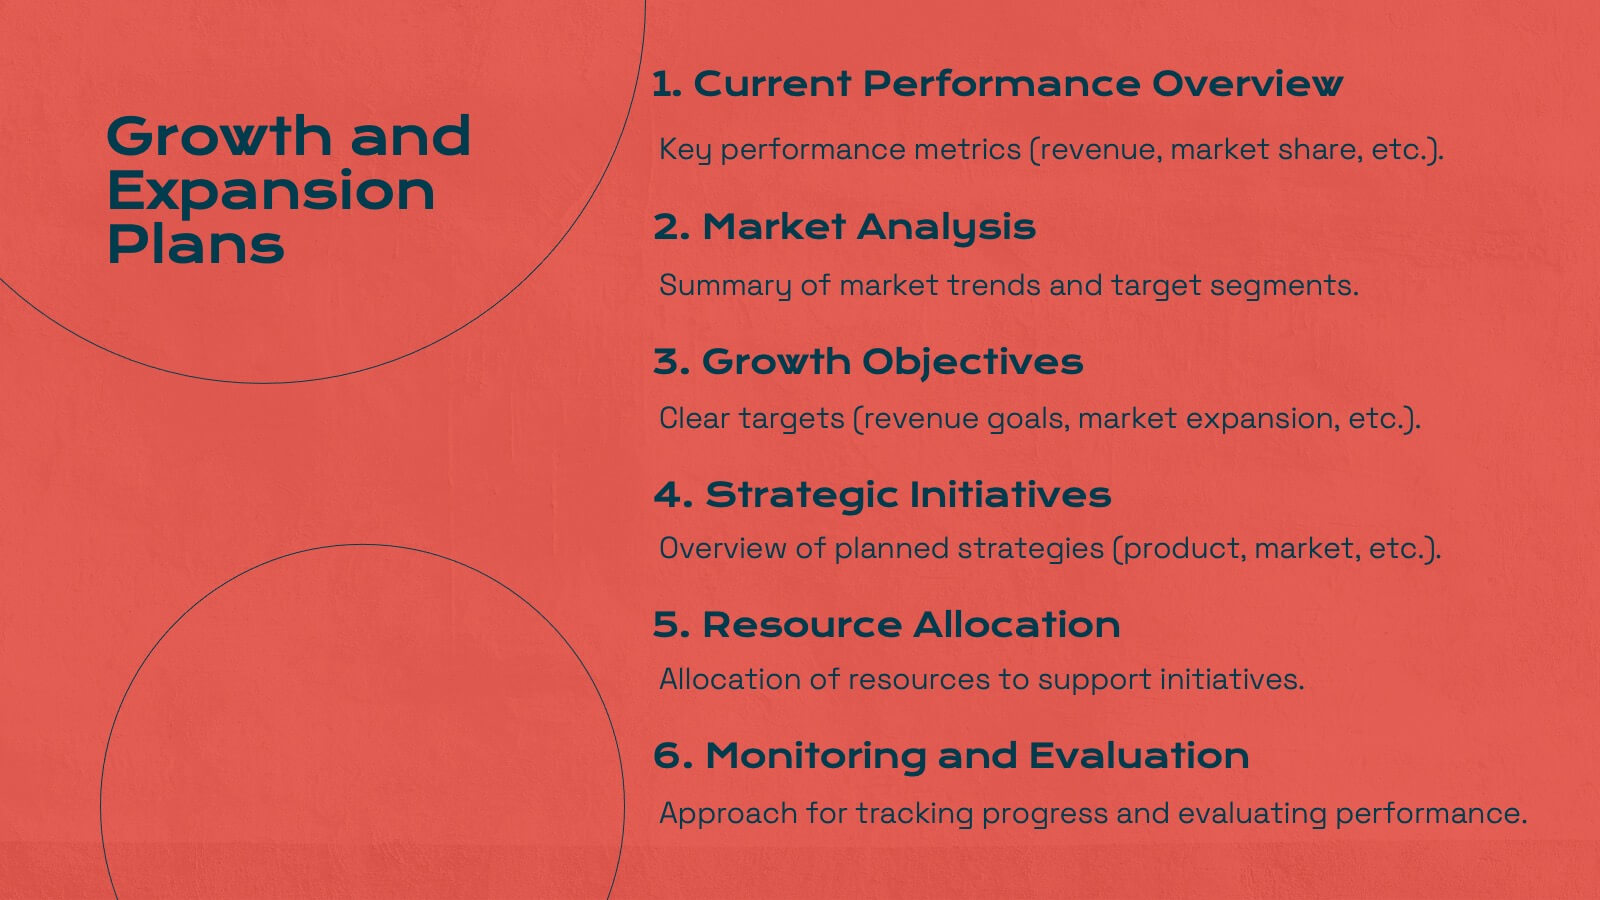
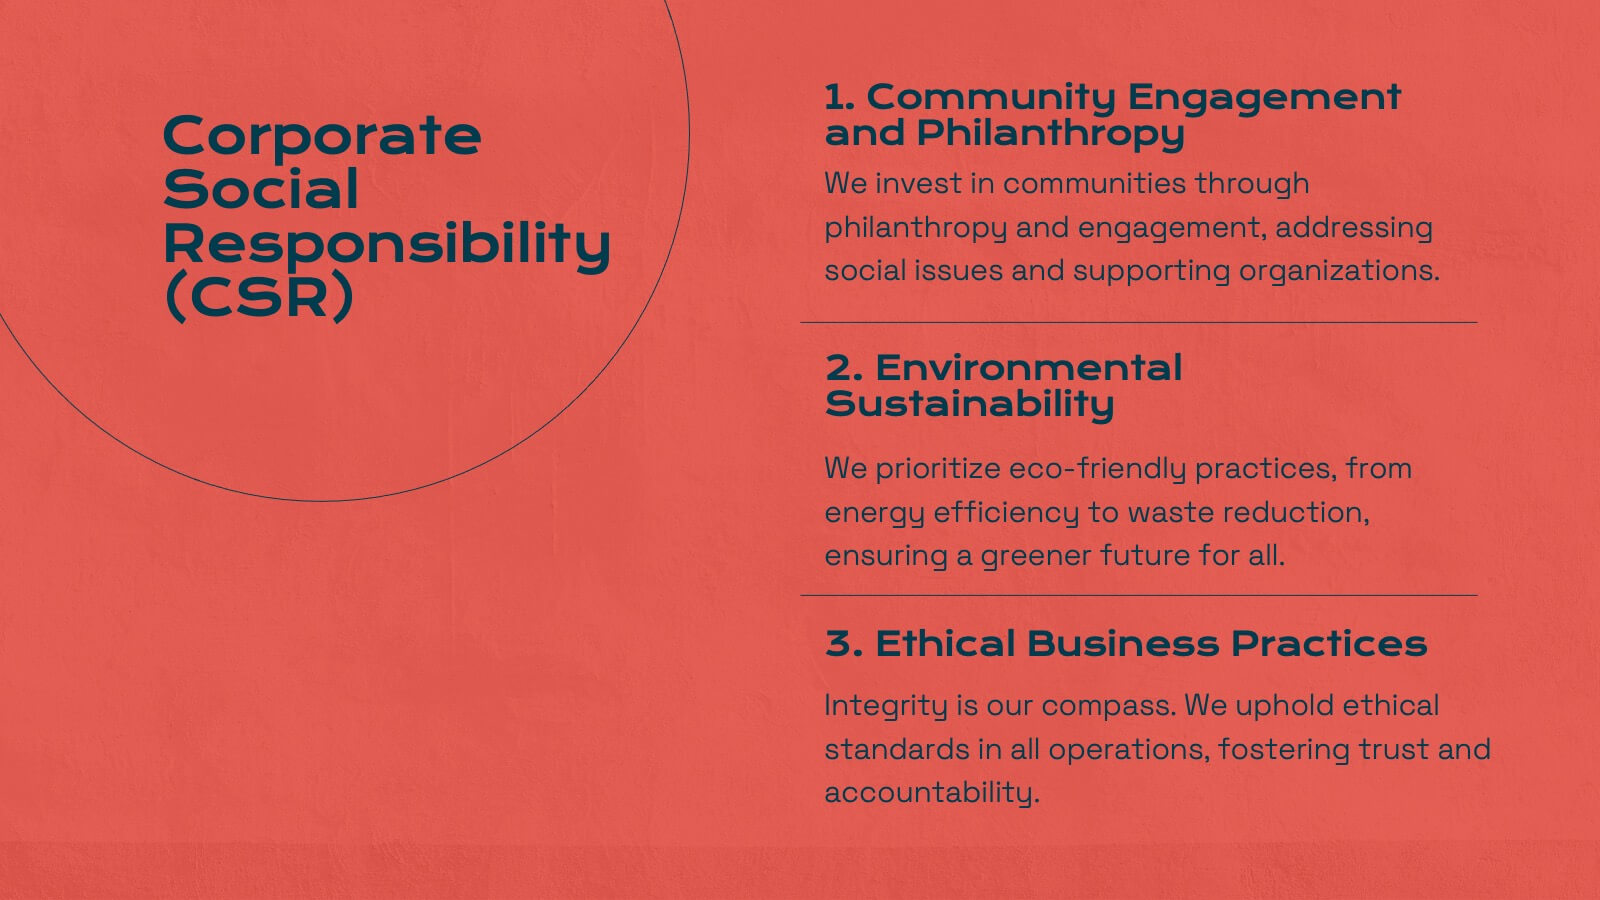
Titan Marketing Research Report Presentation
Energize your marketing research presentations with this bold, vibrant template. Perfect for detailing company history, market presence, and competitive landscapes, it features a striking red design that captures attention. Highlight key insights like target audience, financial highlights, and growth plans to engage your audience. Compatible with PowerPoint, Keynote, and Google Slides, it ensures seamless presentations on any platform.


7 diapositivas
Bubble Map Infographics Presentation Template
Our Bubble Map Infographic is an easy-to-create, visually appealing way to display your data. This template is perfect for educators looking to engage their audience, and for anyone wanting to share information in an interesting way. The graphics are easy to customize by adding your own text or images and there are PowerPoint versions available. This template features a lot of animated bubbles that will help illustrate your points, making them easier to understand than ever before. The color-coded categories make it easy to navigate through the dots and find whatever you need with ease.


6 diapositivas
Value Chain Management Infographics
Optimize your business operations with our Value Chain Management infographic template. This template is fully compatible with popular presentation software like PowerPoint, Keynote, and Google Slides, enabling you to effortlessly customize it to visualize and improve your value chain. The Value Chain Management infographic template offers a visually engaging platform to depict the various activities and processes involved in creating value for your customers. Whether you're a supply chain professional, business owner, or manager, this template provides a user-friendly canvas to create informative presentations and strategies for value chain optimization. Boost your business's efficiency and competitiveness with this SEO-optimized Value Chain Management infographic template, thoughtfully designed for clarity and ease of use. Customize it to highlight key components of your value chain, identify areas for improvement, and streamline your operations for enhanced value creation. Start crafting your personalized infographic today to excel in value chain management.


8 diapositivas
Company Achievements Year in Review Presentation
Highlight milestones with impact using the Company Achievements Year in Review Presentation. This dynamic slide uses a multi-layered, pyramid-style layout to showcase your organization’s key wins, progress, and stats throughout the year. Perfect for internal reviews, investor decks, or annual reports. Fully editable and compatible with PowerPoint, Keynote, and Google Slides.


7 diapositivas
Project Timeline Presentation
Visualize key milestones with this project timeline presentation template. Designed to highlight each phase with clarity, it's perfect for project managers, planners, and teams tracking progress. The horizontal layout, color-coded steps, and year indicators make it easy to customize in PowerPoint, Keynote, or Google Slides for any industry.


5 diapositivas
RAPID Framework for Business Strategy
Clarify decision-making roles with confidence using this vibrant business strategy framework. This template visualizes the RAPID model—Recommend, Agree, Perform, Input, Decide—in a clear flow that simplifies collaboration and speeds up strategy execution. Ideal for leadership teams and cross-functional planning. Works seamlessly in PowerPoint, Keynote, and Google Slides.


4 diapositivas
Statistical Analysis Charts Presentation
Present your data with clarity using this Statistical Analysis Charts Presentation Template. Designed with overlapping bubble visuals and percentage indicators, it’s ideal for displaying survey results, statistical breakdowns, or demographic segments. Clean, modern, and fully editable in PowerPoint, Keynote, and Google Slides.


6 diapositivas
Branching Structure Tree Chart Presentation
Visualize ideas, processes, or team structures with the Branching Structure Tree Chart Presentation. This elegant tree diagram layout allows you to display six key points or stages branching out naturally from a central concept. Ideal for organizational charts, decision flows, or brainstorming visuals. Fully editable in PowerPoint, Keynote, and Google Slides.


28 diapositivas
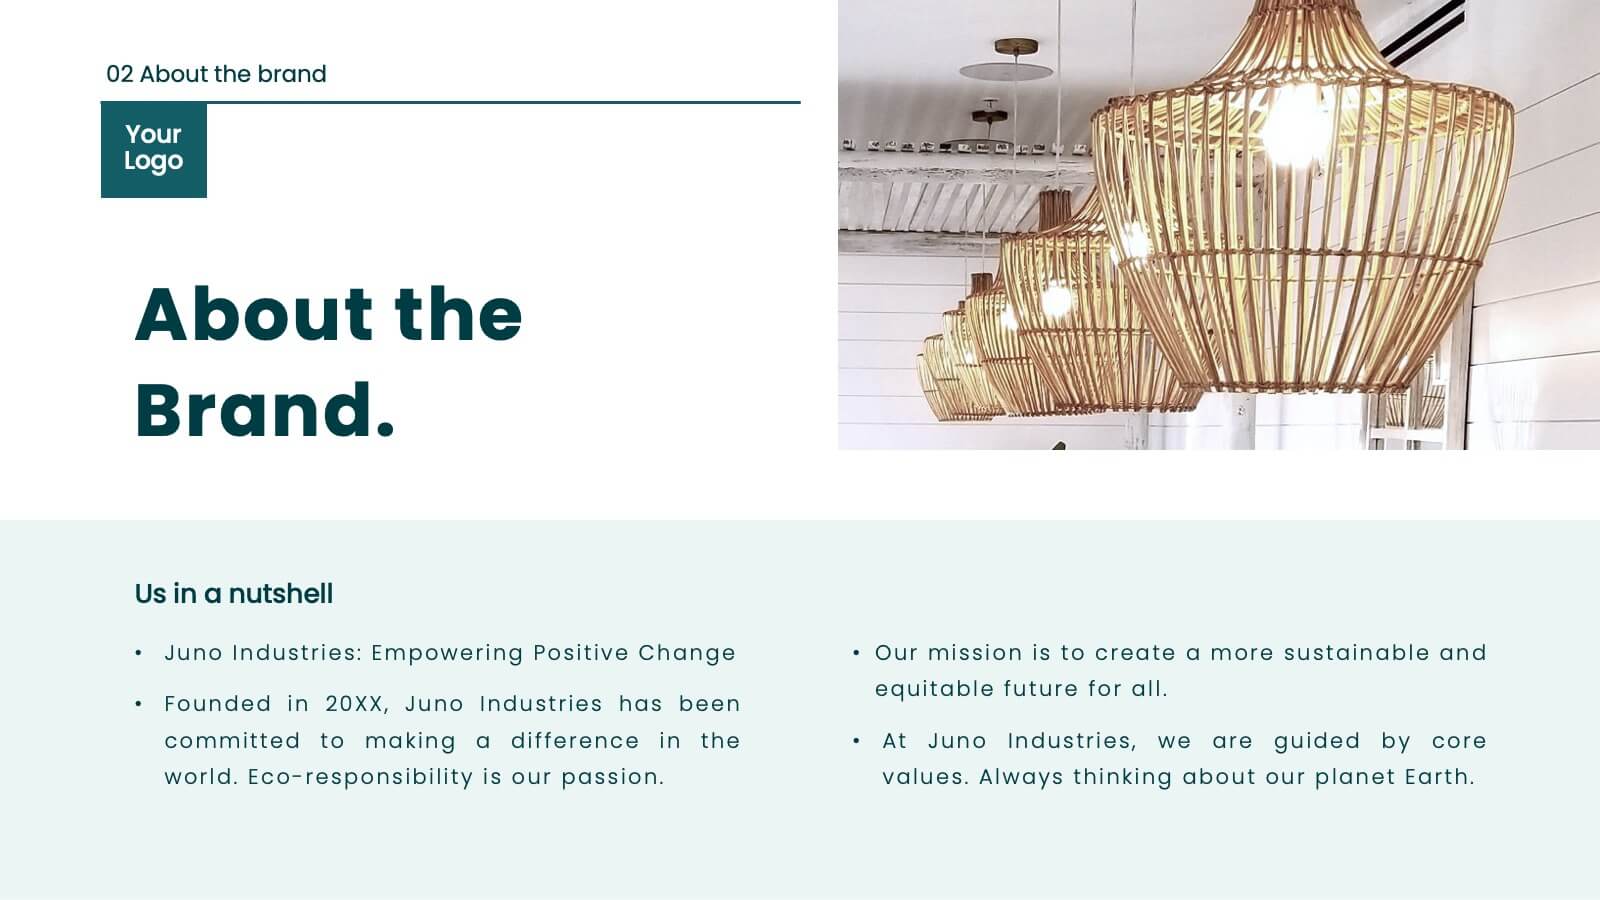
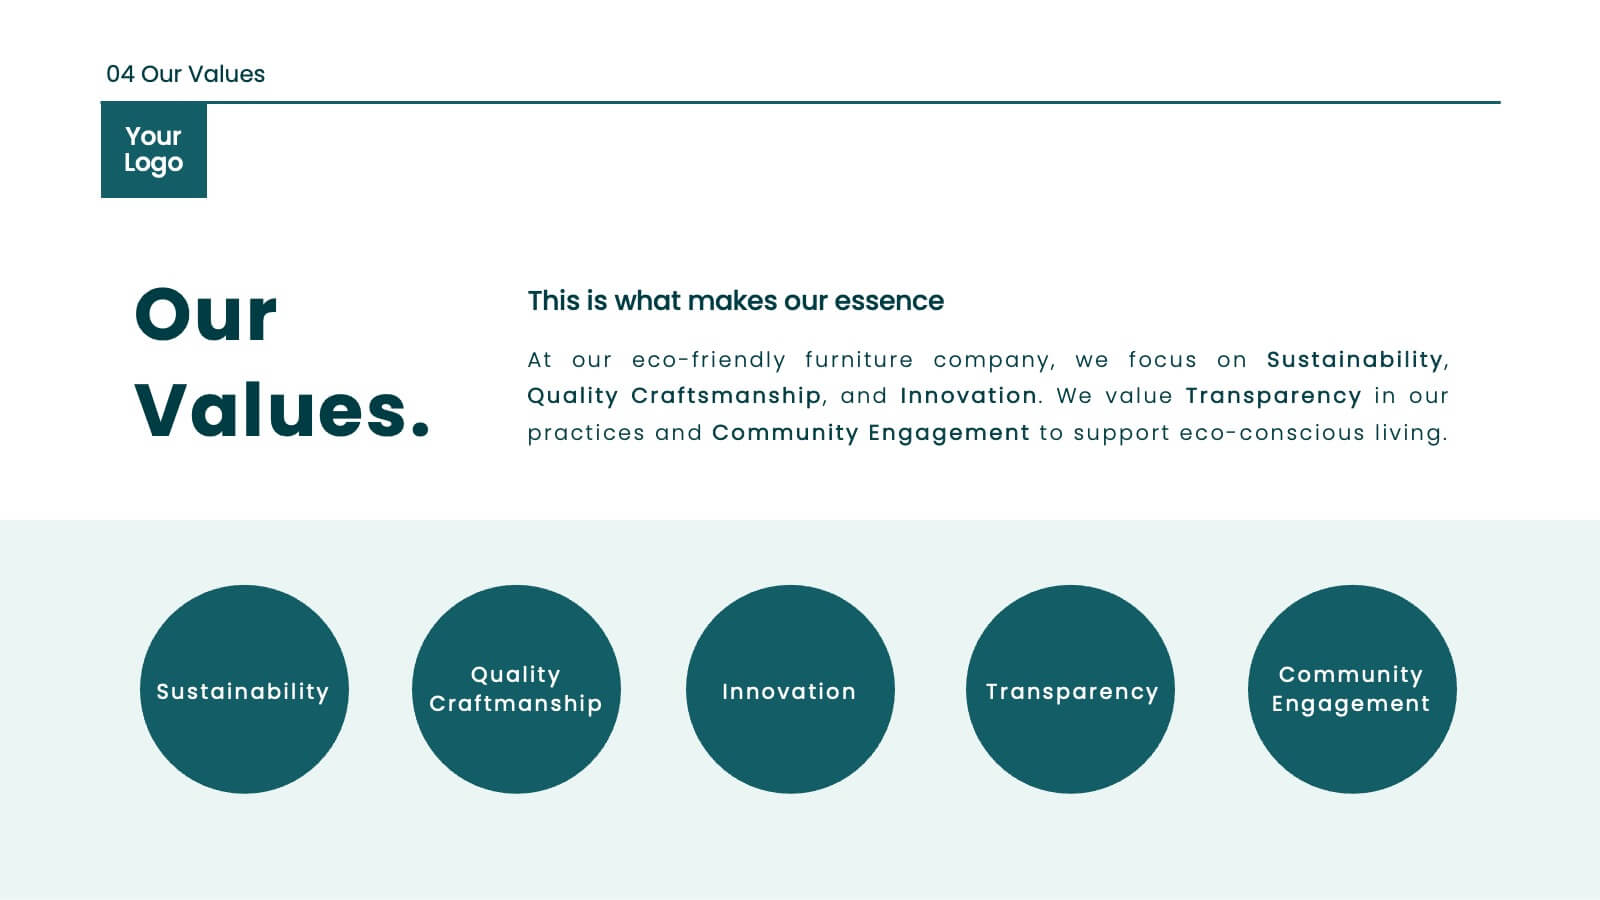
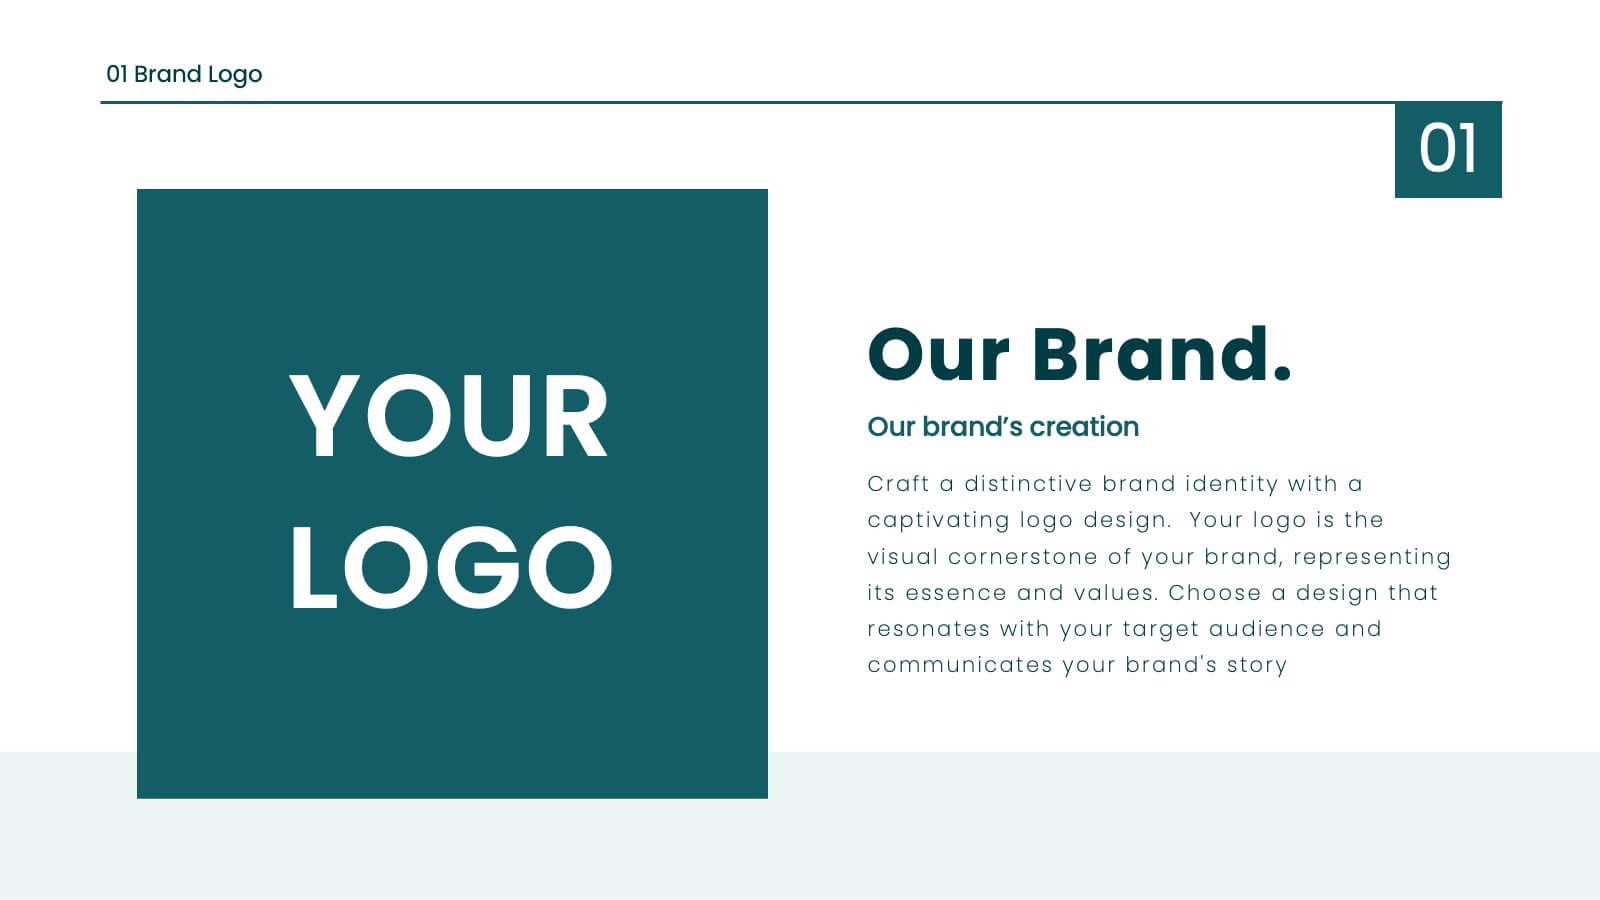
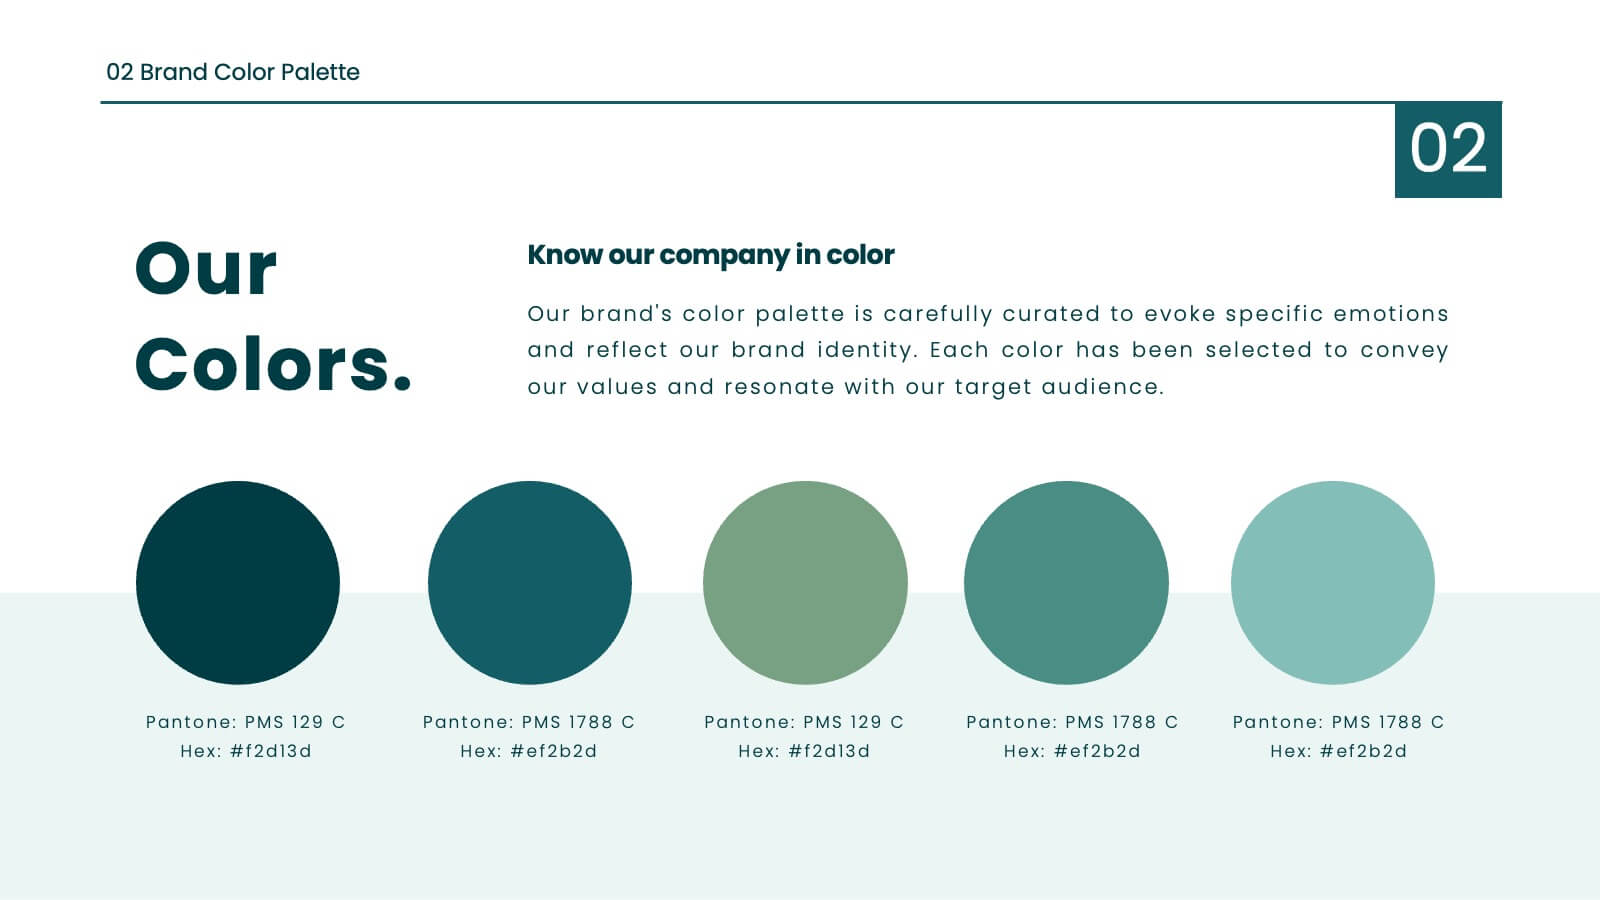
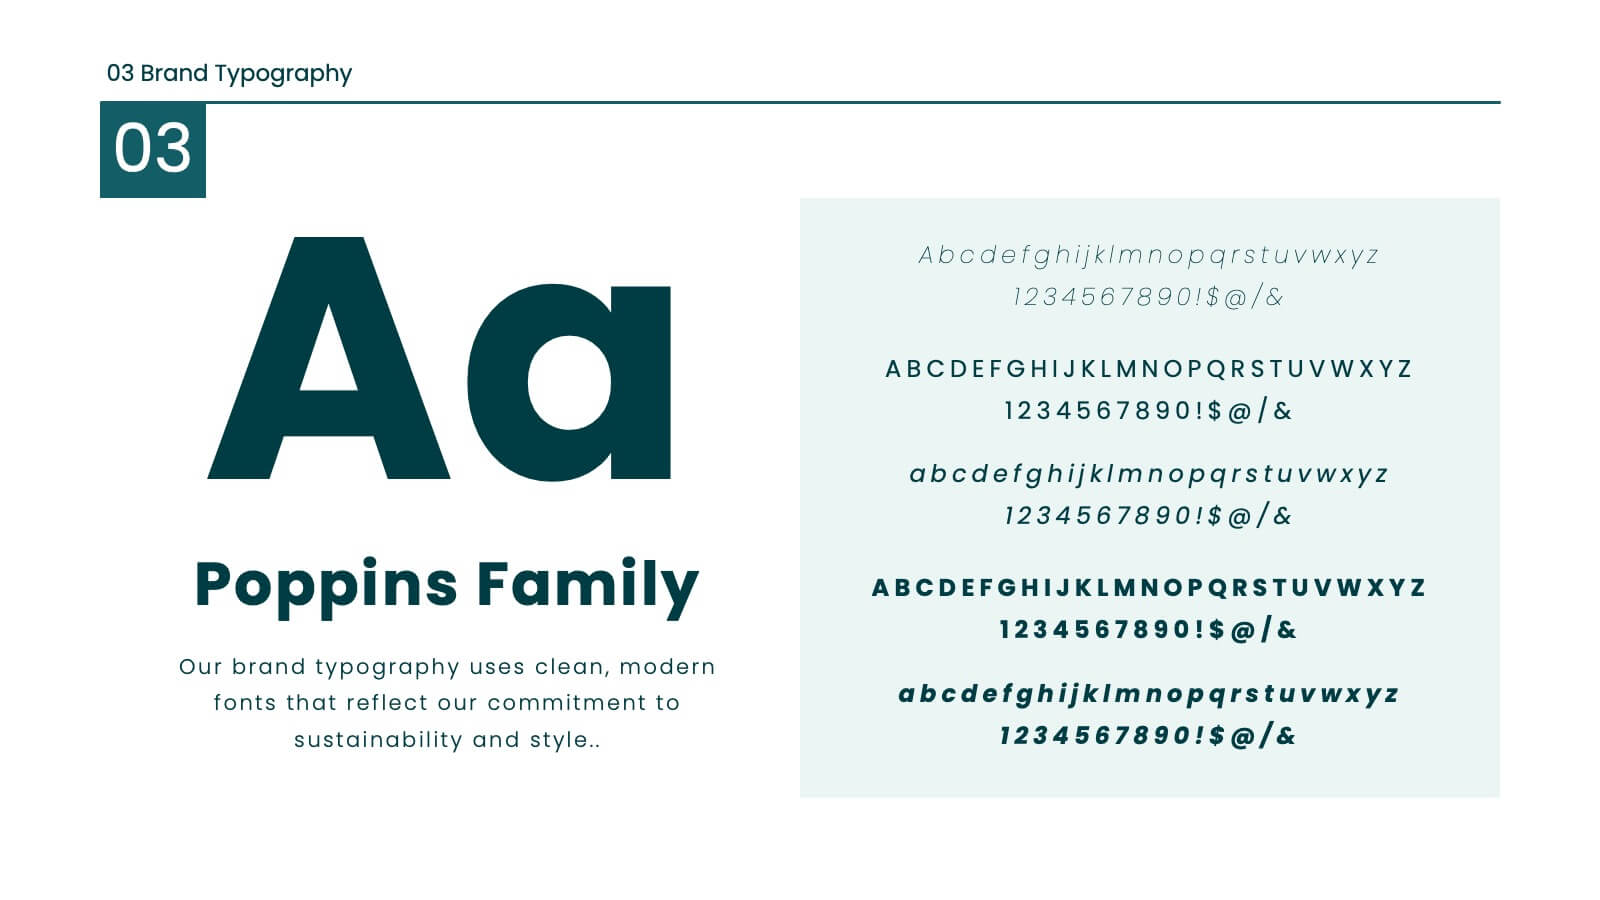
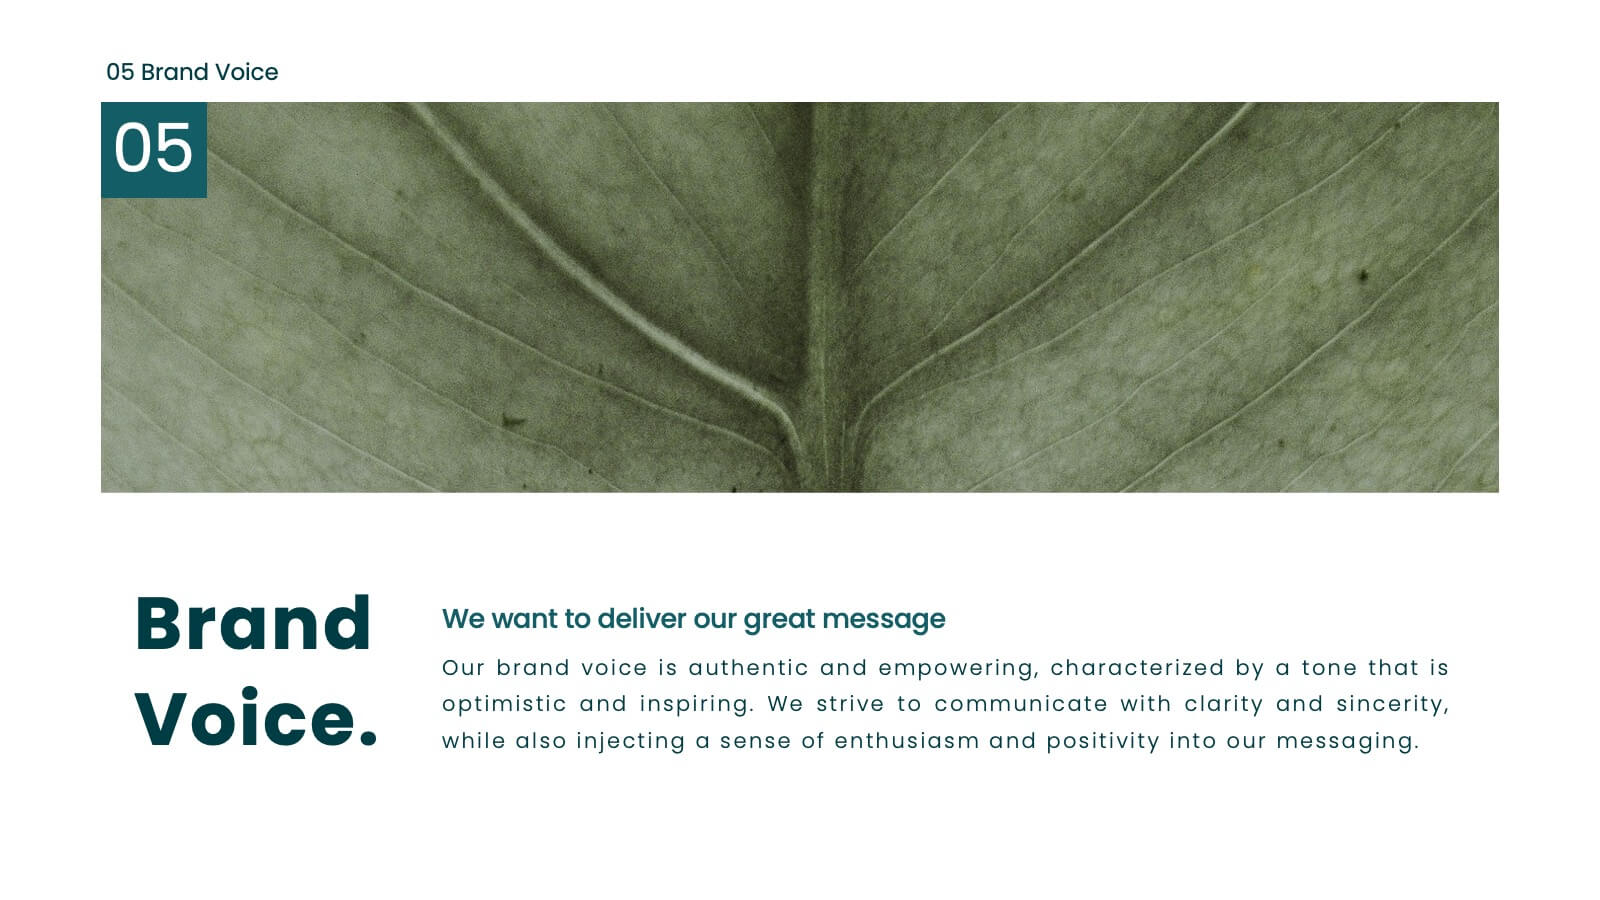
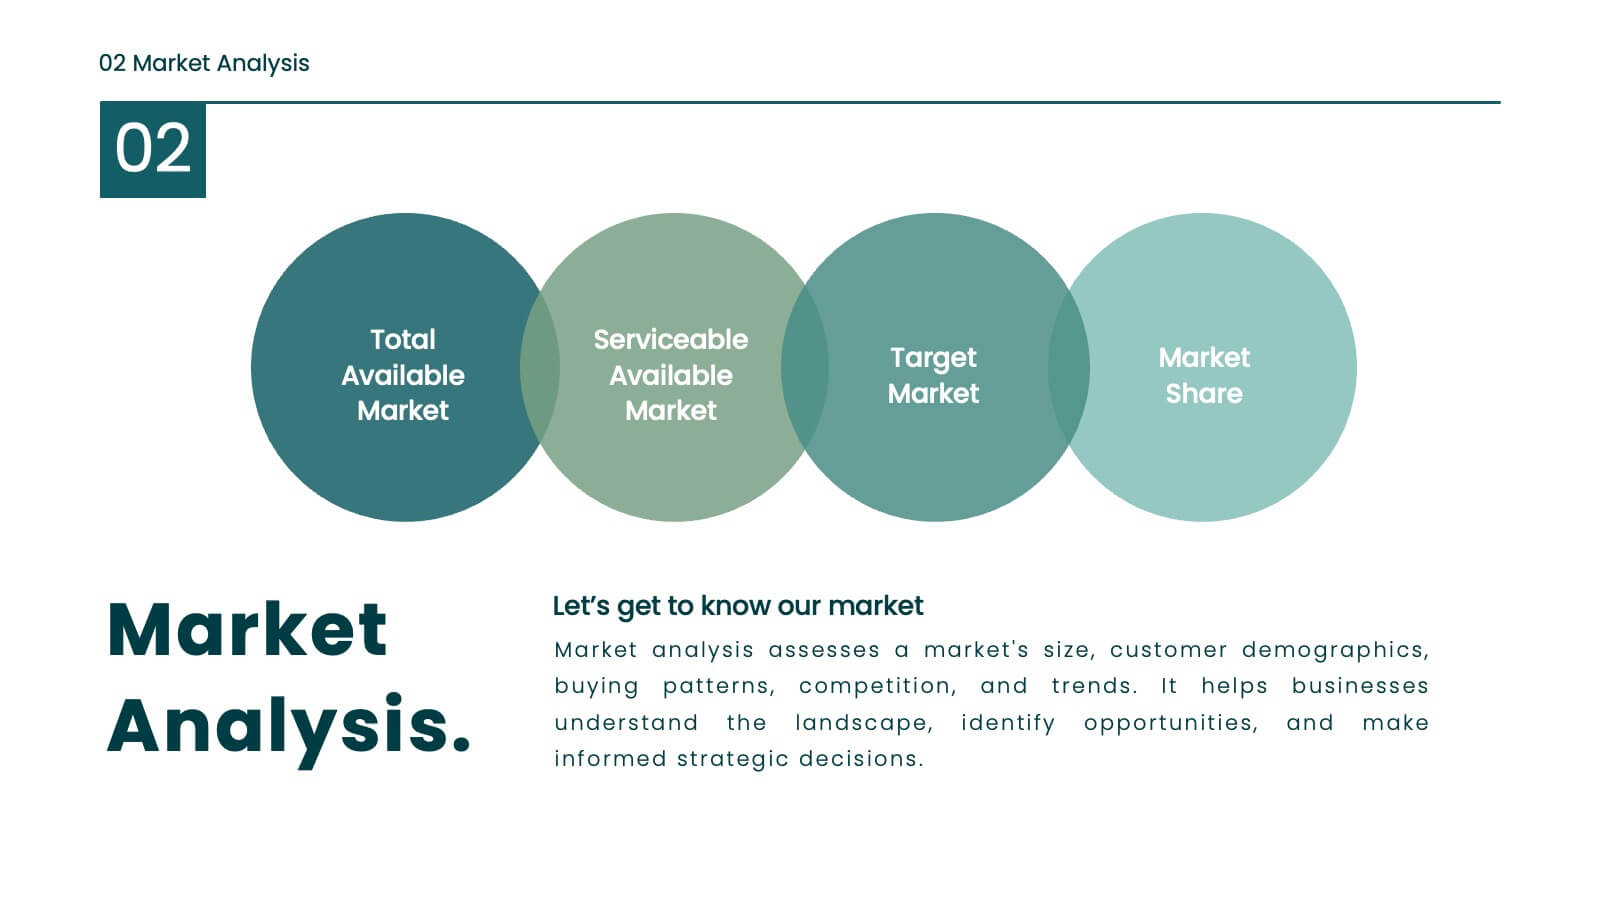
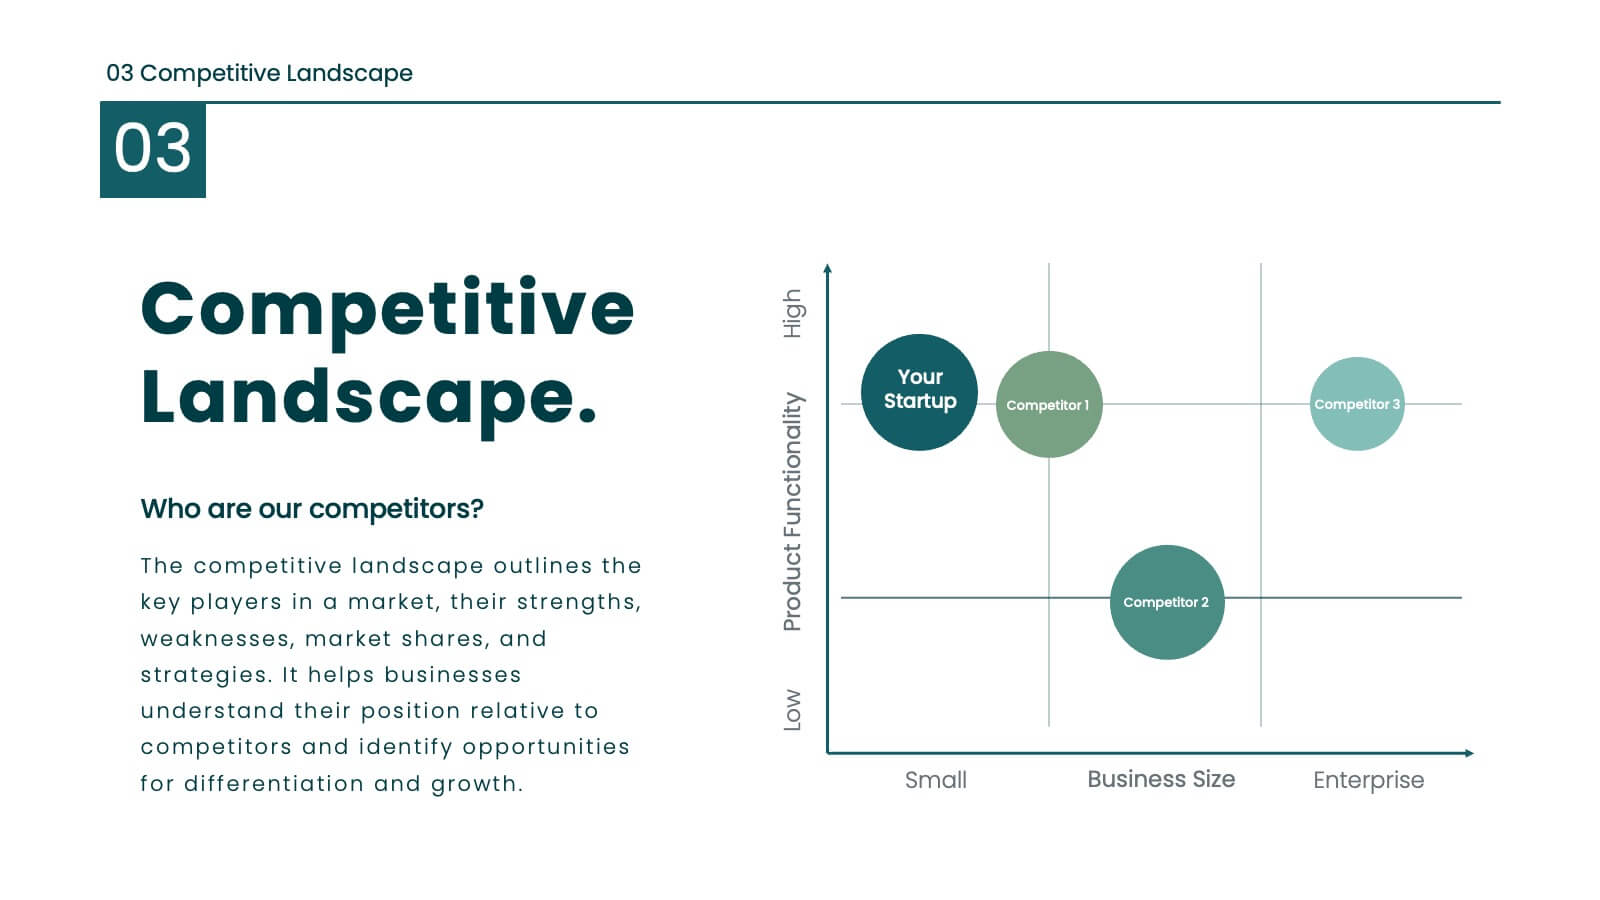
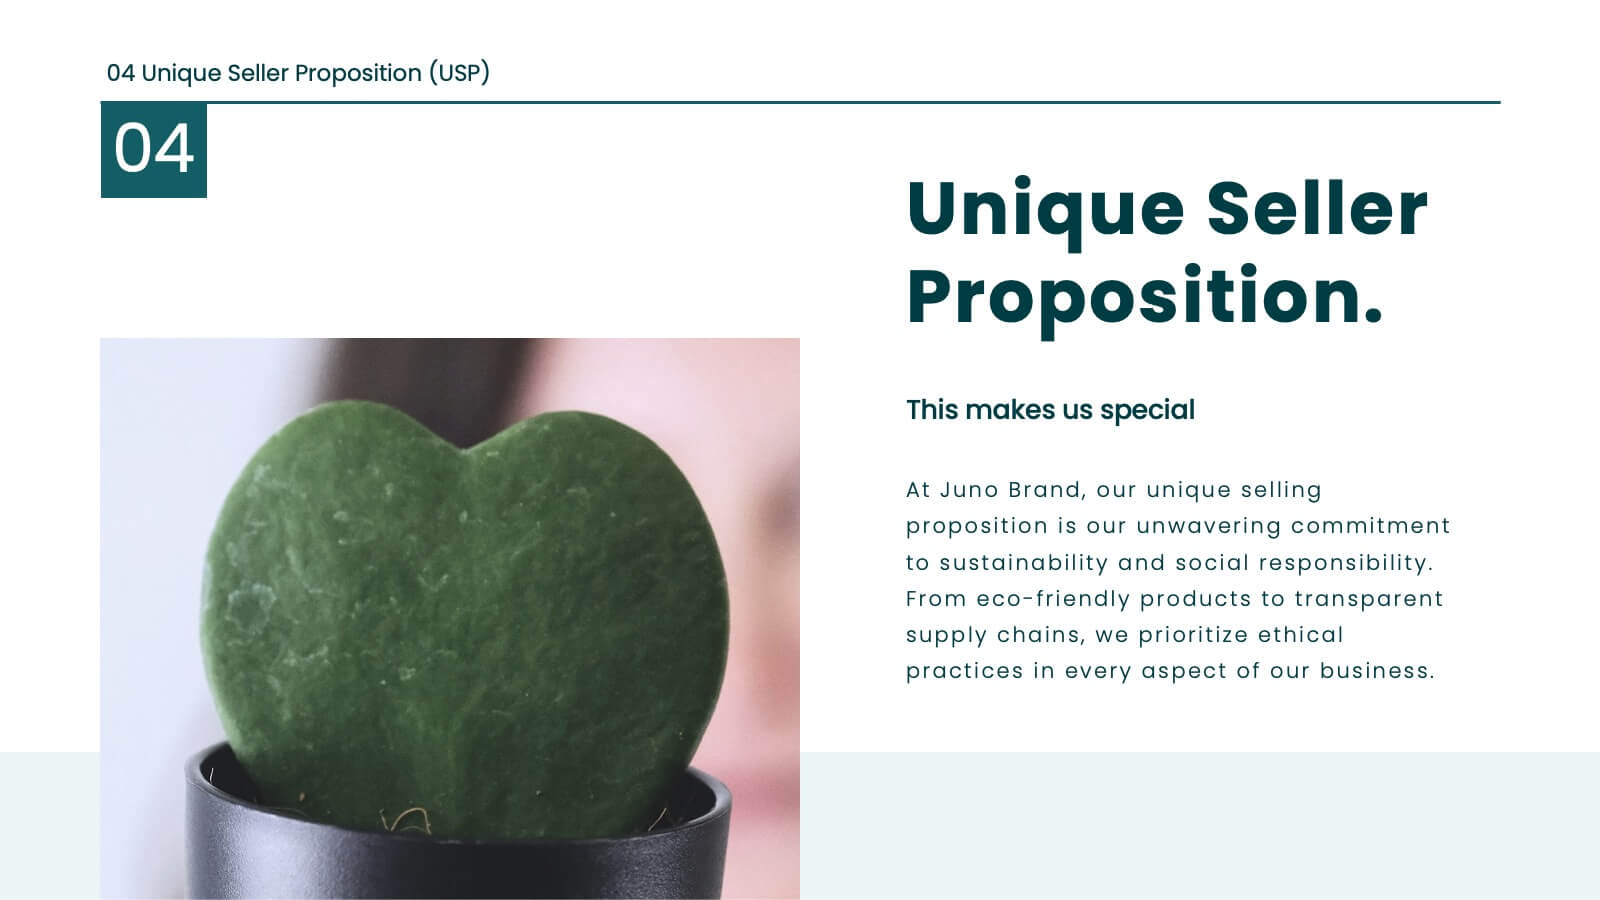
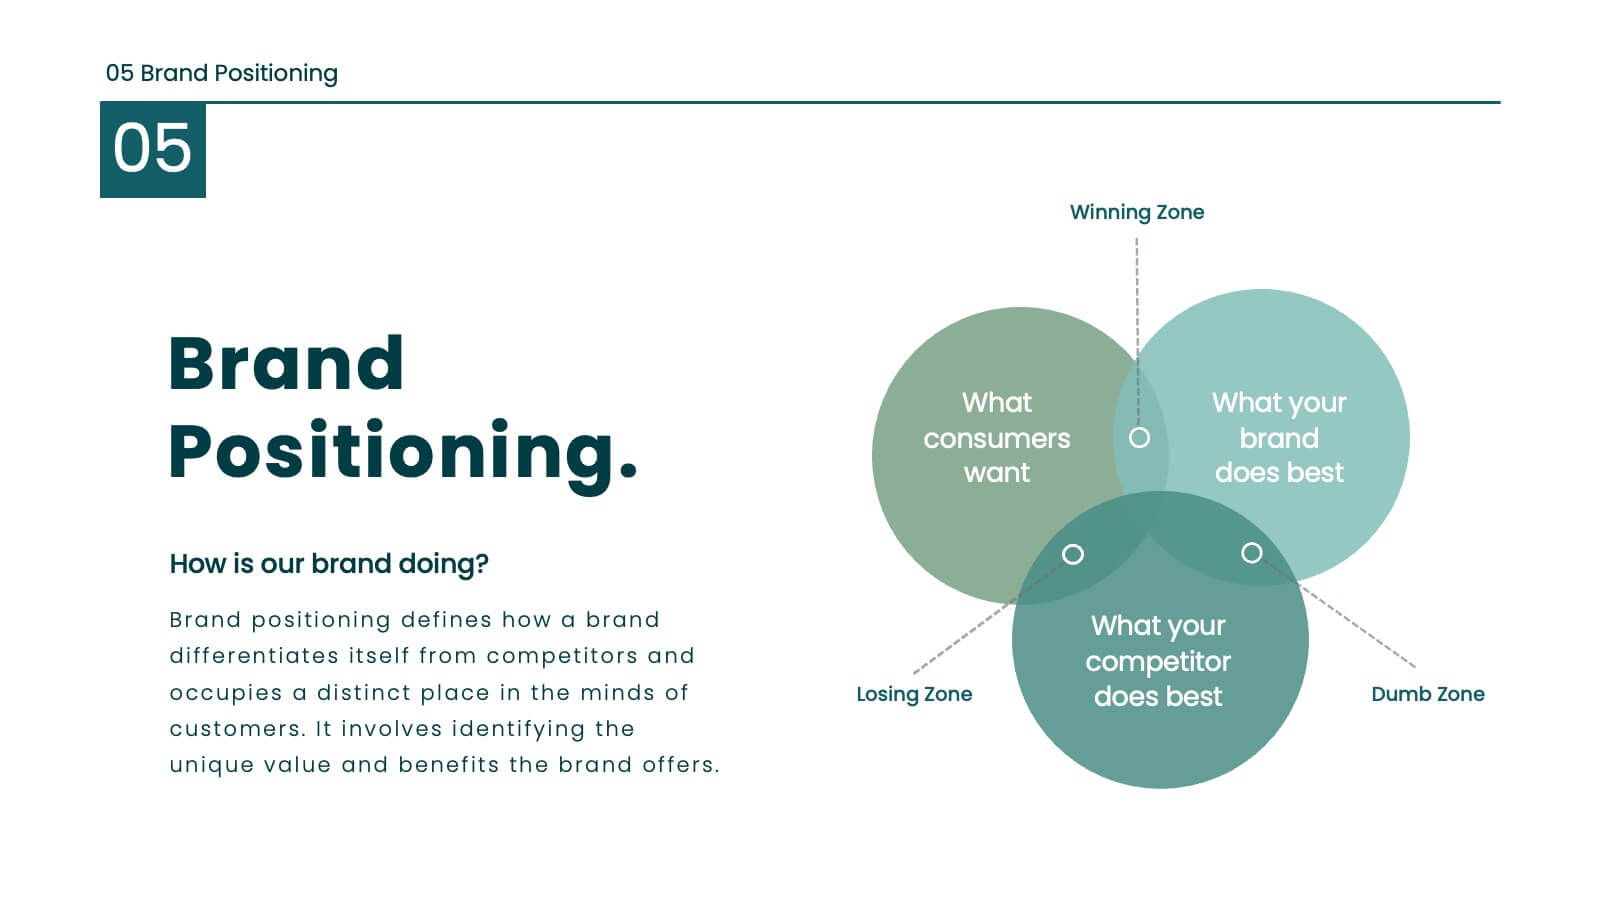
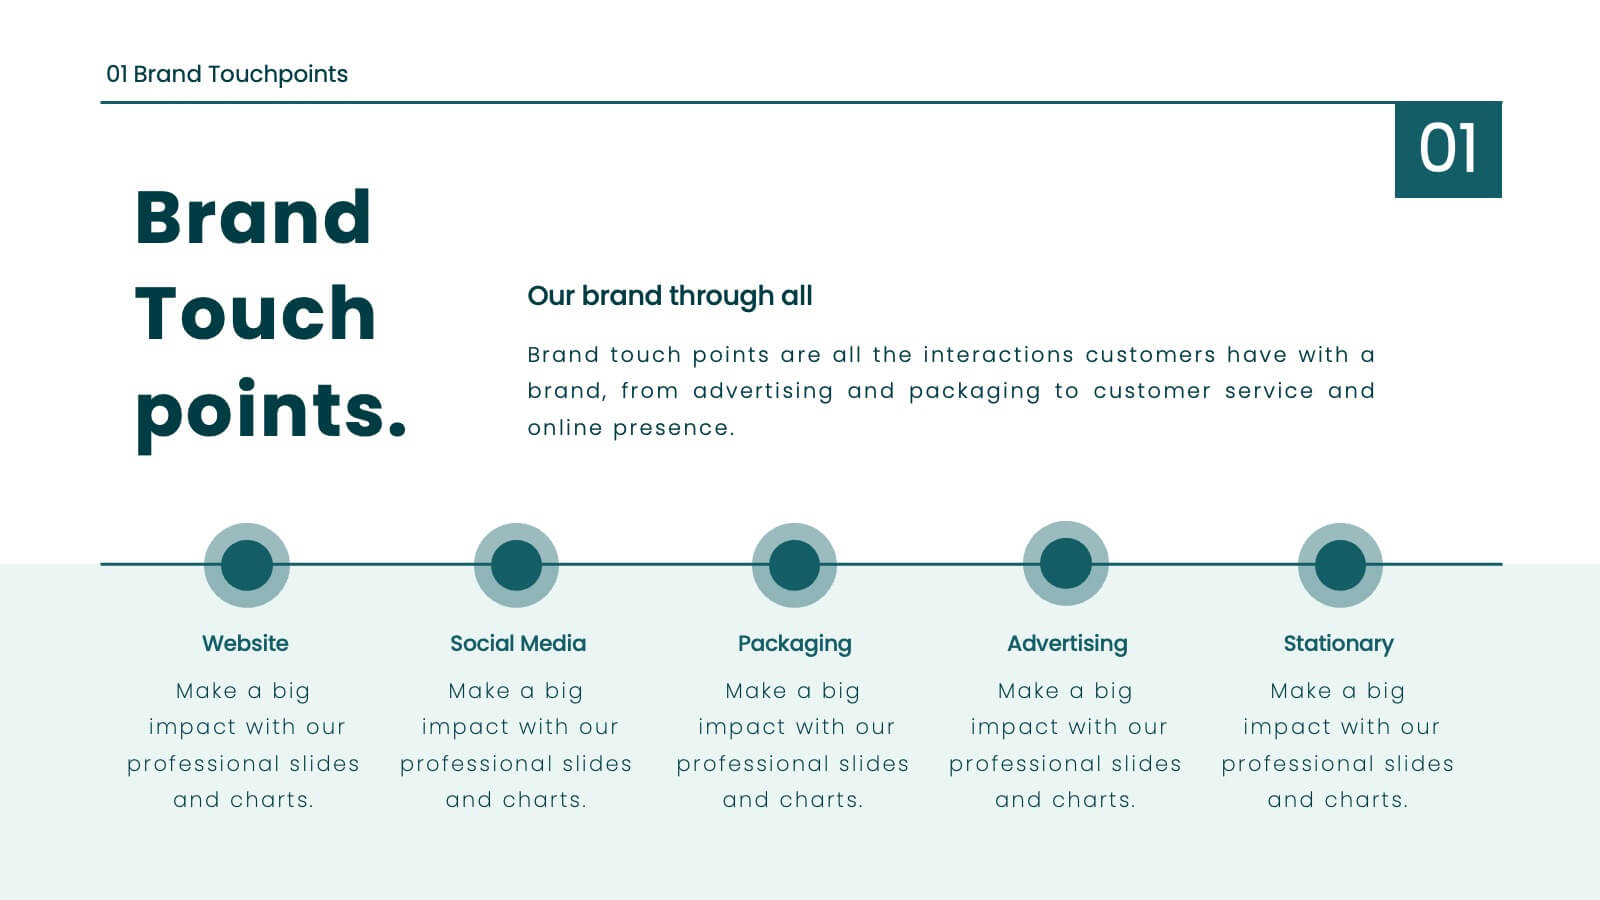
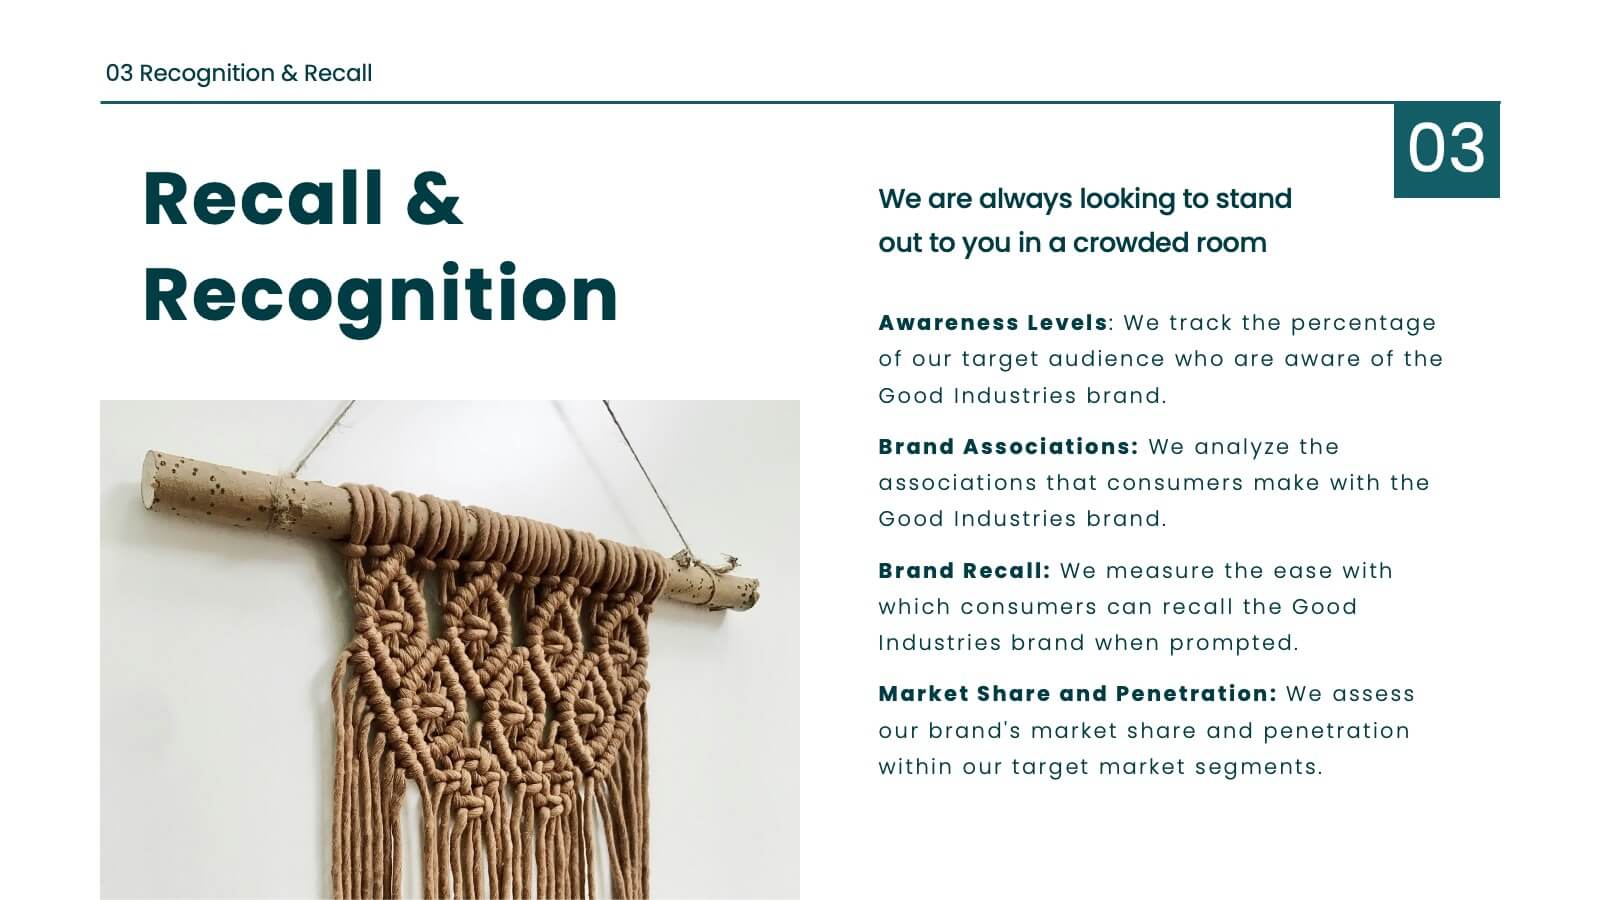
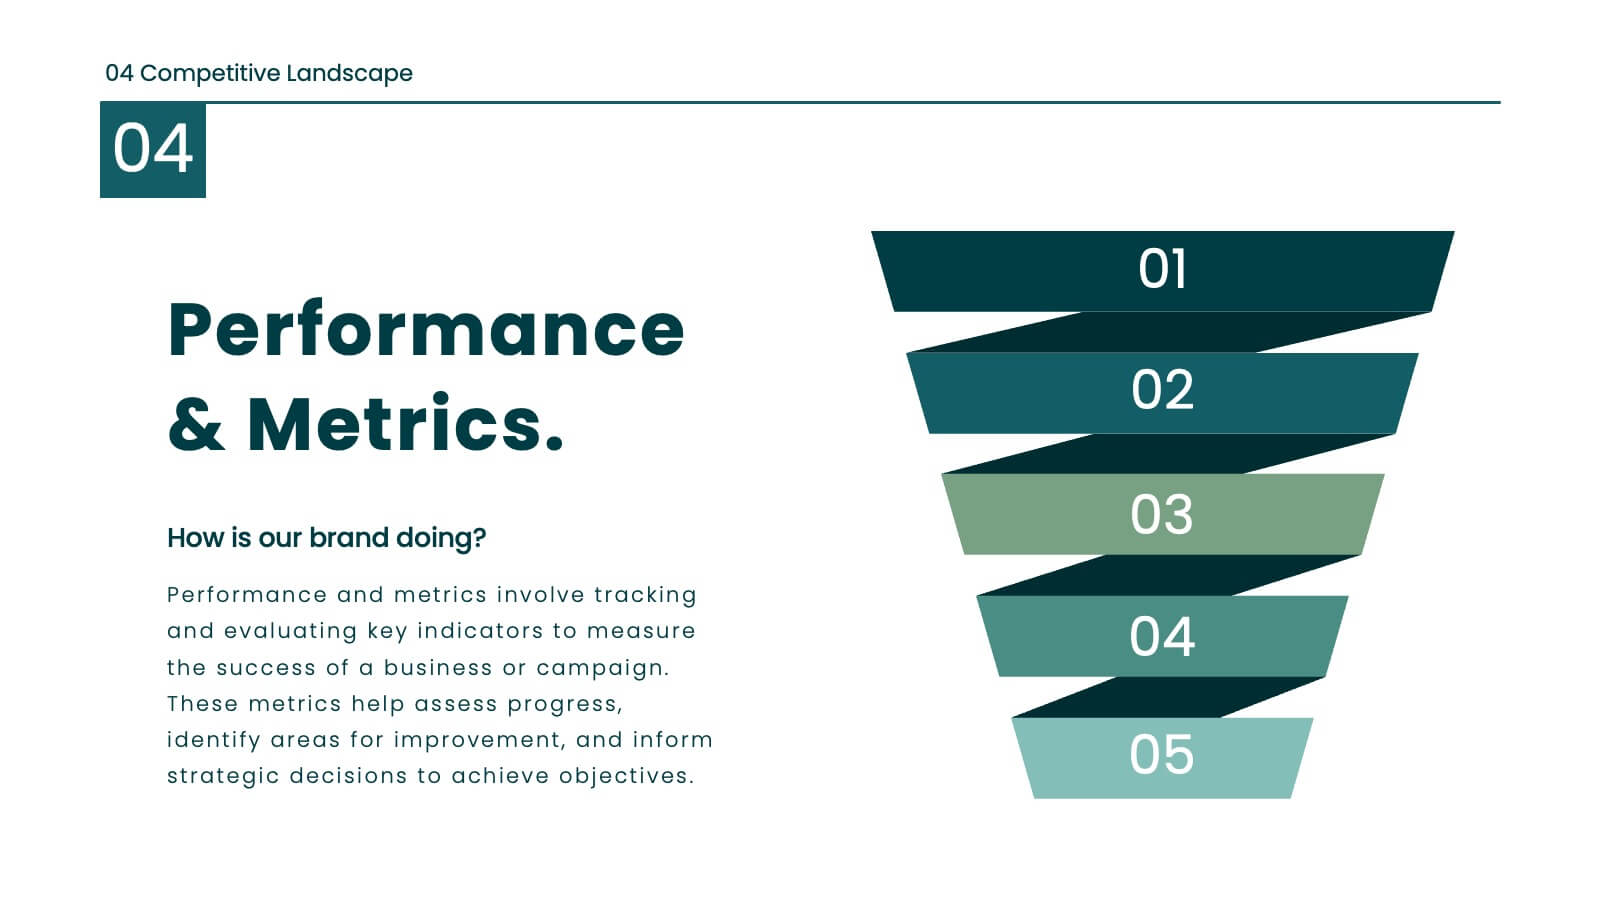
Juno Brand Guidelines Proposal Presentation
Define your brand's identity with this comprehensive, stylish presentation template. Perfect for detailing brand guidelines, vision, mission, and market analysis, it features a clean design with a professional layout. Highlight key elements like color palettes, typography, and unique selling propositions to ensure consistency and clarity. Compatible with PowerPoint, Keynote, and Google Slides, it’s ideal for any platform.


6 diapositivas
Business Flow Chart Design Presentation
Bring clarity and momentum to your process with a clean, visual layout that turns complex steps into an easy-to-follow flow. This presentation helps teams map stages, responsibilities, and progress with confidence, making it perfect for planning, strategy, and operations. Fully compatible with PowerPoint, Keynote, and Google Slides.


5 diapositivas
Cloud Computing Services Overview Presentation
Simplify cloud service explanations with this Cloud Computing Services Overview template. Perfect for IT professionals, business leaders, and tech strategists, this slide visually breaks down key cloud services and infrastructure using an intuitive, easy-to-understand layout. Featuring color-coded icons and modern design, this template helps showcase essential cloud computing components effectively. Fully compatible with PowerPoint, Keynote, and Google Slides for seamless integration into your presentations.


7 diapositivas
Cyber Security Consultant Infographic
Dive into the realm of cyber safety with our cyber security consultant infographic. With a color palette that reflects the technological and serious nature of the domain – blue for trust and black for professionalism – this infographic is a representation of the role and responsibilities of a cyber security consultant. The design employs sleek icons that symbolize various cyber security elements. Ideal for IT professionals, and institutions providing training on cyber security. Compatible with PowerPoint, Keynote, and Google Slides, it promises versatility and ease of use. This ensures that the complex world of cyber security is made accessible.