


Características


¿Tienes alguna pregunta?
Recomendar


4 diapositivas
Green Initiative Report Deck Presentation
Show your sustainability story with a modern, eco-inspired presentation built to highlight green initiatives, progress reports, and environmental goals. Its clean layout makes data and insights easy to follow while maintaining a professional tone. Fully customizable and compatible with PowerPoint, Keynote, and Google Slides for effortless presentation design.


5 diapositivas
Customer Experience Empathy Map Presentation
Enhance Customer Understanding with the Empathy Map Presentation! This Customer Experience Empathy Map template is designed to help businesses visualize customer needs, thoughts, emotions, and behaviors for improved engagement and strategy. Featuring a clear quadrant-based layout, this template allows you to map out customer insights, pain points, and expectations for more effective decision-making. Ideal for marketers, UX designers, and business strategists, this fully editable template is compatible with PowerPoint, Keynote, and Google Slides, making


6 diapositivas
Conversion Funnel Stages Overview Presentation
Visualize user journeys with clarity using the Conversion Funnel Stages Overview Presentation. This funnel diagram template breaks down key conversion phases—from awareness to decision—into distinct, color-coded stages. Ideal for marketing reports, sales strategies, or product demos. Fully editable in PowerPoint, Google Slides, and Canva.


4 diapositivas
3-Circle Venn Diagram Presentation
Visualize overlap and connection with clarity using the 3-Circle Venn Diagram Presentation. This minimalist slide is ideal for showing relationships between three ideas, strategies, or data sets. Each circle is color-coded for distinction, and intersections highlight shared elements. Perfect for business models, marketing segments, or product comparisons. Fully editable in PowerPoint, Keynote, and Google Slides.


4 diapositivas
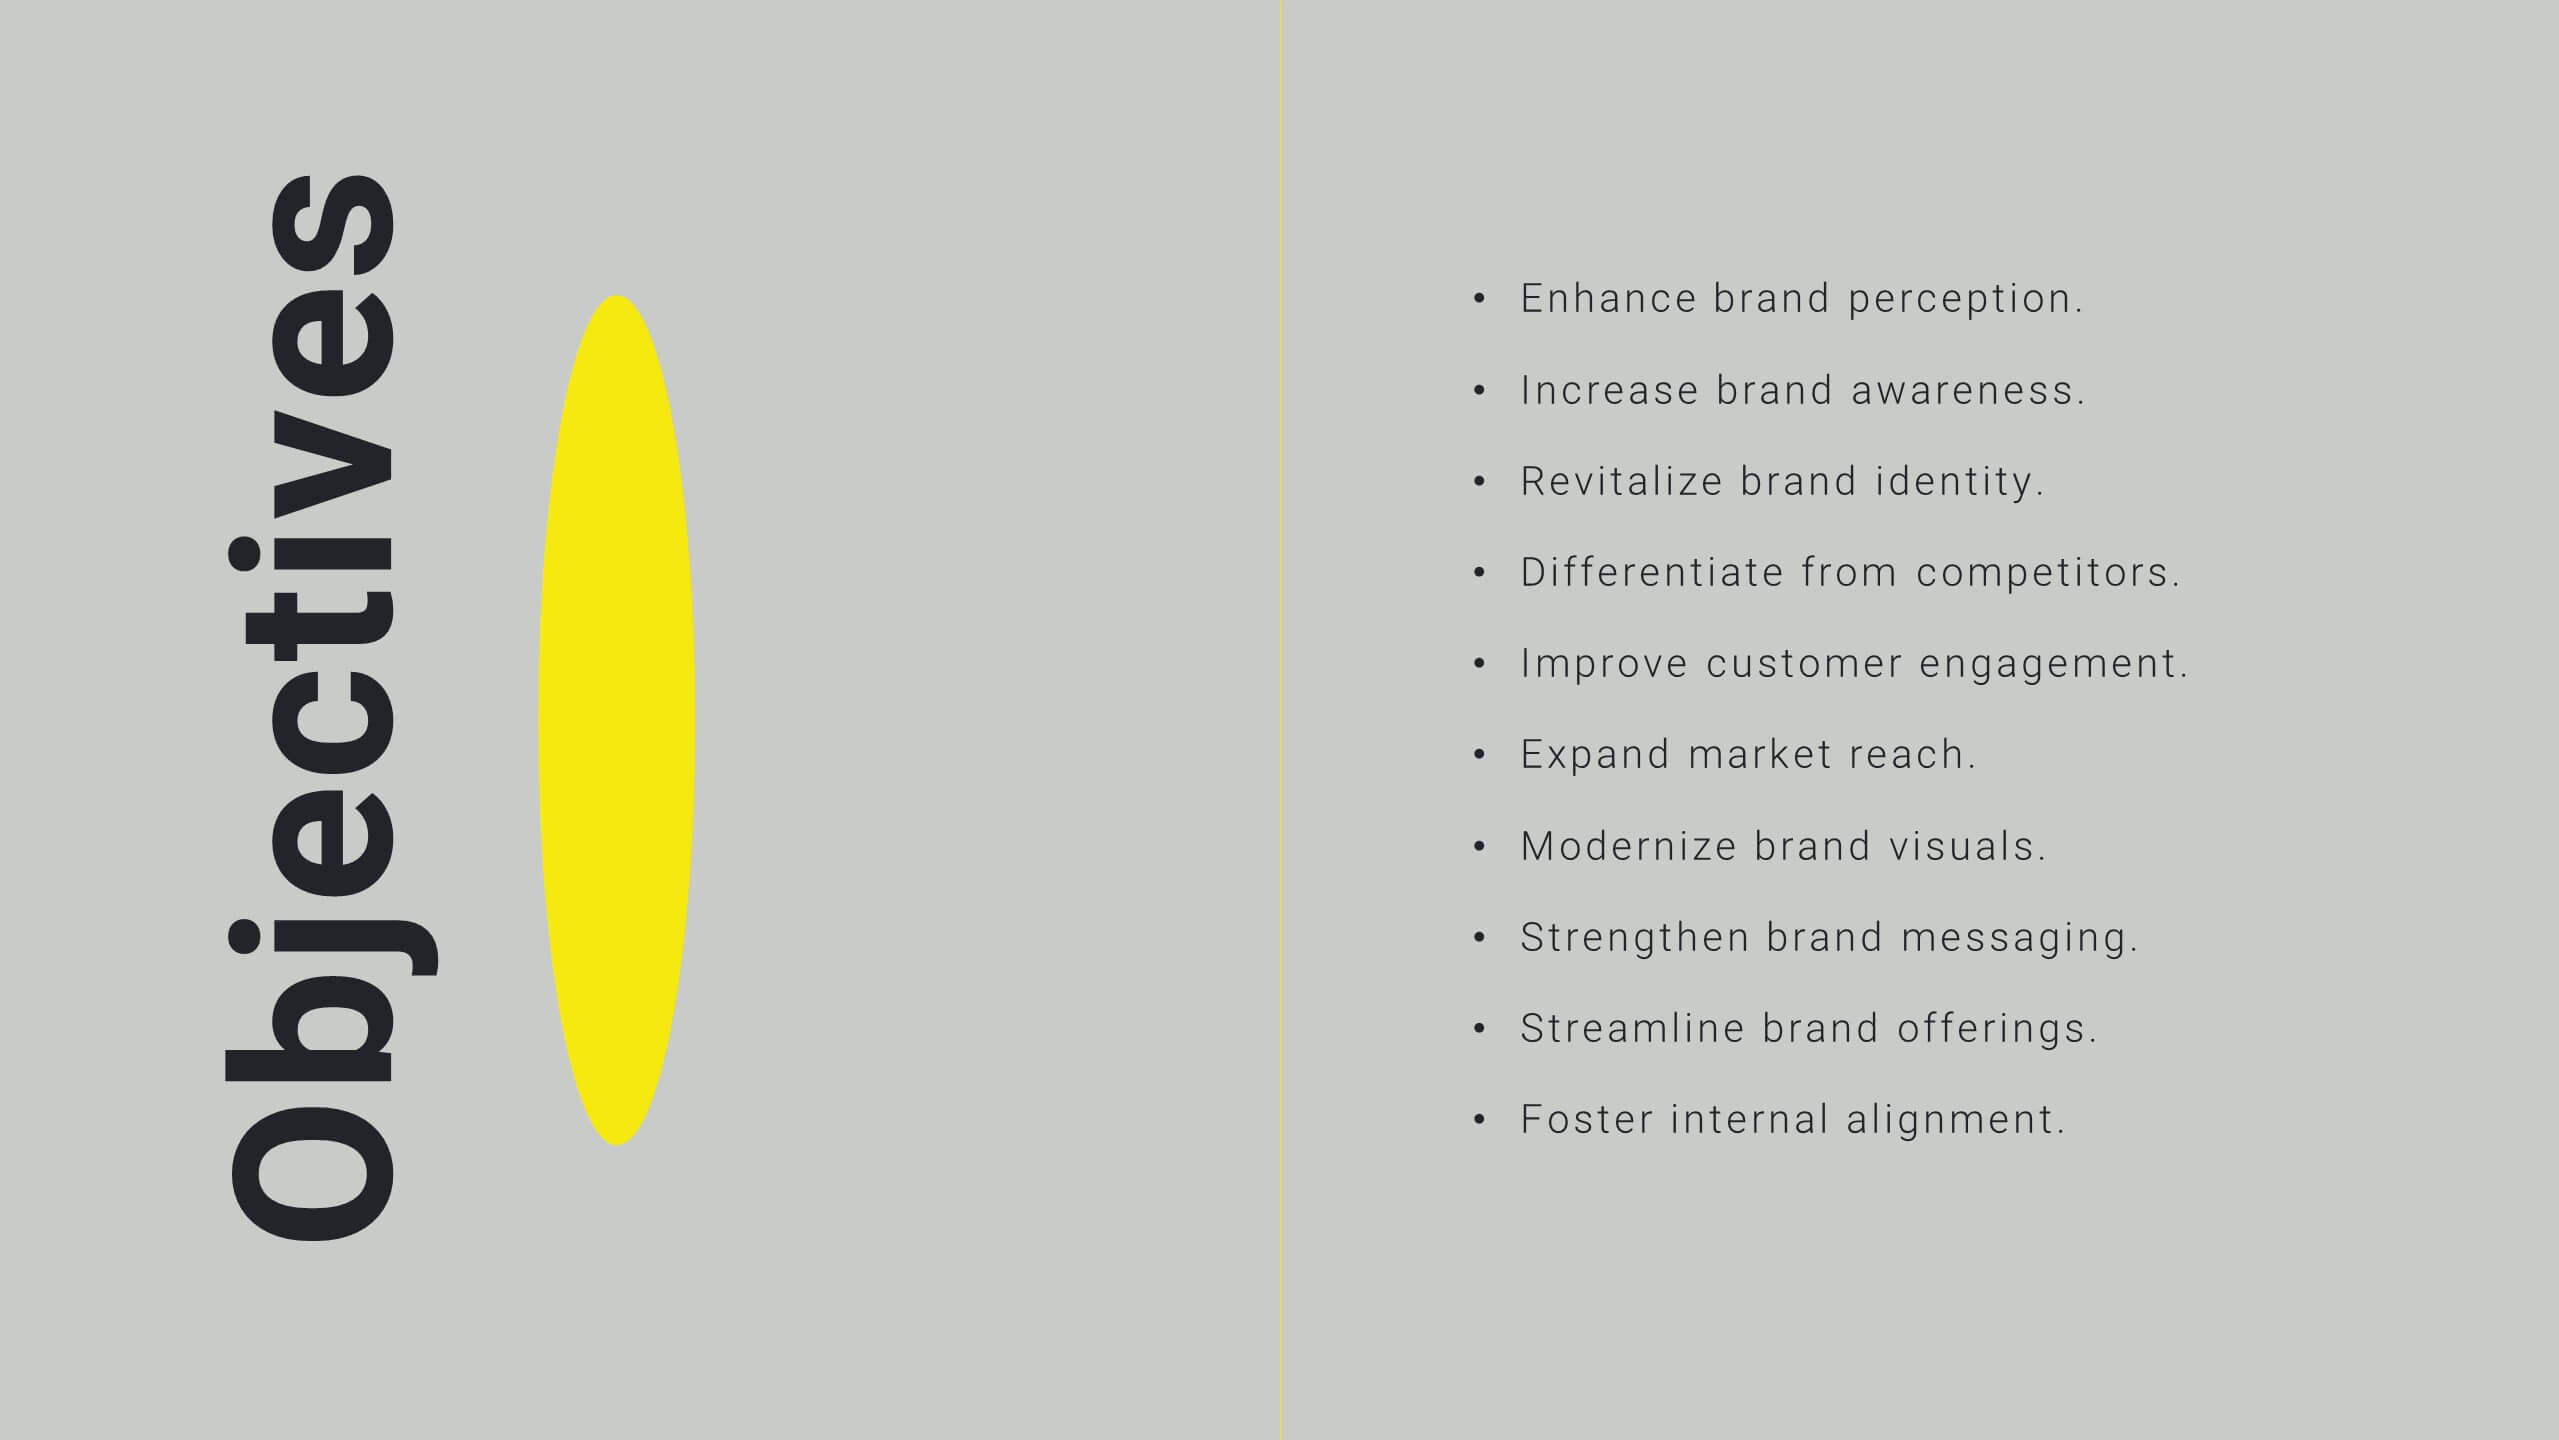
Welcome and About Us Introduction Presentation
Start strong with the Welcome and About Us Introduction Presentation, designed to deliver a polished, professional first impression. This clean layout features bold typography and geometric side visuals, perfect for introducing your company, brand values, or strategic vision. Easily customize the content to suit corporate profiles, startup decks, or team intros. Compatible with Canva, PowerPoint, Google Slides, and Keynote.


4 diapositivas
Veterinary Practice Overview Presentation
Give your veterinary insights a professional touch with this clean, modern infographic layout. Designed to showcase workflows, patient care processes, and team structures, it helps present information clearly and visually. Fully customizable and compatible with PowerPoint, Keynote, and Google Slides for easy editing and seamless presentation design.


5 diapositivas
Problem-Solving and Business Solutions
Simplify complex challenges with this dynamic problem-solving and business solutions slide. Designed with a clear, step-by-step layout, this template helps outline problems, strategies, solutions, and outcomes in a visually engaging way. Ideal for workshops, strategic planning sessions, consulting proposals, and team brainstorming. Fully editable and compatible with PowerPoint, Keynote, and Google Slides.


21 diapositivas
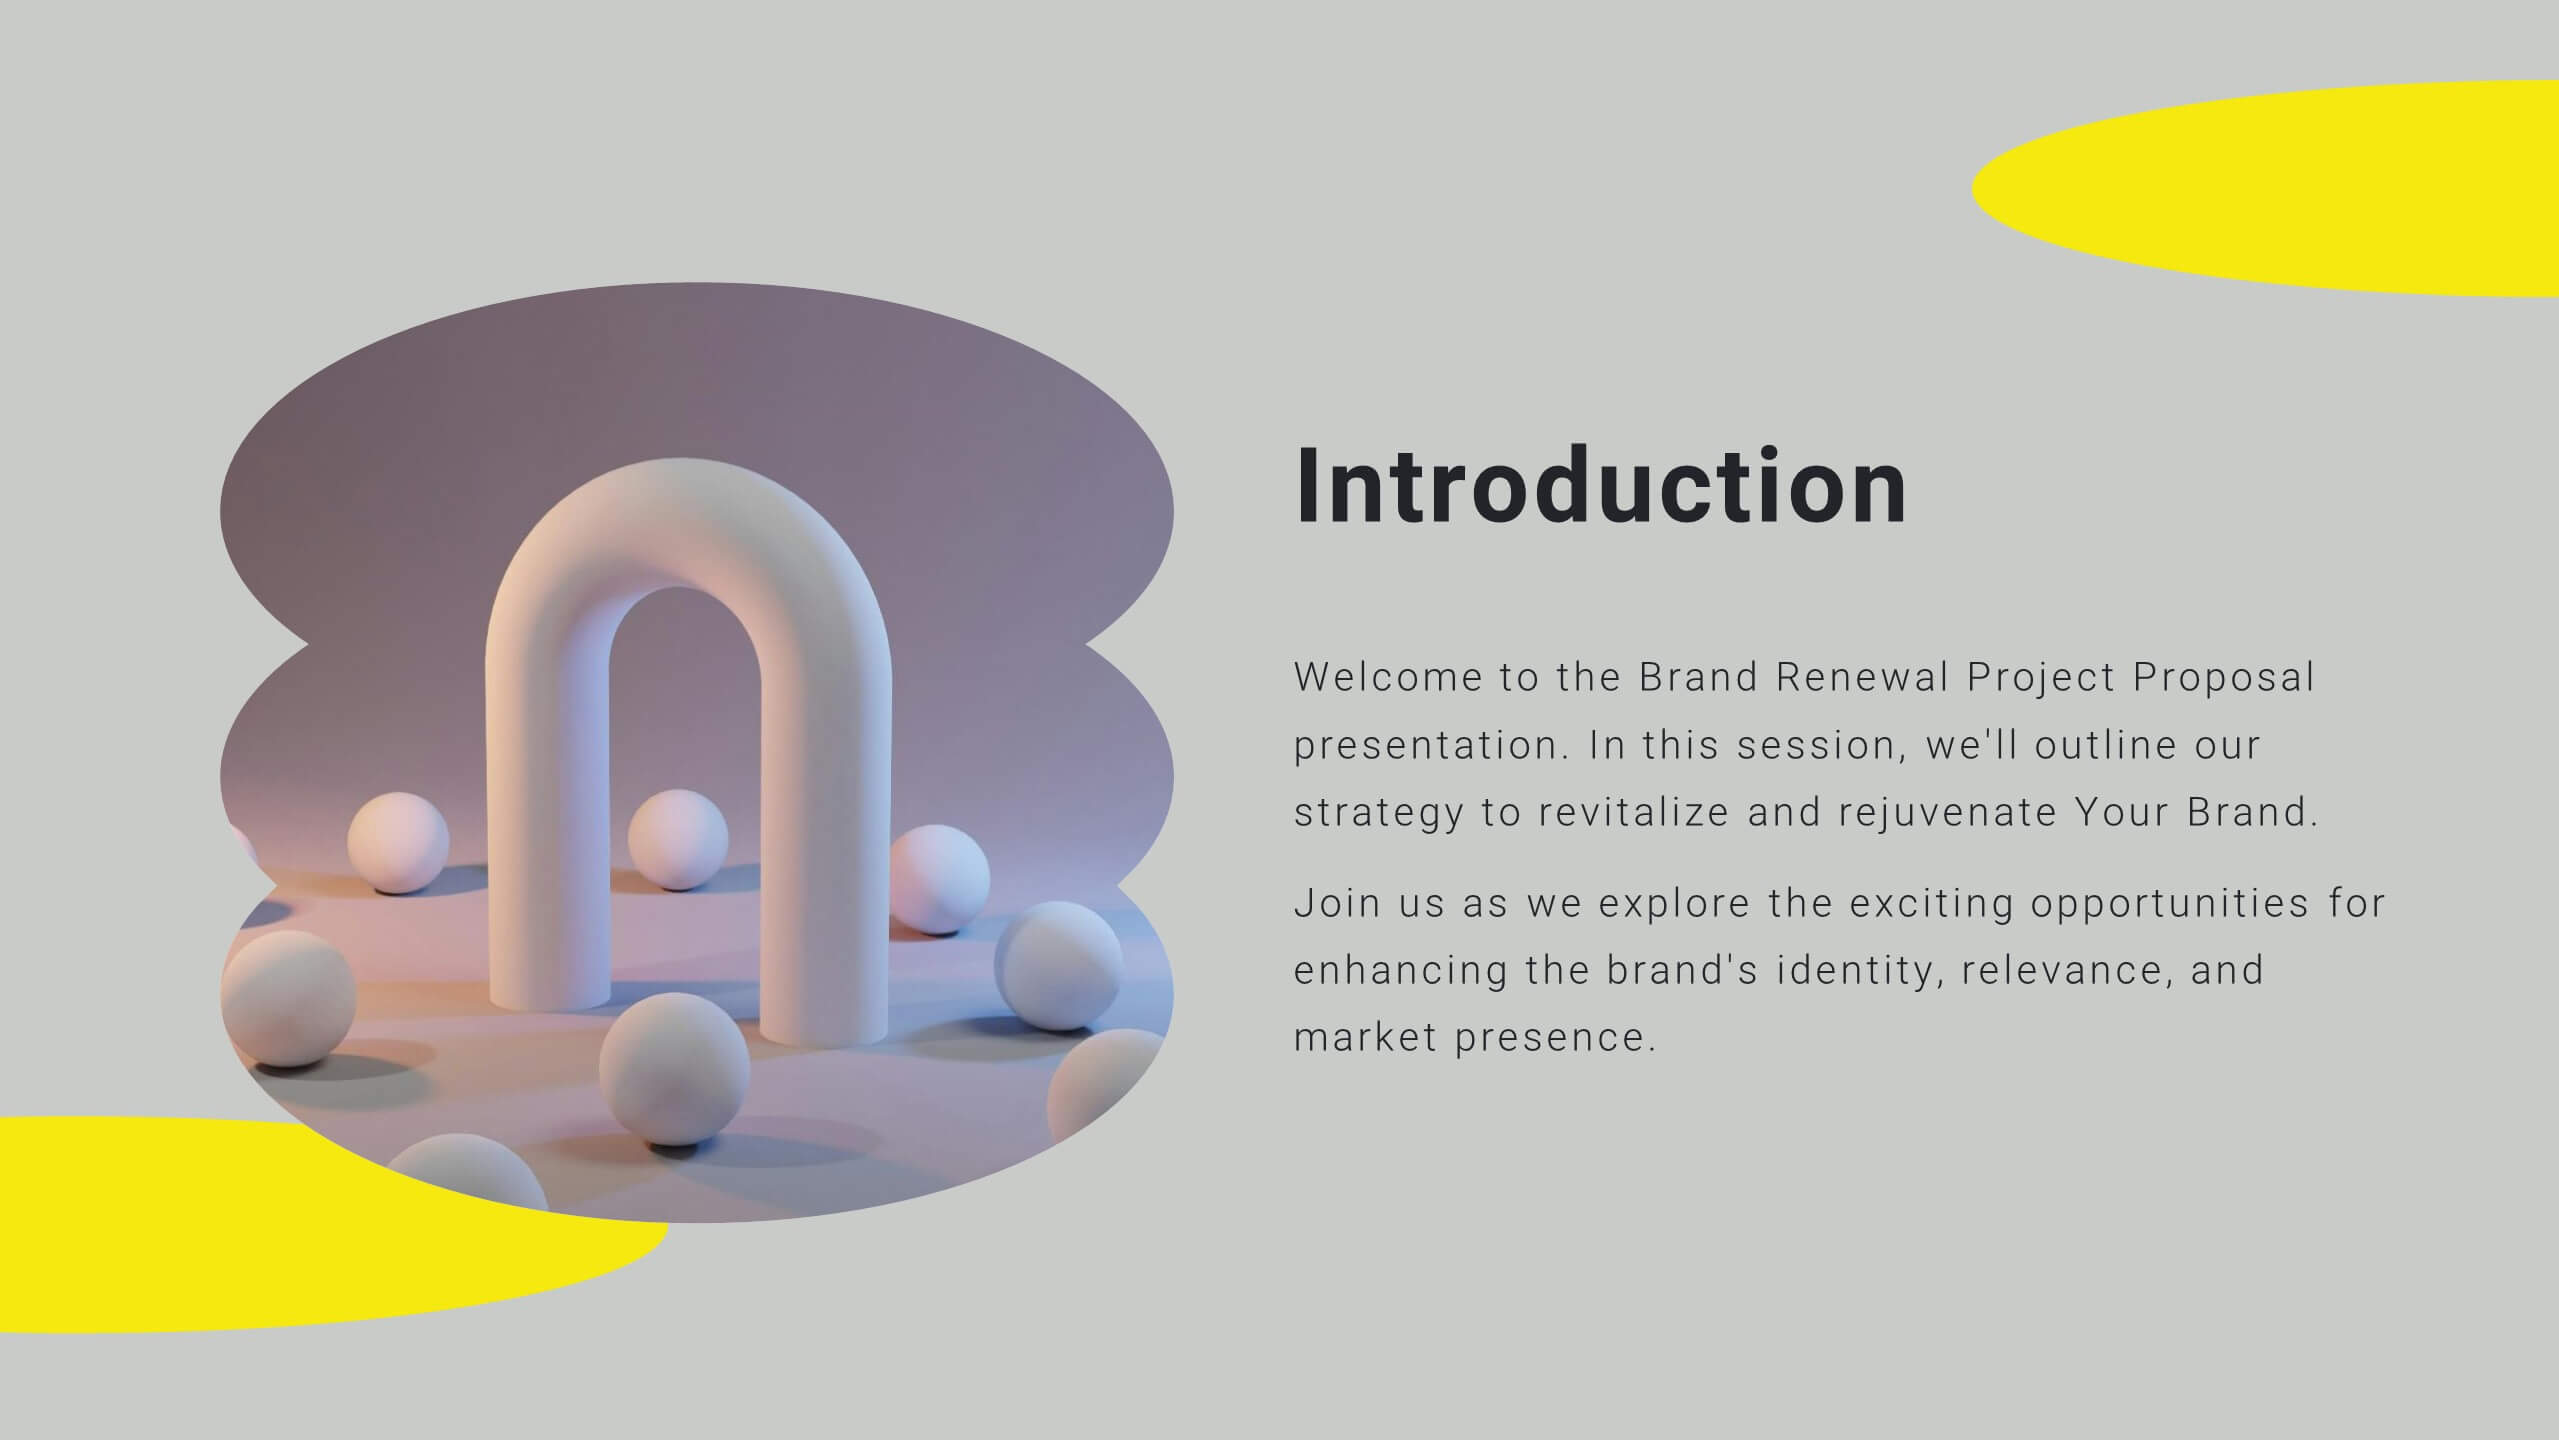
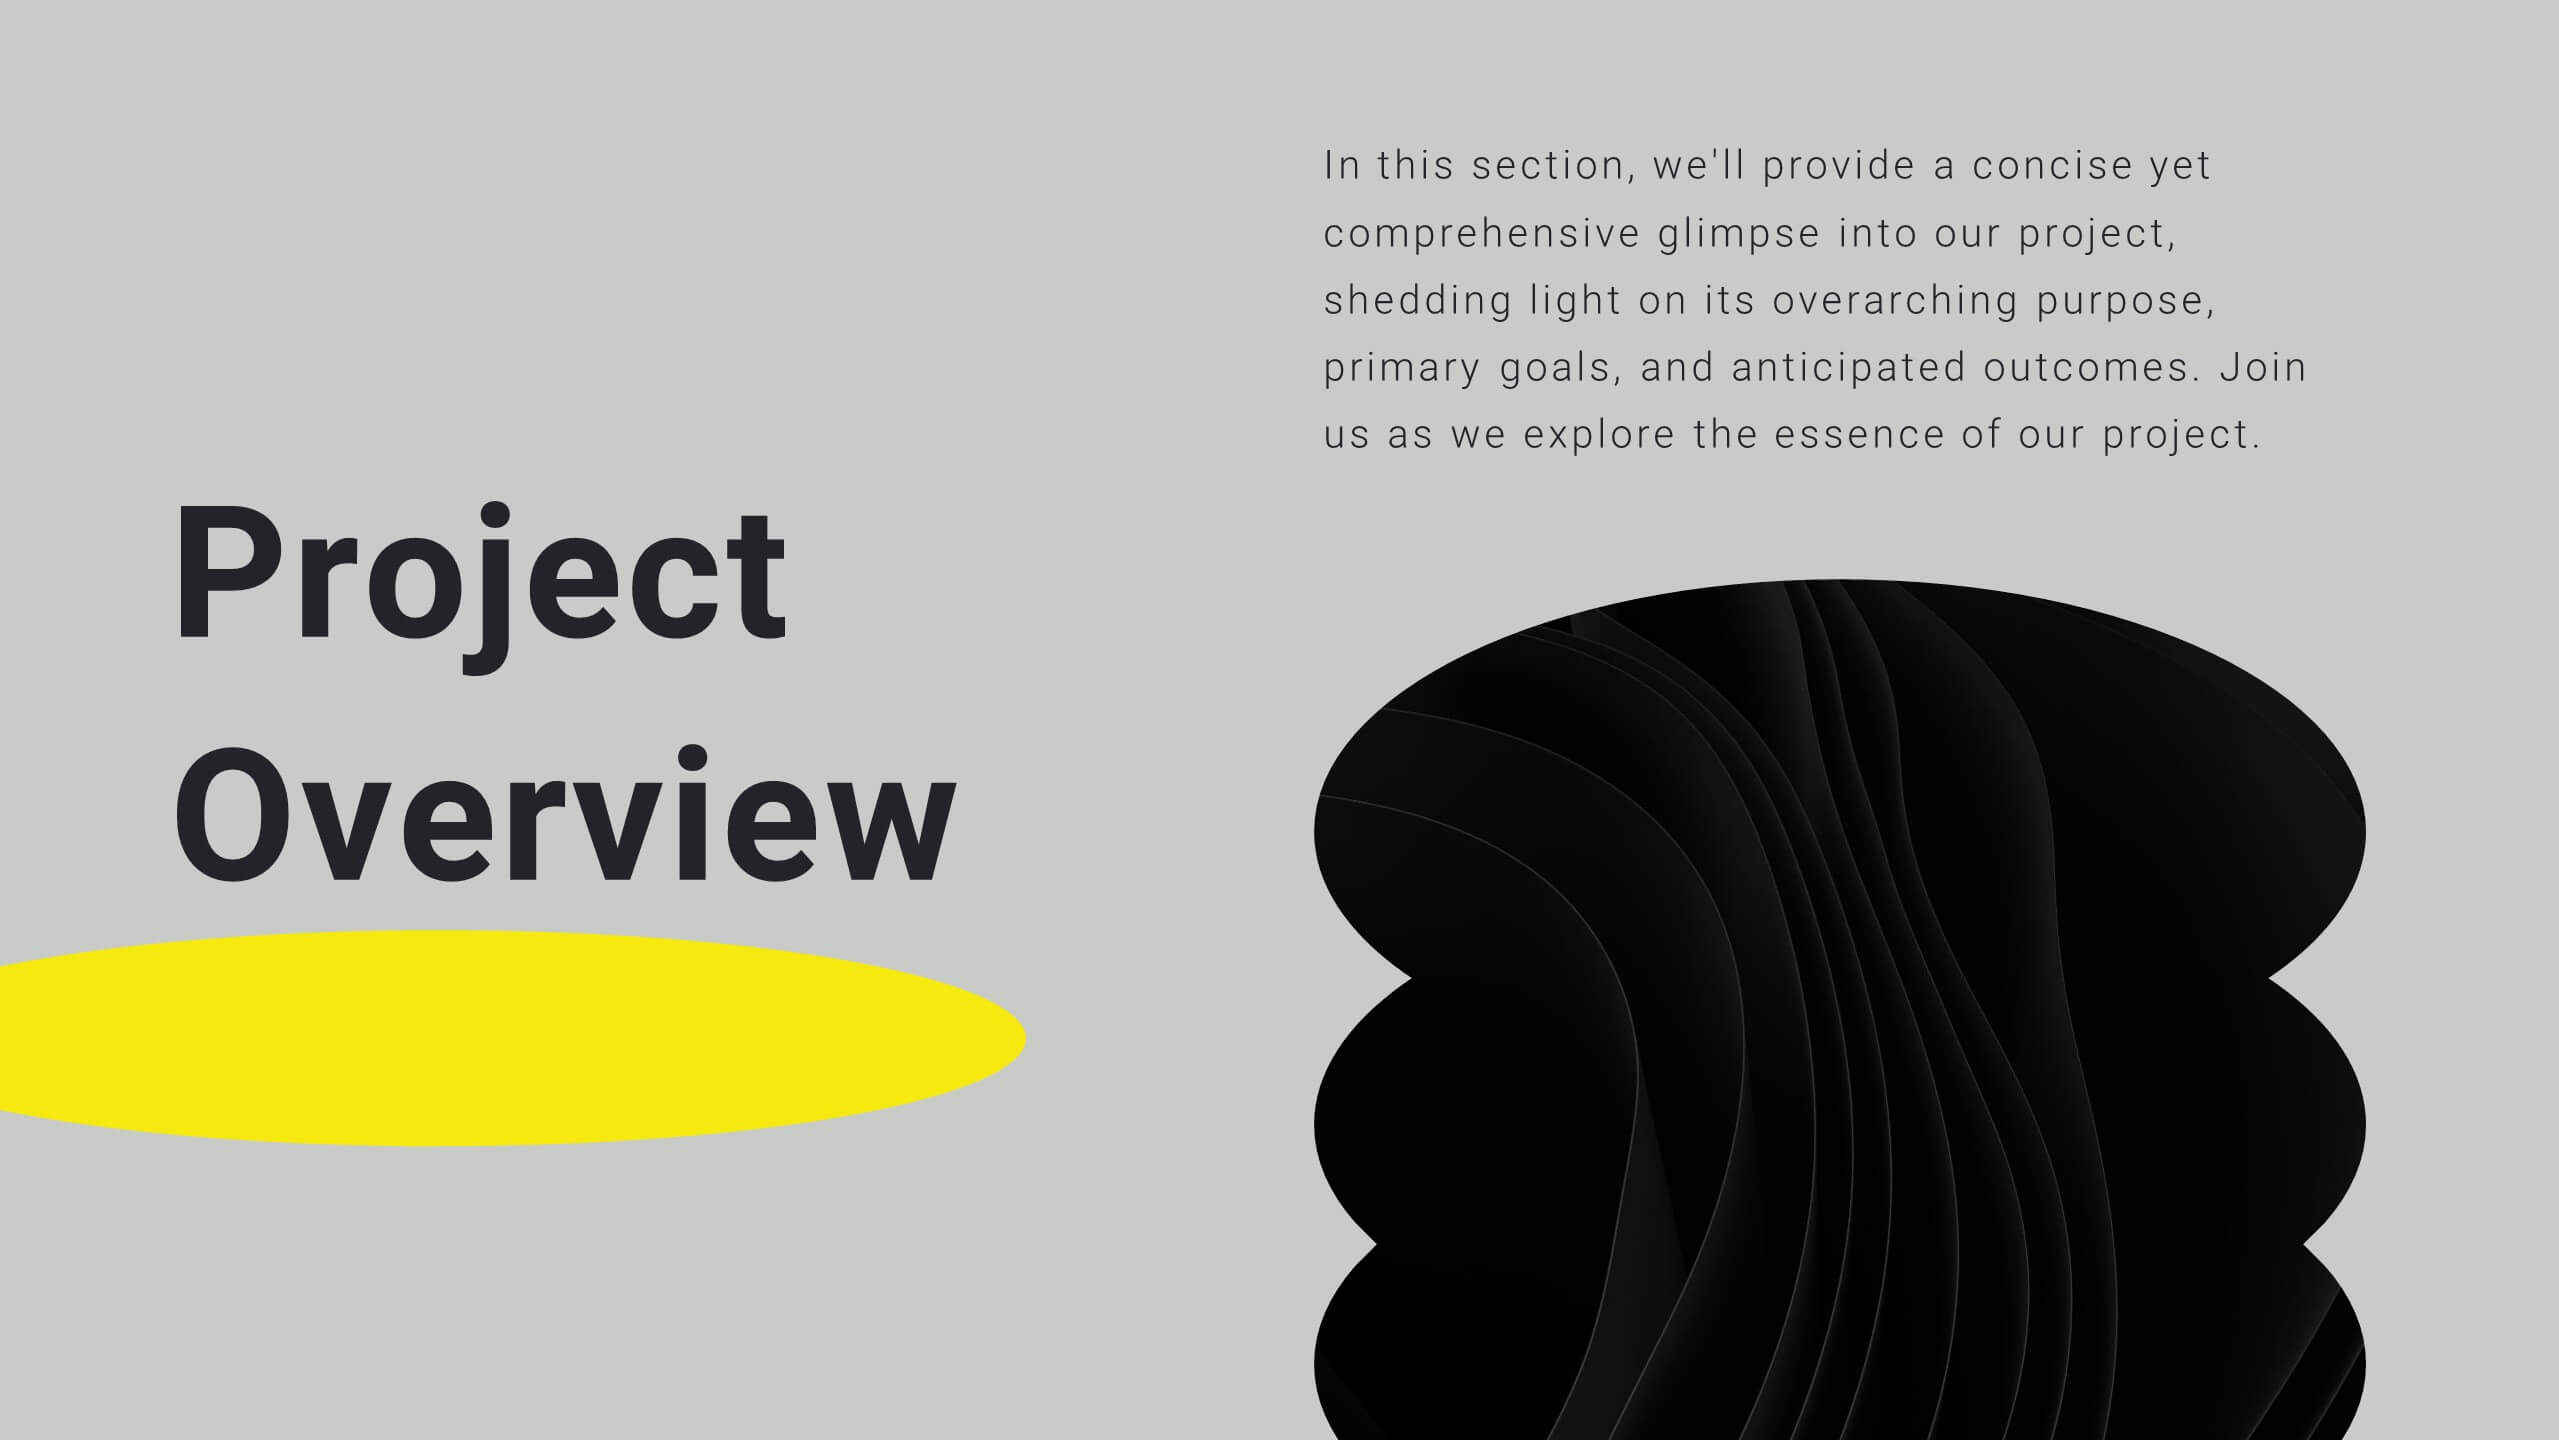
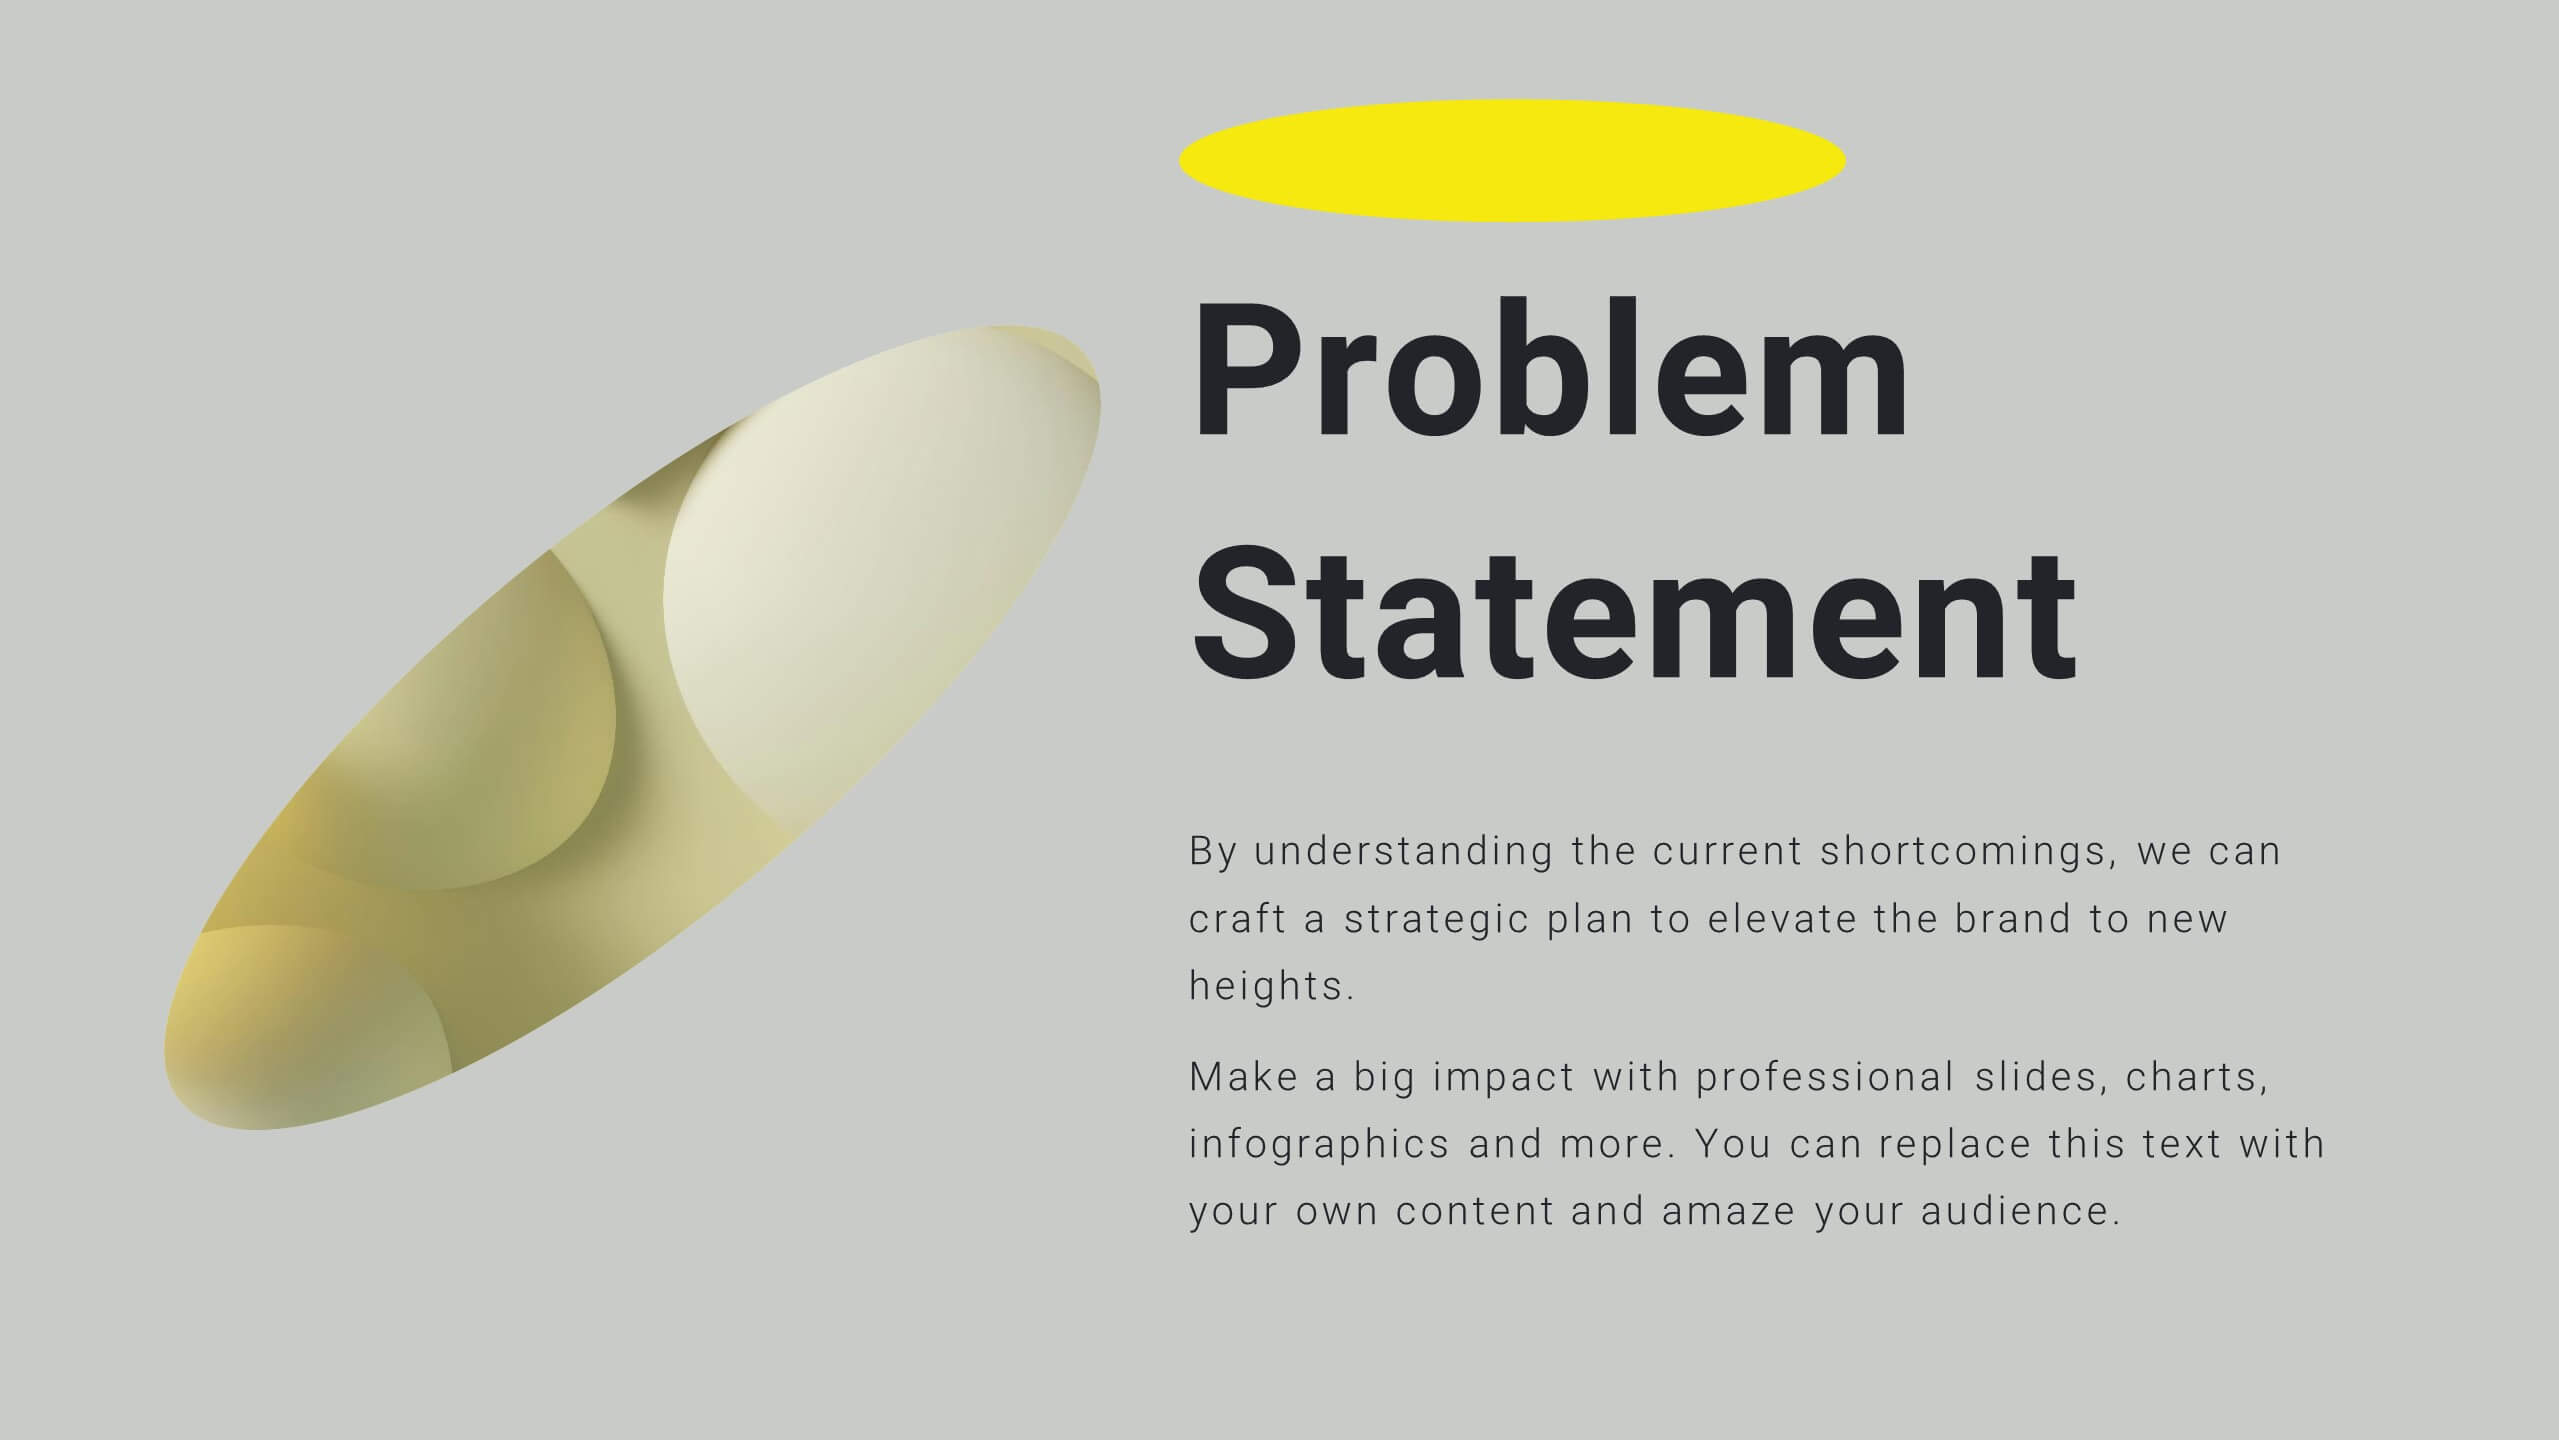
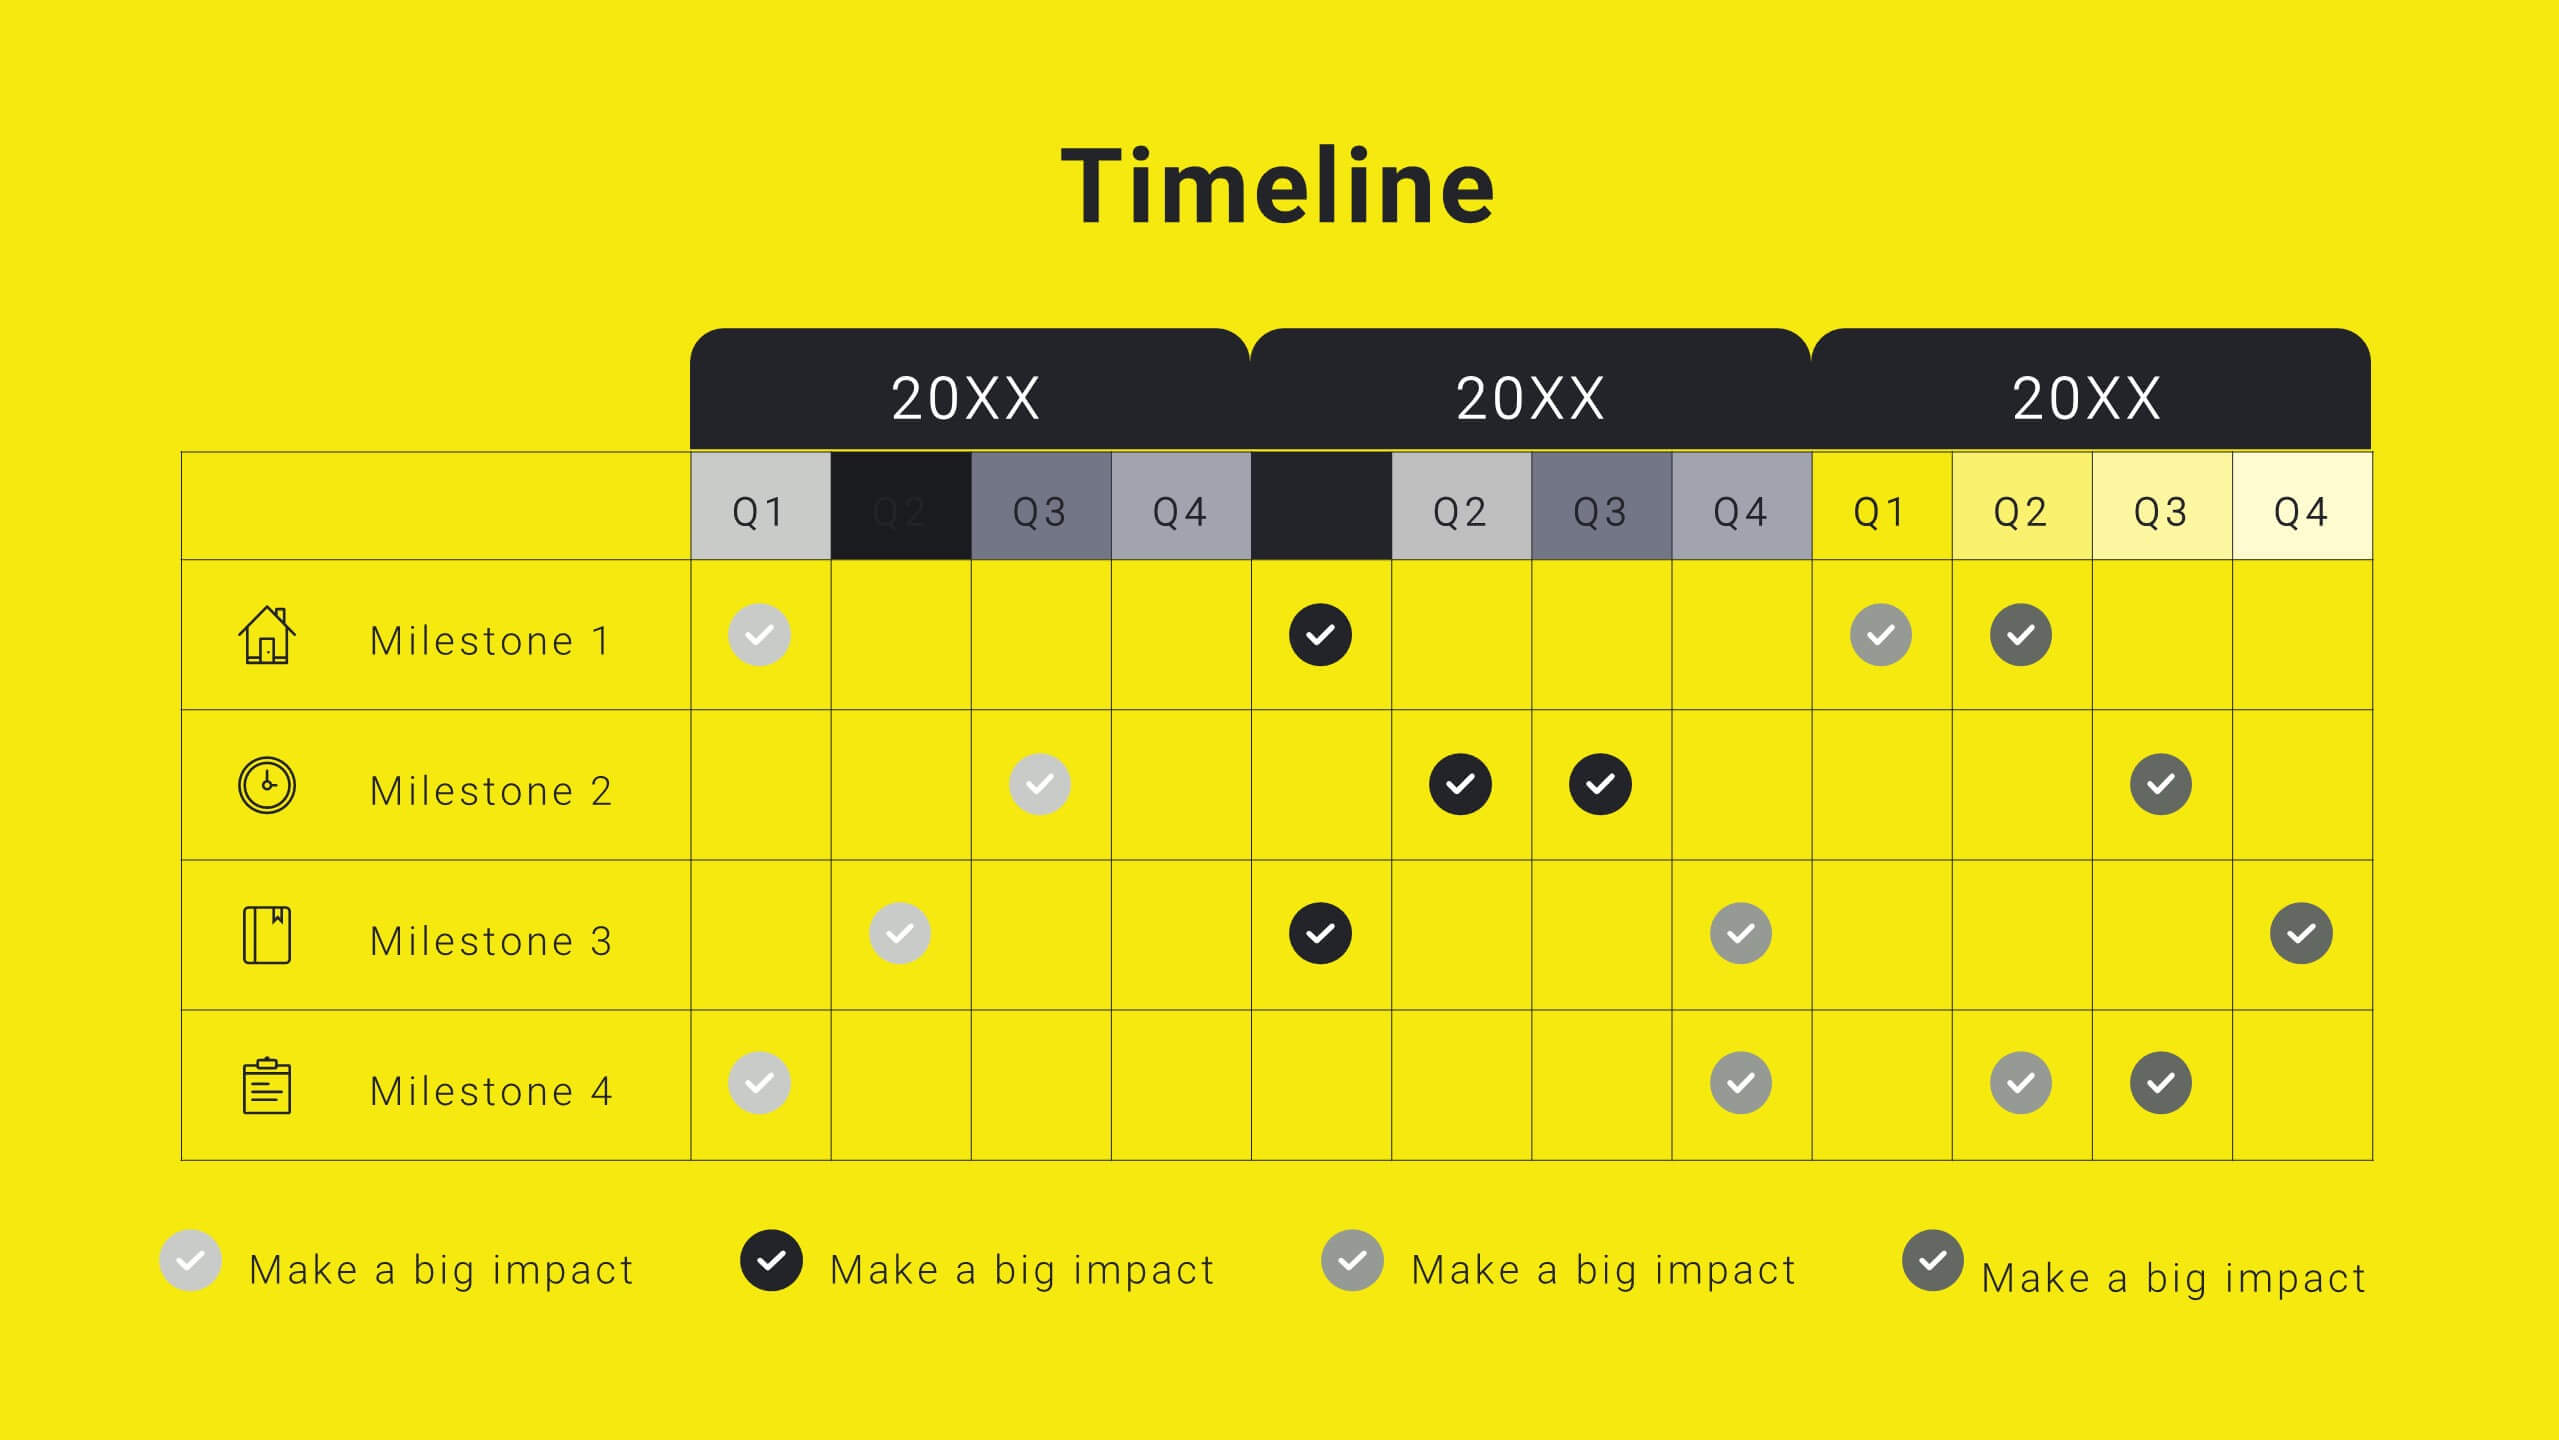
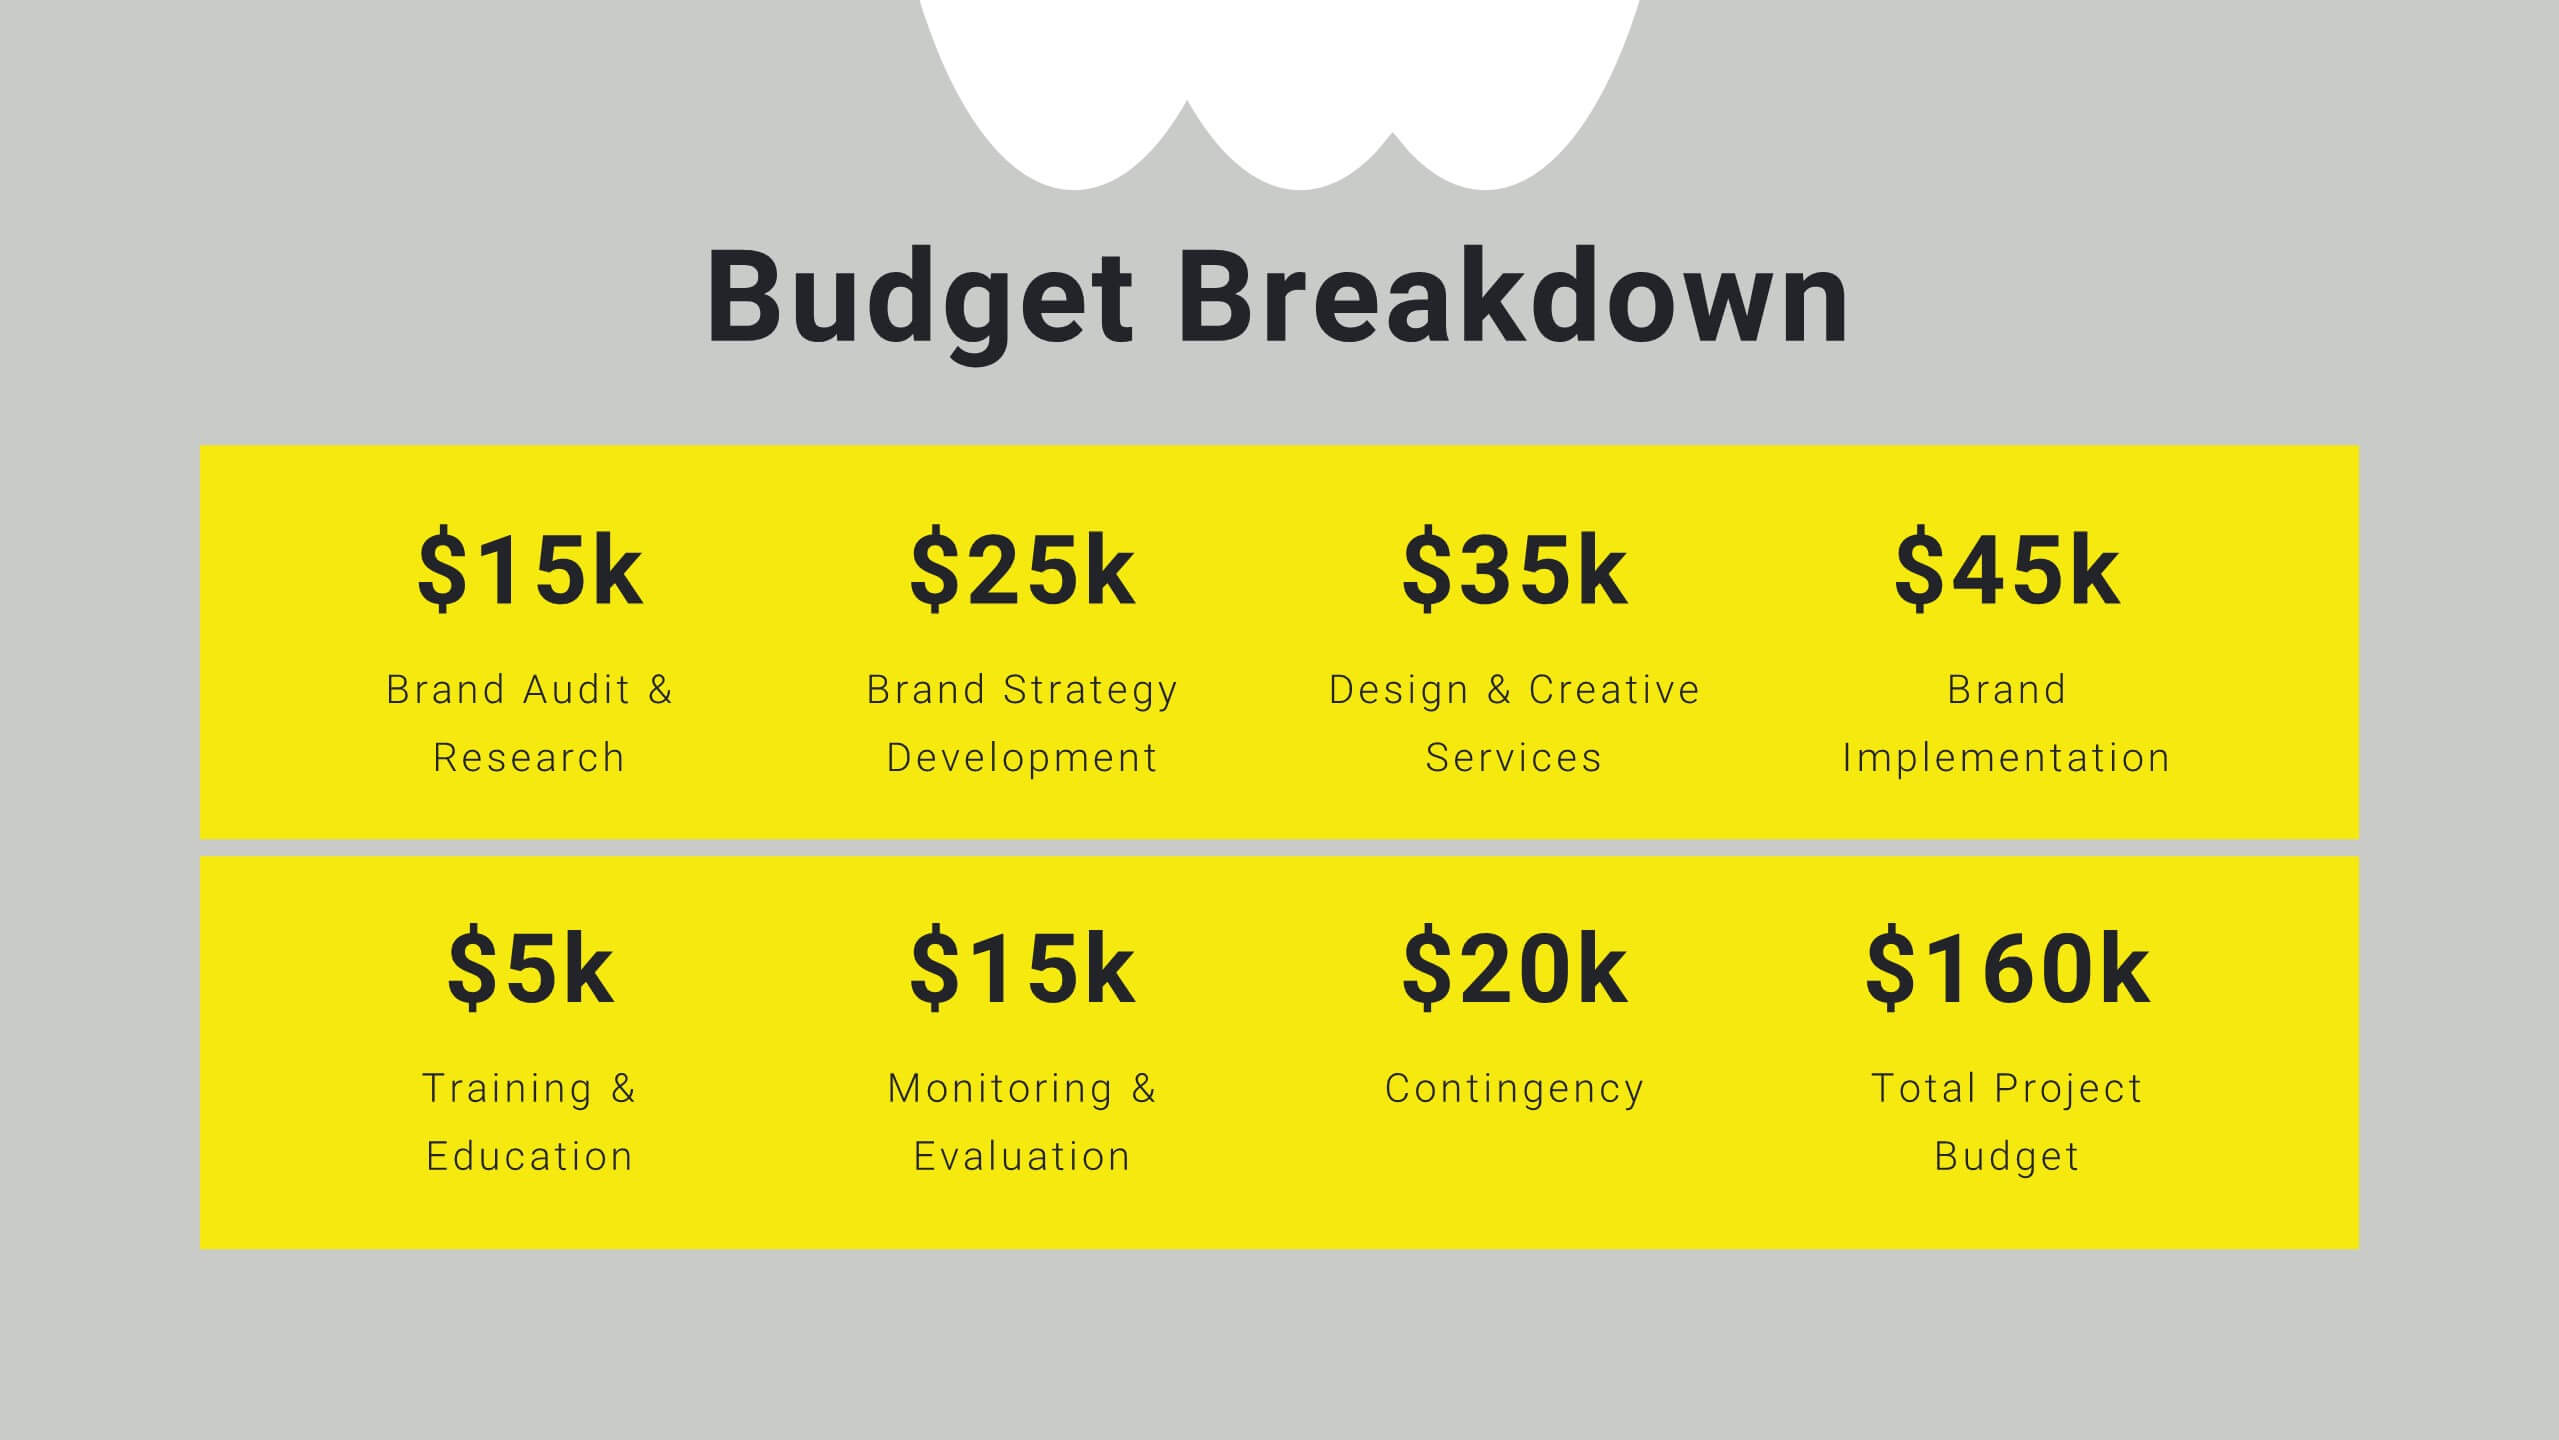
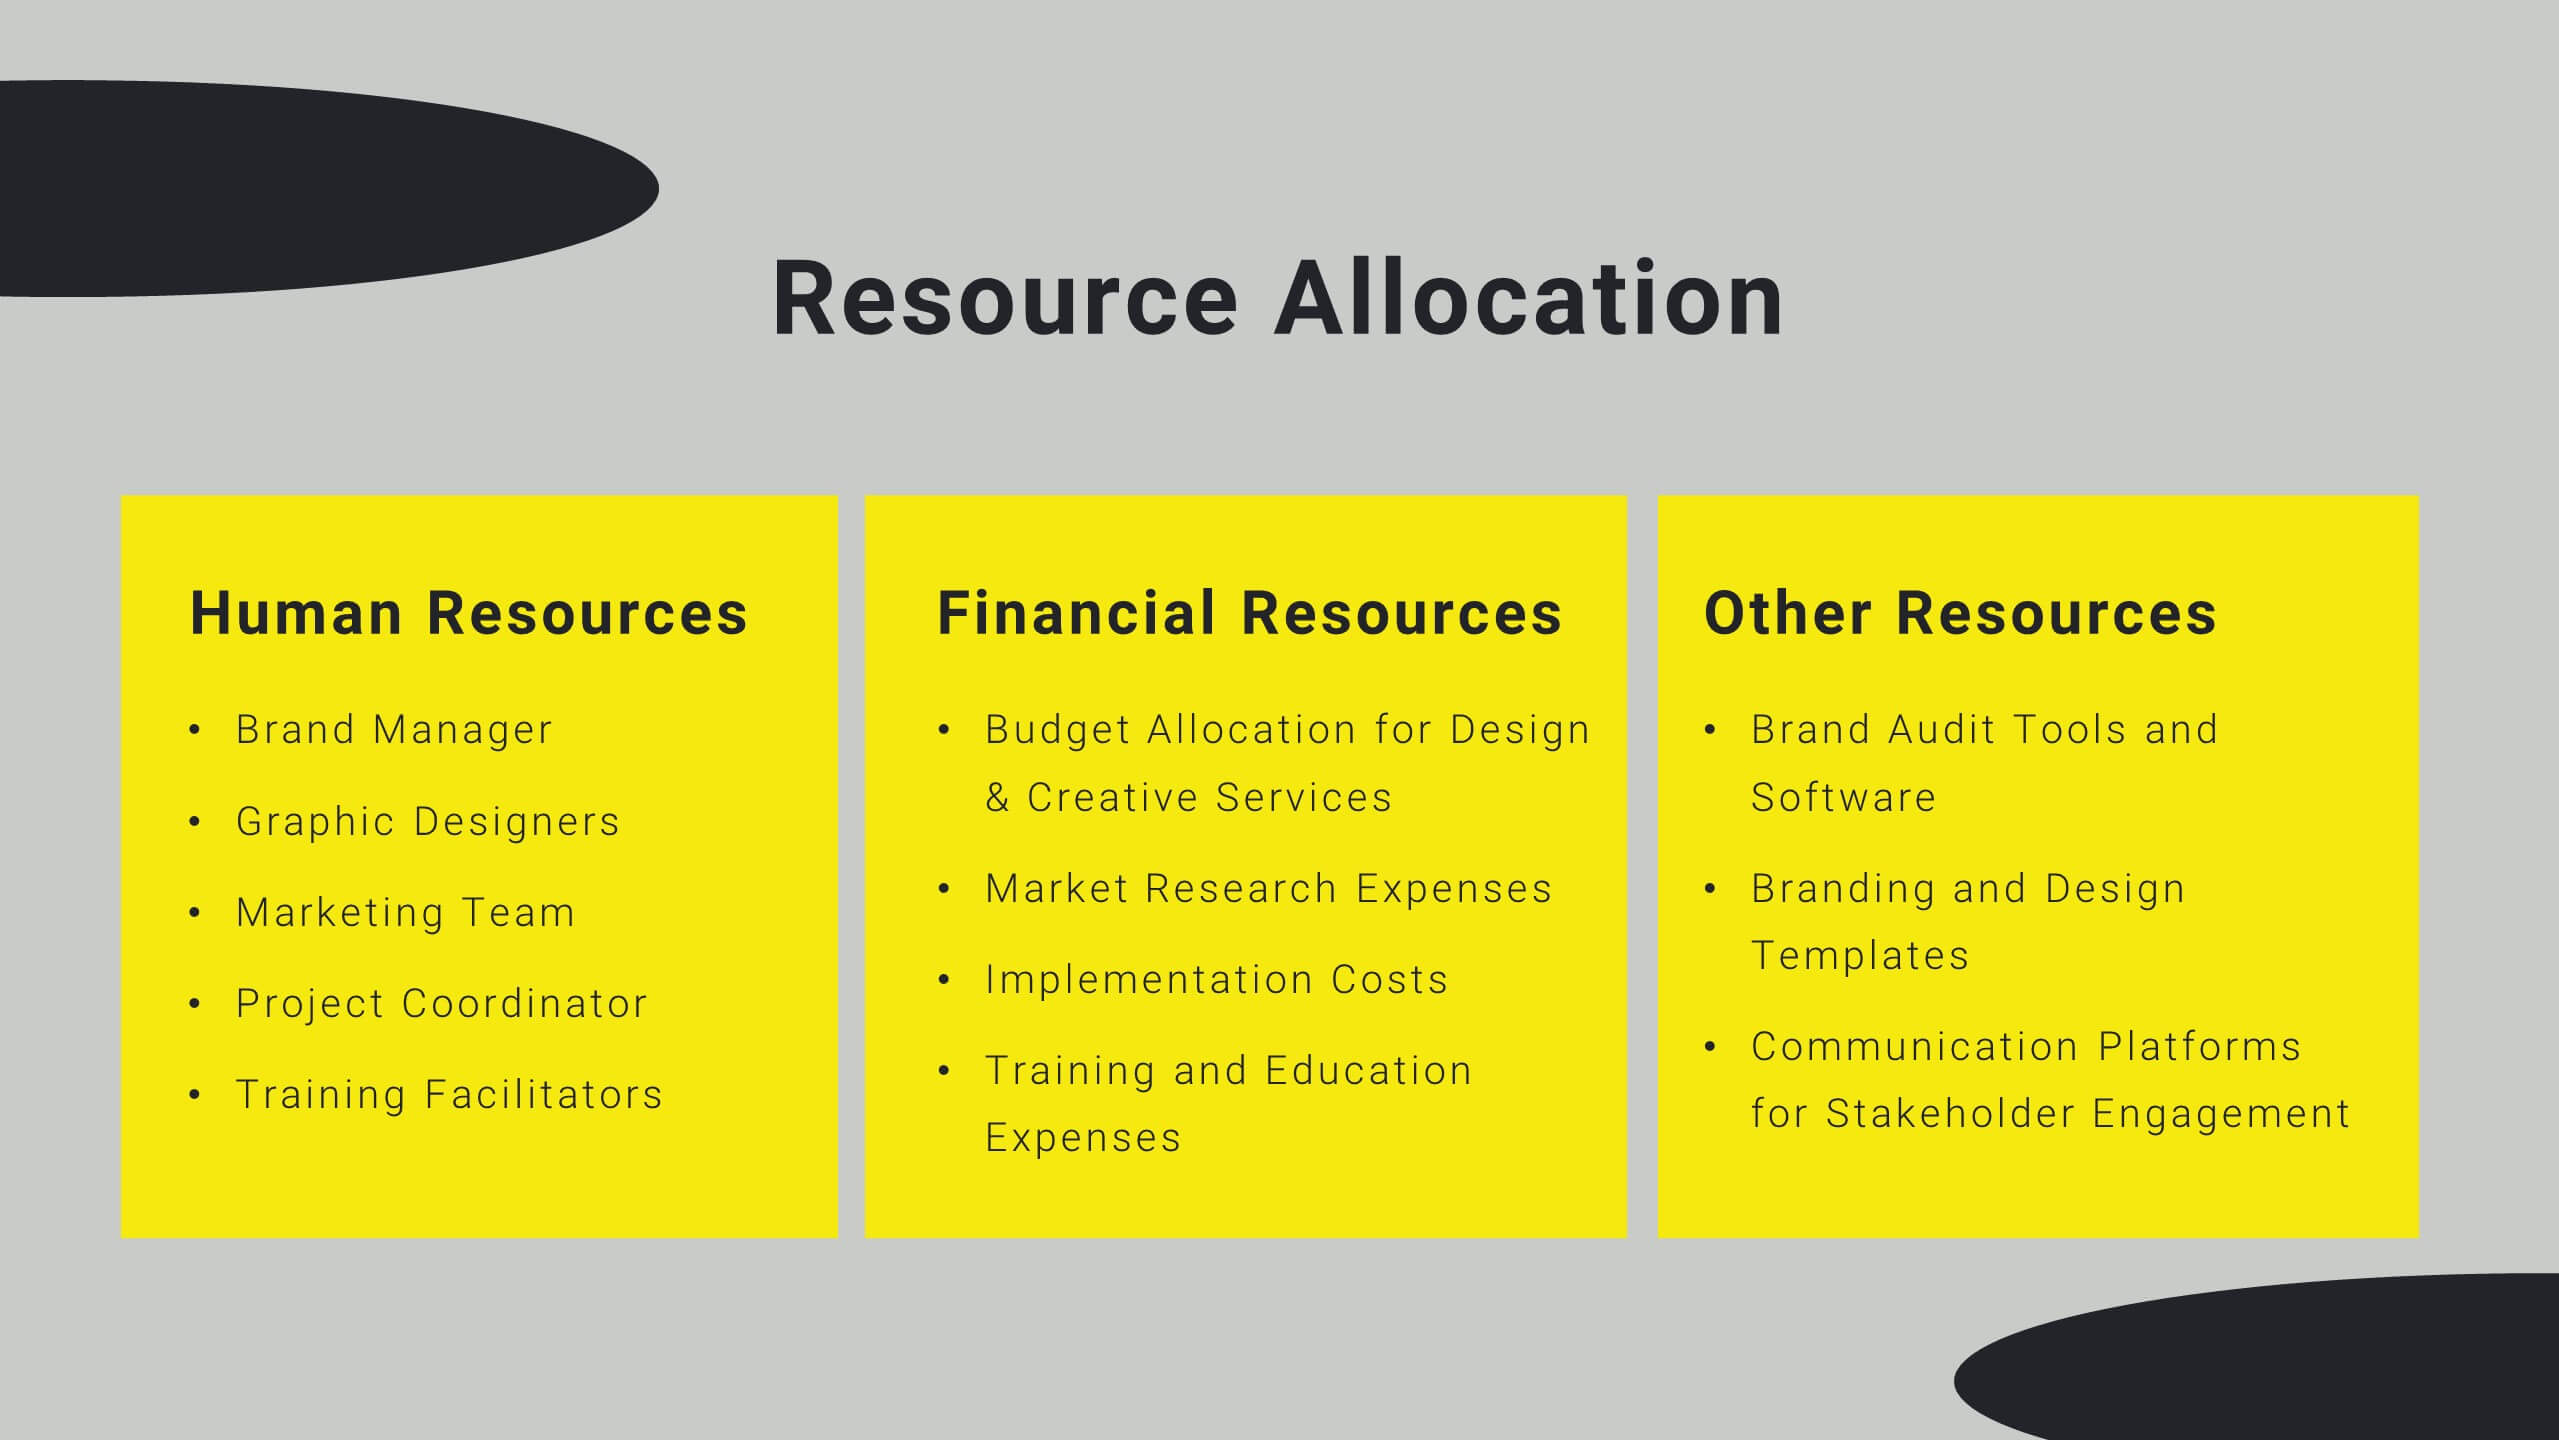
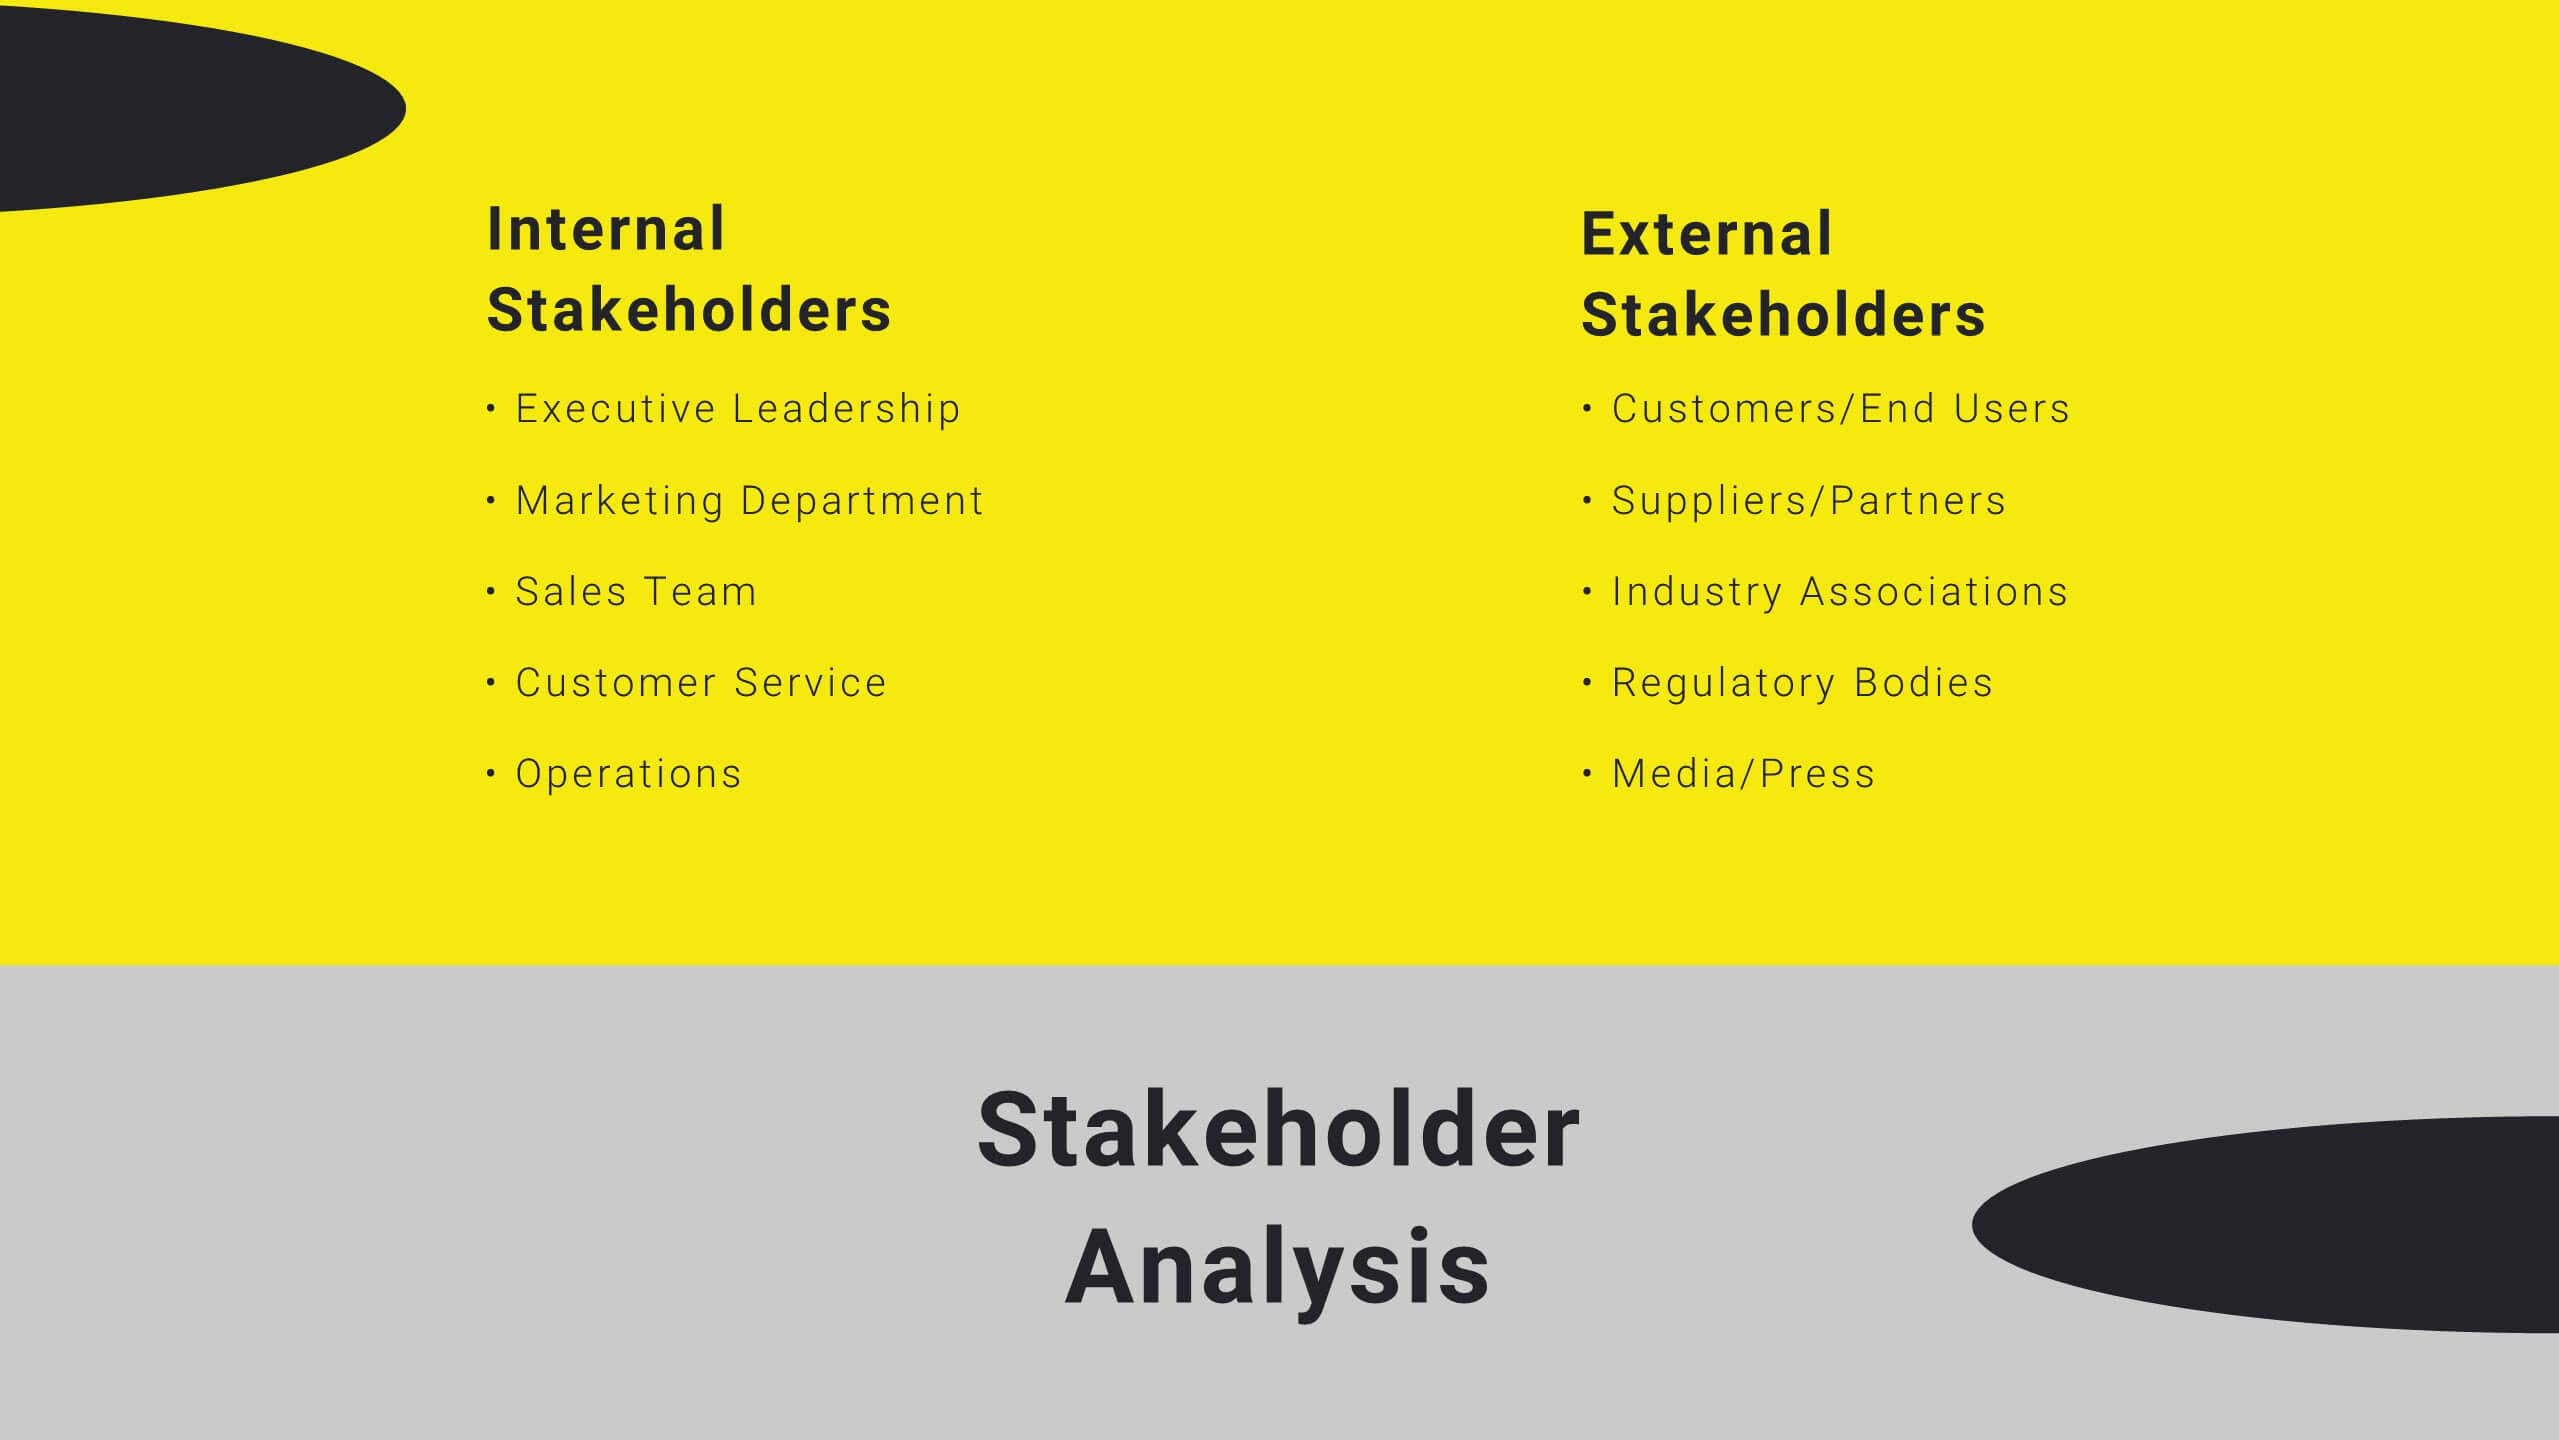
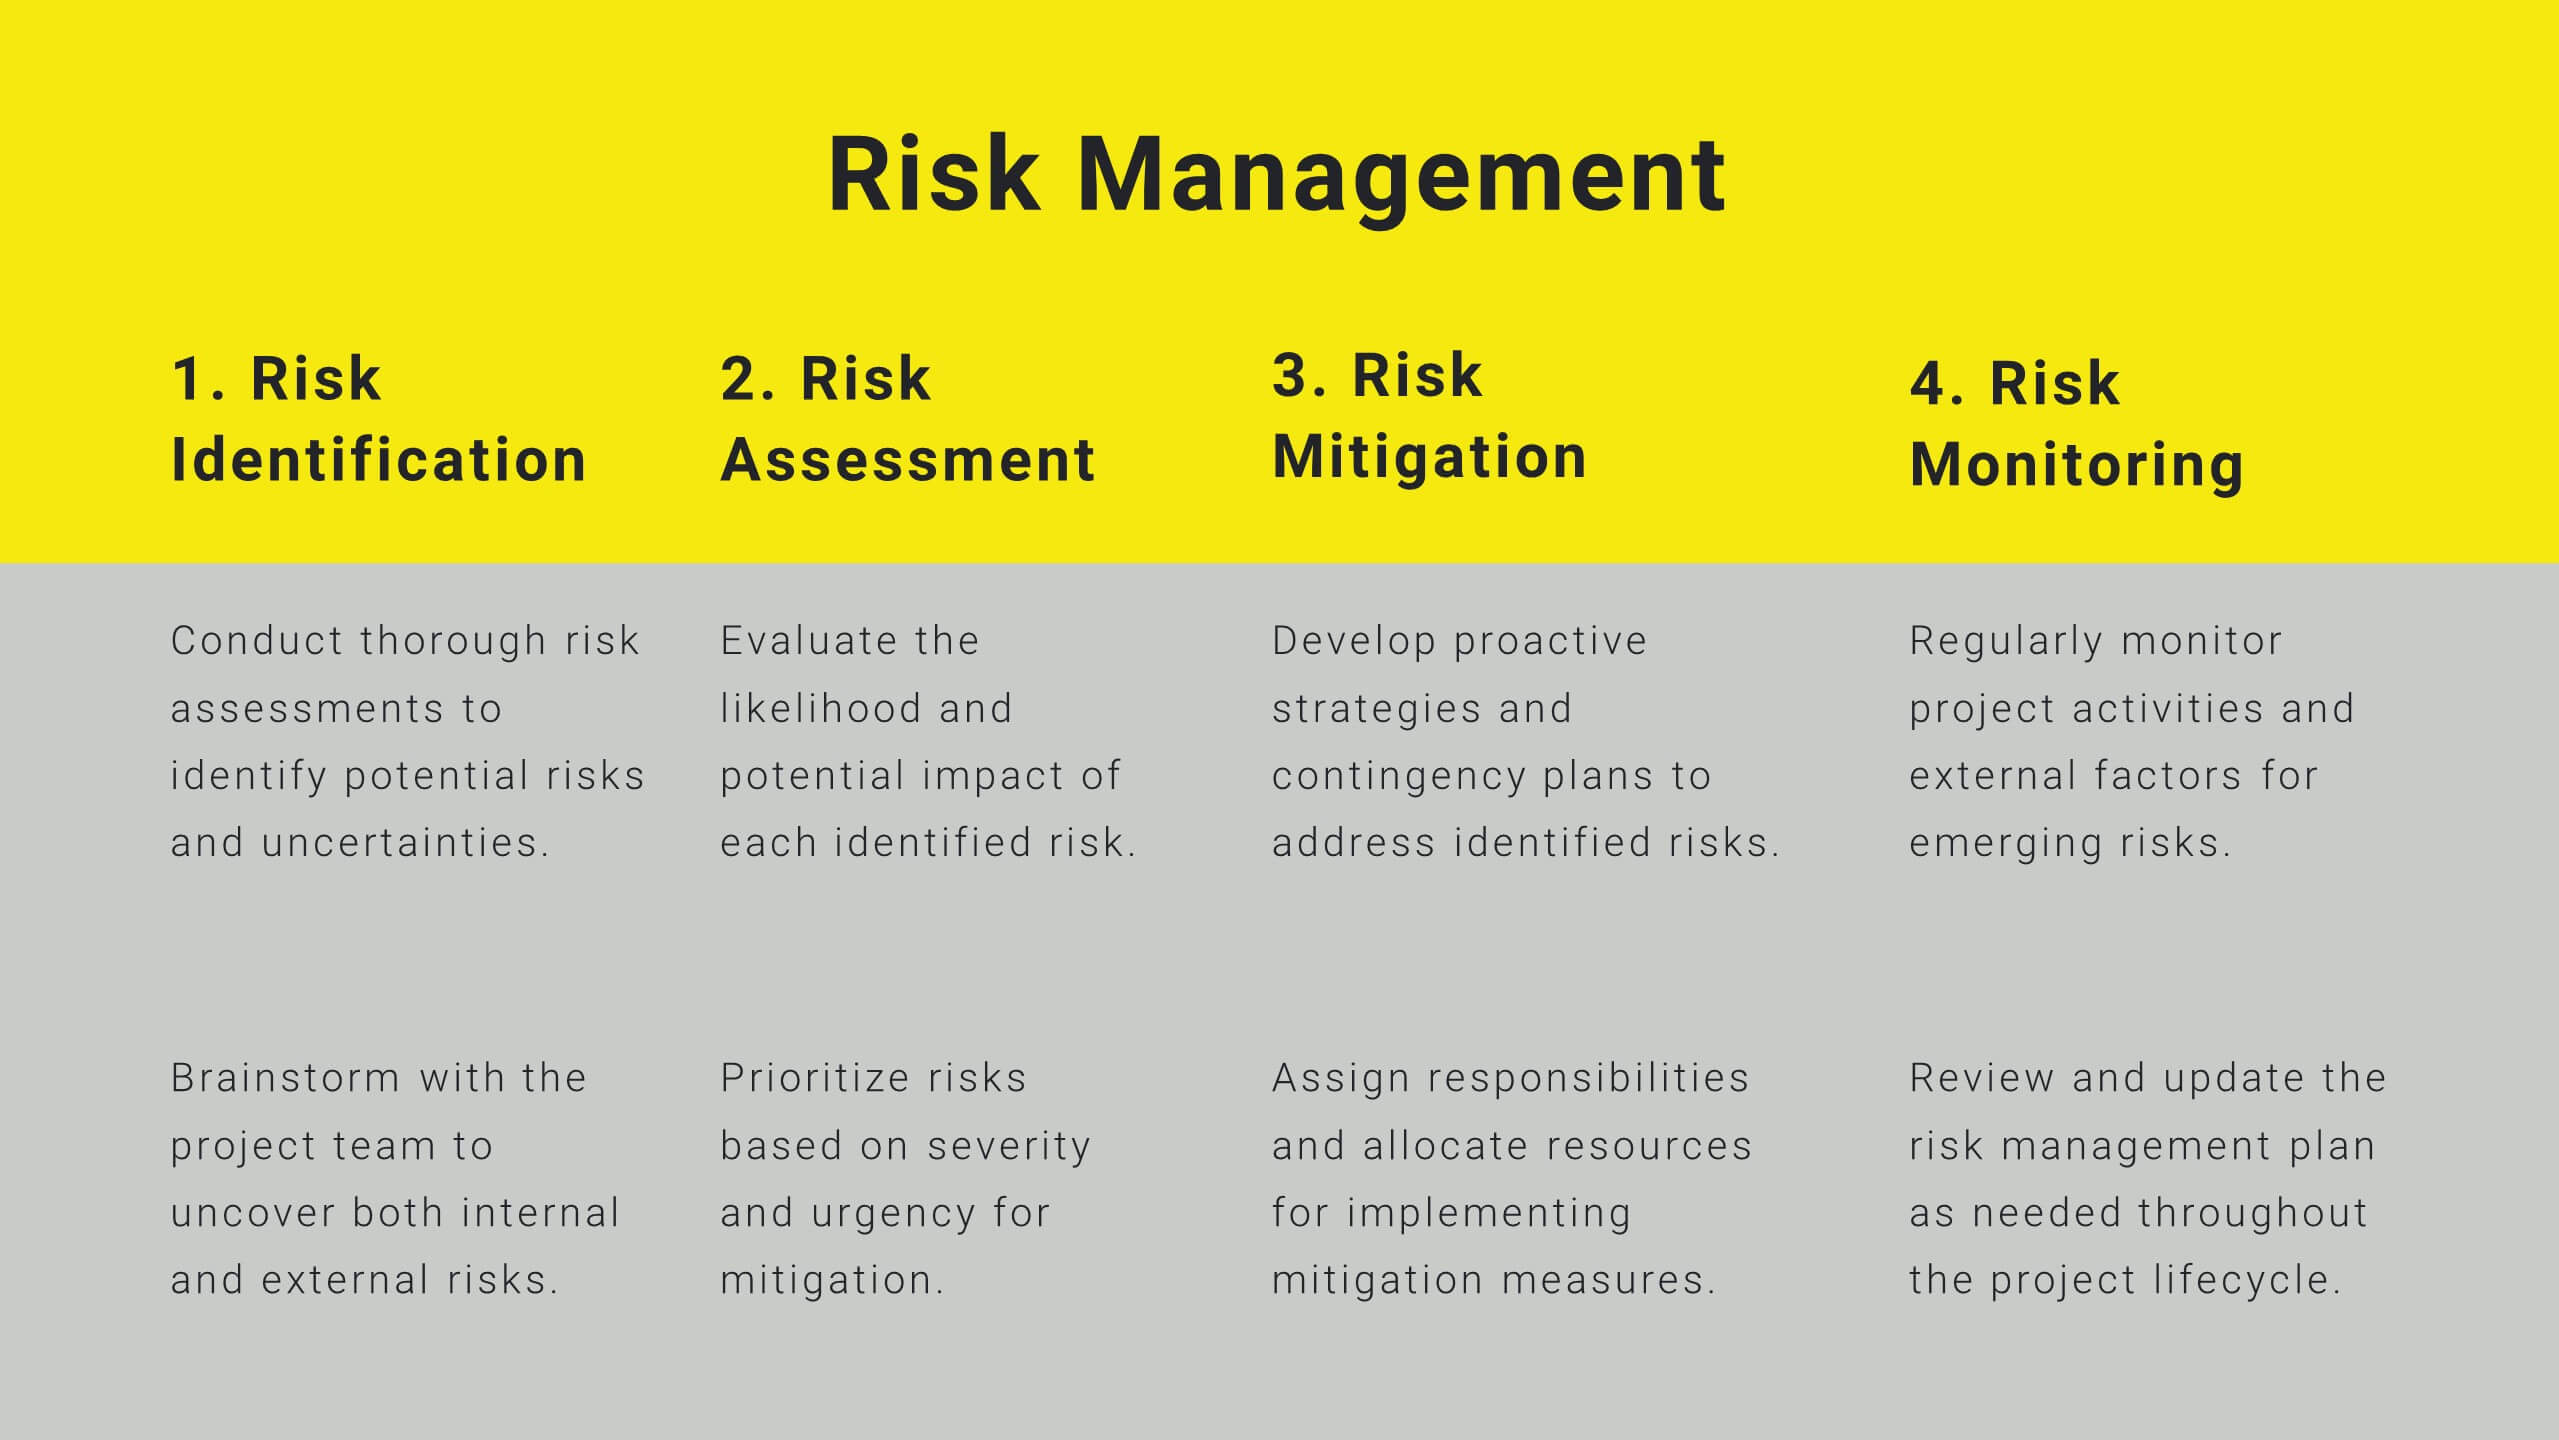
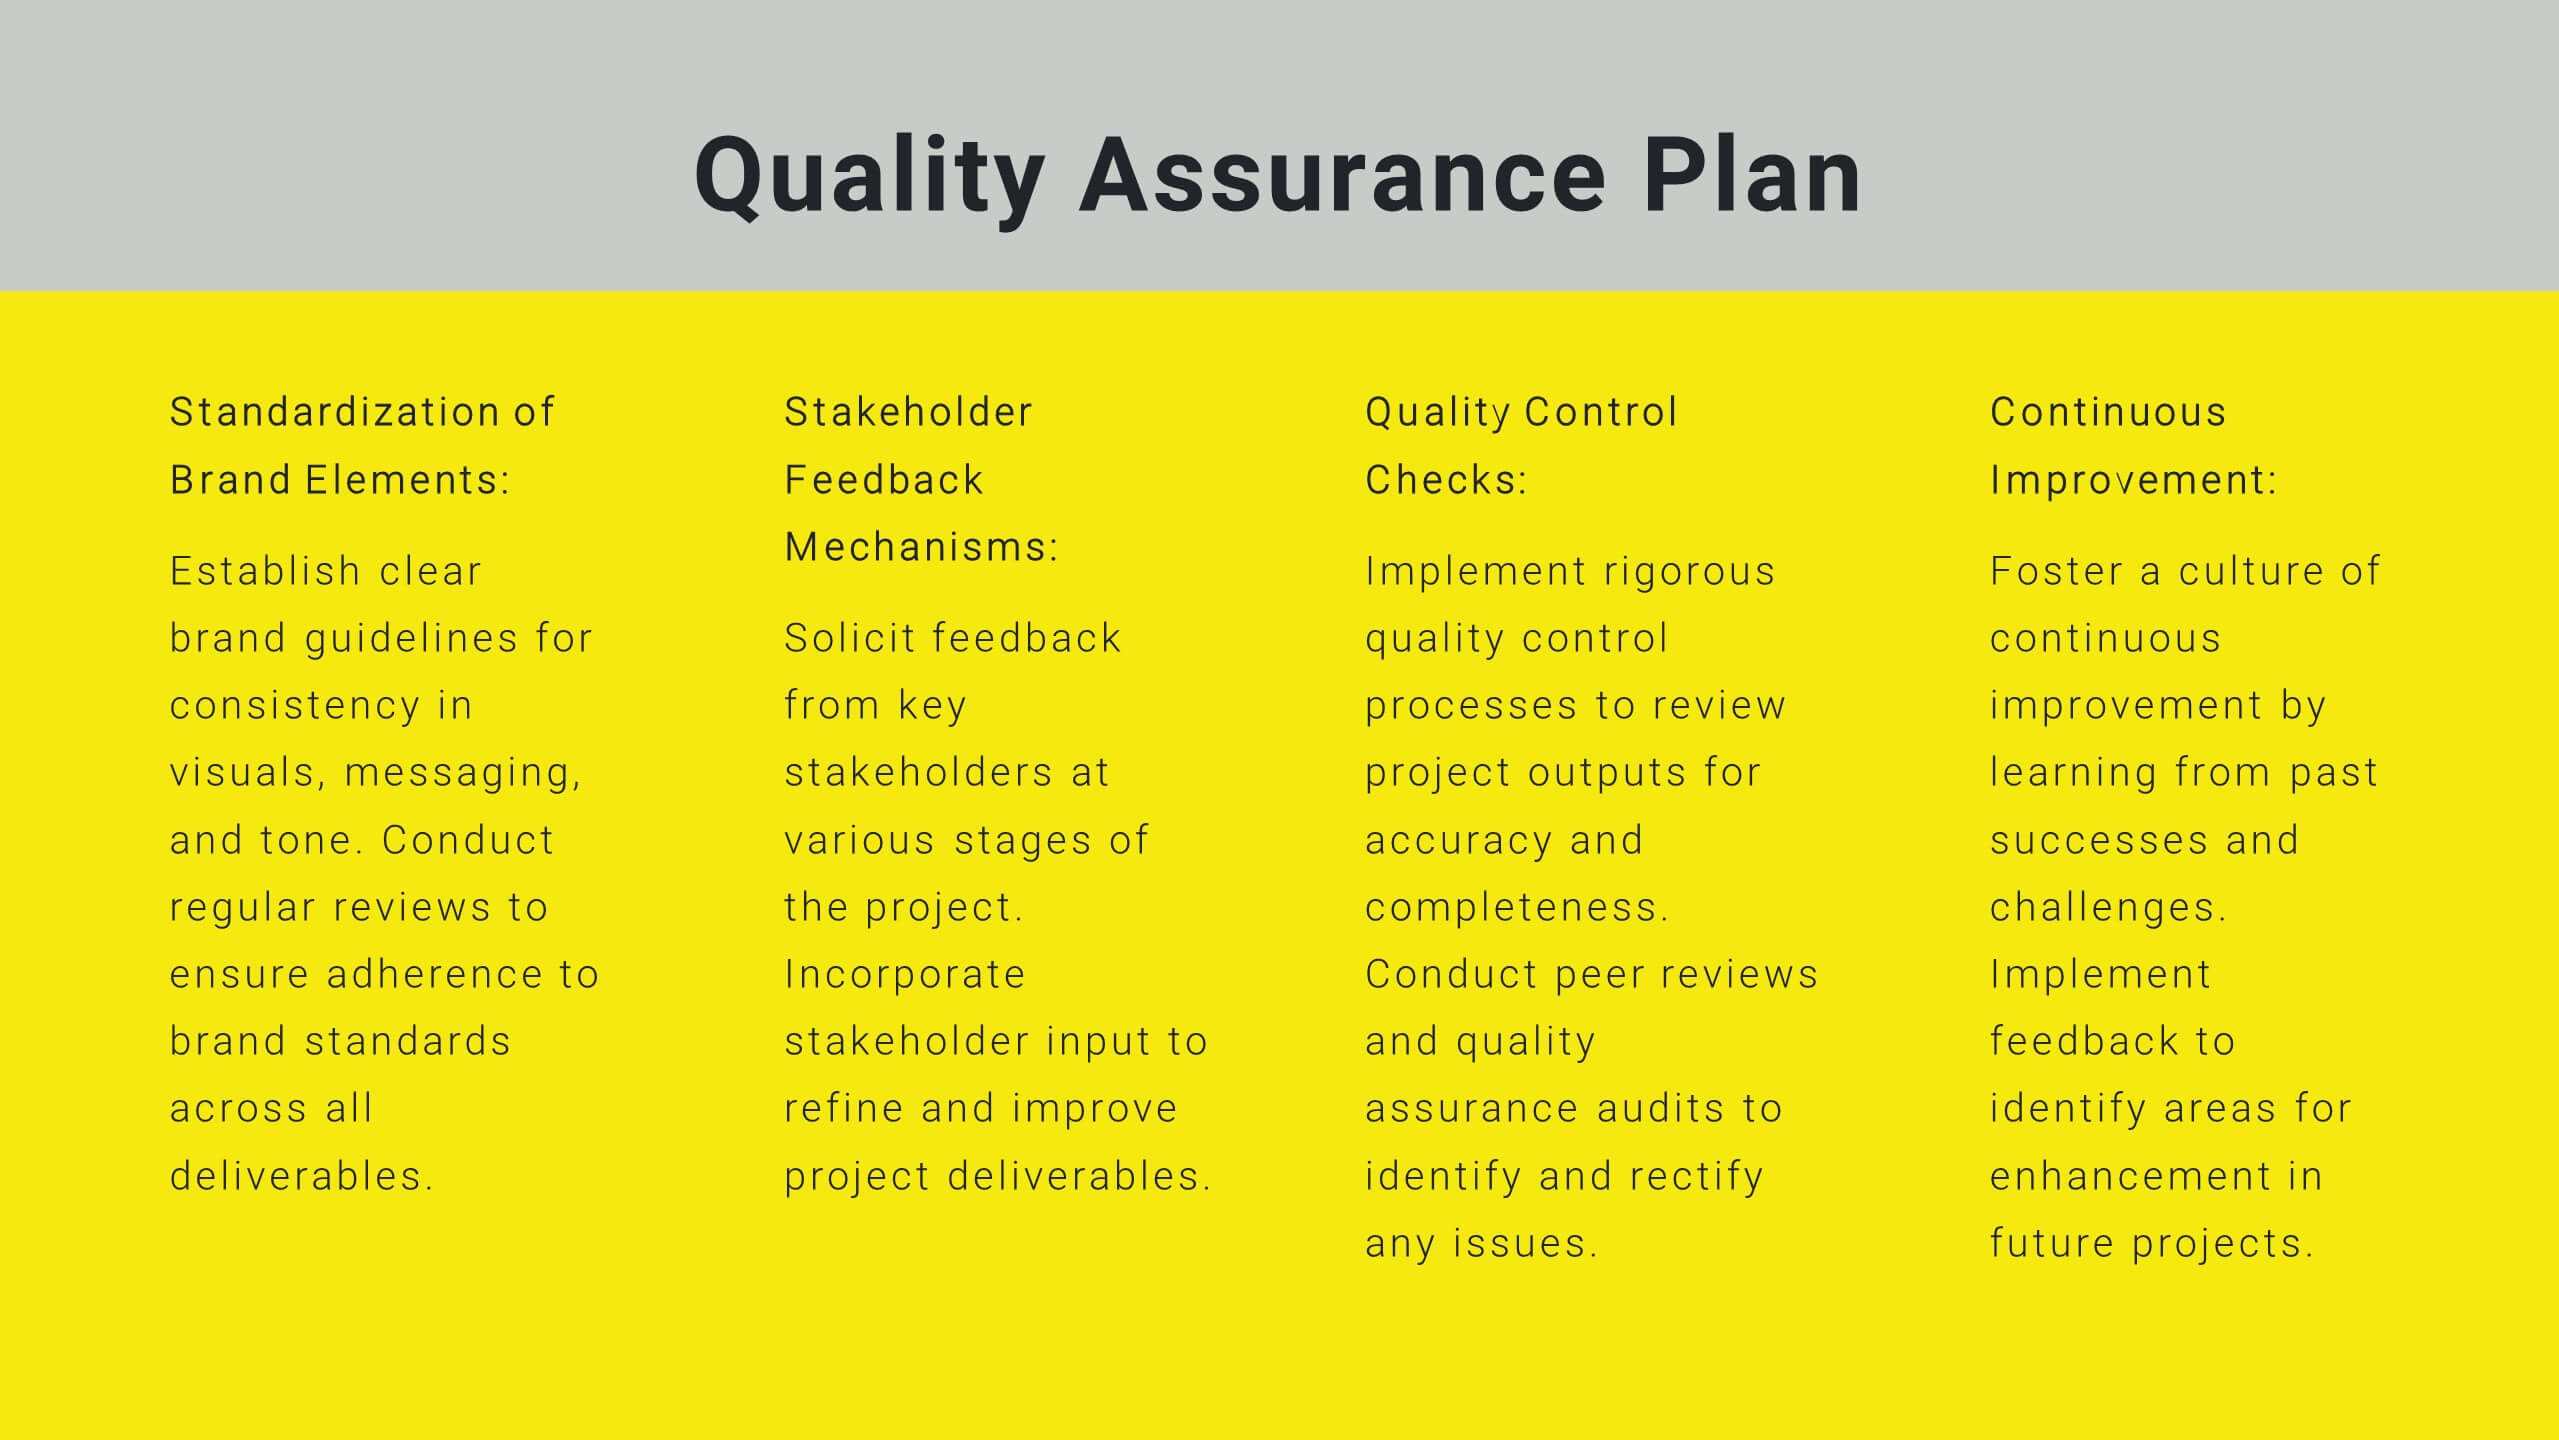
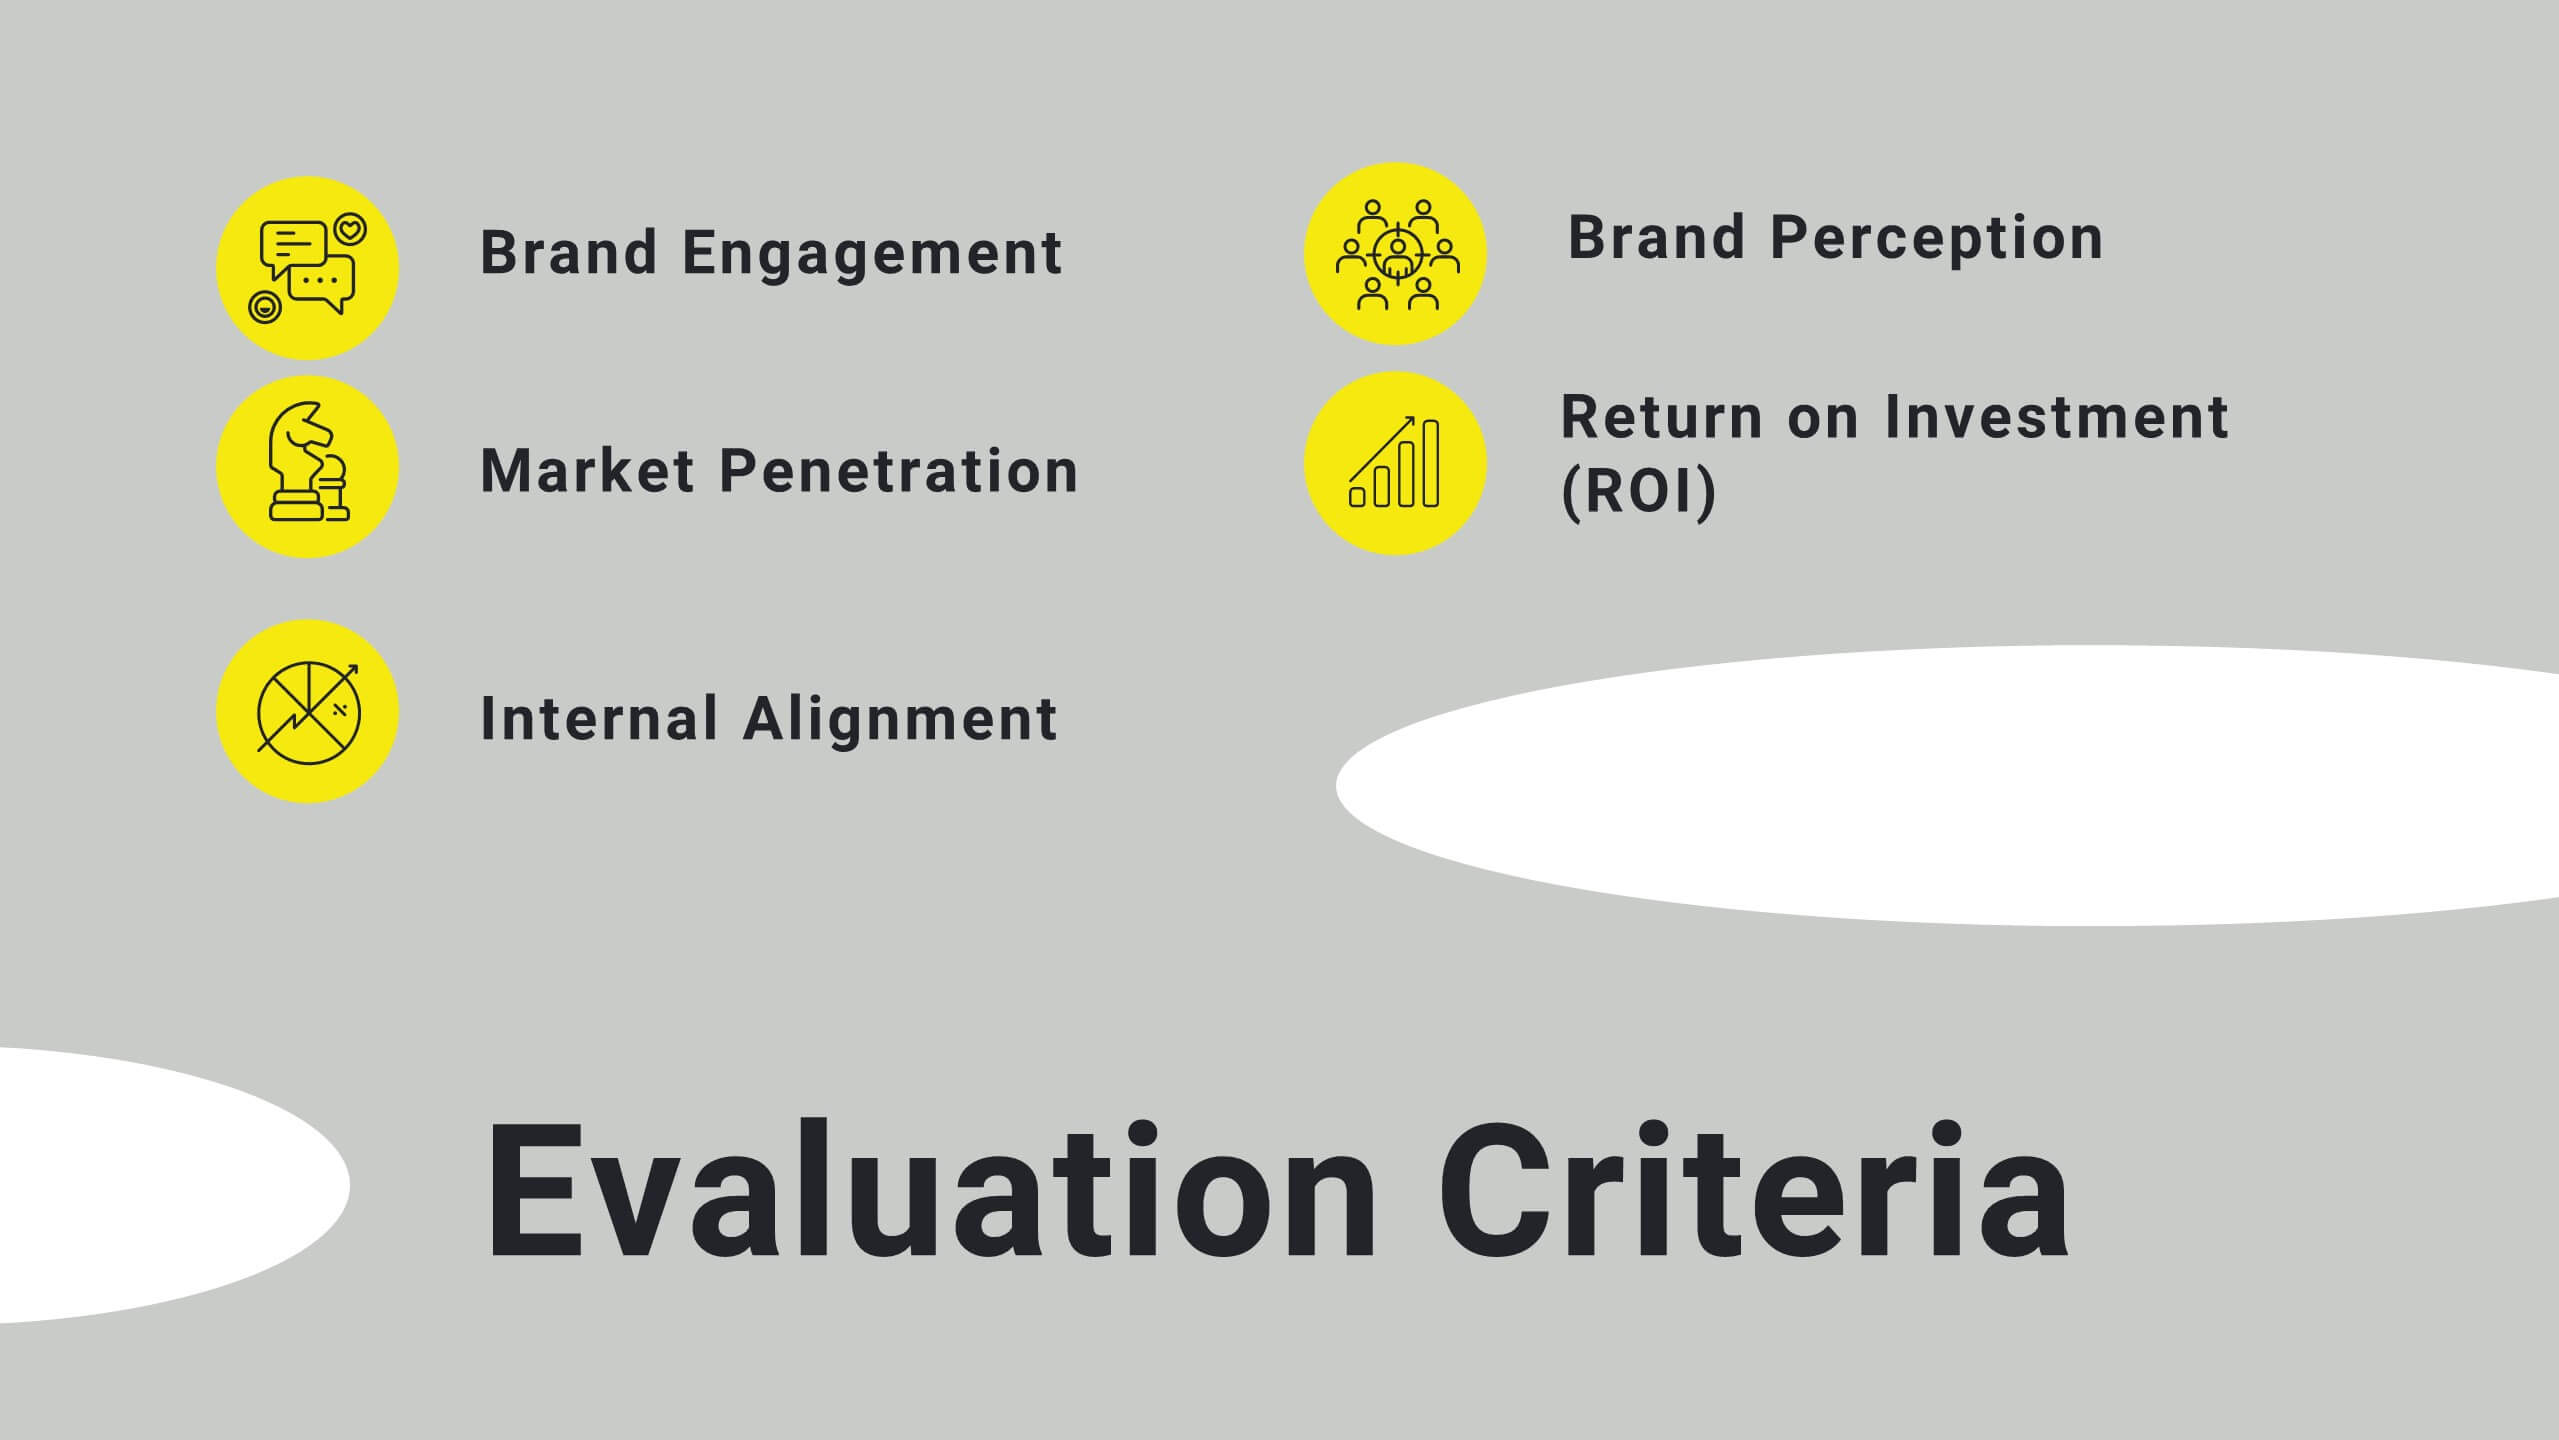
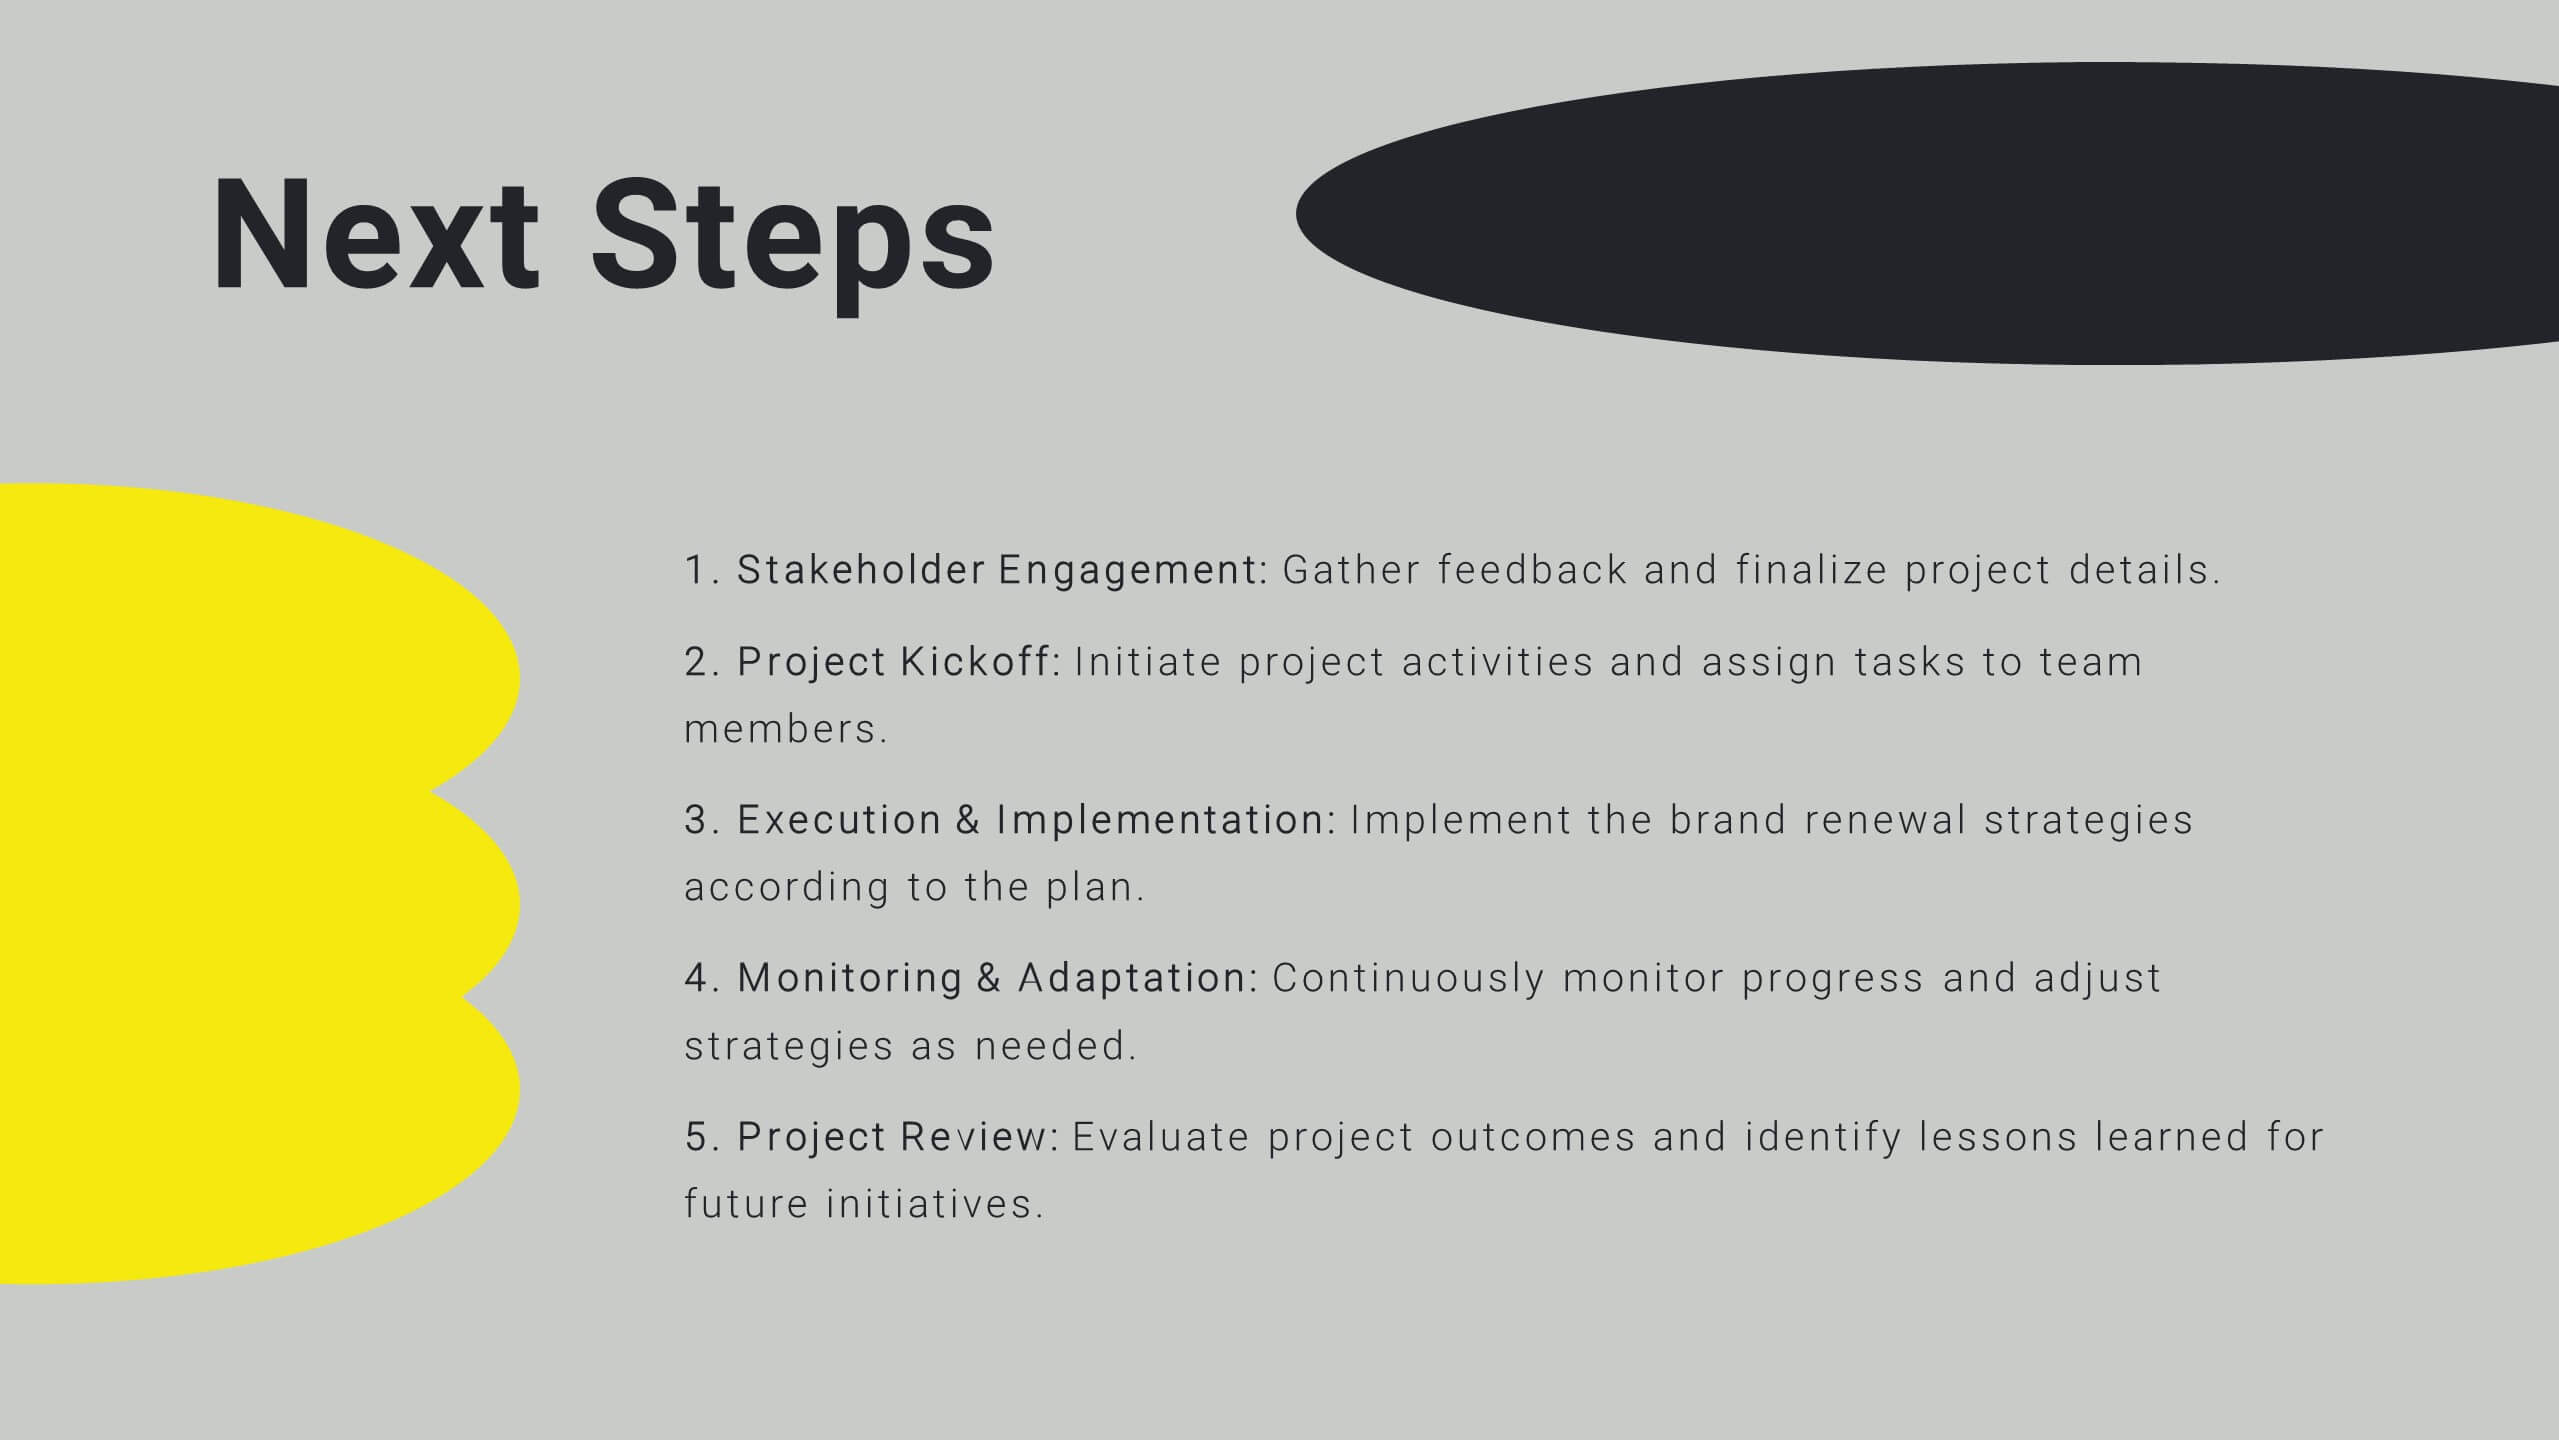
Sable Detailed Project Execution Plan Presentation
Master your project planning with this comprehensive execution plan template! Perfect for detailing project overviews, objectives, and timelines, it includes slides for budget breakdowns, resource allocation, and risk management. Ensure every detail is covered with structured content and clear visuals. Compatible with PowerPoint, Keynote, and Google Slides for seamless presentations on any platform.


6 diapositivas
Commercial Agriculture Infographics
Explore the world of Commercial Agriculture with our customizable infographic template. This template is fully compatible with popular presentation software like PowerPoint, Keynote, and Google Slides, allowing you to easily customize it to illustrate and communicate various aspects of commercial agriculture. The Commercial Agriculture infographic template offers a visually engaging platform to explore and explain the practices, trends, and challenges in modern agriculture for commercial purposes. Whether you're a farmer, agricultural professional, student, or simply interested in food production and sustainability, this template provides a user-friendly canvas to create informative presentations and educational materials. Deepen your understanding of Commercial Agriculture with this SEO-optimized infographic template, thoughtfully designed for clarity and ease of use. Customize it to highlight key agricultural practices, technologies, crop management, and the importance of sustainable farming, ensuring that your audience gains valuable insights into this vital industry. Start crafting your personalized infographic today to explore the world of Commercial Agriculture.


26 diapositivas
Company Profile Geometric Presentation
A company profile is a document or presentation that provides an overview of a business or organization. This presentation template serves as a marketing tool to showcase the company's strengths, capabilities, products, history, and achievements. Use this template to effectively showcases your company's identity, values, and services. The presentation is designed to leave a lasting impression on potential clients, partners, investors, and stakeholders. With its clean lines and geometric elements, the template exudes a sense of sophistication and contemporary style. Compatible with Powerpoint, Keynote, and Google Slides.


5 diapositivas
Corporate Messaging Strategy Presentation
Clarify your company’s voice with this corporate messaging strategy slide. Designed to outline your core communication pillars, this layout helps you present messaging priorities across different channels or audiences. Perfect for marketing teams, branding sessions, or executive briefings. Fully editable in Canva, PowerPoint, and Google Slides for quick customization.


6 diapositivas
Data Analysis Methods Infographics
This Data Analysis Methods Infographic is an excellent tool for professionals and students alike to present statistical findings and patterns. Designed for seamless integration with PowerPoint, Google Slides, and Keynote. The infographics are ideal for illustrating trends, and summarizing large amounts of data in an easily digestible format. With a variety of chart styles, including bar graphs, line charts, and icon arrays, the template allows for versatile data representation. Make your data speak volumes with this crisp and informative infographic, ensuring your audience grasps the insights at a glance. Perfect for market research, academic research, and business performance presentations.


5 diapositivas
Corporate Staff Introduction and Bios Presentation
Introduce your team with clarity using the Corporate Staff Introduction and Bios Presentation. This layout is perfect for showcasing employee names, titles, photos, and brief bios in a professional format. Ideal for company overviews, internal communications, or onboarding decks. Fully editable in PowerPoint, Canva, and Google Slides.


20 diapositivas
Creative Marketing Proposal Presentation
Elevate your business proposals with this sleek marketing proposal template, designed in dynamic purple tones. It comprehensively covers everything from company overview to pricing structures, making it perfect for detailing your marketing strategies effectively. Compatible with PowerPoint, Google Slides, and Keynote, it's ideal for professionals aiming to impress clients and secure projects.


21 diapositivas
Ashbrook Startup Funding Proposal Presentation
This Startup Funding Presentation Template is designed to help entrepreneurs pitch their ideas effectively. Covering essential aspects such as the business model, market analysis, growth plan, and financial overview, it provides a professional structure to captivate investors. Fully customizable and compatible with PowerPoint, Keynote, and Google Slides.


4 diapositivas
Problem-Solving Puzzle Diagram Presentation
The "Problem-Solving Puzzle Diagram Presentation" template effectively showcases a creative approach to illustrating complex problem-solving strategies. Each piece of the puzzle represents a unique aspect of the solution process, encouraging viewers to consider how different components fit together to achieve a successful outcome. The diagram uses contrasting colors to differentiate between the sections clearly, making it easy for the audience to follow along and understand the interconnections. This template is perfect for business analysts, project managers, or any professional involved in strategic planning and problem-solving. It's designed to facilitate discussions in workshops, meetings, or team collaborations where visual aids can enhance comprehension and engagement in developing solutions.


7 diapositivas
30 60 90 Nutritional Plan Infographic
Chart a path to healthful living with the 30 60 90 Nutritional Plan Infographic. In a vibrant mix of yellow, purple, blue, and white, this template presents a visually delightful guide to nutrition enthusiasts and health-conscious audiences. The tailored design encourages a gradual approach to dietary transitions, making it easier to understand and adhere to. Health coaches, dietitians, or fitness trainers will find this as an indispensable tool for workshops, webinars, or consultations. Its seamless integration with PowerPoint, Keynote, and Google Slides enhances the user experience during presentations.