


Características


¿Tienes alguna pregunta?
Recomendar


32 diapositivas
Willowshade Brand Guidelines Proposal Presentation
This dynamic presentation template is tailored to define and showcase comprehensive brand guidelines. Key sections include logo design, typography, color palette, imagery, brand voice, and values, ensuring brand consistency across platforms. It also features areas for target audience analysis, market research, competitive landscape, and unique selling propositions to reinforce strategic positioning. Visual examples for website, social media, packaging, and advertising highlight real-world applications. Fully customizable and compatible with PowerPoint, Keynote, and Google Slides.


21 diapositivas
Aetherion New Product Proposal Presentation
This Product Presentation Template is designed to effectively showcase your product's features, target market, and competitive advantages. It includes sections for customer pain points, pricing strategy, technical specifications, and marketing plans. Fully customizable for PowerPoint, Keynote, and Google Slides, it's perfect for product launches and investor pitches.


5 diapositivas
Healthcare Innovations and Medical Trends Presentation
Showcase breakthroughs and progress with the Healthcare Innovations and Medical Trends Presentation. This slide features a stylized heart icon with segmented color highlights tied to four labeled icons—perfect for visualizing trends, solutions, or stages in care. Fully editable in Canva, PowerPoint, Keynote, and Google Slides for easy customization.


10 diapositivas
Stakeholder Analysis Matrix Presentation
Spark interest from the very first slide with a clean, engaging layout designed to simplify complex relationships. This presentation helps you outline stakeholder influence, priorities, and engagement levels in a clear, structured way that supports better project decisions. Fully compatible with PowerPoint, Keynote, and Google Slides.


5 diapositivas
Ideal Customer Profile Breakdown
Shine a light on your perfect customer with this bright, idea-inspired layout—designed to guide you through the essential traits, needs, and behaviors that define your ideal client. Perfect for marketing strategy, sales enablement, or persona creation. Fully compatible with PowerPoint, Keynote, and Google Slides.


6 diapositivas
5G Network Infographic
5G, short for fifth-generation wireless technology, is the latest generation of mobile network technology designed to provide faster, more reliable, and higher capacity wireless communication. This infographic template is designed to educate viewers about the key features, benefits, and impact of 5G technology on various aspects of our lives. This template aims to provide a comprehensive and easy-to-understand overview of the transformative capabilities of 5G technology. It serves as a valuable resource for individuals, businesses, and organizations seeking to understand the potential impact and benefits of 5G on various aspects of our lives and the broader technological landscape.


7 diapositivas
Team Work Infographic Presentation Template
Teamwork is a method of working collaboratively in order to achieve a goal. Members of a team can accomplish more than they could individually through their combined talents, knowledge and experience. This template can be used to help explain what teamwork is, what it looks like, why it’s important, and how you can cultivate it within your organization. This teamwork template is designed to encourage communication. Use this template to help evaluate what areas your team can improve on and how they can do so. Point out exactly how vital teamwork is to the success of your business.


4 diapositivas
Decision-Making Models and Strategies Presentation
Break down complex decision-making processes into clear, visual steps with the Decision-Making Models and Strategies presentation slide. This template uses a 3D staircase layout paired with data percentages to illustrate phases, criteria, or strategy distribution. It's perfect for business analysts, consultants, or strategic planning teams. Fully editable in PowerPoint, Keynote, and Google Slides for quick customization.

22 diapositivas
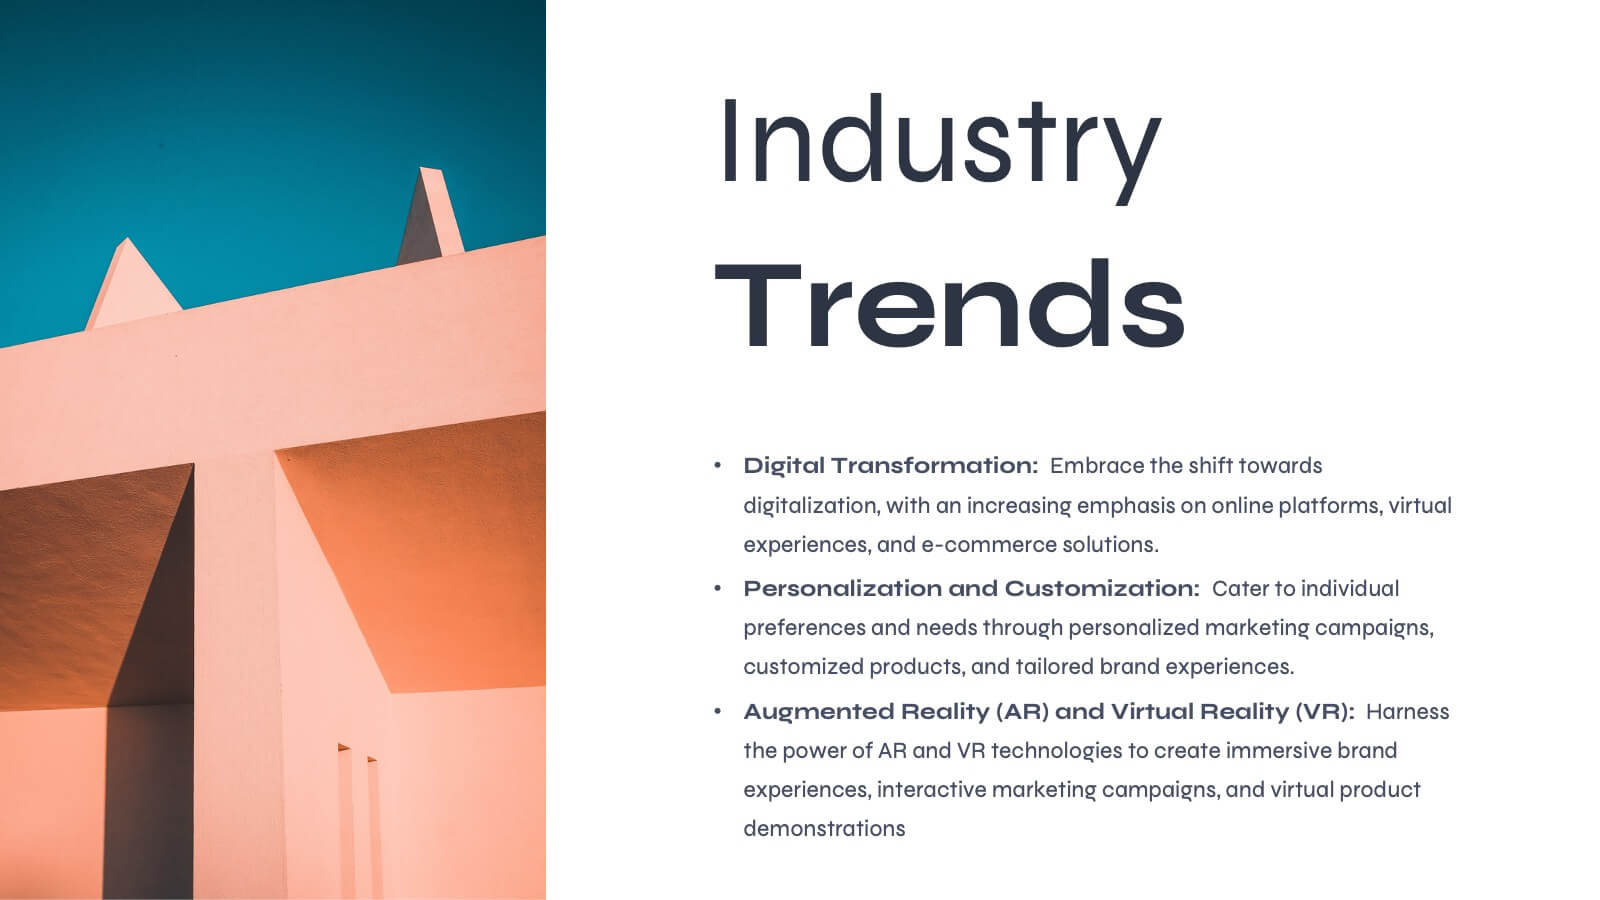
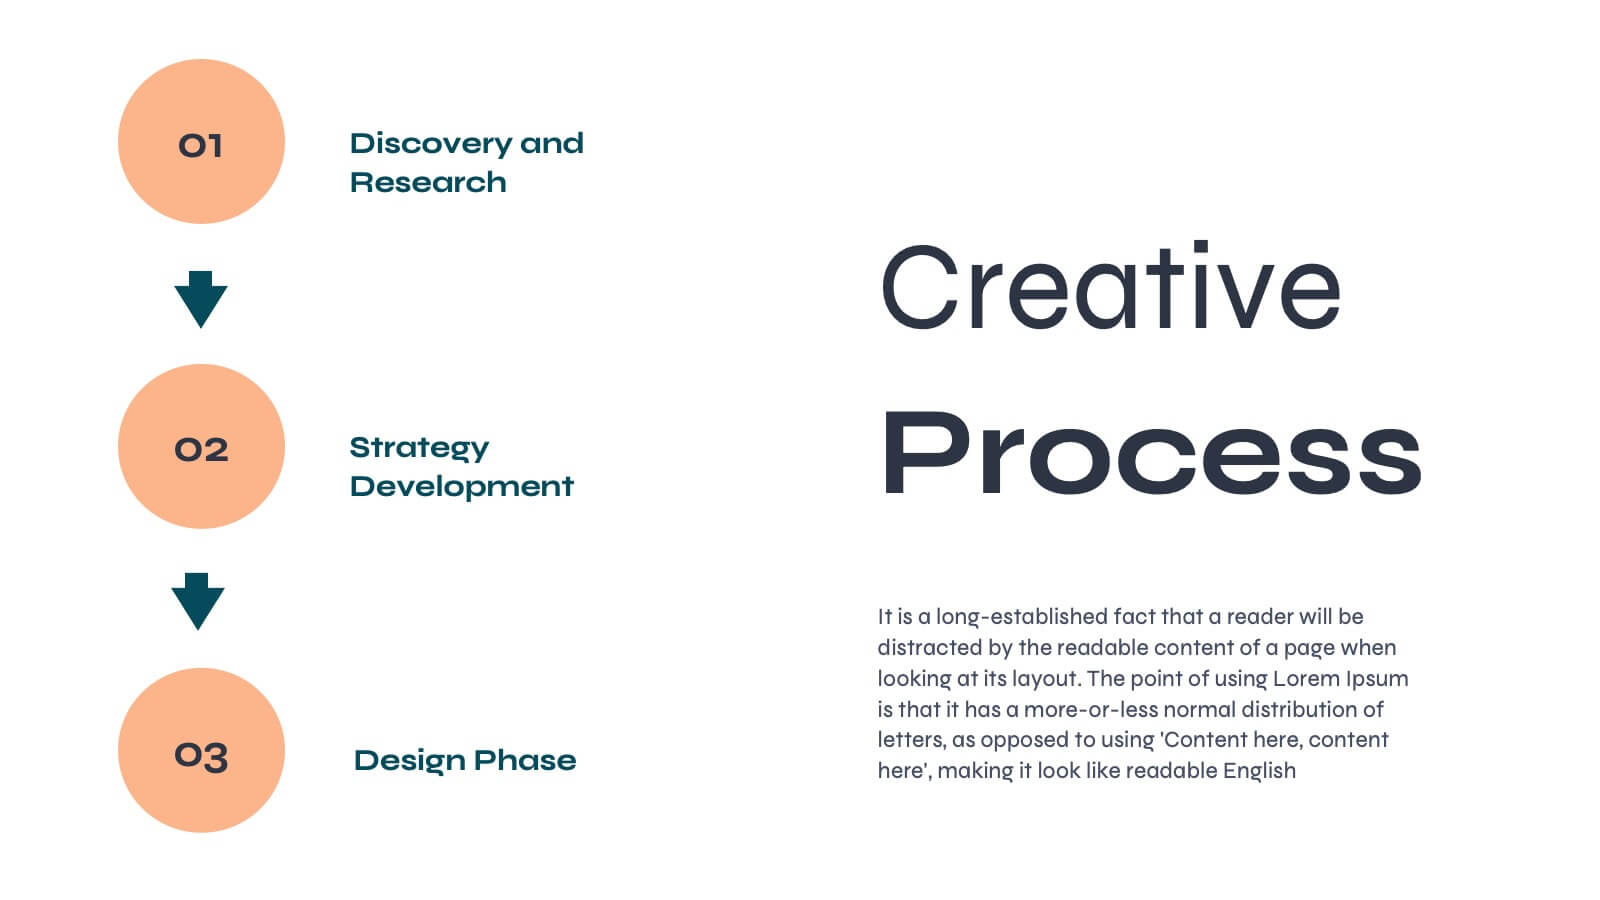
Aurora Agency Portfolio Presentation
Showcase your agency's strengths with this polished, modern presentation template. Perfect for presenting market analysis, client success stories, and creative processes, it features a clean and professional design. Highlight your team's expertise and strategic approach to impress potential clients. Compatible with PowerPoint, Keynote, and Google Slides, it ensures seamless presentations on any platform.


7 diapositivas
Environmental Infographic Presentation Template
An Environmental infographic is a great tool for educating your audience about the state of the environment. This template includes a large format and bold colors that create an impactful visual appeal. The design provides space for facts, stats, and descriptions of the project in question. Use this template to show how much the world has changed and what measures are being taken to mitigate effects on the environment. This infographic has a green hue and illustrations that allow you to add information on the world's natural resources. This is a unique and fun way to display your information.


5 diapositivas
Infographic Business Charts Presentation
Bring your data to life with a bold, visual storytelling layout designed to make insights instantly clear and impossible to ignore. This presentation highlights key metrics using clean, modern business charts that simplify comparisons and trends for any audience. Fully compatible with PowerPoint, Keynote, and Google Slides.


8 diapositivas
Startups Pitch Deck Presentation
Bring your idea to life with a bold, energetic layout designed to showcase vision, traction, and future potential. This presentation helps you communicate your business model, strategy, and key insights with clarity and confidence. Clean visuals and structured sections keep your message strong and compelling. Fully compatible with PowerPoint, Keynote, and Google Slides.


7 diapositivas
5G Infographic Presentation Template
A 5G infographic is data related to the 5th generation of mobile telecommunications technology. This infographic template is an engaging way to display facts and figures, and attract attention from a wide audience. The main purpose of our 5G infographic template is to help you educate others about the new technology and its capabilities, and to help promote understanding of 5G. The information presented in this infographic can range from details, such as the differences between 5G and previous generations of mobile networks, and the benefits and potential applications of 5G.


7 diapositivas
Porters Five Forces Model Infographic Presentation
Porter's Five Forces Model is a structured framework used to analyze the competitive forces within an industry and their impact on a company's profitability. With template you can create an appealing and informative infographic about Porter's Five Forces Model. Featuring helpful illustrations and easy-to-read text, this template is perfect for breaking down the complex concepts of Porter's Five Forces Model into simple, understandable terms. Designed for use with Powerpoint, Keynote, and Google Slides, you can easily add your own content and tailor the template to fit your specific needs.


5 diapositivas
Collaborative Learning Techniques Overview Presentation
Highlight team-based education methods with the Collaborative Learning Techniques Overview Presentation. This layout is perfect for mapping out peer-led discussions, group projects, or cooperative learning strategies using a visual 4-step flow. The clean, screen-themed icons make it ideal for educators, trainers, or eLearning creators. Fully editable in Canva, PowerPoint, Keynote, and Google Slides.
21 diapositivas
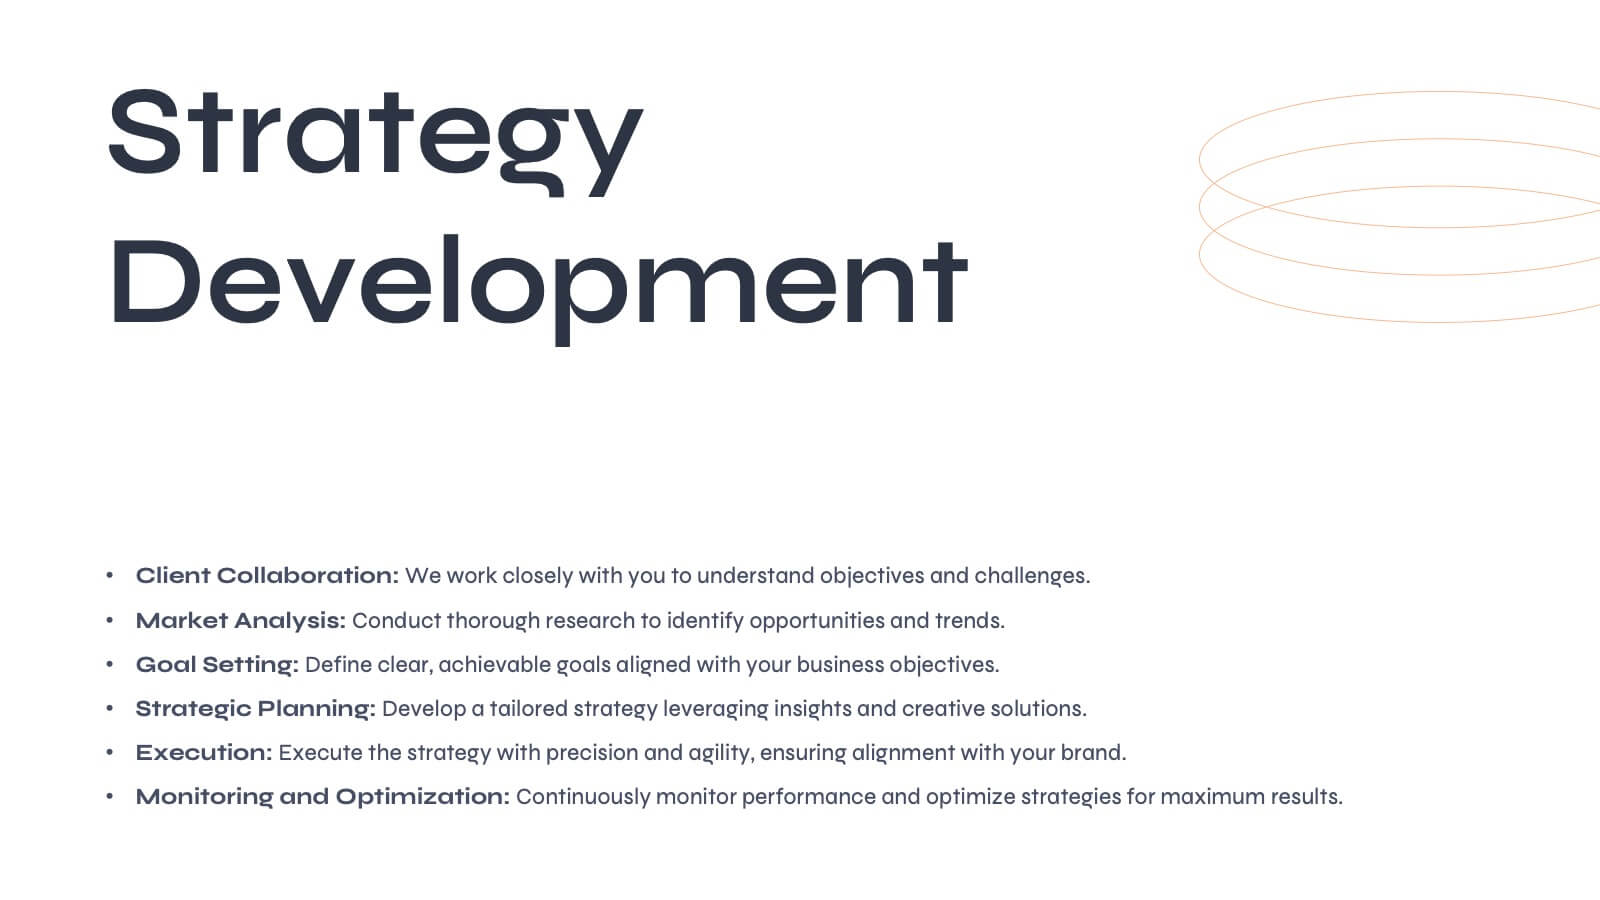
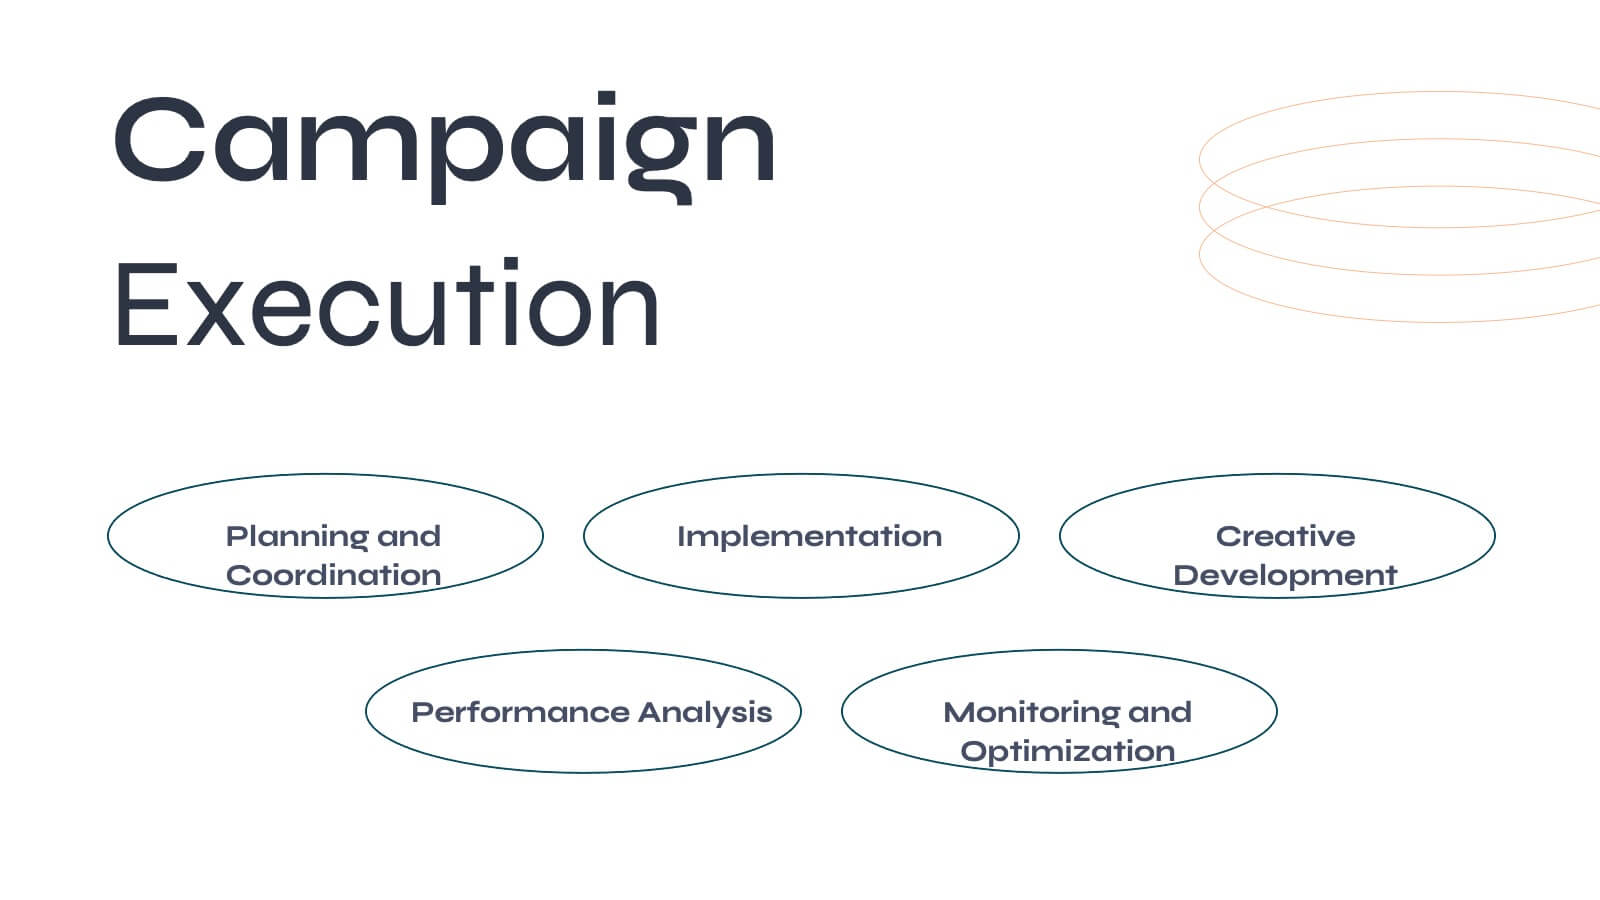
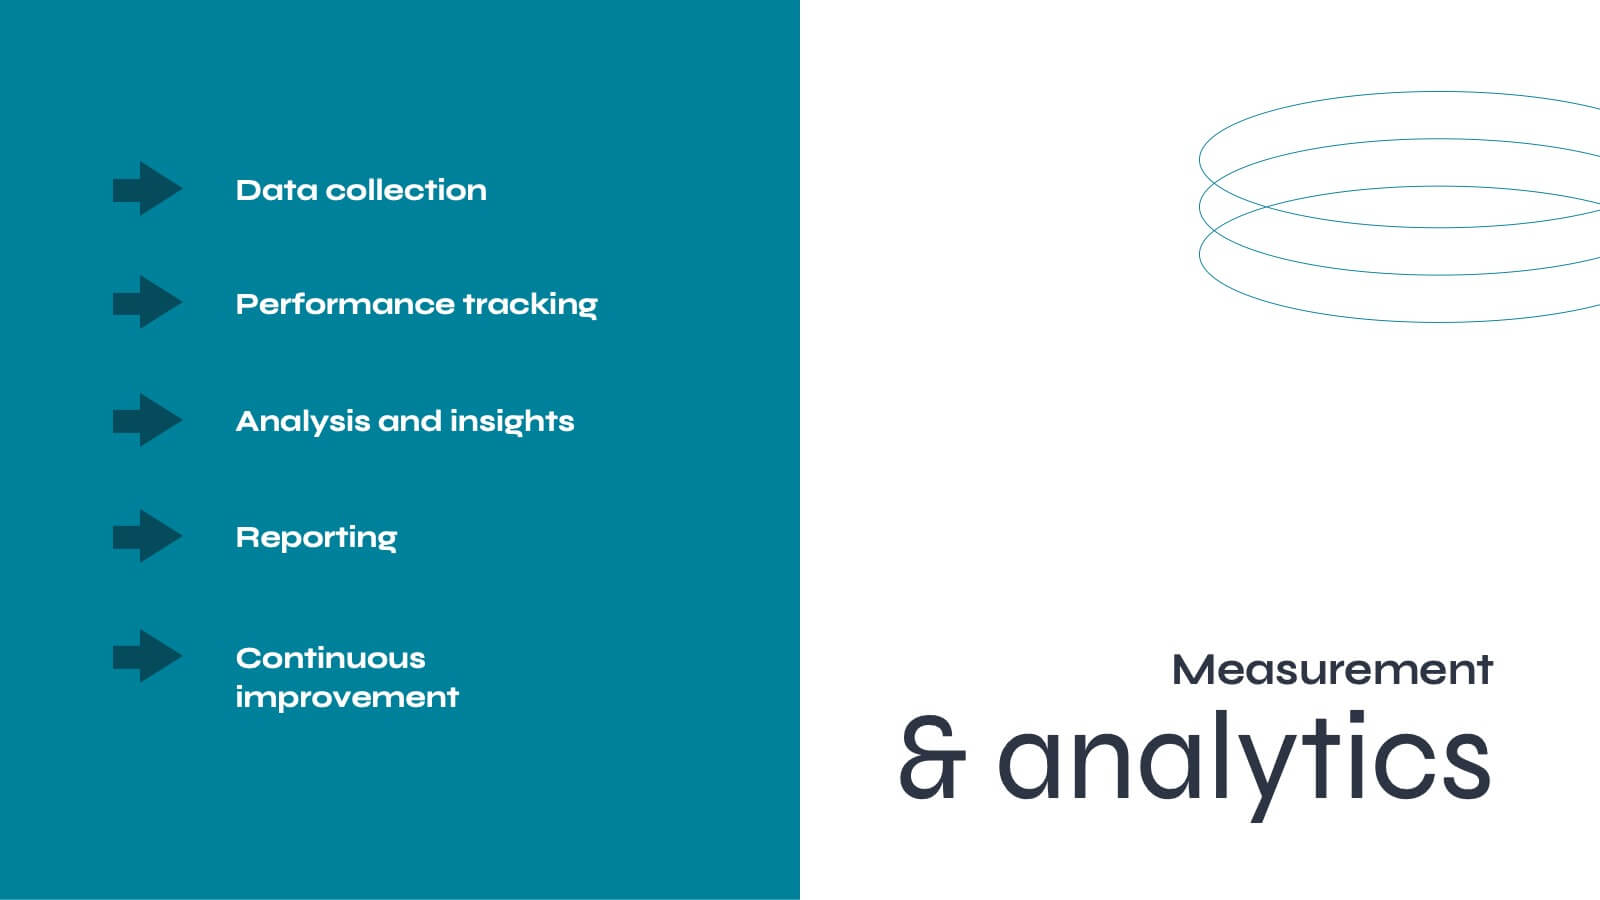
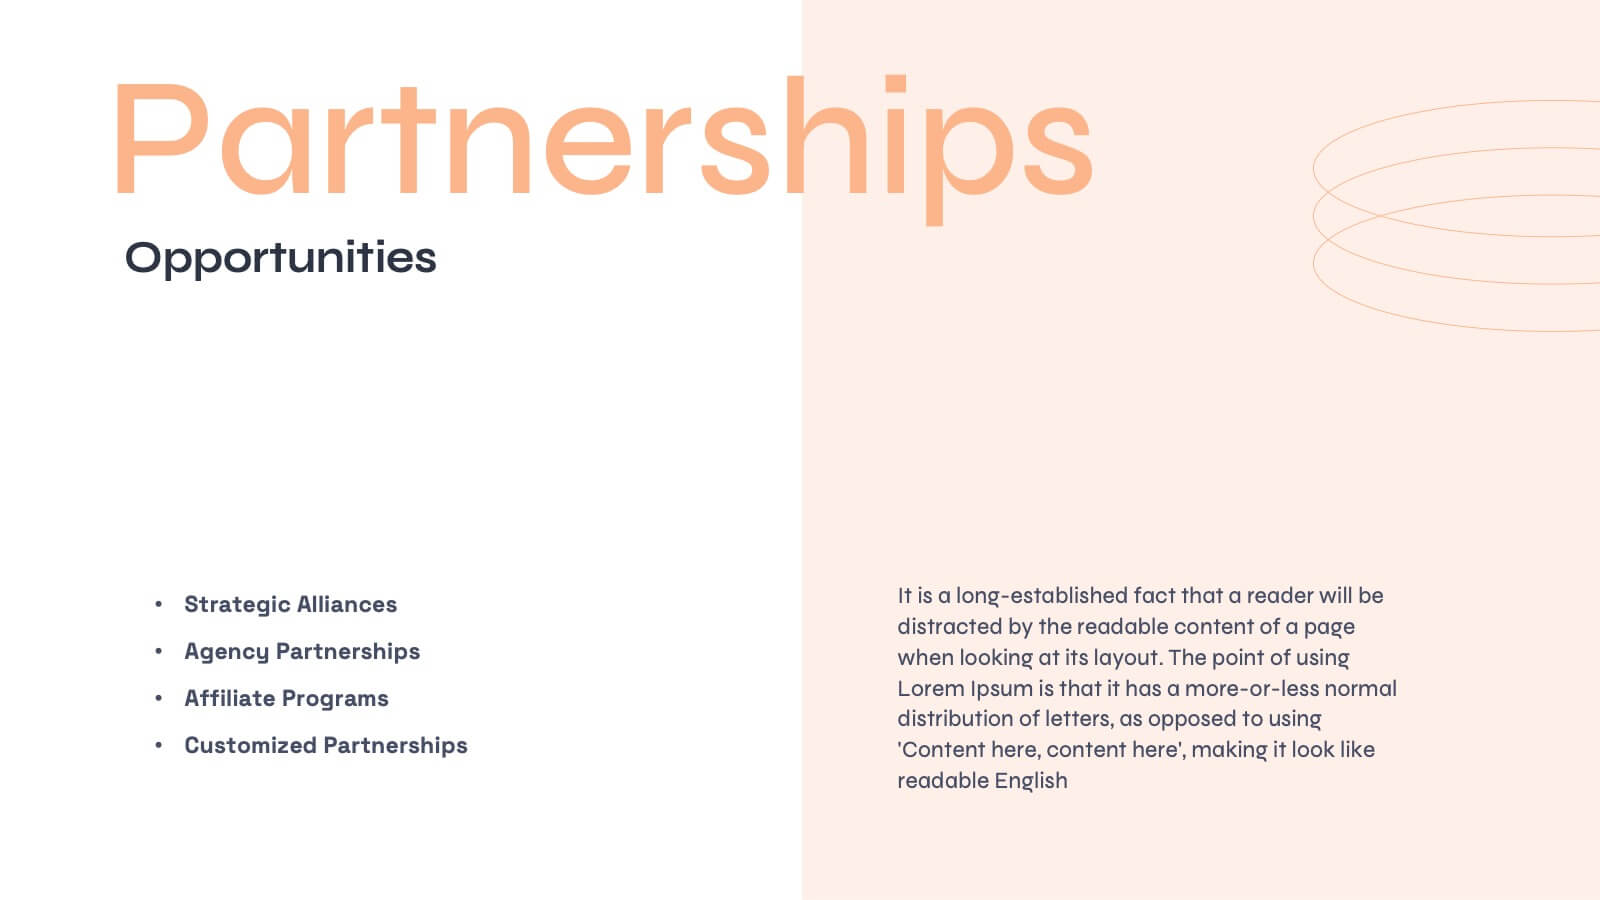
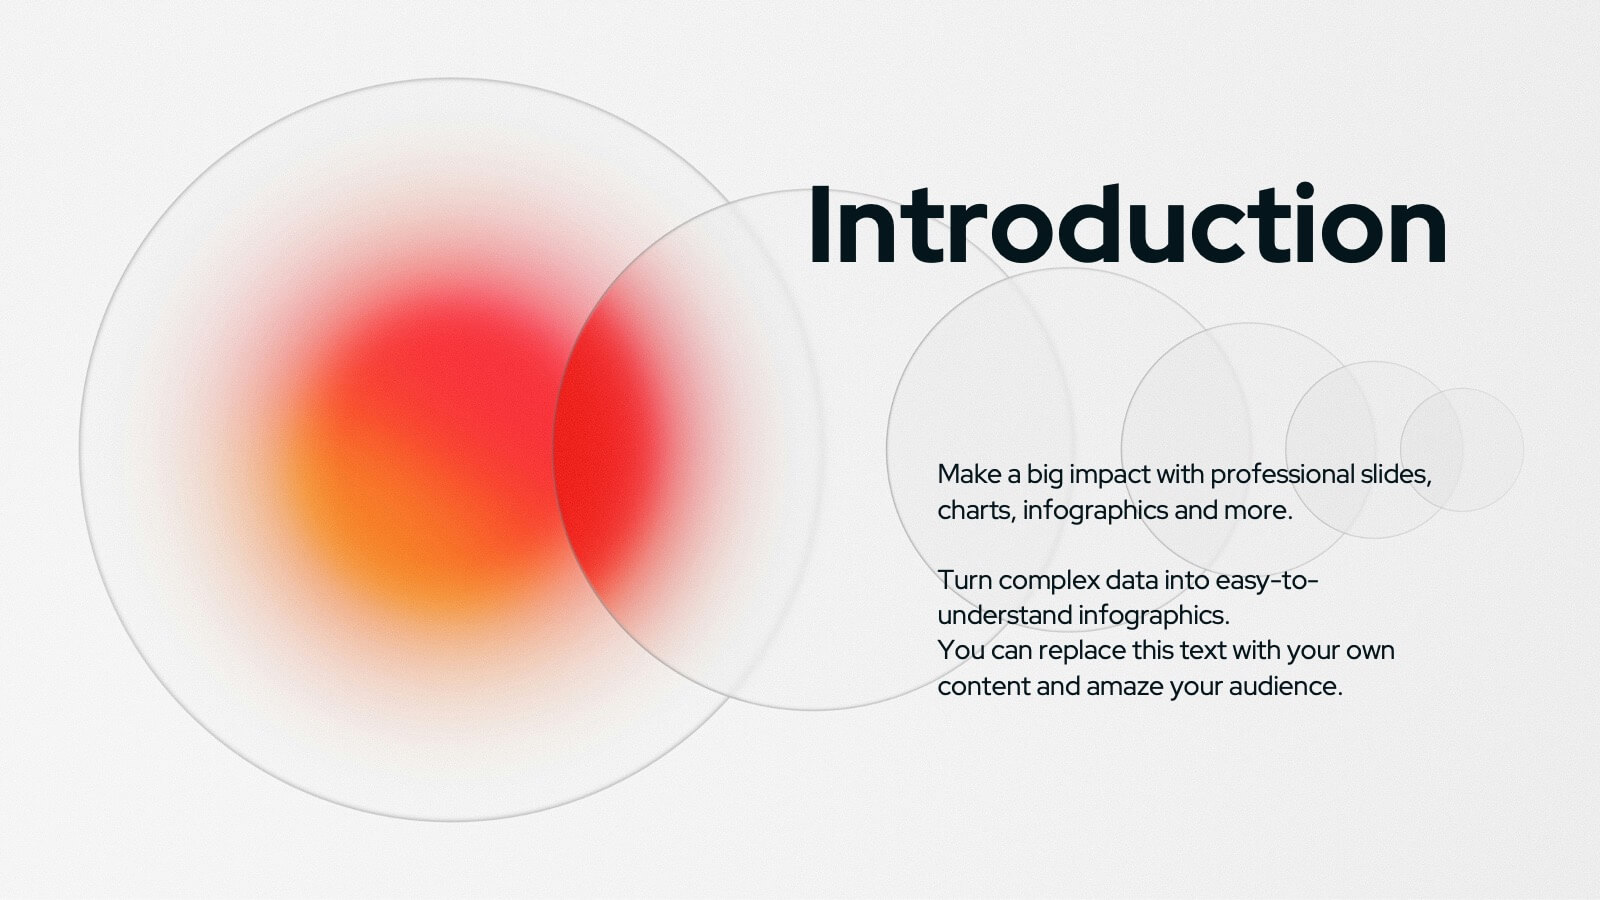
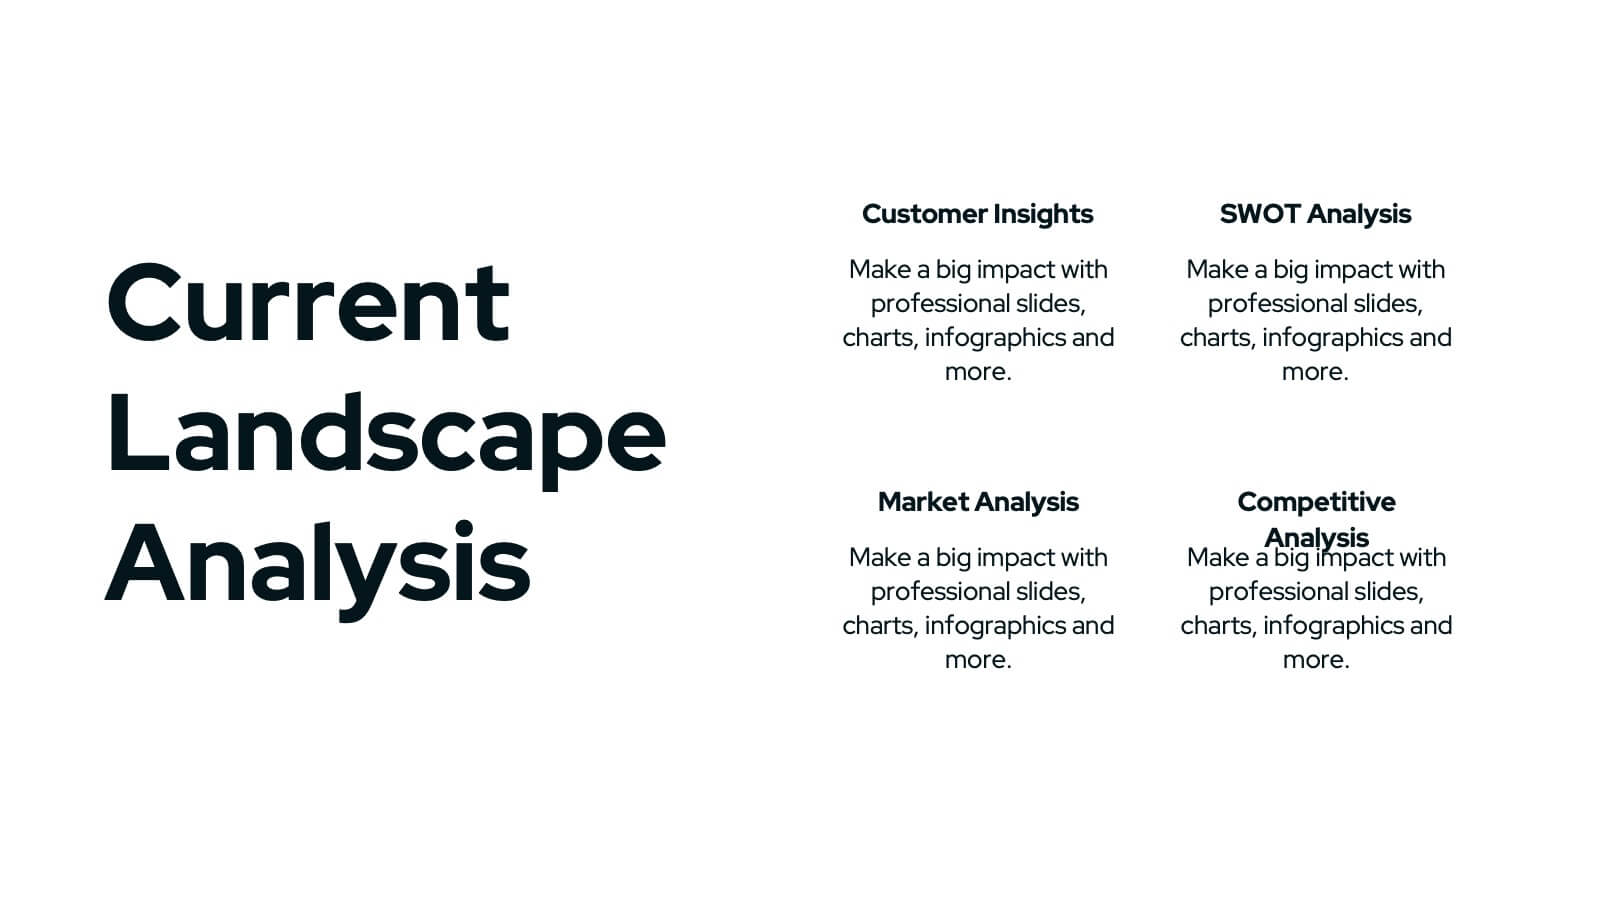
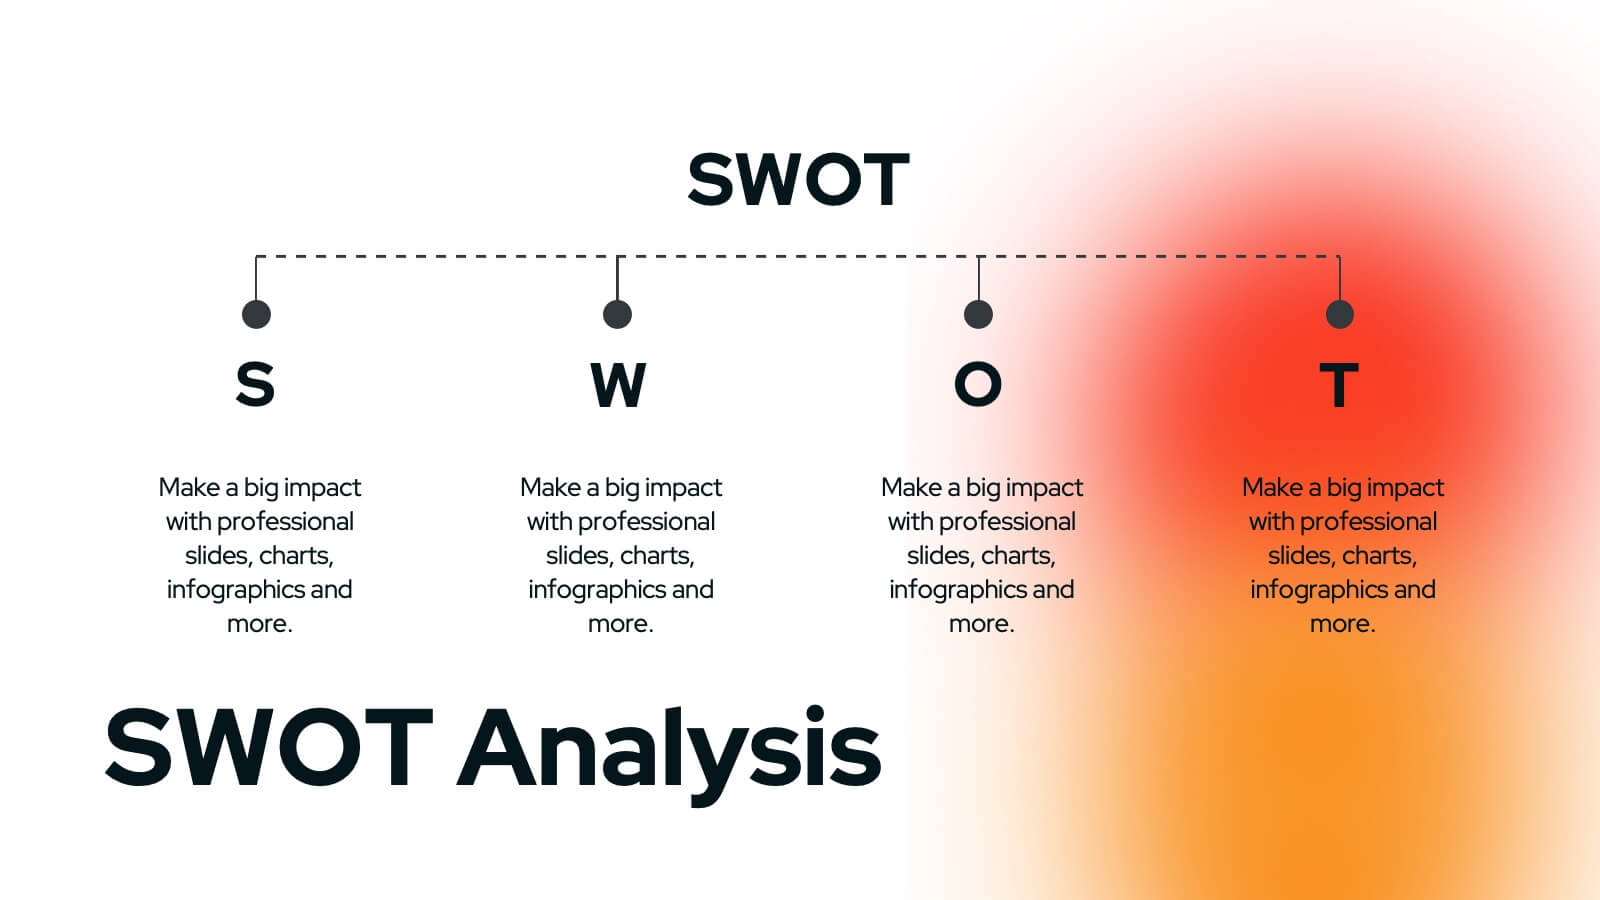
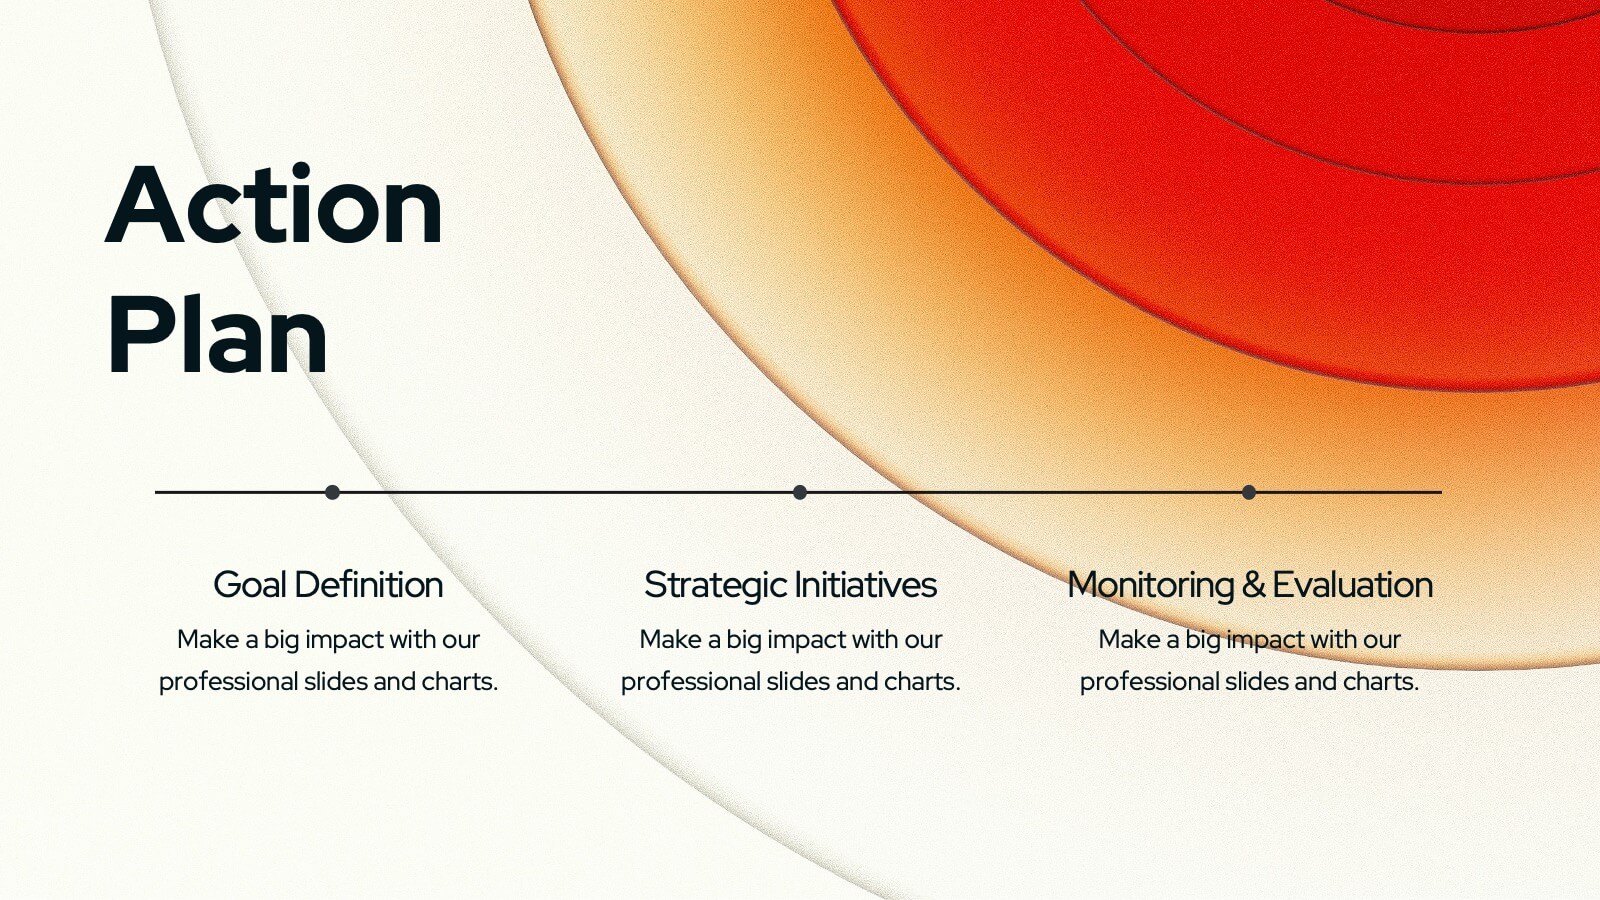
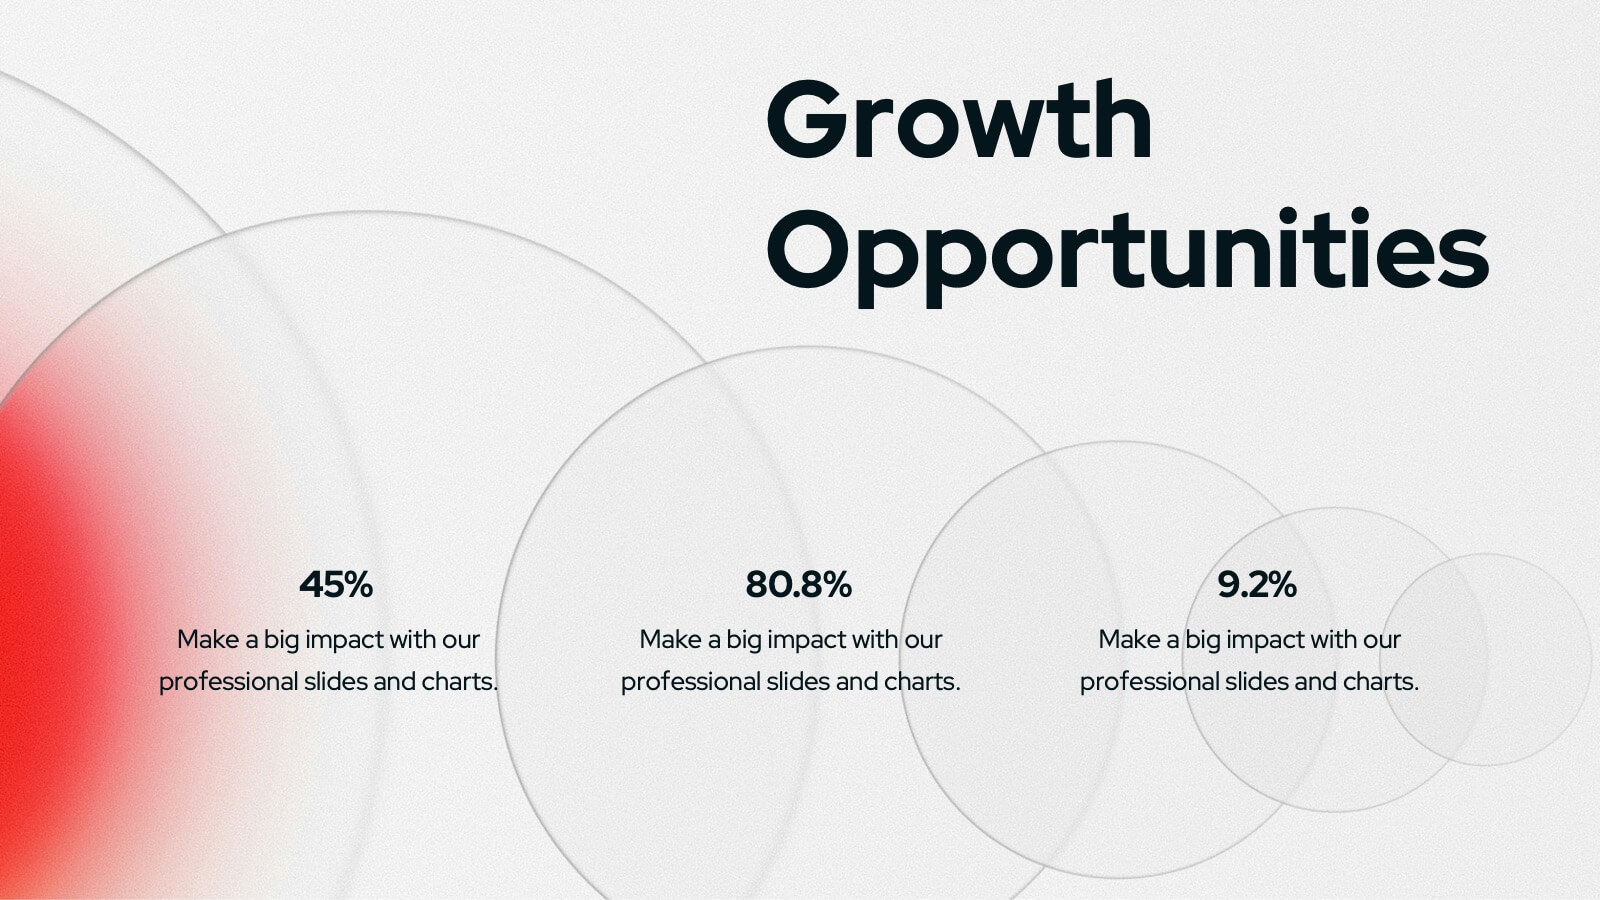
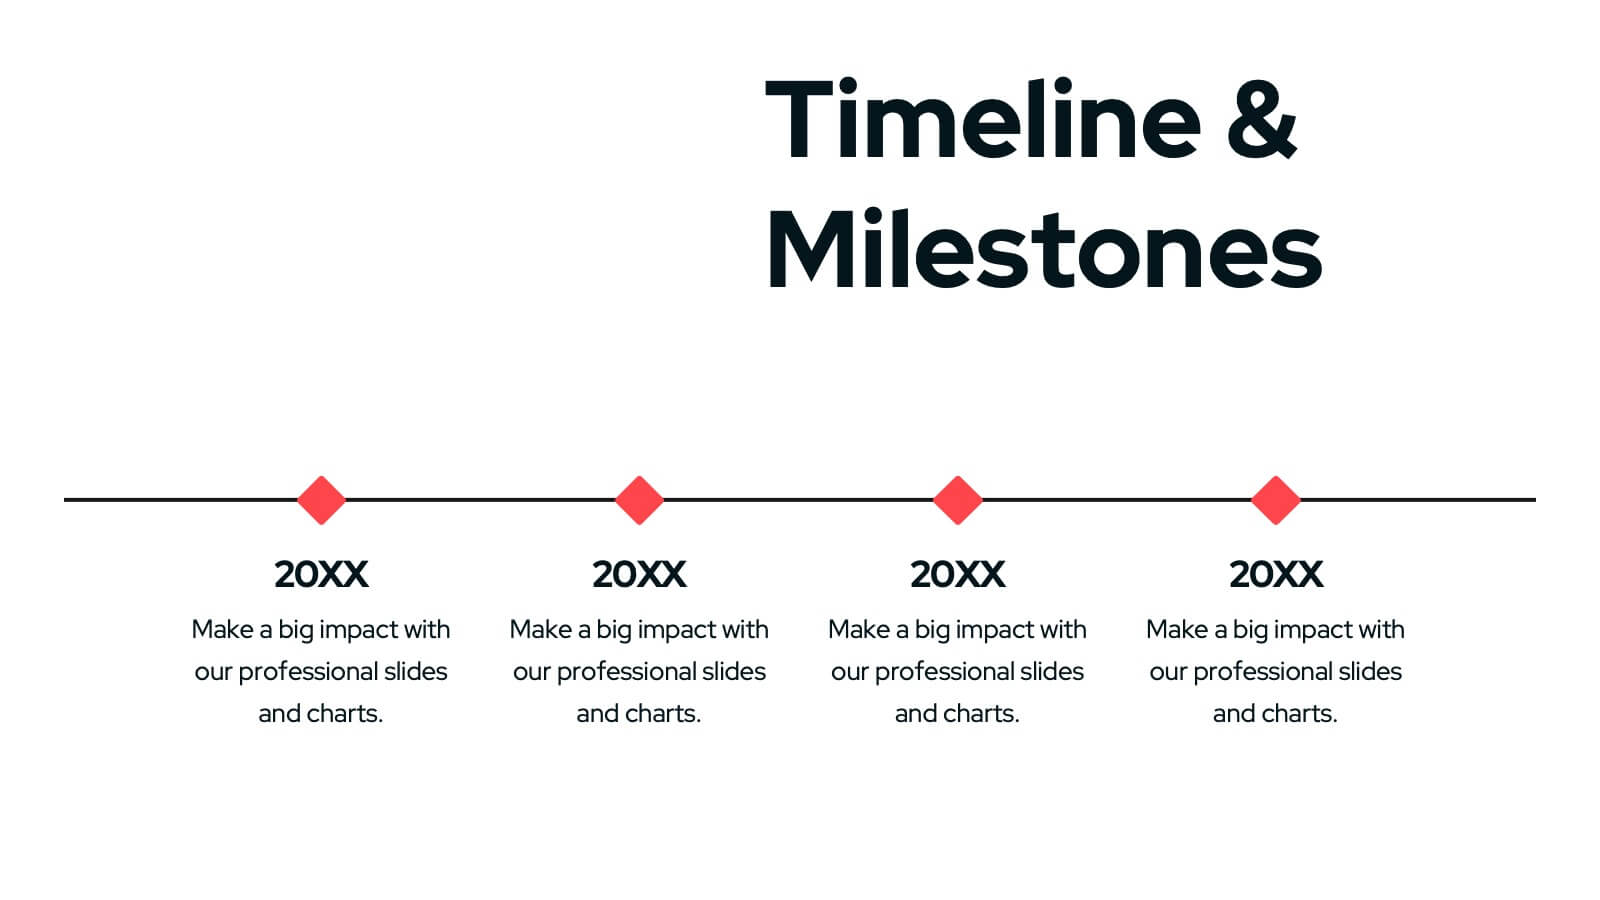
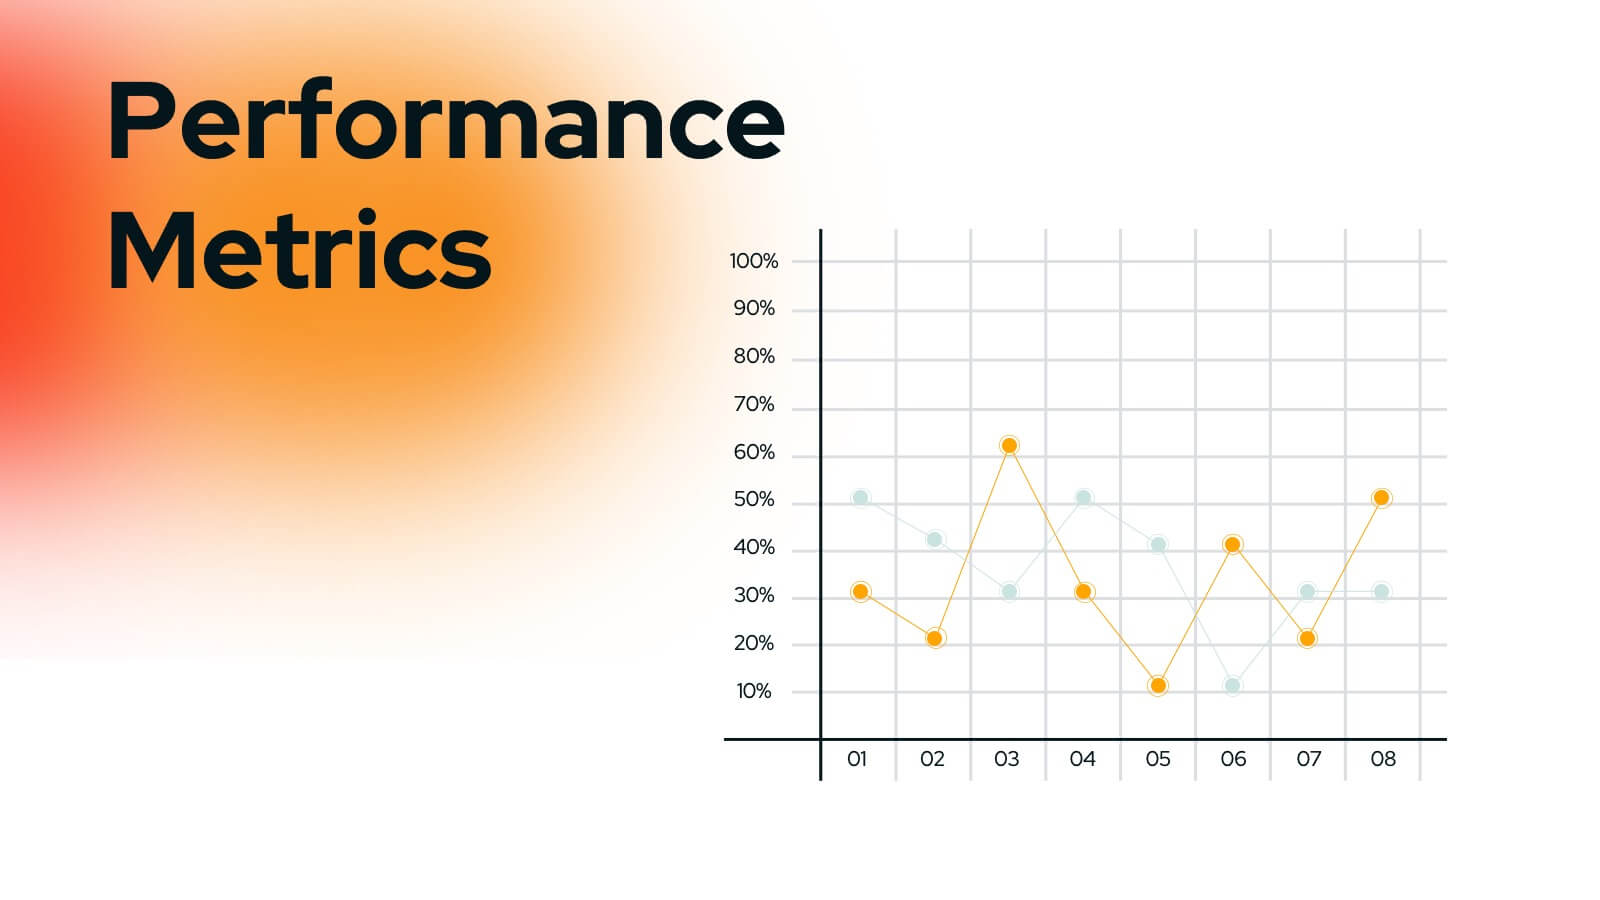
Wyrm Marketing Strategy Plan Presentation
Unleash the power of your marketing strategy with this bold and dynamic presentation template! Perfect for covering everything from landscape analysis and target audience identification to performance metrics and risk management. This template helps guide your audience through key challenges, SWOT analysis, and strategic initiatives with clarity and impact. Compatible with PowerPoint, Keynote, and Google Slides for effortless and engaging presentations.


5 diapositivas
SaaS Pricing Model
Present your pricing plans with confidence using this clear and structured SaaS pricing model template. Perfect for showcasing tiered options like Free, Basic, Medium, and Premium, this design makes feature comparisons easy for your audience to grasp. Fully compatible with PowerPoint, Keynote, and Google Slides for effortless editing and presentation.