


Características


¿Tienes alguna pregunta?
Recomendar


6 diapositivas
Pillar Ideas Infographic
"Pillar ideas" usually refer to the fundamental principles, concepts, or key components that form the foundation of a particular topic, strategy, or framework. This infographic template outlines and explains the core pillars or key principles of a particular topic, concept, or strategy. These pillars are essential for understanding and implementing the core aspects of that subject. The pillars included in the infographic provide structure and a clear understanding of the foundational elements that contribute to the success and effectiveness of various endeavors. This template is compatible with Powerpoint, Keynote, and Google Slides.


4 diapositivas
Business Role Structure Diagram Presentation
Bring your team structure to life with a clear, engaging visual that makes every role instantly understandable. This presentation helps you map relationships, outline responsibilities, and communicate workflow with ease. Designed for simple customization and professional clarity, it supports PowerPoint, Keynote, and Google Slides for seamless editing across platforms.


4 diapositivas
Identifying Performance Gaps
Clearly showcase the steps needed to bridge critical performance gaps with this modern template. Ideal for strategic planning, business reviews, and goal-setting sessions. Highlight each stage of growth with dynamic visuals. Fully customizable for PowerPoint, Keynote, and Google Slides.


5 diapositivas
Next-Gen Networks and 5G Infrastructure Presentation
Build the future, one signal at a time. This engaging infographic presentation visually tracks the evolution of mobile network infrastructure, using a clean timeline layout with colorful tower icons and milestone markers. Perfect for tech educators, analysts, or engineers. Fully compatible with PowerPoint, Keynote, and Google Slides for seamless editing.


6 diapositivas
Governance Tools Infographics
Enhance your understanding of Governance Tools with our customizable infographic template. This template is fully compatible with popular presentation software like PowerPoint, Keynote, and Google Slides, allowing you to easily customize it to illustrate and communicate various governance tools and practices. The Governance Tools infographic template offers a visually engaging platform to explore and explain the tools, frameworks, and strategies used to facilitate effective governance within organizations. Whether you're a governance professional, business leader, or interested in corporate governance, this template provides a user-friendly canvas to create informative presentations and educational materials. Deepen your knowledge of Governance Tools with this SEO-optimized infographic template, thoughtfully designed for clarity and ease of use. Customize it to showcase governance frameworks, compliance mechanisms, risk management tools, and best practices, ensuring that your audience gains valuable insights into this critical field. Start crafting your personalized infographic today to delve into the world of Governance Tools.


4 diapositivas
Butterfly Graph for Diverging Metrics Presentation
Easily compare opposing values with the Butterfly Graph for Diverging Metrics Presentation. Ideal for visualizing split opinions, pros vs. cons, or pre- and post-metrics across multiple categories. The clean, mirrored layout helps audiences grasp key differences at a glance. Compatible with PowerPoint, Google Slides, Canva, and Keynote.


4 diapositivas
Regional Economic Evolution in Asia Map Presentation
Track economic progress across Asia with this regional growth map. Each country is paired with a progress bar for visual comparison of growth indicators. Ideal for data-driven insights, economic reviews, or development updates. Editable in PowerPoint, Keynote, and Google Slides for seamless customization and professional, geography-based presentations.


7 diapositivas
Buyer Infographic
Discover the power of visual storytelling with our dynamic Infographic Template, designed to bring the buyer's journey to life in full color and engaging detail! Each slide is a palette of opportunity, with bold hues and intuitive layouts that transform standard data into a compelling narrative. This template is a marketer’s dream, perfect for delineating complex buyer behaviors, demographics, and decision processes in an easily digestible format. It leverages striking graphics and concise text to illuminate key insights that drive consumer actions, making it indispensable for presentations, reports, or online content. Customize to your heart’s content, adjusting colors, fonts, and layouts to align perfectly with your branding. Whether you're detailing market trends, consumer feedback, or purchase patterns, this template ensures your data not only informs but also inspires. Ideal for strategists, sales teams, and marketers, it's your secret weapon in crafting stories that not only tell but also sell.


5 diapositivas
World History Infographic Presentation
Bring the past to life with this engaging World History Infographic presentation. Featuring a circular layout with 4 editable sections, this infographic allows you to highlight key events, historical milestones, or cultural movements. Ideal for educators, students, and history enthusiasts, it’s designed for clarity, storytelling, and visual appeal. Fully compatible with PowerPoint, Keynote, and Google Slides – and easy to customize for any topic or timeline.


5 diapositivas
Agricultural Business Strategy
Showcase your farming goals and plans with this circular, step-based strategy slide. Perfect for presenting agricultural business models, market planning, or farm-to-market strategies. The layout uses clean icons and an engaging central farm illustration to enhance clarity. Fully editable in PowerPoint, Keynote, and Google Slides.


6 diapositivas
OKR Goal-Setting Framework Presentation
Achieve clarity and focus with the OKR Goal-Setting Framework. This structured layout helps visualize objectives and key results using hexagonal elements for a clear strategic overview. Perfect for business planning, performance tracking, and team alignment. Fully editable and compatible with PowerPoint, Keynote, and Google Slides for effortless customization.


20 diapositivas
Solar Beam Sales Proposal Presentation
Supercharge your sales presentation with the Solar Beam Sales Proposal template! This vibrant and dynamic template is designed to capture attention and drive home your key points with flair. Start with a bold introduction, then seamlessly guide your audience through your company overview, product/service details, and target market analysis. Highlight your sales objectives, showcase your team, and provide compelling customer testimonials. With dedicated slides for pricing strategies, sales collateral, and performance metrics, you’ll have all the tools you need to make a persuasive pitch. The template also includes sections for discussing future opportunities, action plans, and a Q&A session to address any final questions. Its modern, professional design ensures that your proposal stands out in any setting. Fully customizable and compatible with PowerPoint, Keynote, and Google Slides, this template is your go-to for creating impactful sales presentations that leave a lasting impression.


3 diapositivas
Governance and Compliance Framework Presentation
Strengthen your organization's structure with our Governance and Compliance Framework template. This visually compelling template is crafted to effectively communicate the integration of governance, compliance, and risk management. It is ideal for demonstrating how these elements collaborate to uphold regulatory standards and manage business risks. Fully compatible with PowerPoint, Keynote, and Google Slides, it's an essential tool for any corporate governance presentation aimed at promoting effective, compliant business practices.


23 diapositivas
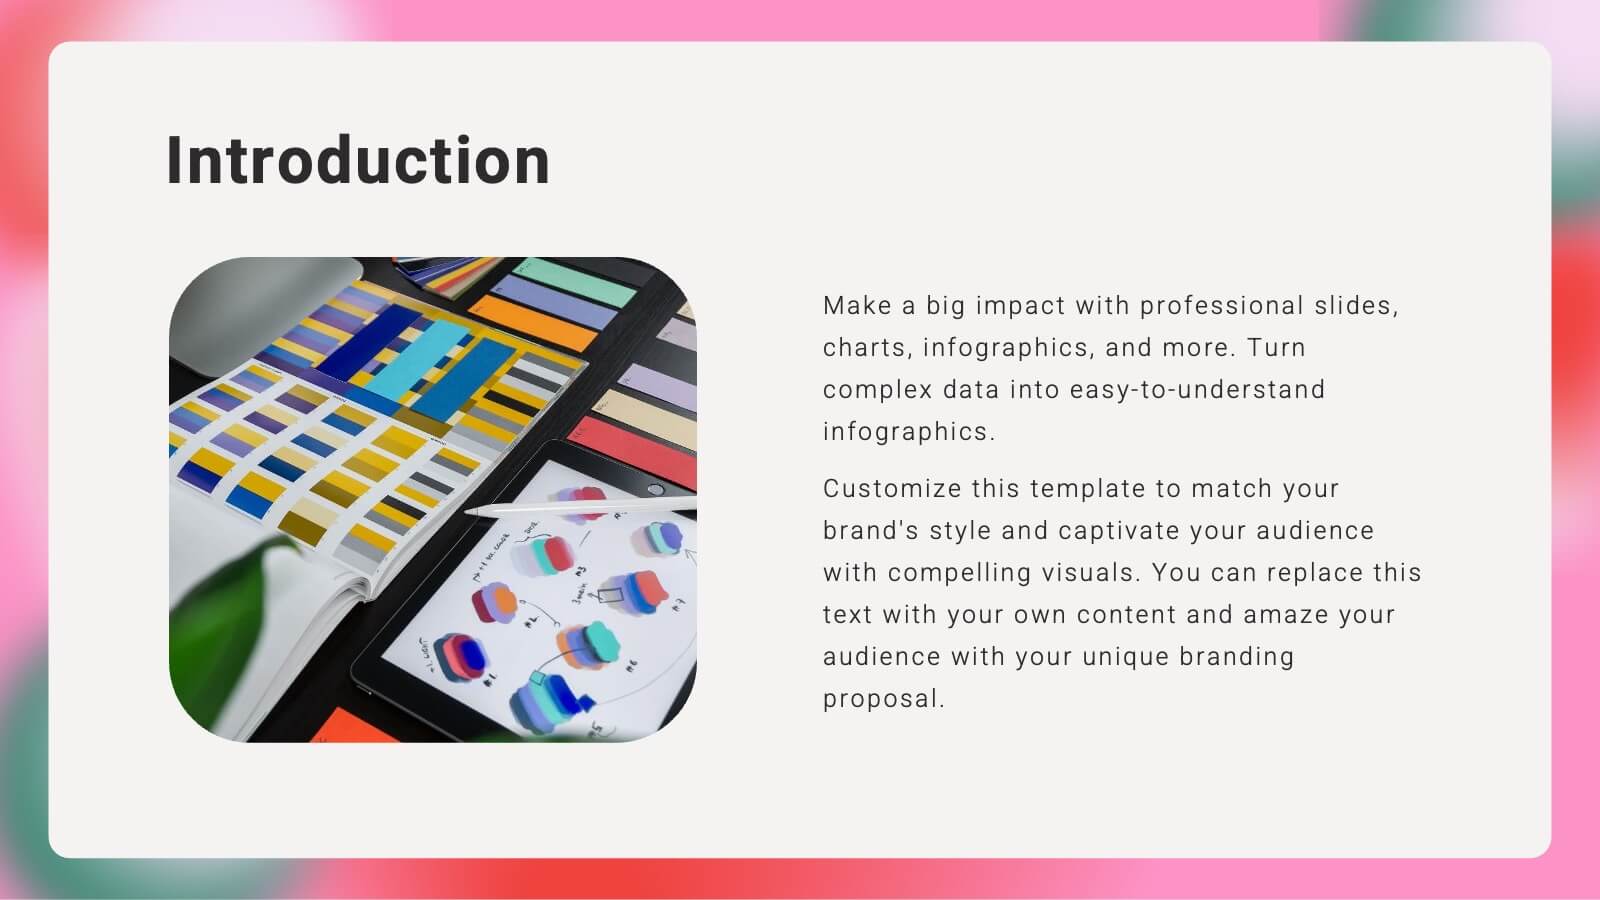
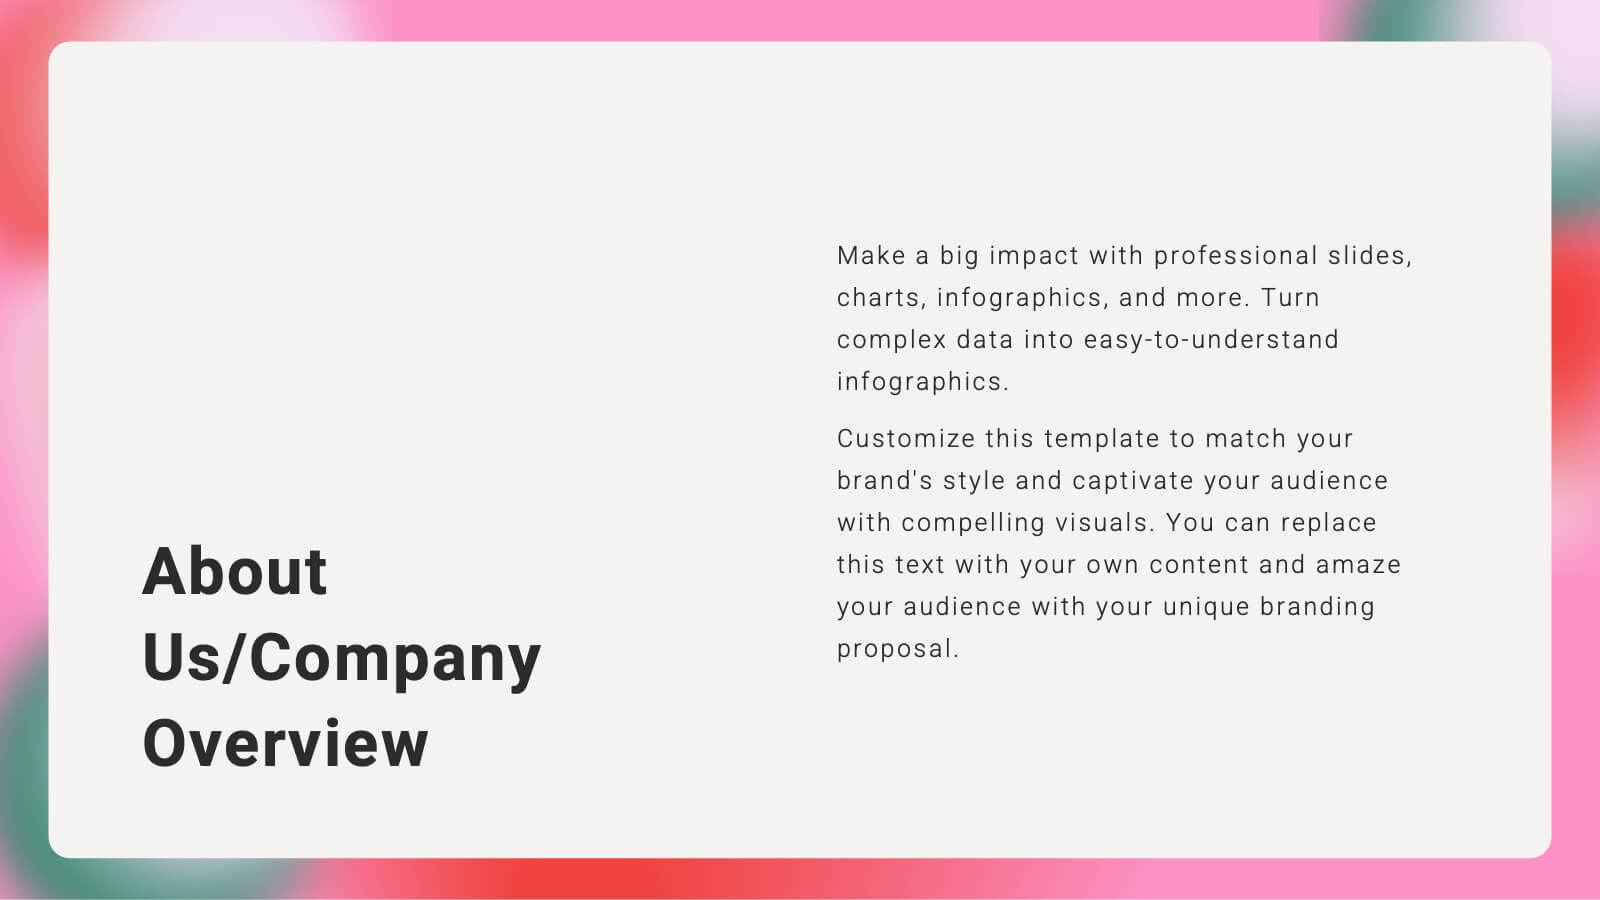
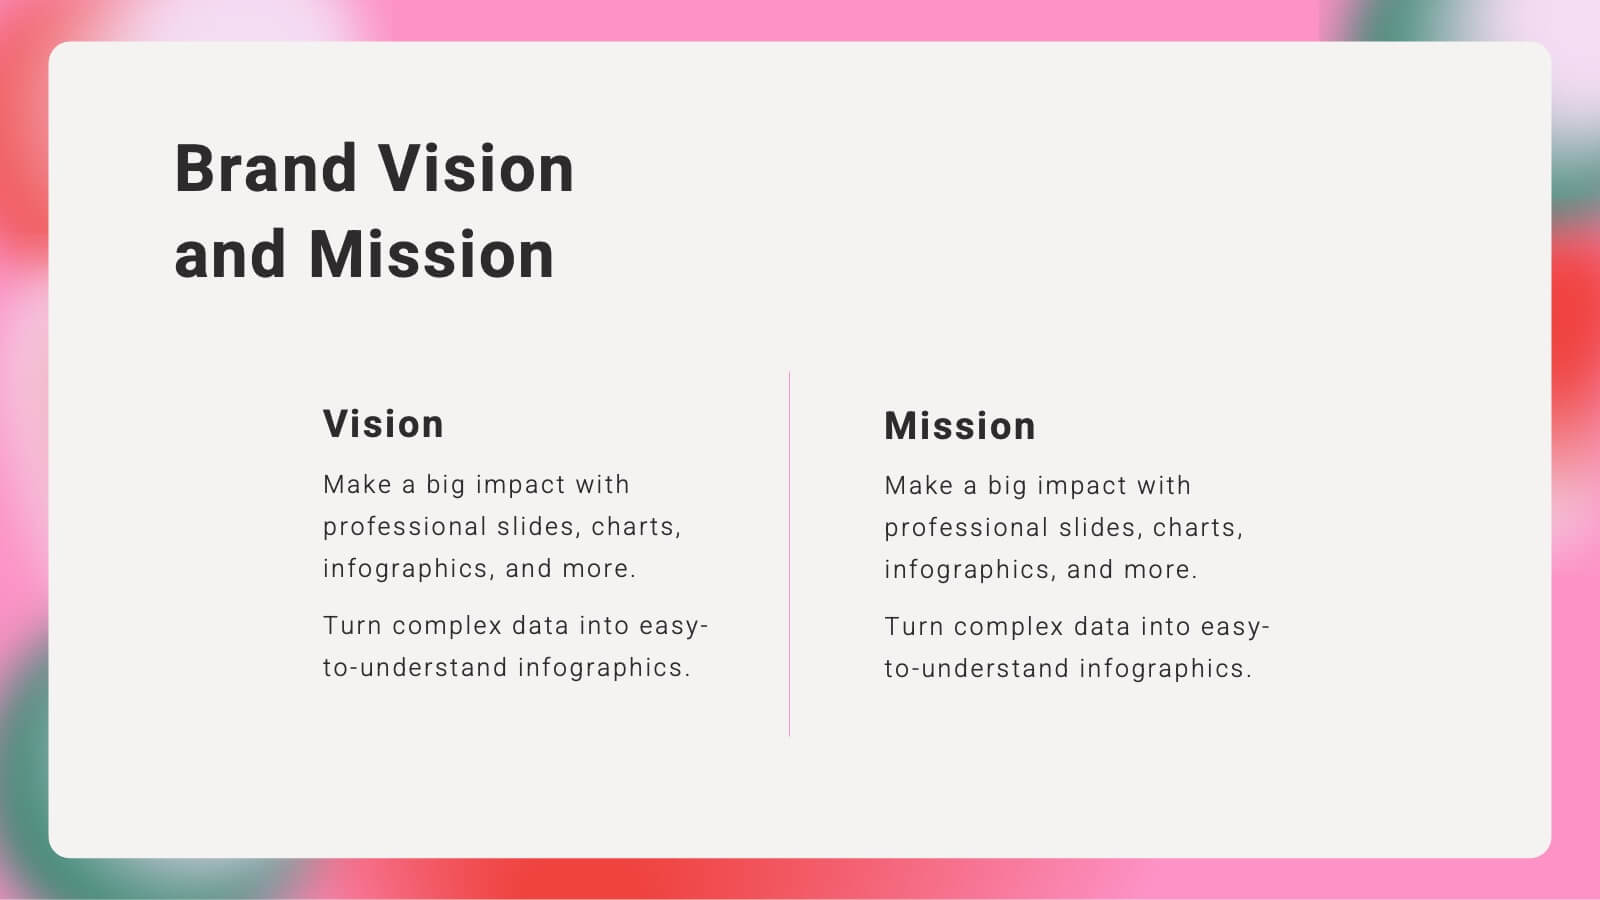
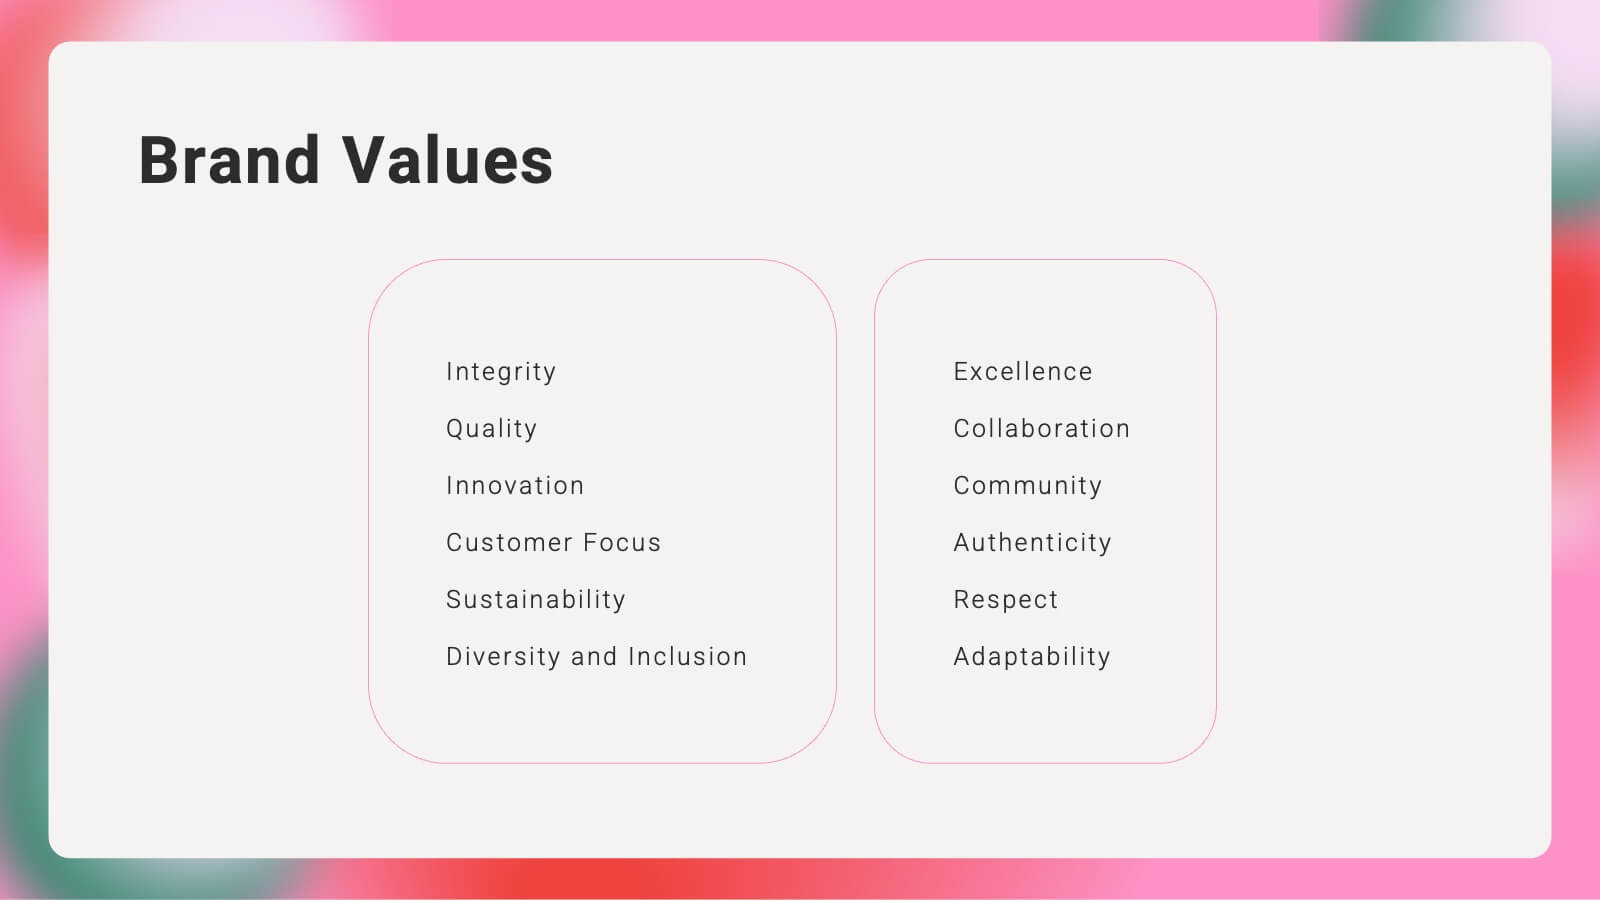
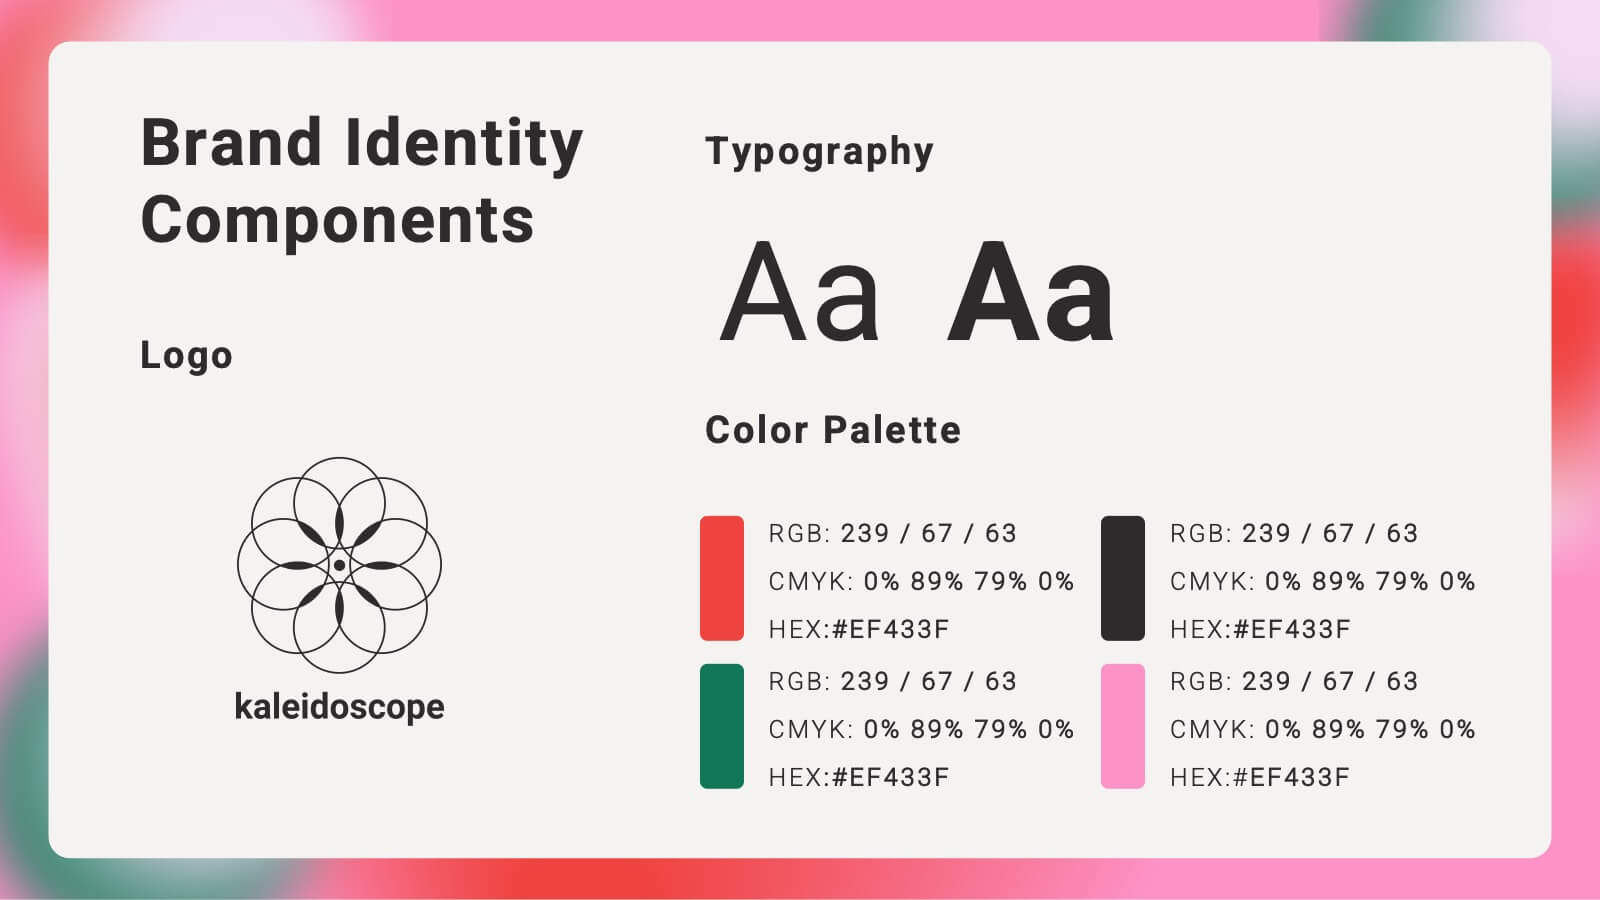
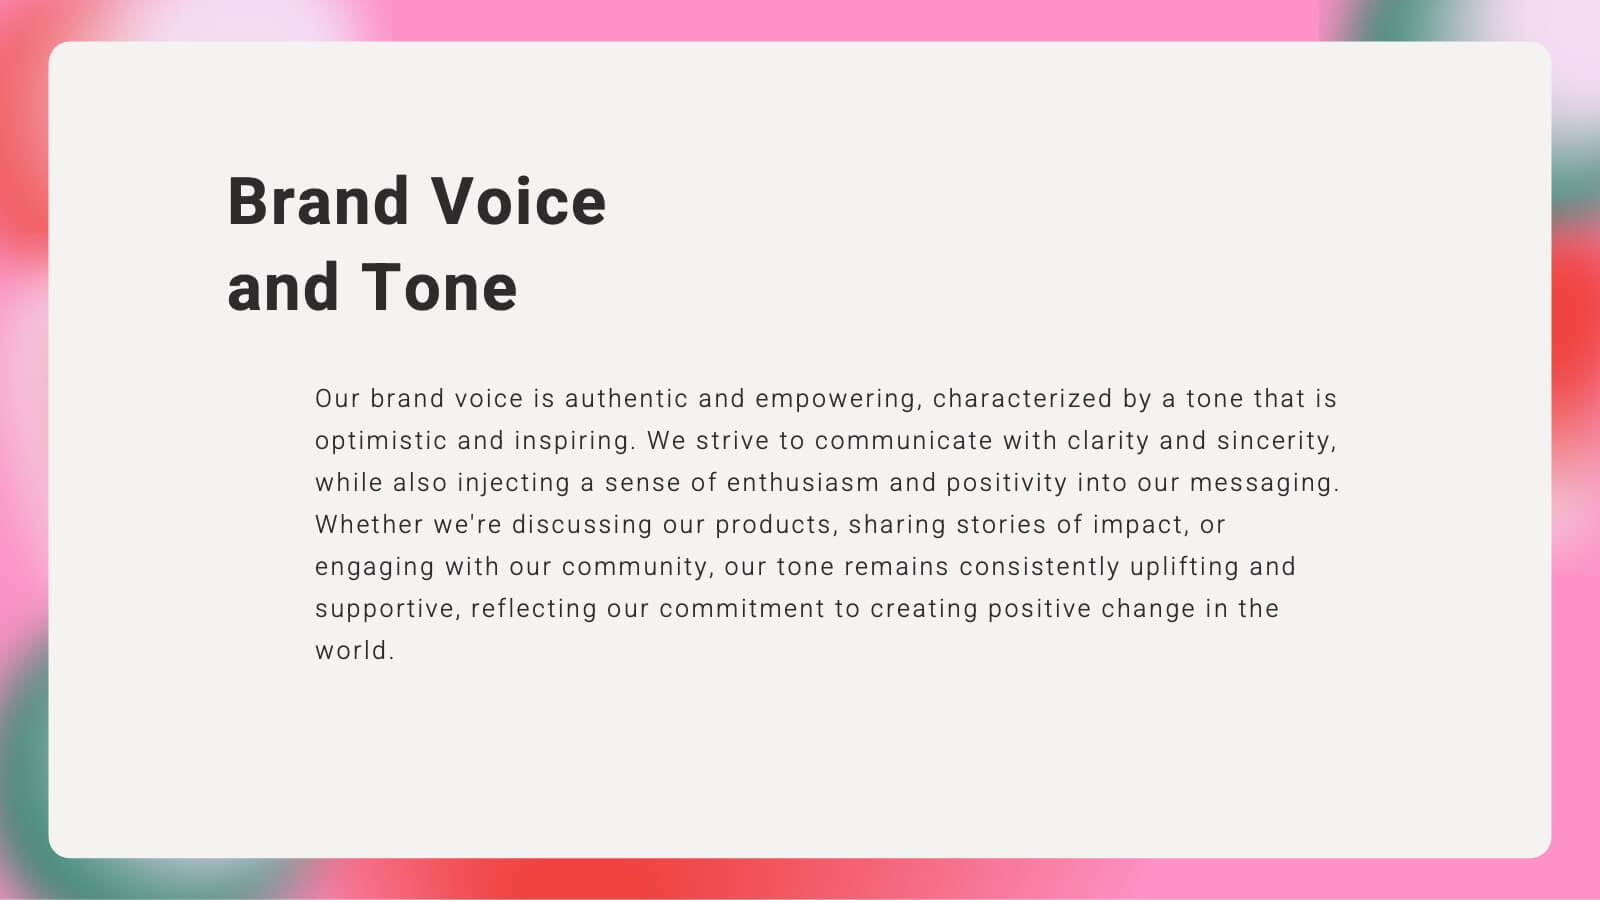
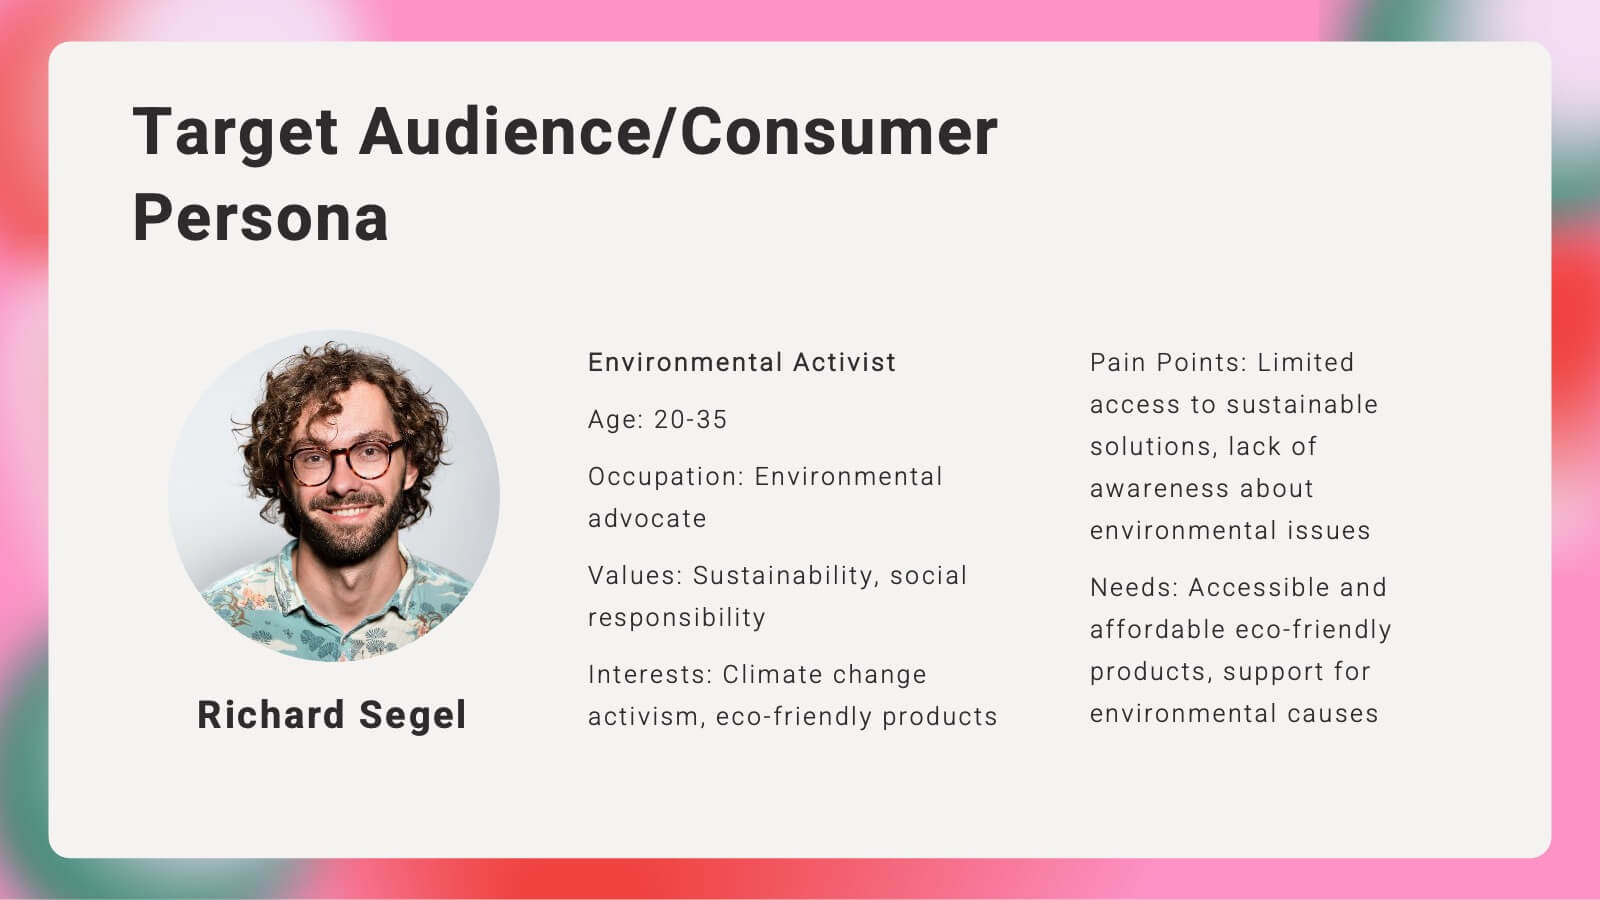
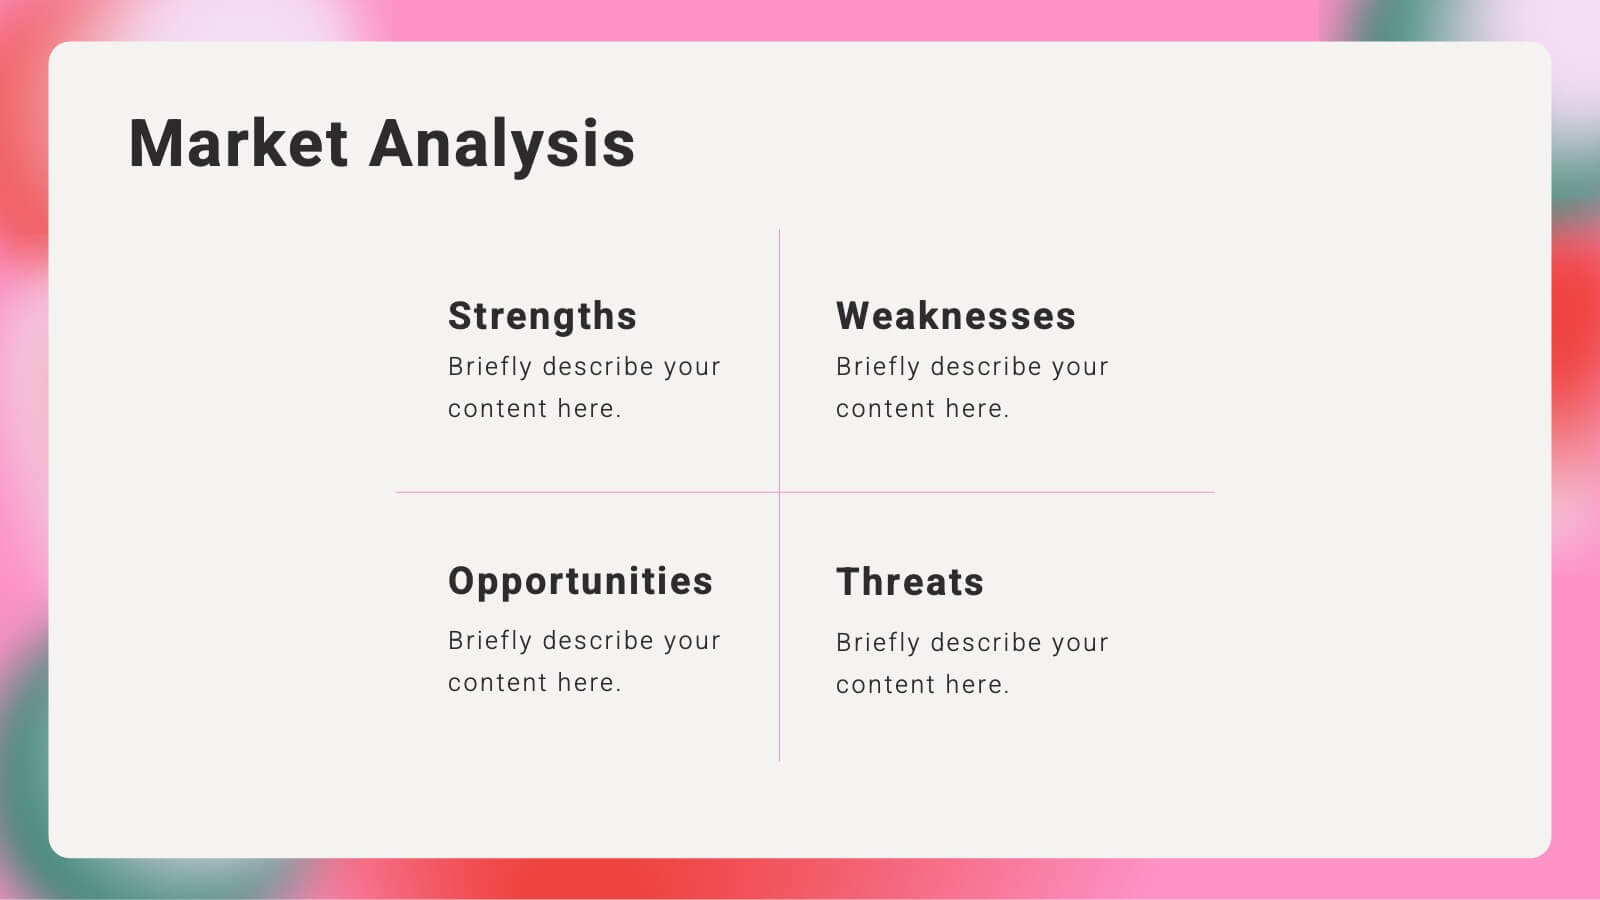
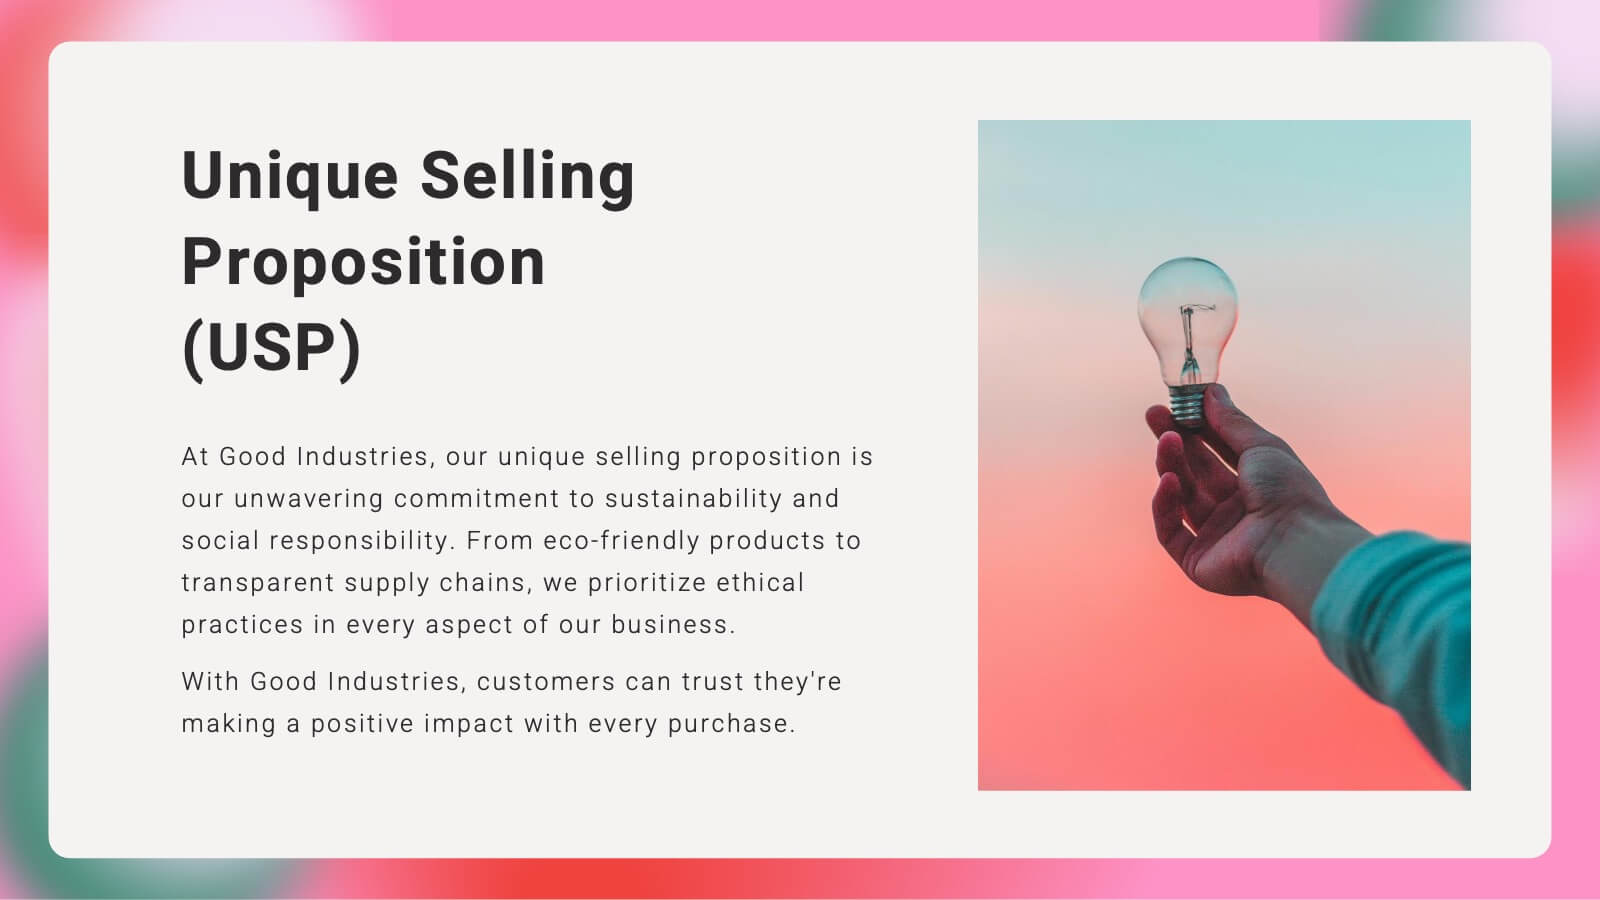
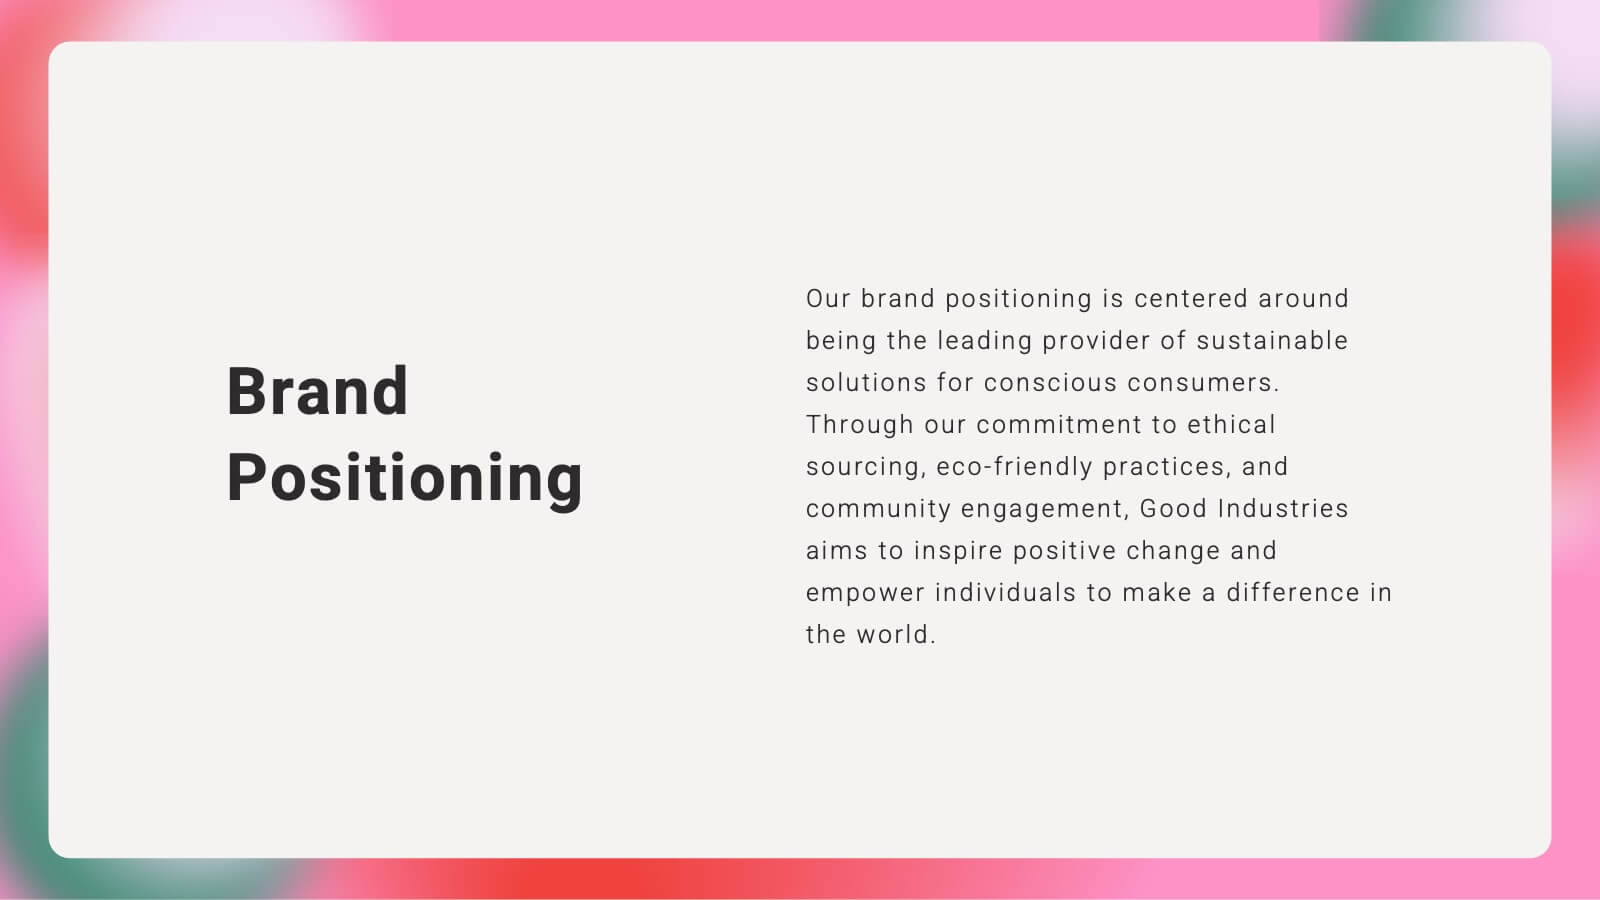
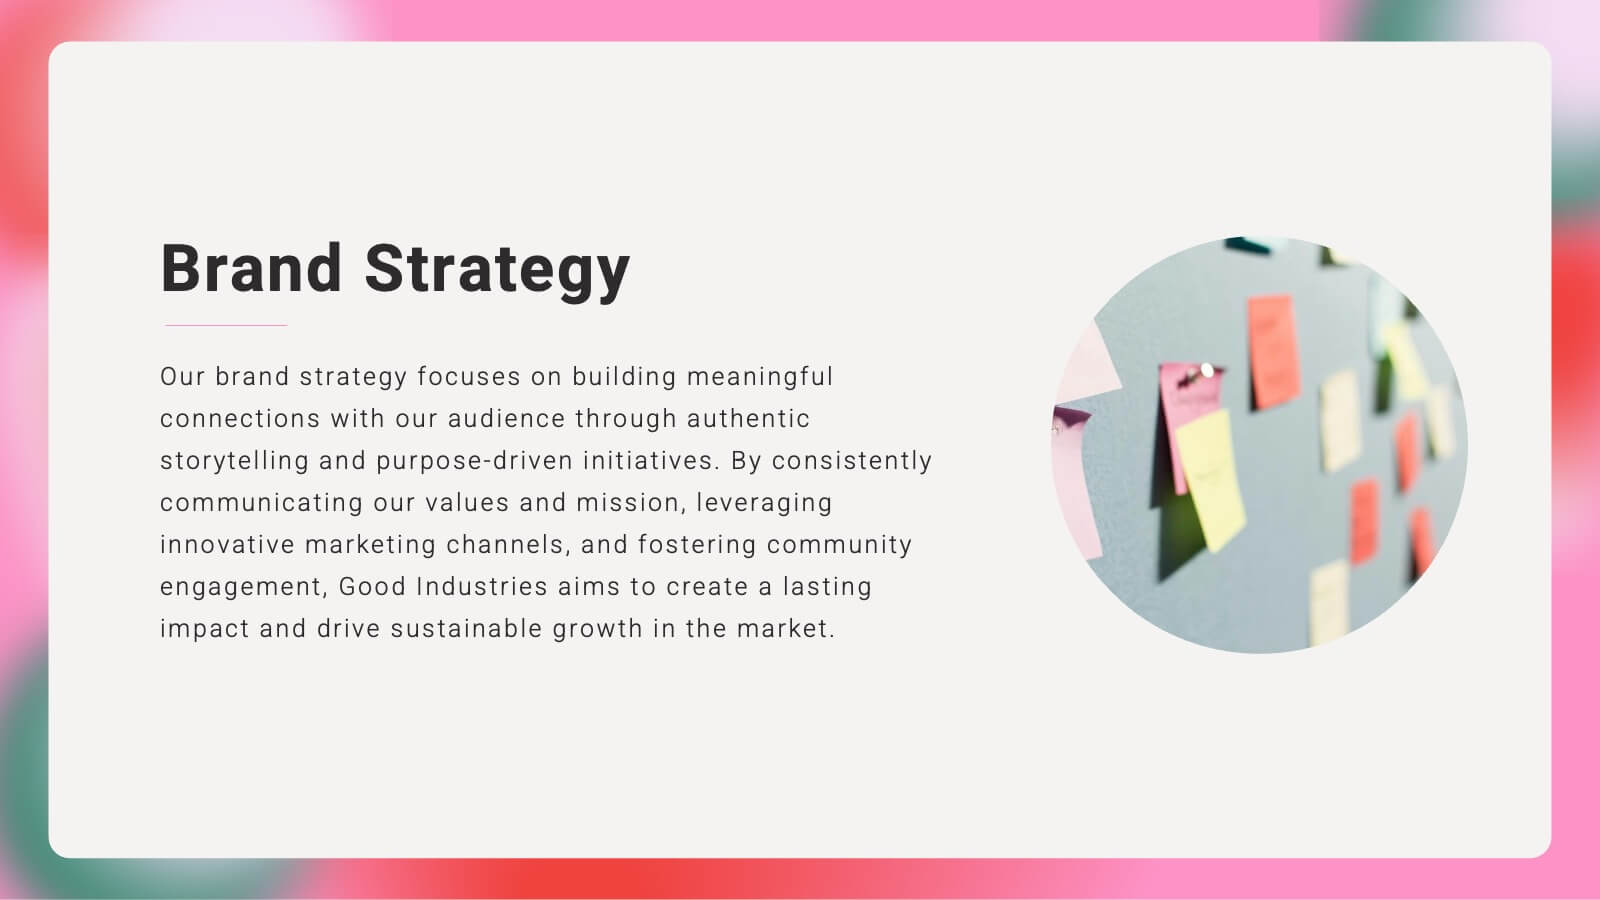
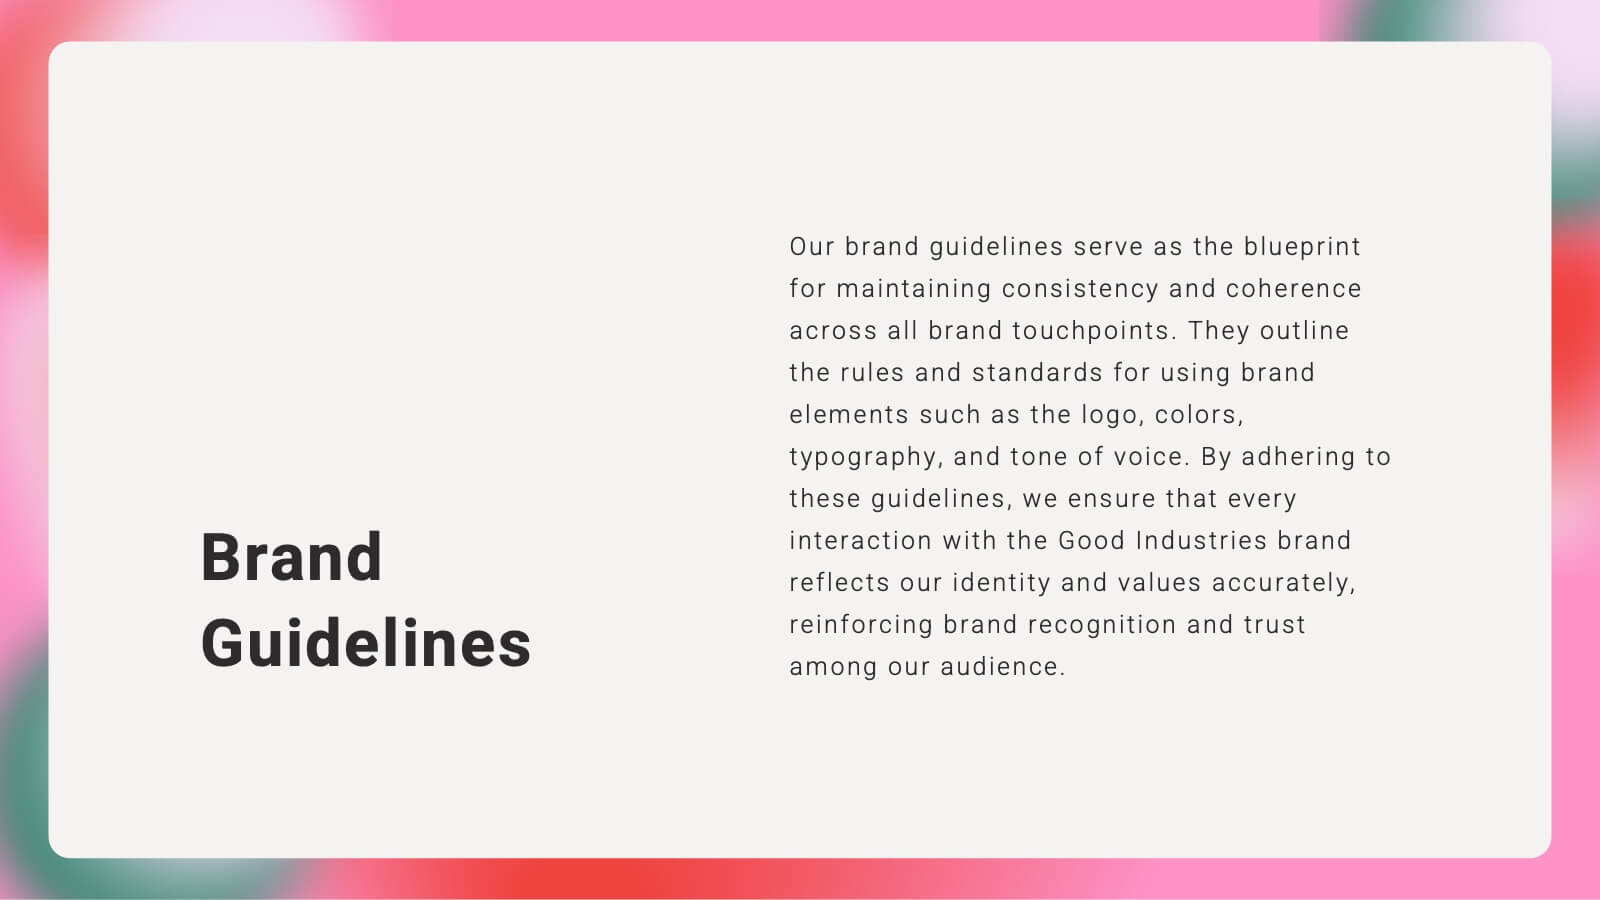
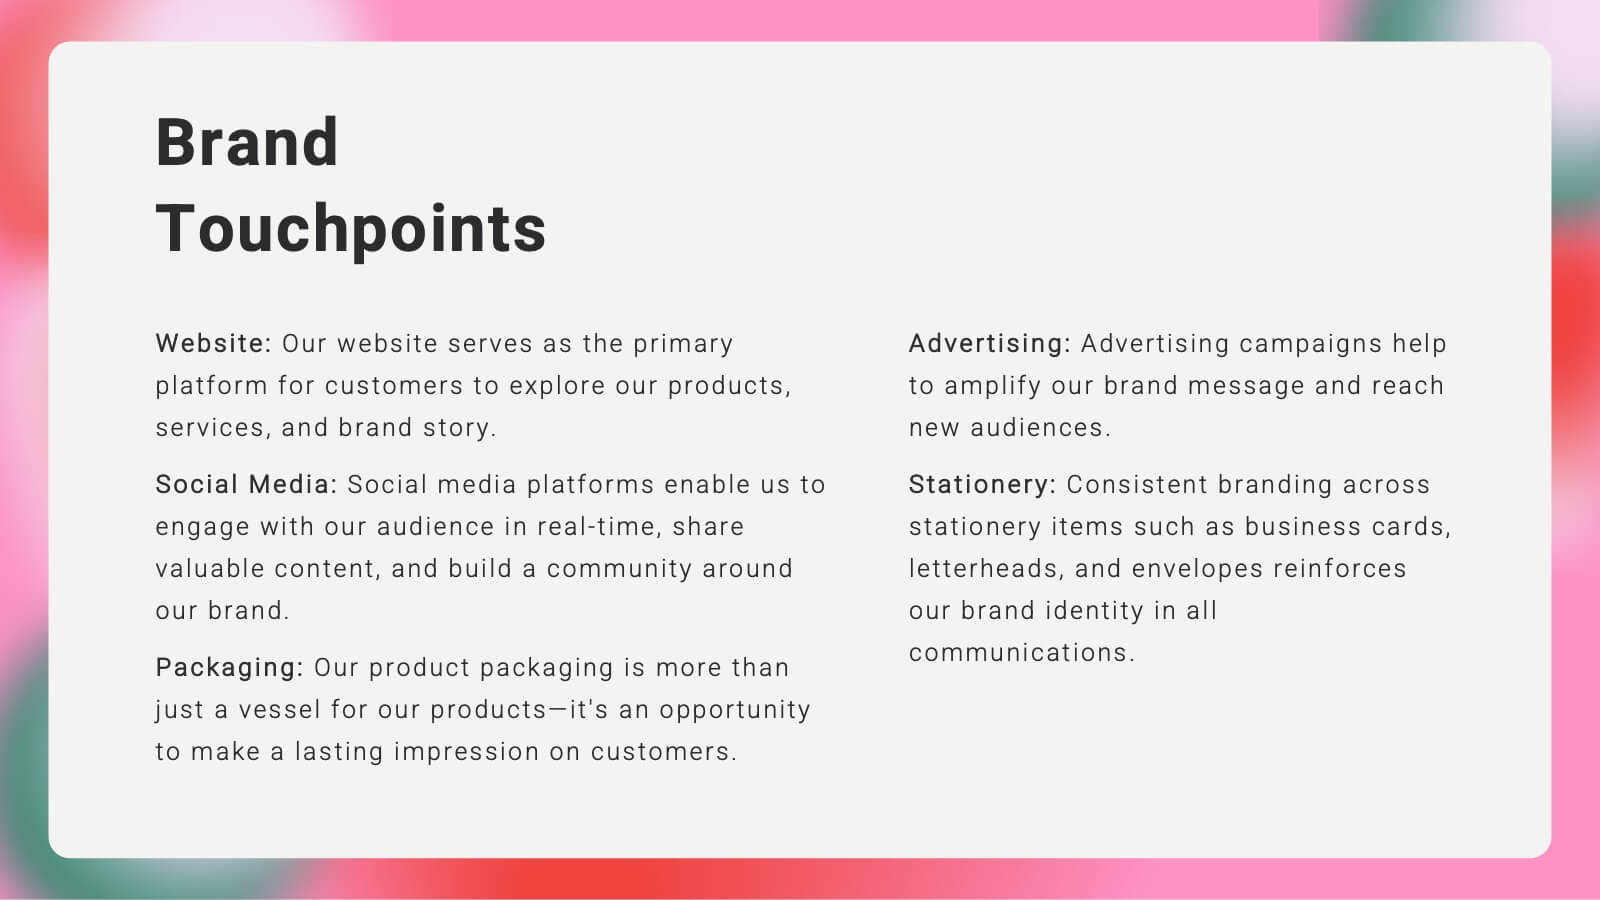
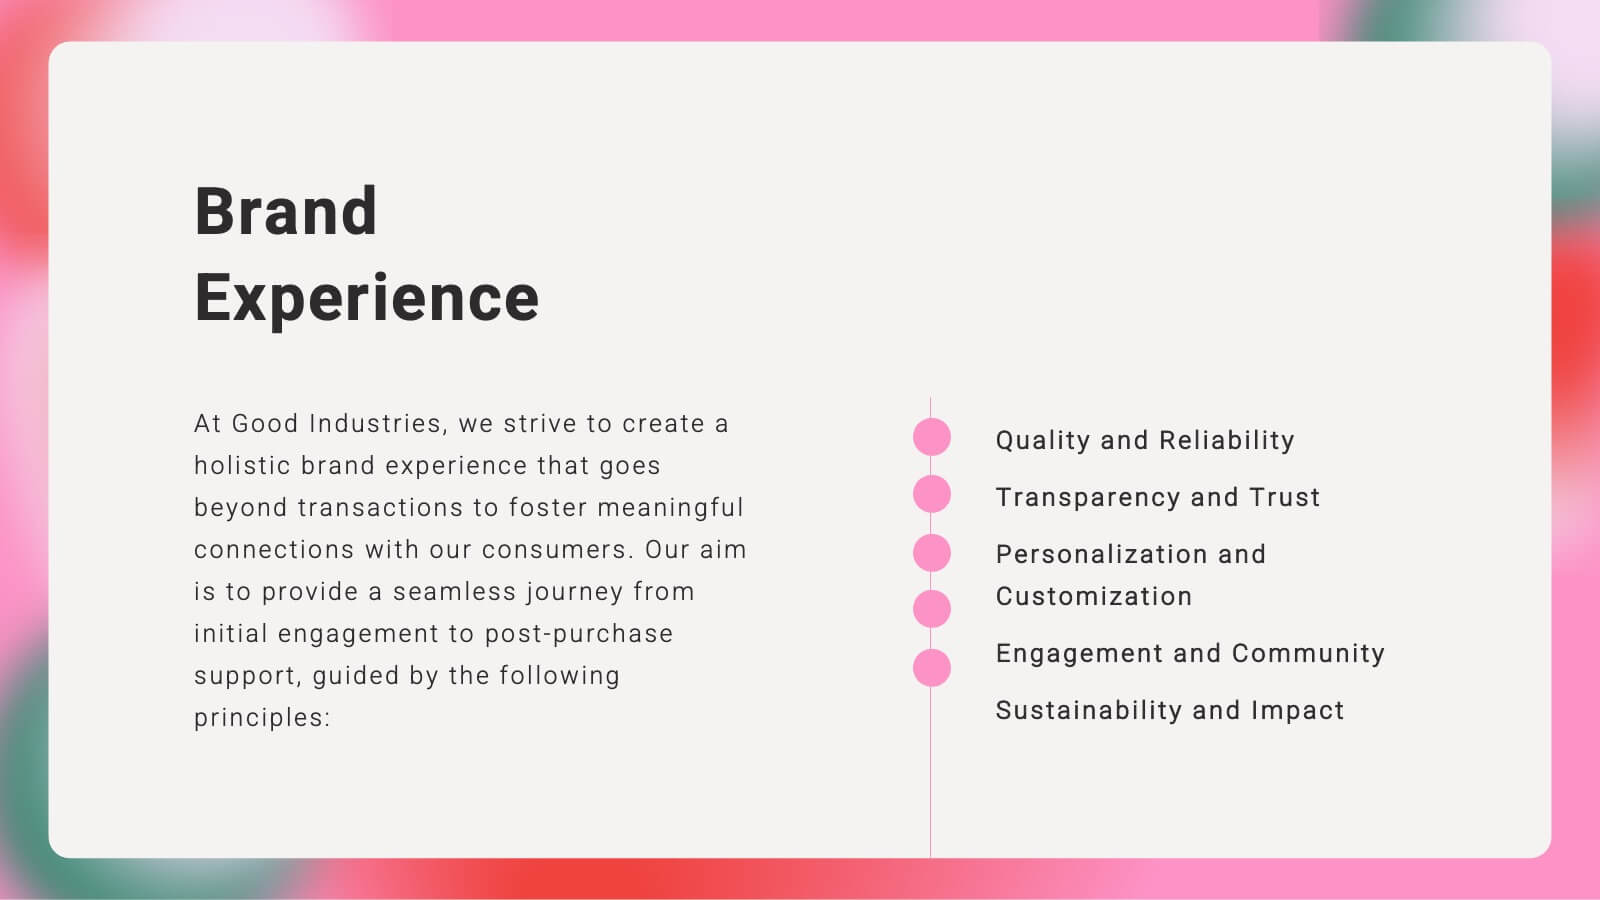
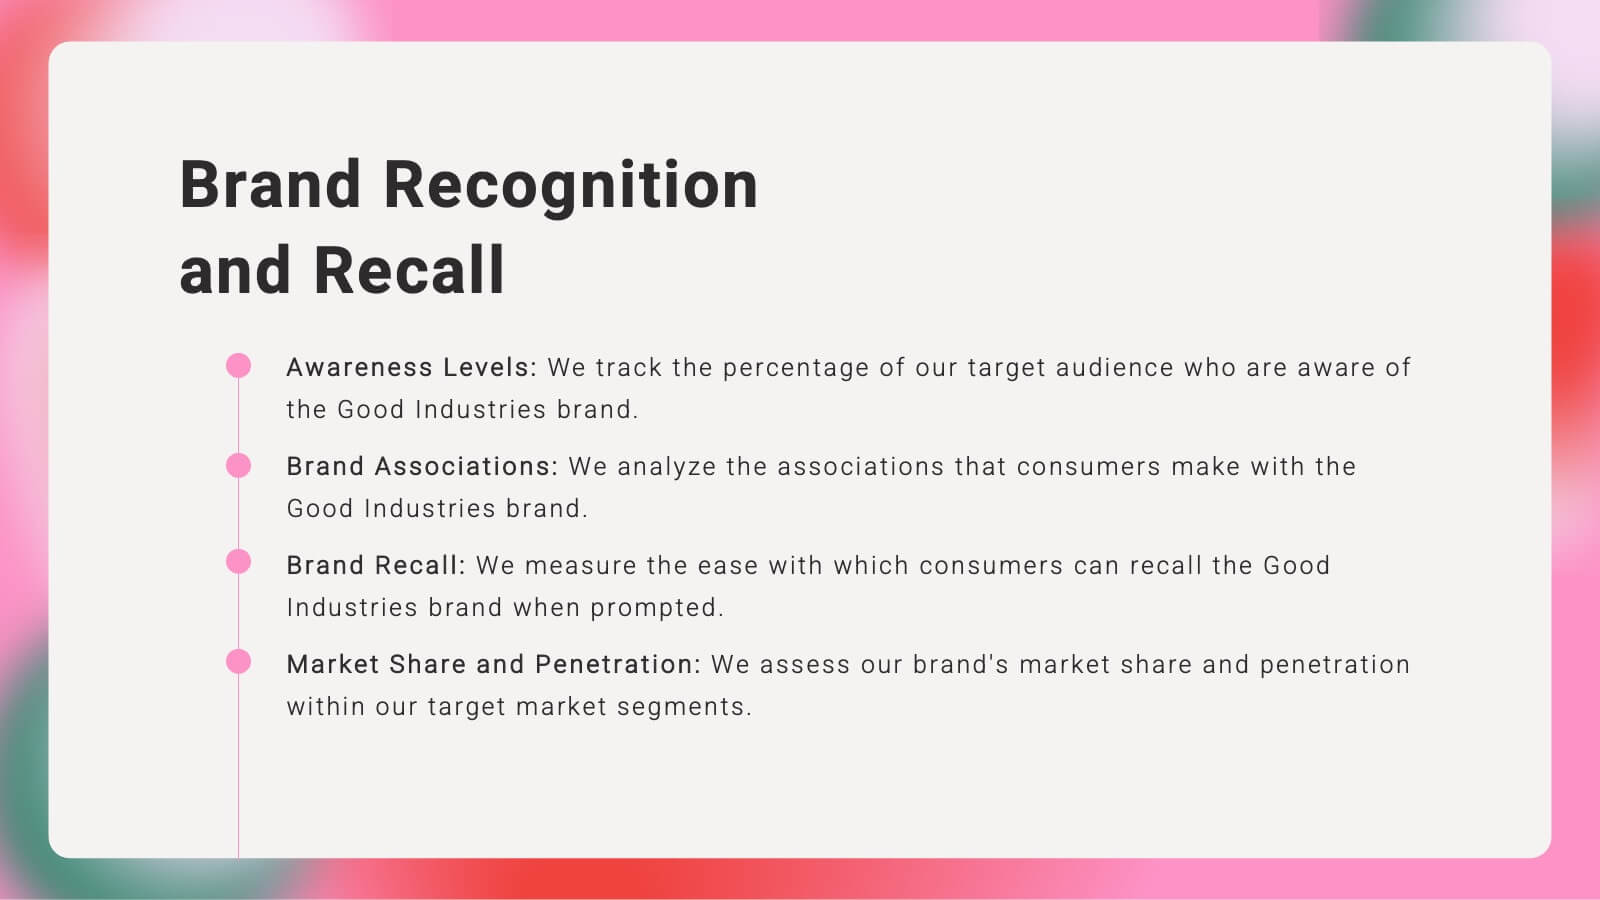
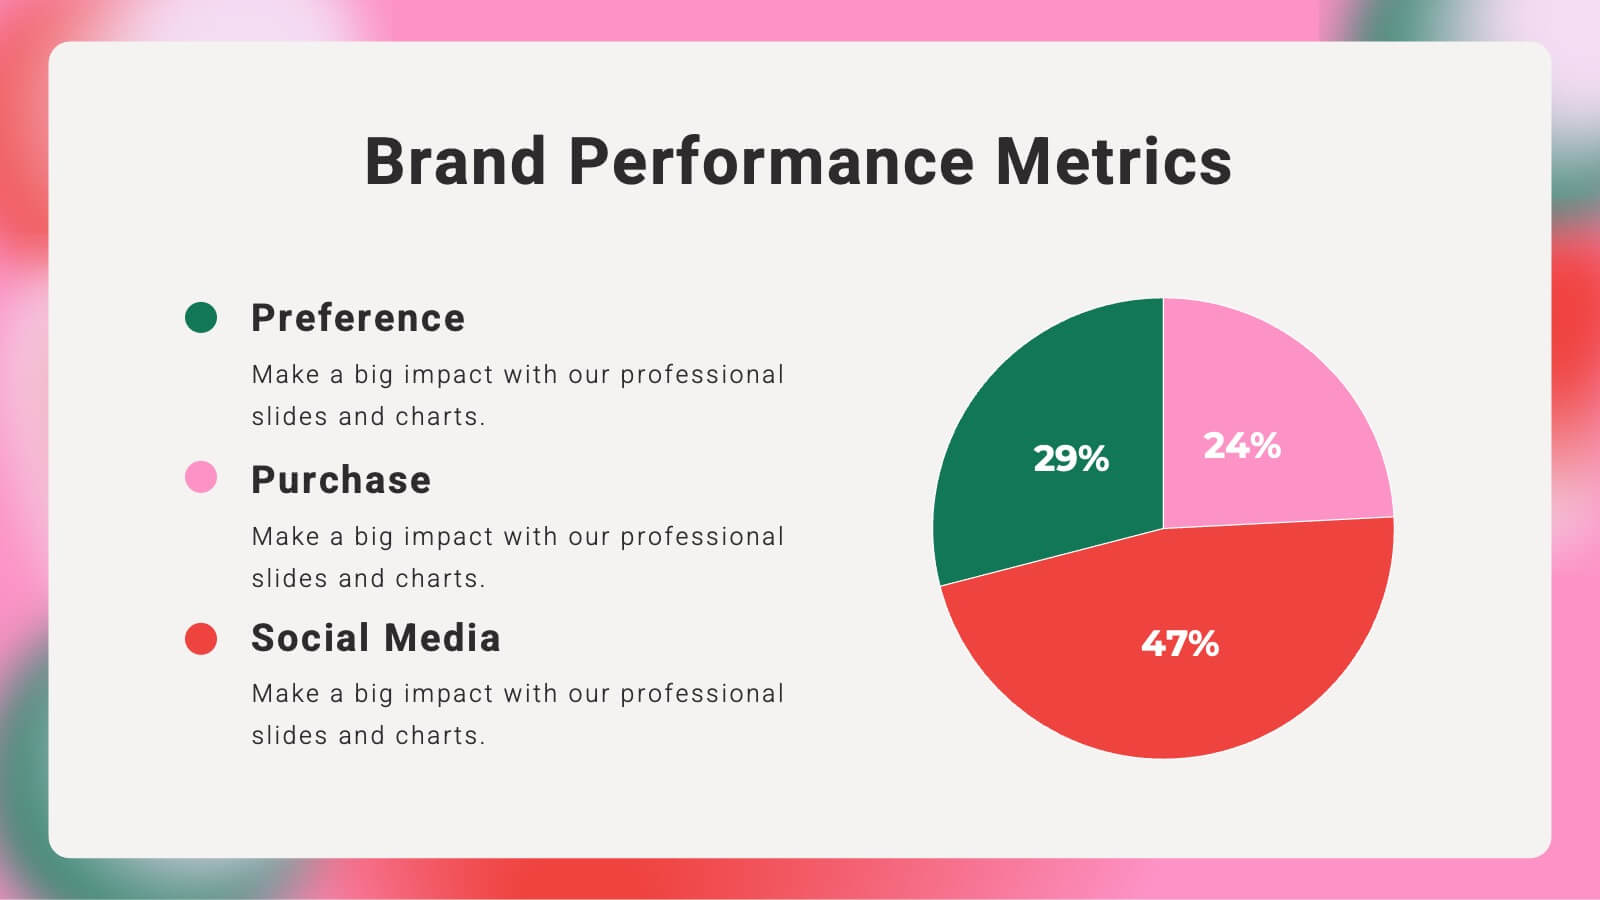
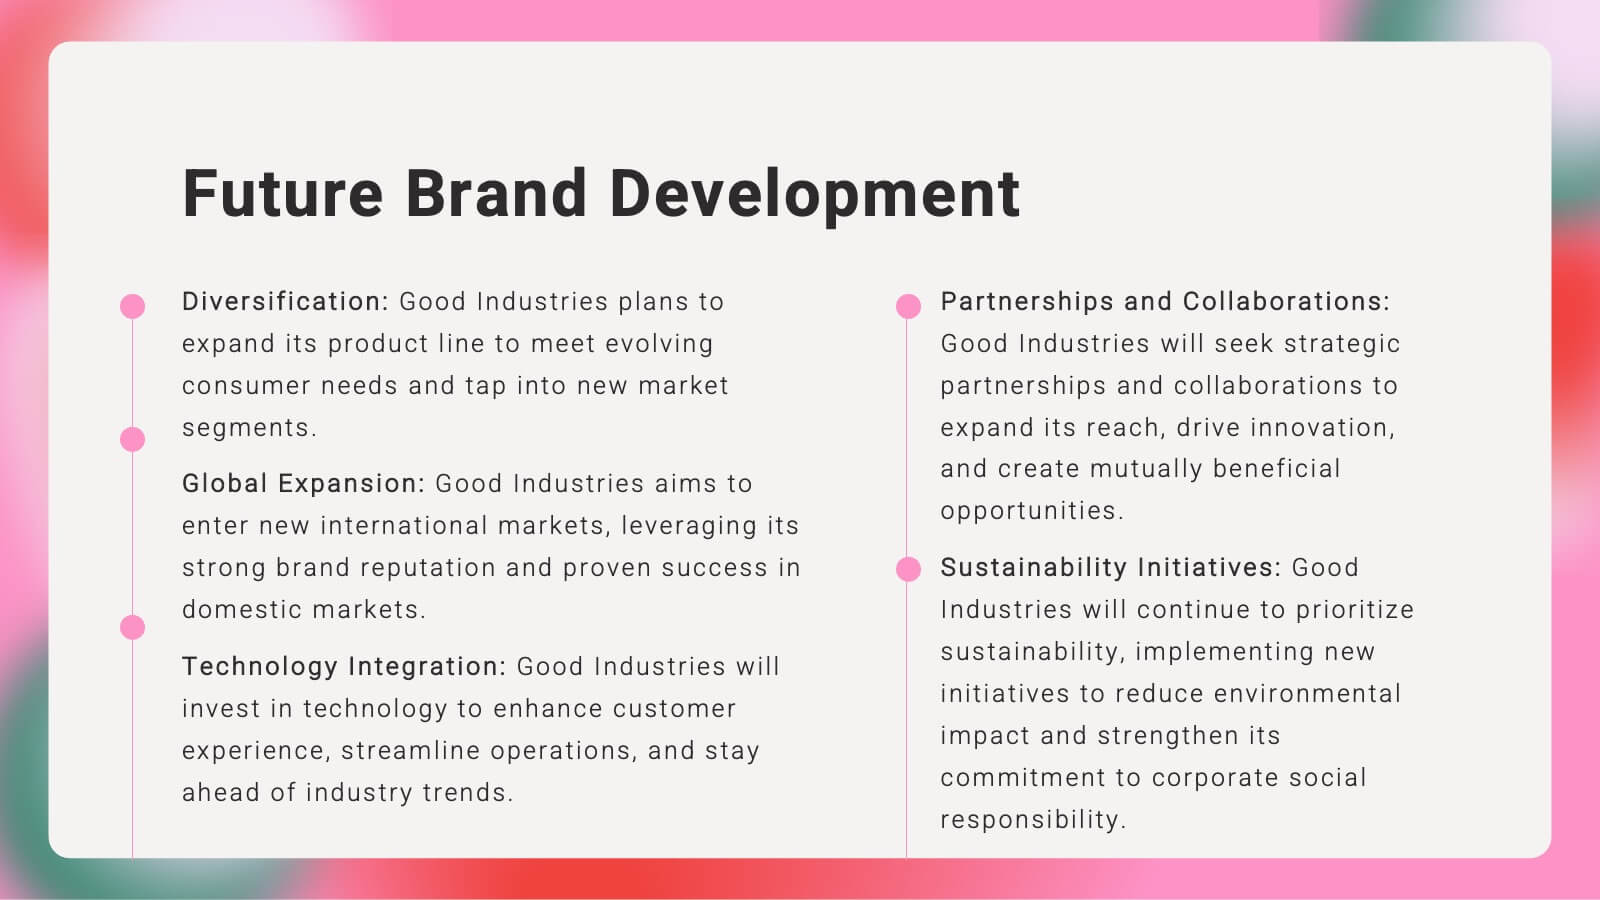
Kaleidoscope Brand Strategy Report Presentation
Craft a compelling narrative for your brand with this vibrant brand strategy presentation template. Designed to cover every facet of brand development, from vision and mission to market analysis and consumer personas, this template is an essential tool for businesses looking to establish a strong brand identity. It incorporates visually engaging slides that outline brand voice, values, and touchpoints, facilitating a thorough understanding of strategic branding. Compatible with platforms like PowerPoint, Google Slides, and Keynote, it is accessible across various devices, making it perfect for collaborative planning and presentations.


5 diapositivas
Construction Budgeting and Resource Allocation Presentation
Visualize your construction budget layer by layer with the Construction Budgeting and Resource Allocation Presentation. This pyramid-style infographic breaks down costs and resources—from materials and labor to safety infrastructure—making it easy to communicate project allocations. Fully editable in PowerPoint, Keynote, and Google Slides.


6 diapositivas
5-Level Risk Assessment Diagram Presentation
Simplify complex risk analysis with a clean, layered design that walks your audience through five key levels of impact and probability. Perfect for corporate reports, project management, or strategic planning, this presentation ensures clarity and engagement. Fully compatible with PowerPoint, Keynote, and Google Slides for easy customization.


6 diapositivas
Risk Evaluation and Mitigation Plan Presentation
Take control of uncertainty with a clean, visual layout that helps you assess potential challenges and map out clear solutions. Ideal for project planning, operations, or corporate risk management, this presentation simplifies complex data into actionable insights. Compatible with PowerPoint, Keynote, and Google Slides for easy customization.