


Características


¿Tienes alguna pregunta?
Recomendar

21 diapositivas
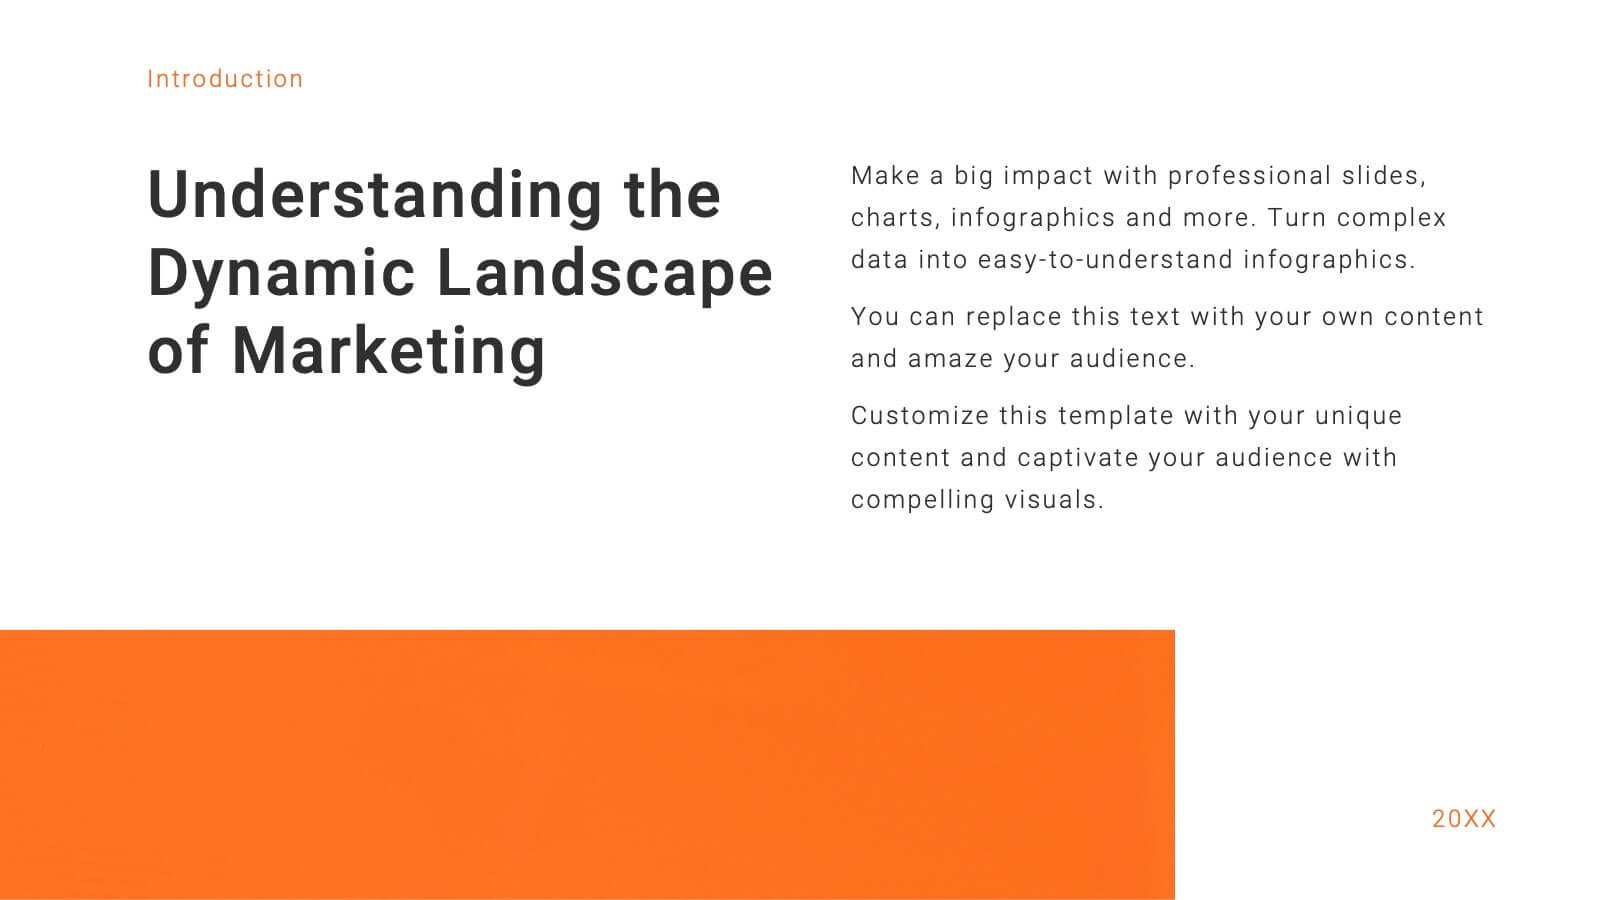
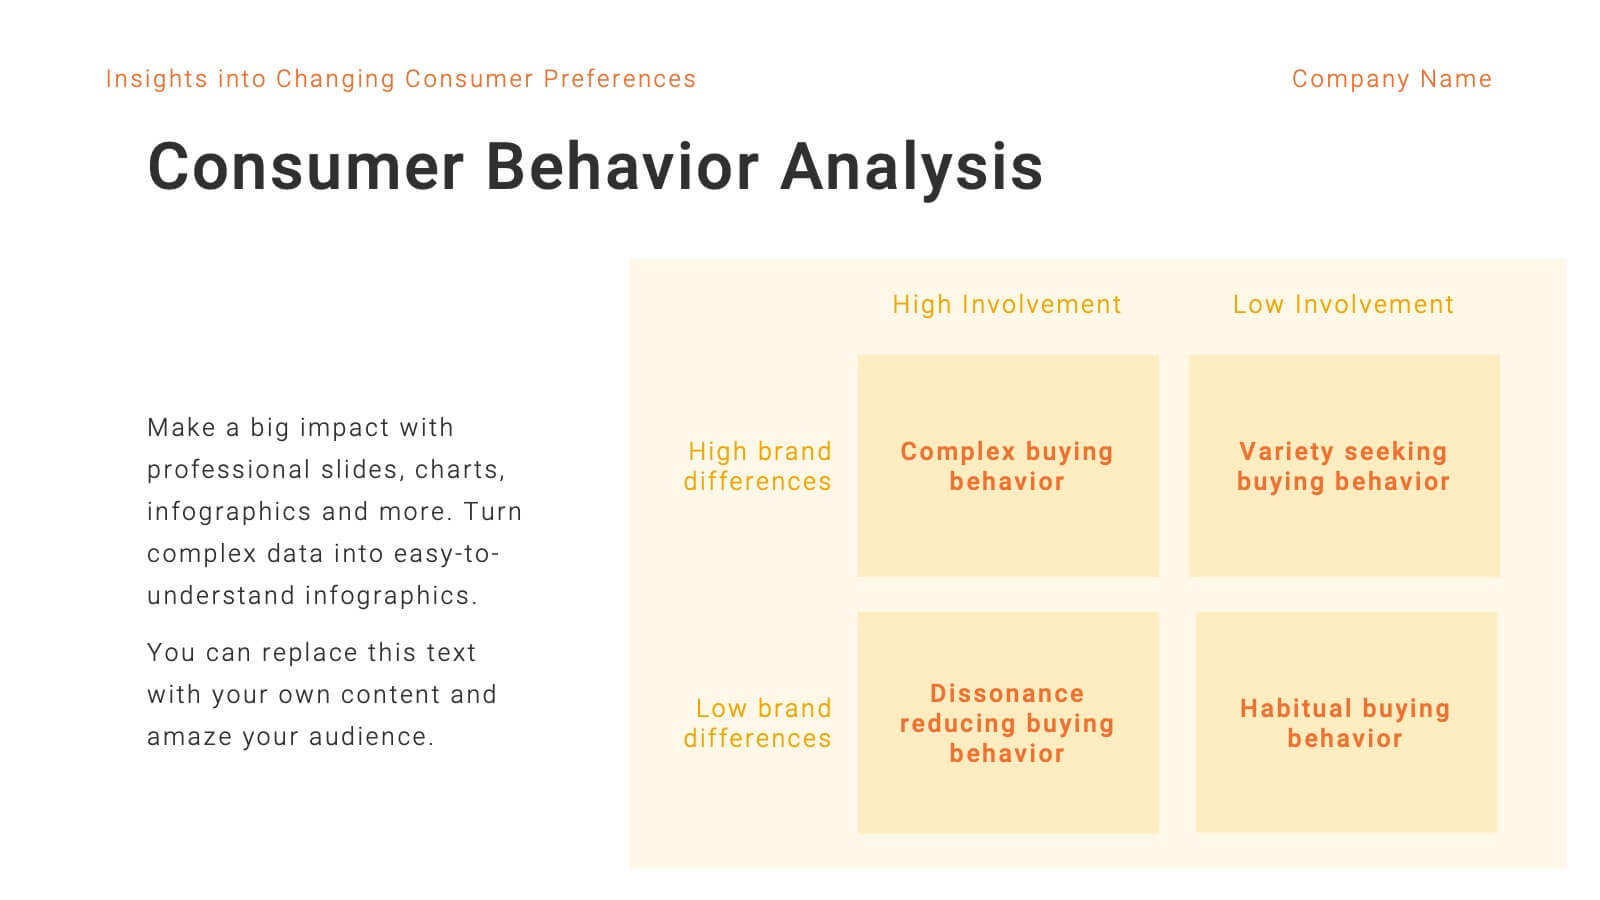
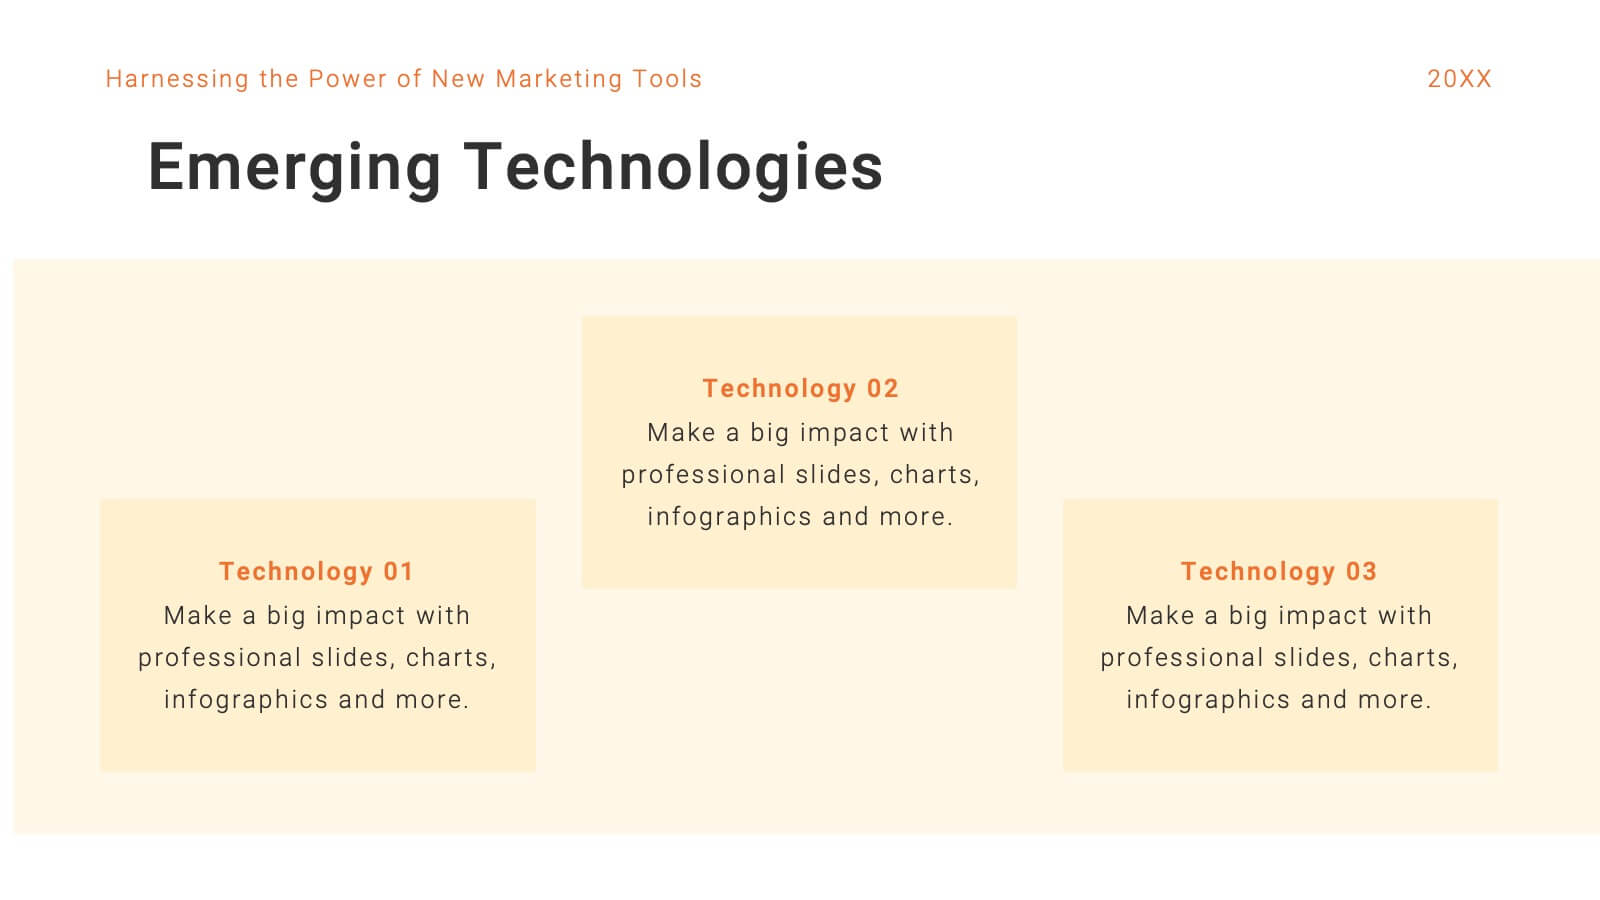
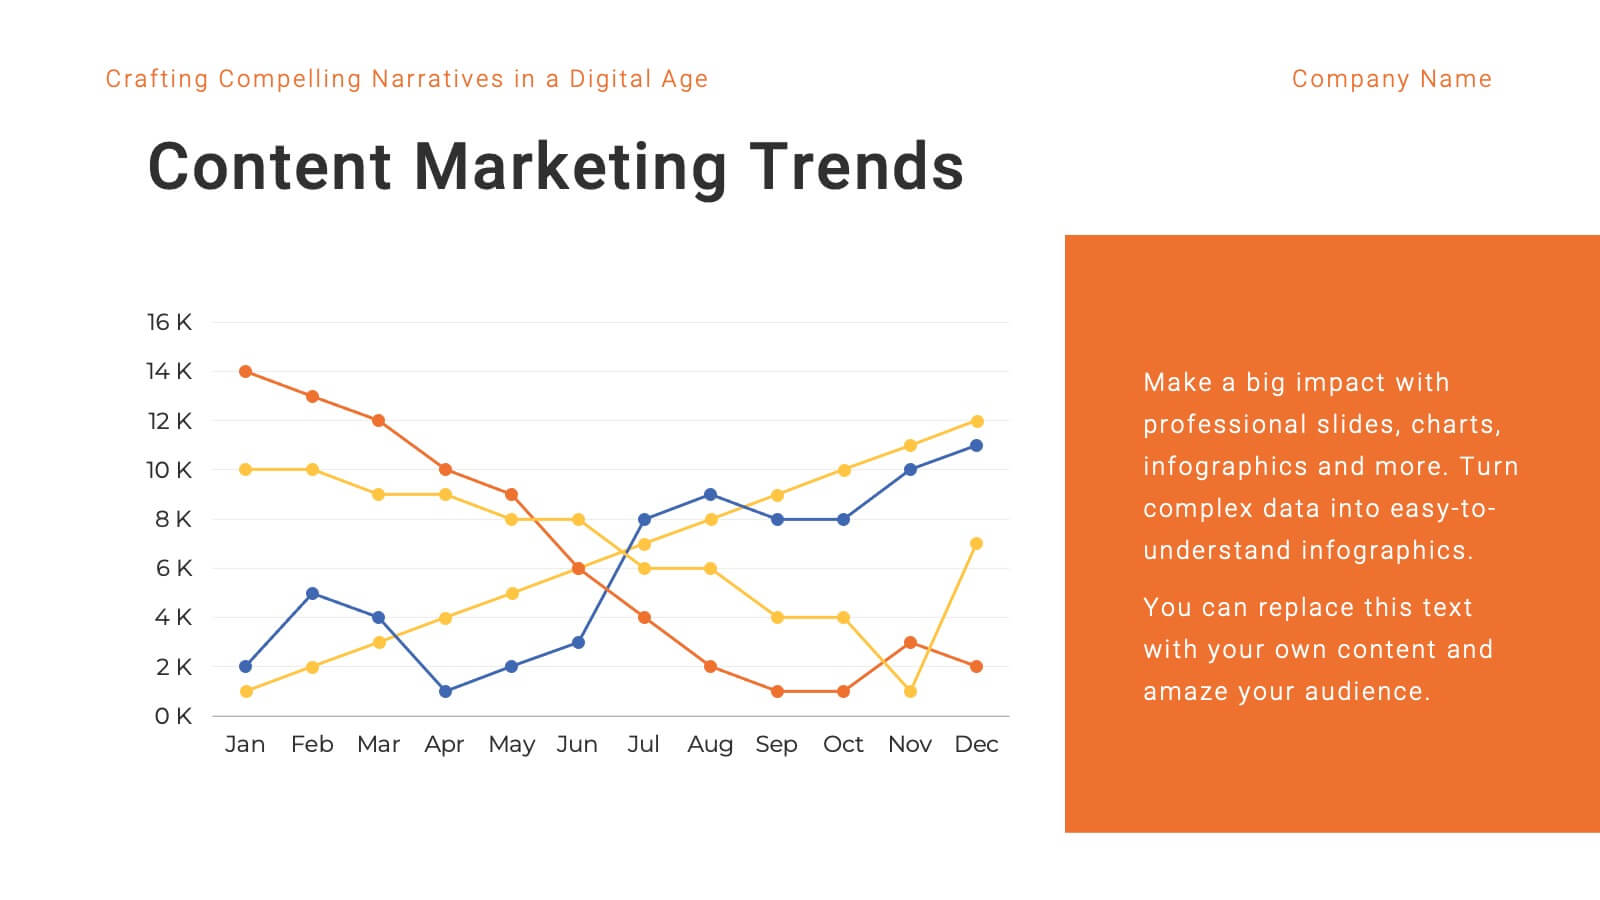
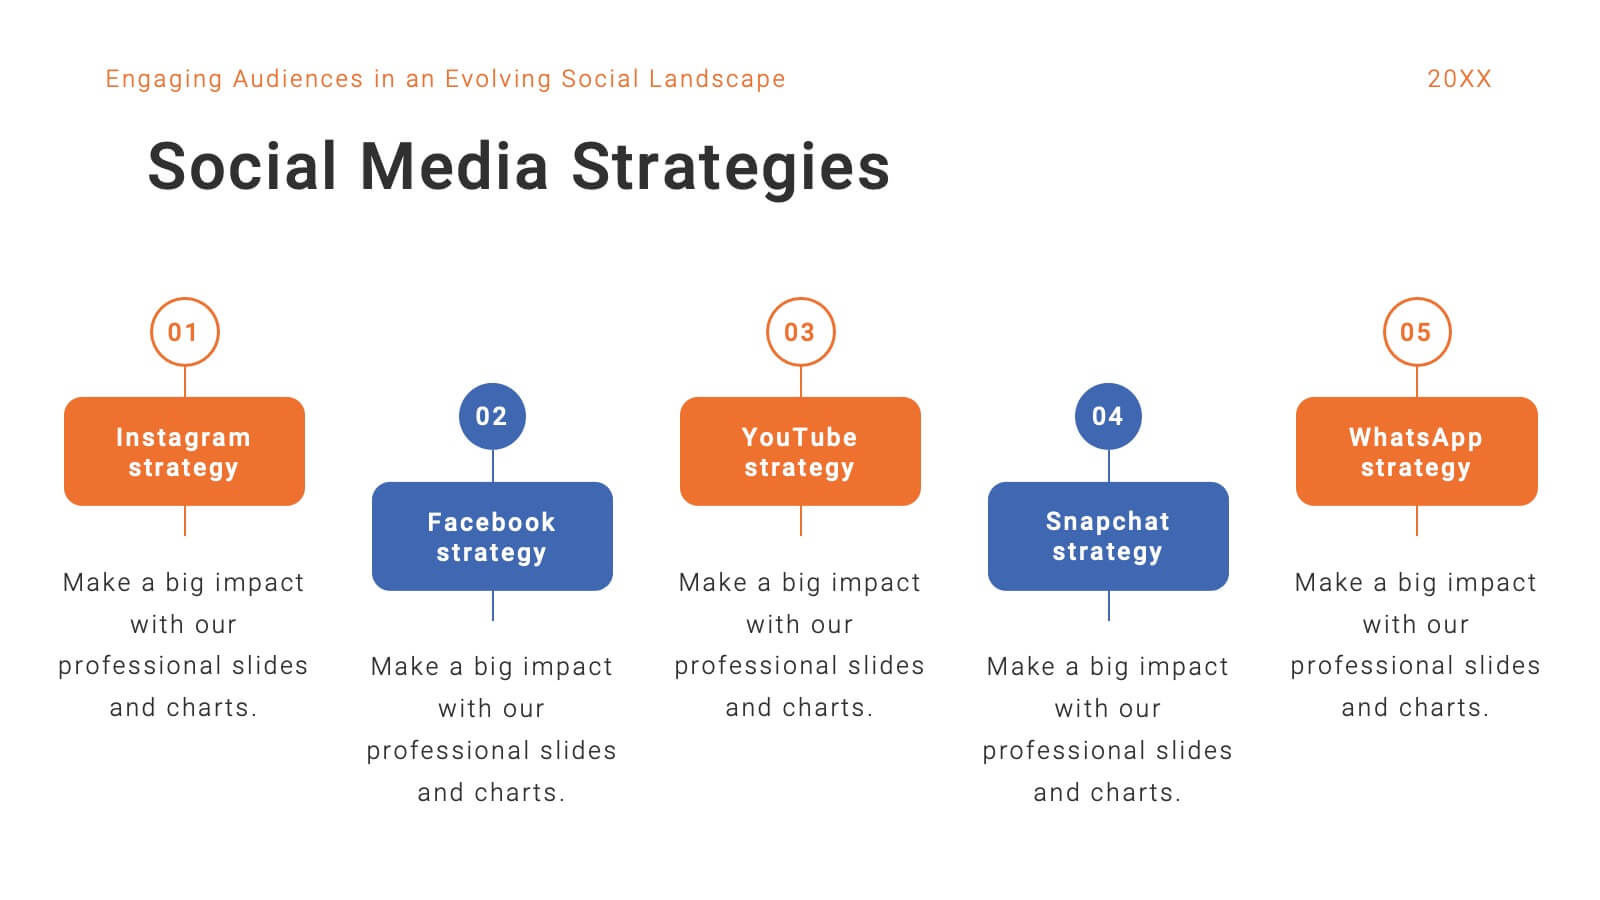
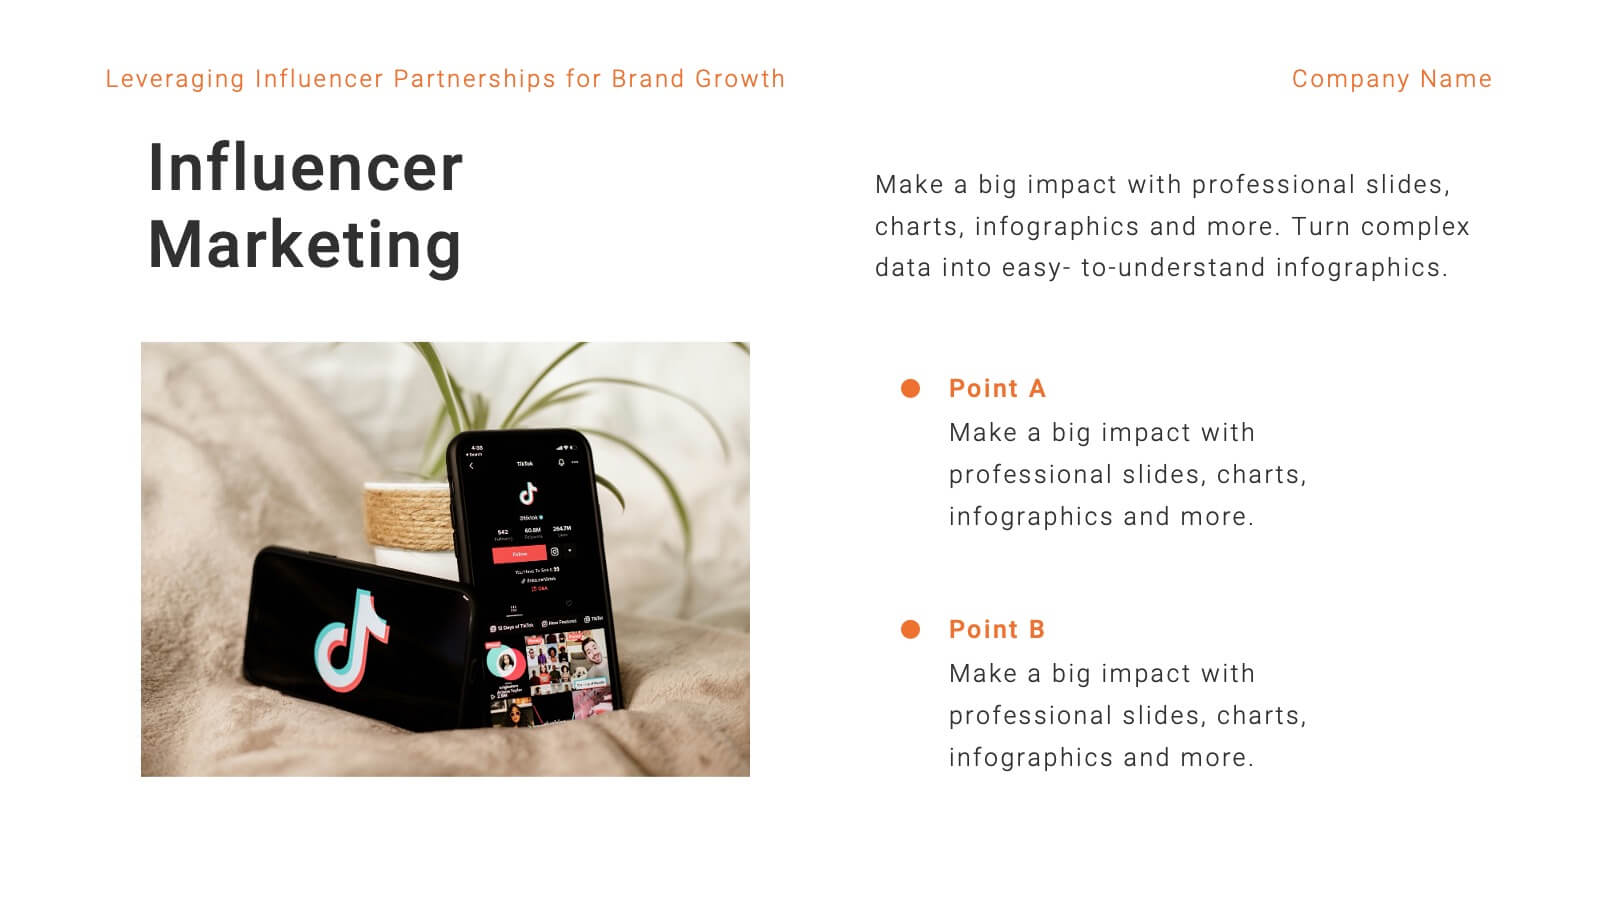
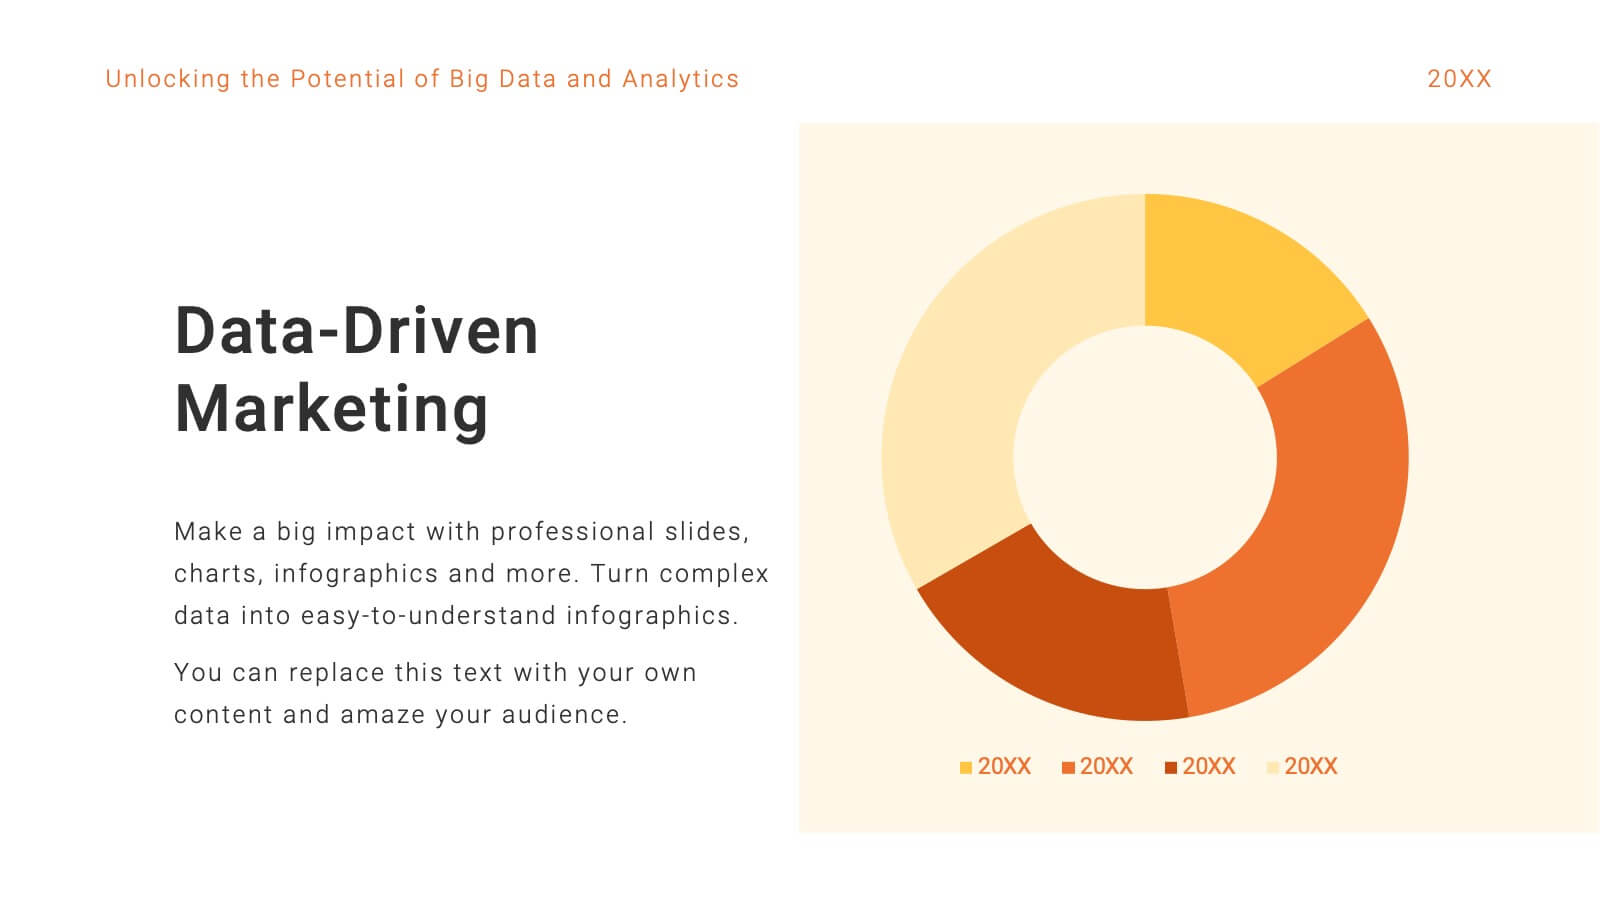
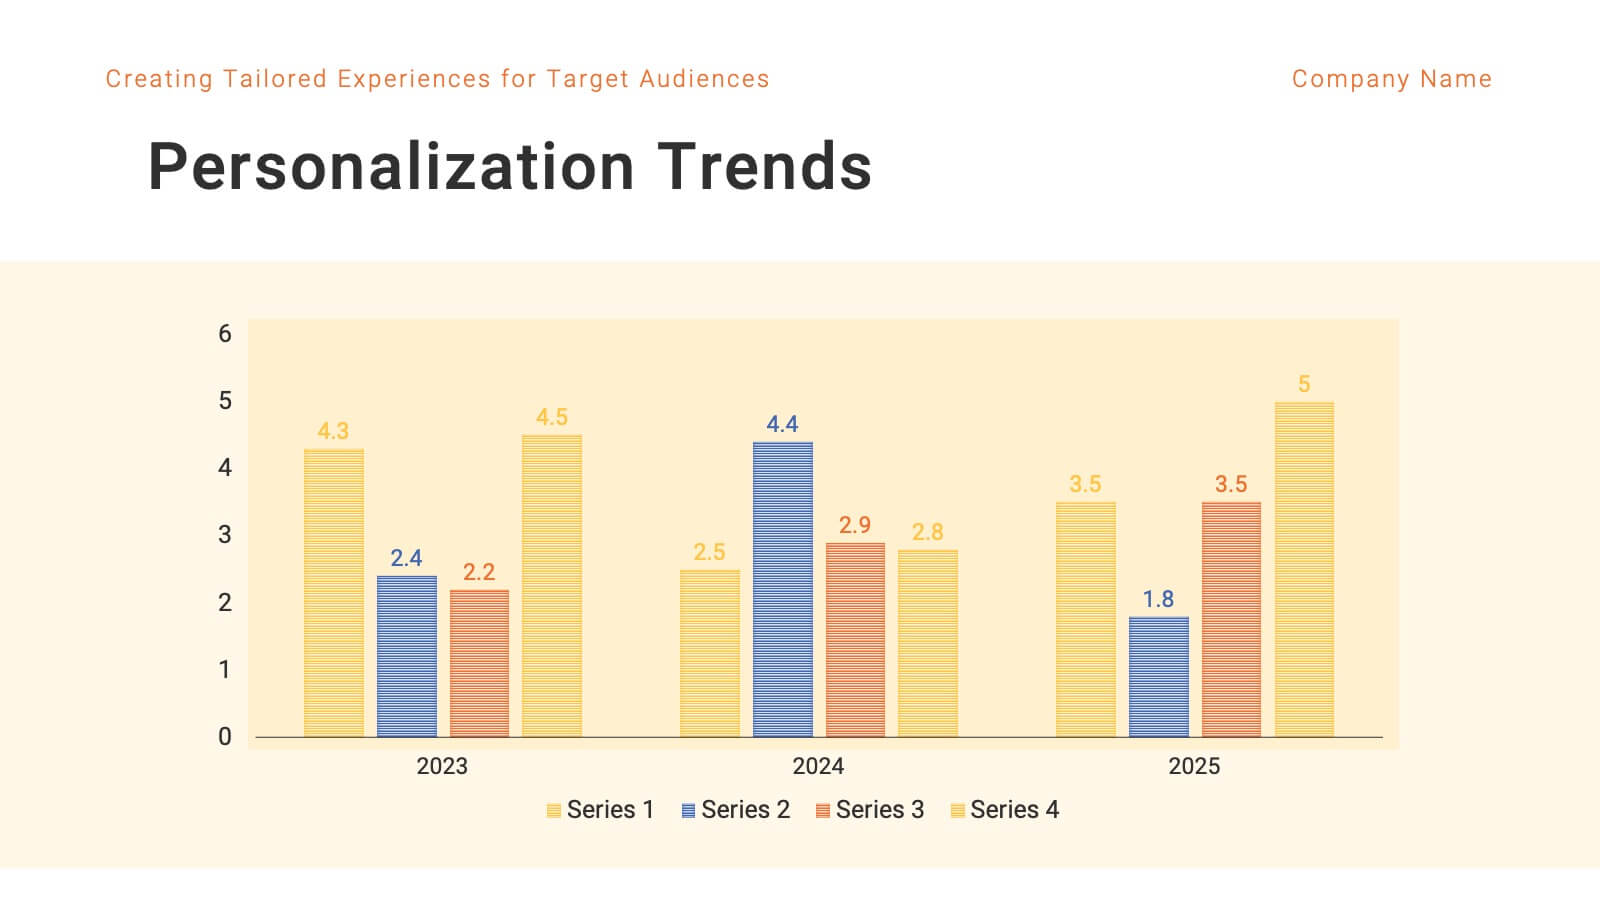
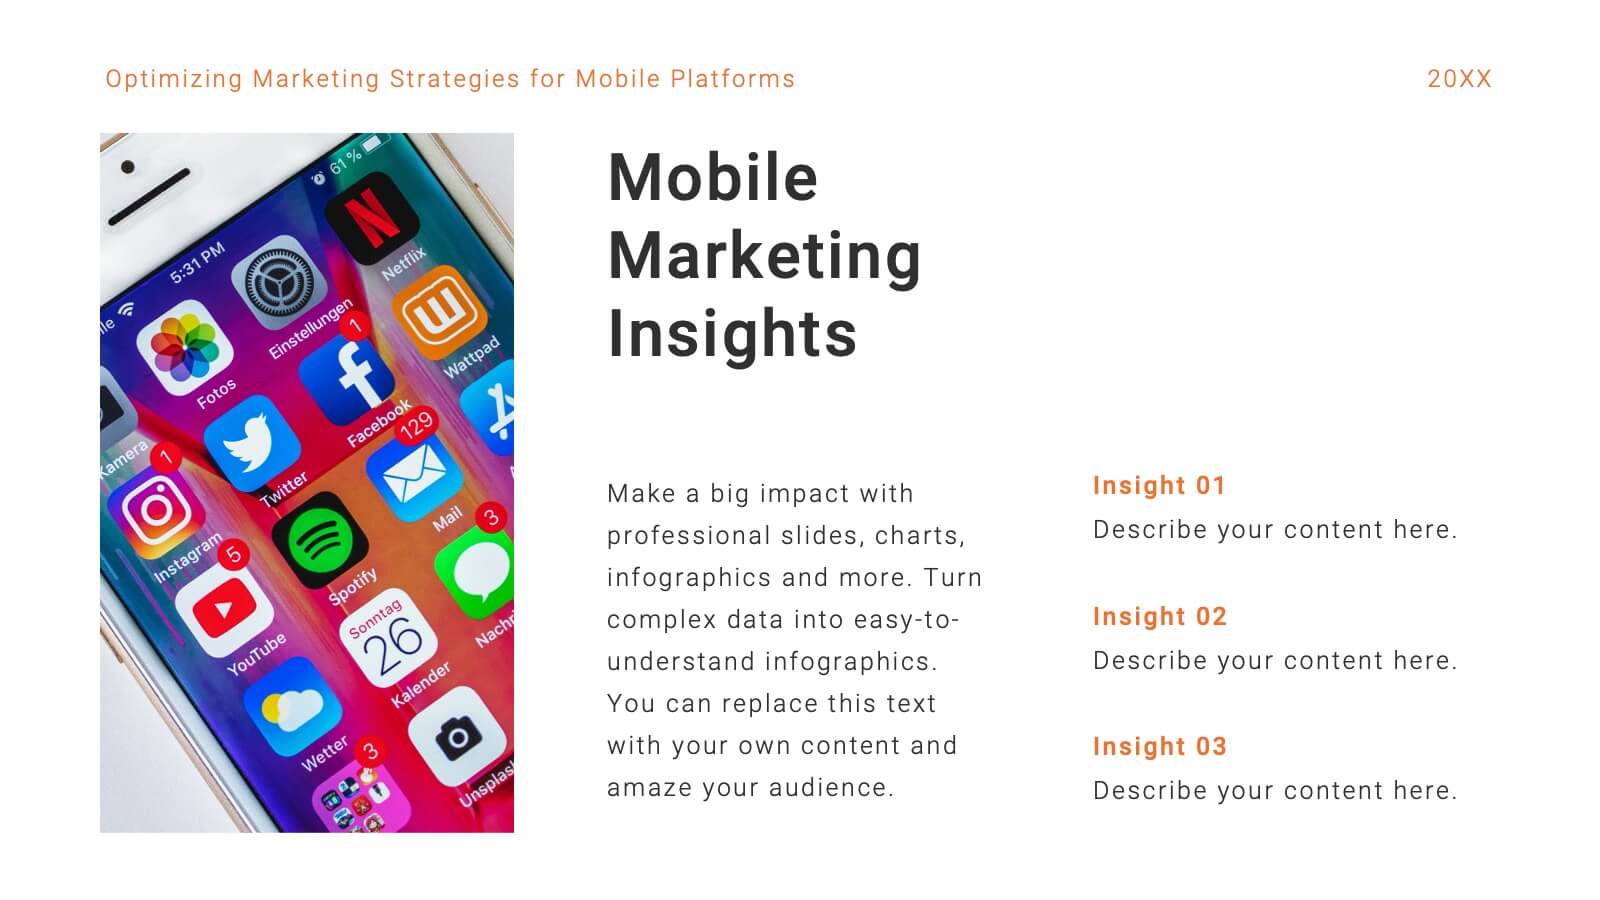
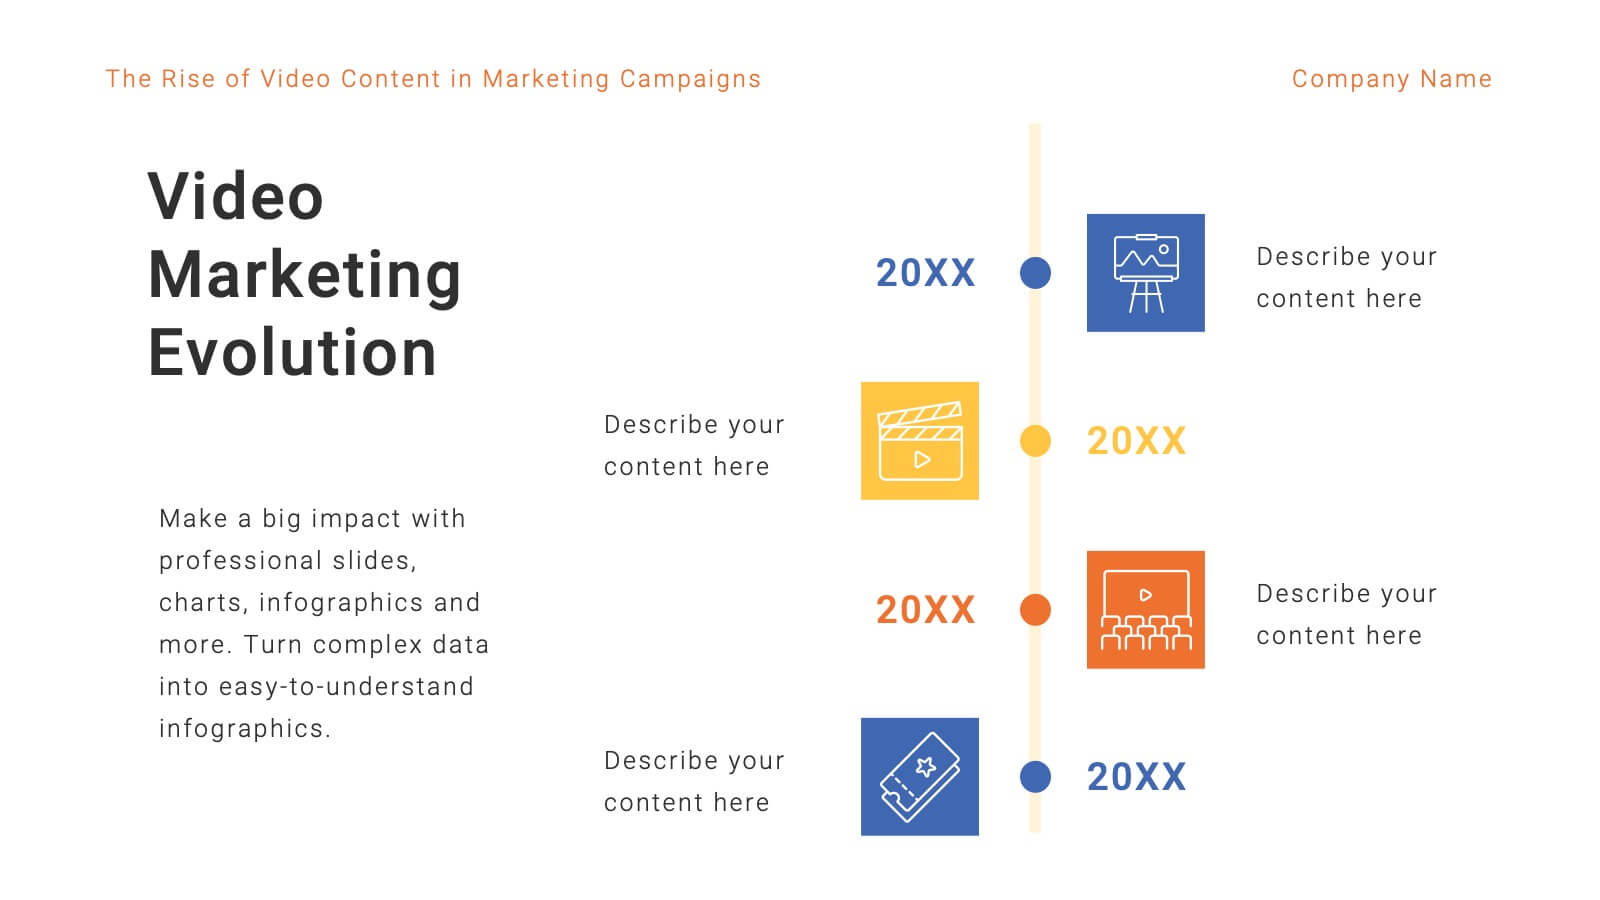
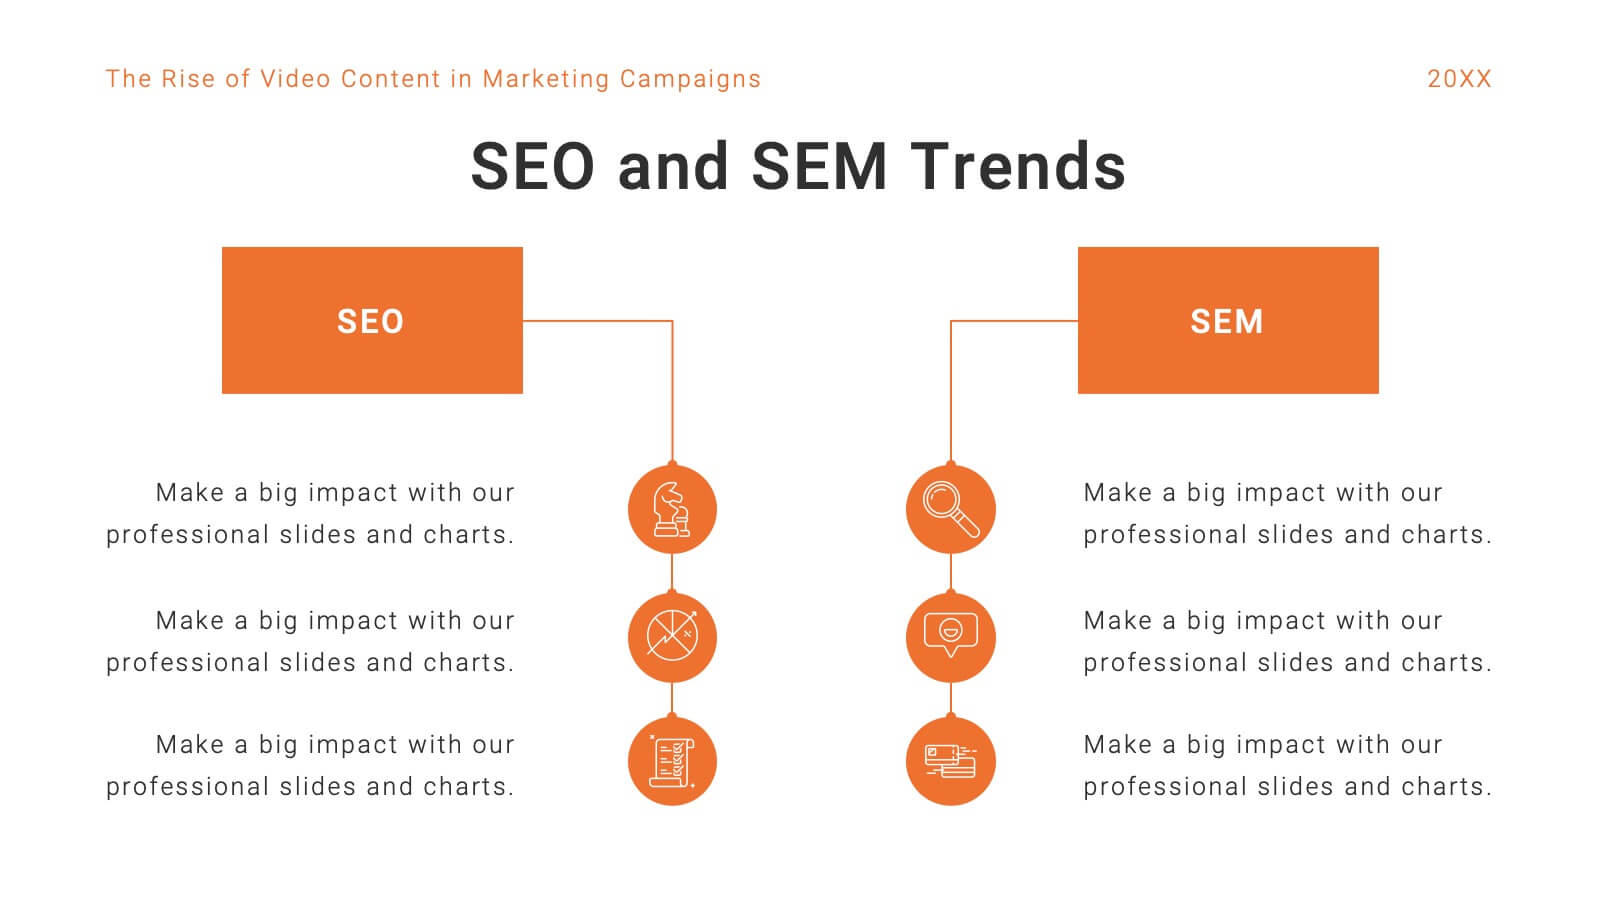
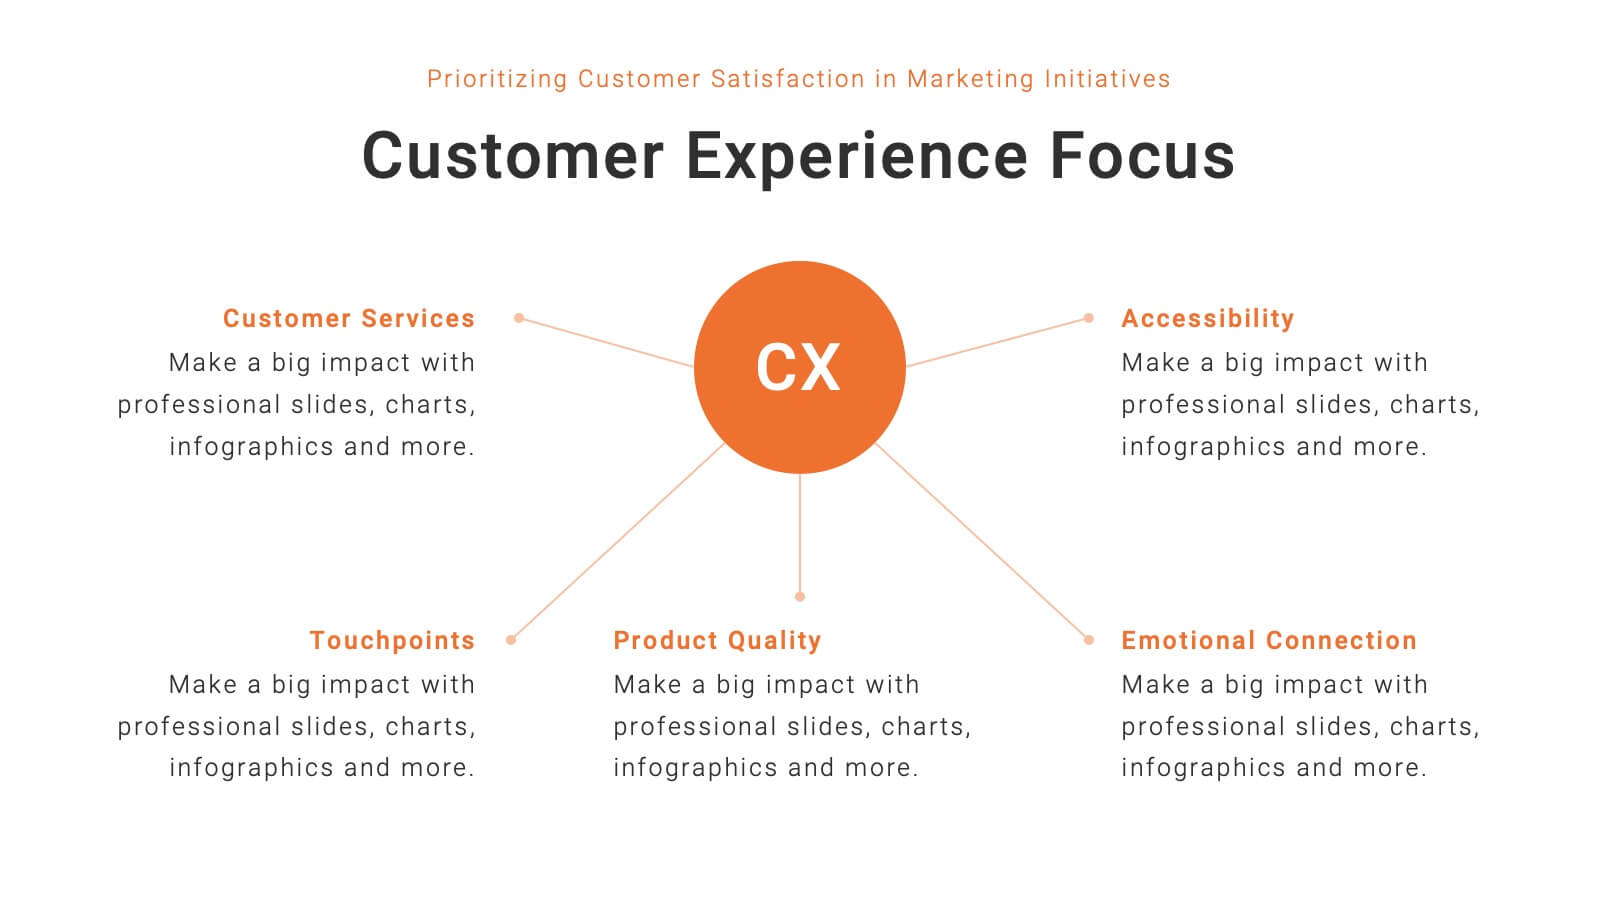
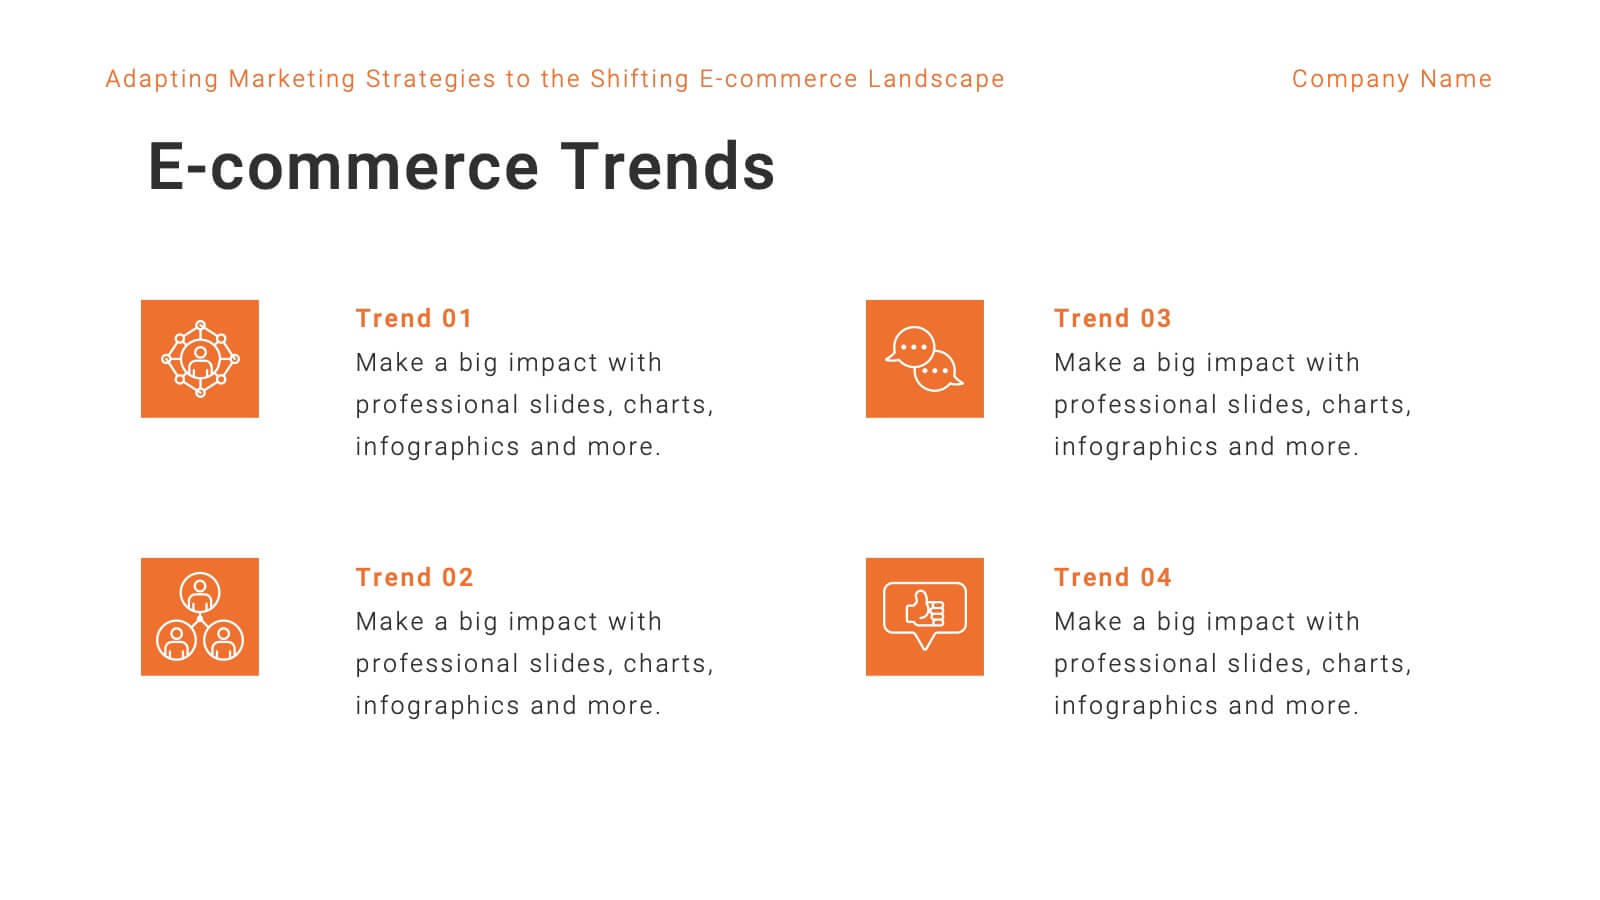
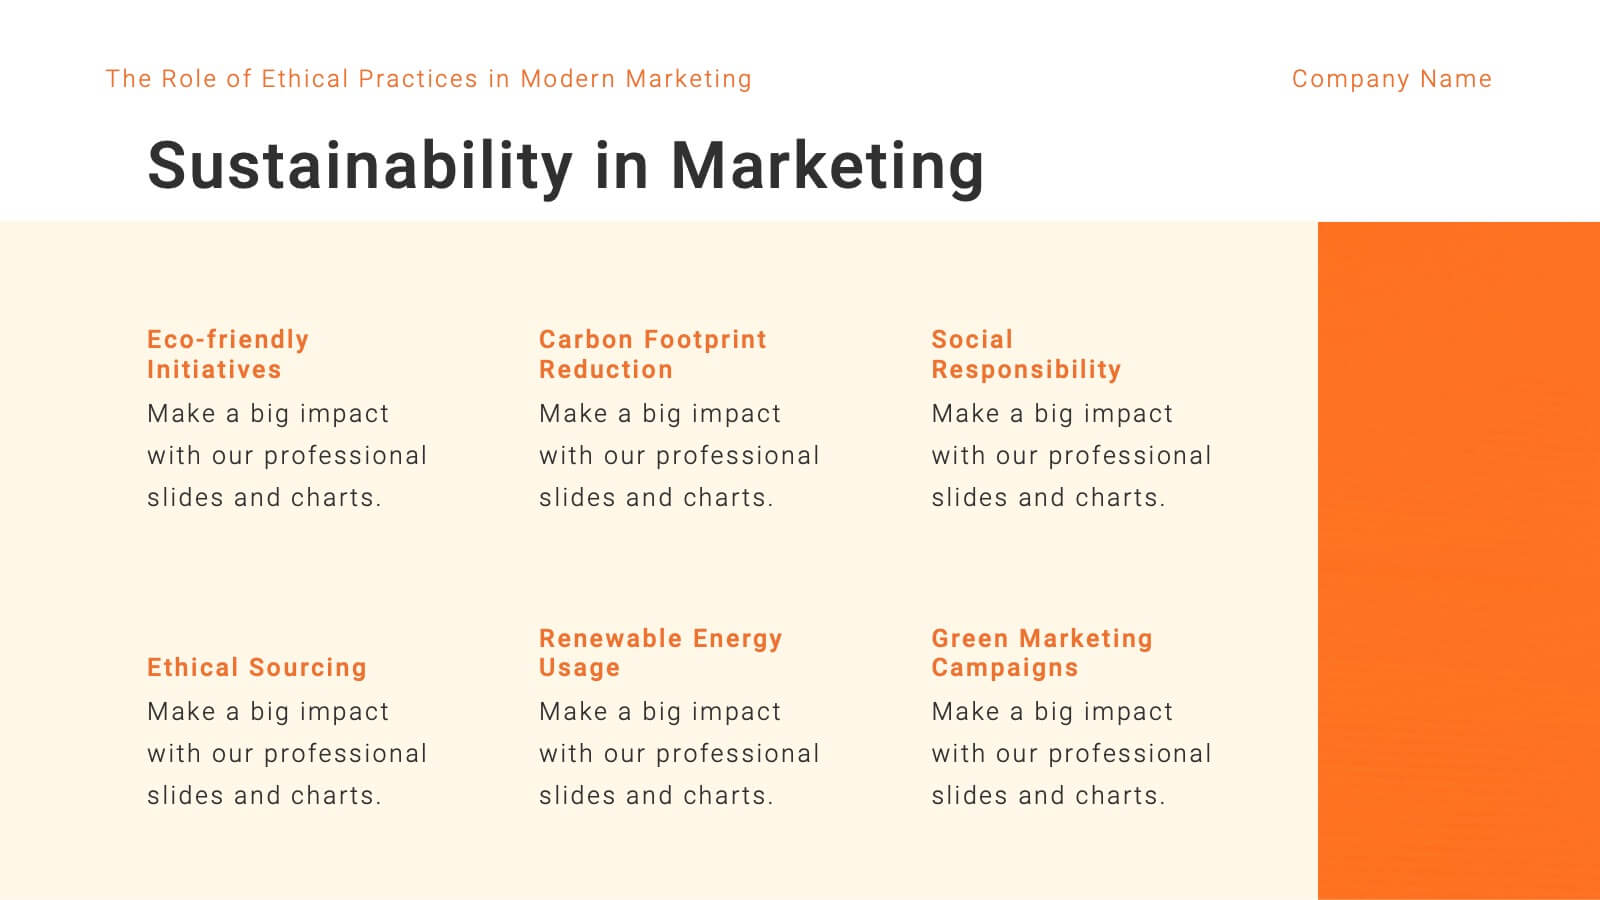
Mercury Marketing Research Report Presentation
Elevate your marketing strategy with this insightful and data-driven presentation template! Perfect for analyzing trends, consumer behavior, and emerging technologies, this template provides a thorough overview of today’s marketing landscape. From social media strategies to e-commerce trends, it covers all key areas. Fully customizable and compatible with PowerPoint, Keynote, and Google Slides for easy use.


6 diapositivas
Business Overview Company Profile Presentation
Present Your Business with a Dynamic Overview! The Business Overview Company Profile template features a modern circular flow design, perfect for showcasing company insights, key strategies, and core values. With six structured content sections, this layout helps you present information in a clear and engaging way. Whether you're introducing your business or outlining corporate initiatives, this fully editable template in PowerPoint, Keynote, and Google Slides ensures a polished and professional presentation for any industry.


6 diapositivas
Virtual Meeting Best Practices Presentation
Master your online meetings with this sleek, illustrated layout featuring a character graphic and clear content blocks. Designed to share virtual etiquette, tools, or steps for effective communication, it’s ideal for remote team briefings and onboarding. Fully editable and compatible with PowerPoint, Keynote, and Google Slides.


7 diapositivas
Asia Map Overview Infographic
Dive into the vast and varied landscape of Asia with our collection of infographic slides designed to provide an insightful overview of the continent. These templates are ideal for educators, business professionals, and researchers looking to present data on Asia’s geography, demographics, economic status, and more. Each slide is meticulously crafted to display information clearly and attractively, using maps, charts, and icons to represent statistical data and trends across Asia. The different shades and colors used in the maps distinguish between countries, regions, or data points, making it easy for audiences to grasp complex information at a glance. These templates are fully customizable, enabling you to highlight specific areas or data according to your presentation needs. Whether discussing population growth, economic development, or environmental concerns, these slides are an excellent resource for conveying detailed information in a visually engaging format.


5 diapositivas
Strategic Planning with Concentric Circles
Draw your audience in with a visual that’s as focused as your message! This strategic concentric circles template helps you map out layered priorities, interconnected goals, or phased strategies in a clean, compelling way. Fully customizable and compatible with PowerPoint, Keynote, and Google Slides for seamless presentation design.


21 diapositivas
Apollo Sales Pitch Deck Template Presentation
Create an impressive sales pitch with this sophisticated template. Highlight your company overview, problem statement, solutions, and market opportunities. Showcase your unique selling proposition and marketing strategy. Ideal for PowerPoint, Keynote, and Google Slides.


5 diapositivas
Project Task Allocation Chart Presentation
Track project progress with this clear Task Allocation Chart. Assign team members, visualize task completion, and streamline planning in one editable slide. Perfect for managing responsibilities across departments or sprints, this layout keeps teams aligned. Fully customizable in PowerPoint, Keynote, and Google Slides for professional and agile teams.


6 diapositivas
Industry Analysis Porter's 5 Forces Presentation
Analyze industry competition with this Porter's Five Forces template! This structured layout visually breaks down key factors like buyer power, supplier influence, competitive rivalry, new market entrants, and substitution threats, making it ideal for strategic planning and market assessments. Fully customizable and compatible with PowerPoint, Keynote, and Google Slides.


7 diapositivas
SEO Optimization Infographic Presentation
Search engine optimization (SEO) is the practice of optimizing websites and digital content to rank higher in search engine result pages. Use this template to lay out the basics of optimization, including best practices and examples, as well as a checklist for everything you need to know. This template is perfect to show your audience a step by step process of SEO. It includes a great space to enter data, knowledge and helpful tips with a simple design and bright colors. This can be used in an article, presentation or even a blog post to give your audience all the information needed about SEO.


21 diapositivas
Project Proposal Presentation
Outline your project's scope and objectives with precision using this Project Proposal presentation template. Designed for clarity and impact, it includes slides for project overview, deliverables, timeline, budget breakdown, and risk management. Ideal for project managers and teams, this template ensures detailed communication and streamlined project planning. Compatible with PowerPoint, Keynote, and Google Slides, it's perfect for driving successful project execution.


26 diapositivas
Doriyan Presentation Template
Doriyan is a beautiful, colorful, professional and descriptive presentation. This template has wonderful colors and graphics that are engaging and conveys the information to the audience. This template is suitable for all types of businesses especially those that are investors, realtors or other companies involved in investment advice. Charts, timelines and easy to edit text makes this template perfect for businesses seeking to introduce there business and services to make a great impression. Doriyan offers a way to boost your business. Present your information with this efficient template!


7 diapositivas
Liability Insurance Infographic
Liability insurance is a type of insurance that provides coverage and protection to individuals and businesses against the risk of being sued and held legally liable for injuries, damages, or losses caused to other individuals or entities. This template is your roadmap to understanding the vital realm of liability insurance, a shield against unexpected financial risks. Compatible with Powerpoint, Keynote, and Google Slides. It lays out the crucial aspects of liability insurance in a clear and engaging manner, ensuring you're well-equipped to protect yourself or your business.


8 diapositivas
Team Statistics and Rankings Presentation
Showcase match performance, rankings, and team metrics with this Team Statistics and Rankings Presentation. Visualize key game stats using editable diagrams, heatmaps, and comparison scores. Perfect for sports analysts, coaches, or recap slides. Compatible with PowerPoint, Keynote, and Google Slides—fully customizable for your team’s specific data and branding needs.


5 diapositivas
Five-Step Process Improvement Presentation
Streamline operations with the Five-Step Process Improvement presentation. This template visually maps out key phases of business optimization, using a structured timeline to highlight each step's purpose and impact. Perfect for project managers, consultants, and corporate strategists, this design helps teams track progress and refine workflows effectively. Fully editable and compatible with PowerPoint, Keynote, and Google Slides for effortless customization.


7 diapositivas
TAM SAM SOM Analysis Infographic Presentation
A TAM SAM SOM Infographic is a visual representation of a business concept that is used to describe a company's potential market size and growth opportunities. TAM stands for Total Addressable Market, SAM stands for Serviceable Addressable Market, and SOM stands for Serviceable Obtainable Market. This template includes a series of concentric circles, rectangles, and other shapes with the TAM being the largest circle, followed by the SAM and SOM. This infographic also includes text, icons, and other graphic elements to help illustrate key points and communicate your growth strategy.


3 diapositivas
Work from Home Setup and Productivity Plan Presentation
Ready to supercharge your productivity from your kitchen table to your couch office? This visual template helps you map out ideal remote work setups, task plans, and daily focus routines. Organize workspace essentials and time blocks in a clean, engaging format. Fully compatible with PowerPoint, Keynote, and Google Slides.


6 diapositivas
Scrum Team Roles and Sprint Planning Presentation
Visualize your Agile workflow with this Scrum team diagram. Highlight roles, responsibilities, and key sprint planning phases in a clear, circular flow. Ideal for project managers, team leads, or Agile coaches. Fully editable in PowerPoint, Keynote, and Google Slides to support your software development or Agile training presentations.