
Características


¿Tienes alguna pregunta?
Recomendar


5 diapositivas
Visual Data Representation Bubble Map
Display complex data in a clean, engaging format with this Visual Data Representation Bubble Map. Ideal for highlighting key points, data clusters, or relationships, each bubble can be customized to match your topic. Perfect for presentations in business, research, or strategy—fully editable in PowerPoint, Keynote, and Google Slides.


6 diapositivas
Target Market Stock Infographic
The target market refers to the specific group of individuals or businesses that a company aims to reach and serve with its products or services. The goal of this infographic template is to provide a overview of your target market, allowing marketers and businesses to craft more personalized and effective marketing strategies. This template is designed to identify and understand that the market is a crucial aspect of marketing and business strategy. This template will help you tailor offerings and marketing efforts to meet the needs of your intended audience. Create marketing campaigns that resonate with your viewers.


26 diapositivas
Dax Presentation Template
Dax is a professional and clean template that was created to make your presentations stand out. It has a vibrant color scheme and engaging graphics that are easy to edit. The clean look has plenty of room for you to display your content, and this high-quality design will make an impression in your meeting or presentation for your targeted audience. It also allows you to present your content in a way that is professional and engaging. Its vibrant style also makes it stand out from other presentations. This template is suitable for all types of businesses. Don't think twice this one if for you!


4 diapositivas
Veterinary Practice Overview Presentation
Give your veterinary insights a professional touch with this clean, modern infographic layout. Designed to showcase workflows, patient care processes, and team structures, it helps present information clearly and visually. Fully customizable and compatible with PowerPoint, Keynote, and Google Slides for easy editing and seamless presentation design.


7 diapositivas
Project Gantt Charts Infographic Presentation
A Gantt chart is a graphical representation of project activities in a table format, where time is represented on the horizontal axis and work on the vertical axis. Gantt charts are useful for project workflow, but if you don’t know how to create them, finding alternatives can be time consuming. Our template makes it easy to create your own in minutes! This infographic template will ensure that your milestones and critical tasks are completed by deadlines, and help you track progress towards your overall project goals. Just download and edit in PowerPoint, Keynote, or Google Sheets.


26 diapositivas
Real Estate Company Profile Presentation
Step into the world of real estate, where every brick tells a story and every home harbors a dream. Our warm and bold template, draped in varying shades of brown, encapsulates the essence of properties, from cozy homes to towering skyscrapers. Boasting tailored graphics, detailed icons, and versatile image placeholders, it's more than just a visual aid; it's an experience. Seamless compatibility ensures it's ready for Powerpoint, Keynote, or Google Slides. An invaluable asset for realtors, property managers, housing agencies, or anyone looking to make an impact in the real estate market. Present with confidence; let every property shine.


10 diapositivas
Effective Team Communication Presentation
Streamline your Effective Team Communication with this modern infographic template. Designed to enhance collaboration and workflow clarity, this slide helps visualize key communication strategies for better team efficiency. Fully customizable in PowerPoint, Keynote, and Google Slides, making it perfect for corporate training, leadership meetings, and project planning.


6 diapositivas
Oceania Biome Map Infographics
Explore our versatile Oceania Biome Map infographic template, a powerful tool for visualizing the diverse ecosystems in the Oceania region. This template is compatible with popular presentation software such as PowerPoint, Keynote, and Google Slides, allowing you to effortlessly customize it to meet your specific needs. The Oceania Biome Map infographic template serves as a foundational framework for displaying information about various biomes, including rainforests, deserts, coral reefs, and more. Whether you're an educator, environmentalist, or simply interested in Oceania's ecology, this template provides a user-friendly platform for creating informative presentations and educational materials. Impress your audience with this SEO-optimized Oceania Biome Map infographic template, thoughtfully designed for clarity and ease of use. Customize it to showcase the unique characteristics and biodiversity of Oceania's biomes, making it an invaluable resource for your projects and presentations. Begin crafting your personalized infographic today!


5 diapositivas
Marketing Concepts Infographics
Marketing Concepts refer to the various strategies and philosophies that guide the marketing efforts of businesses and organizations. Our marketing concept infographics are visual representations of the different marketing concepts and strategies that businesses use to promote their products or services. These infographics can cover a wide range of marketing topics, including target audience, product positioning, branding, advertising, and video marketing. The purpose of these infographics is to provide a easy-to-understand overview of key marketing concepts that businesses can use to drive sales and increase brand awareness.


24 diapositivas
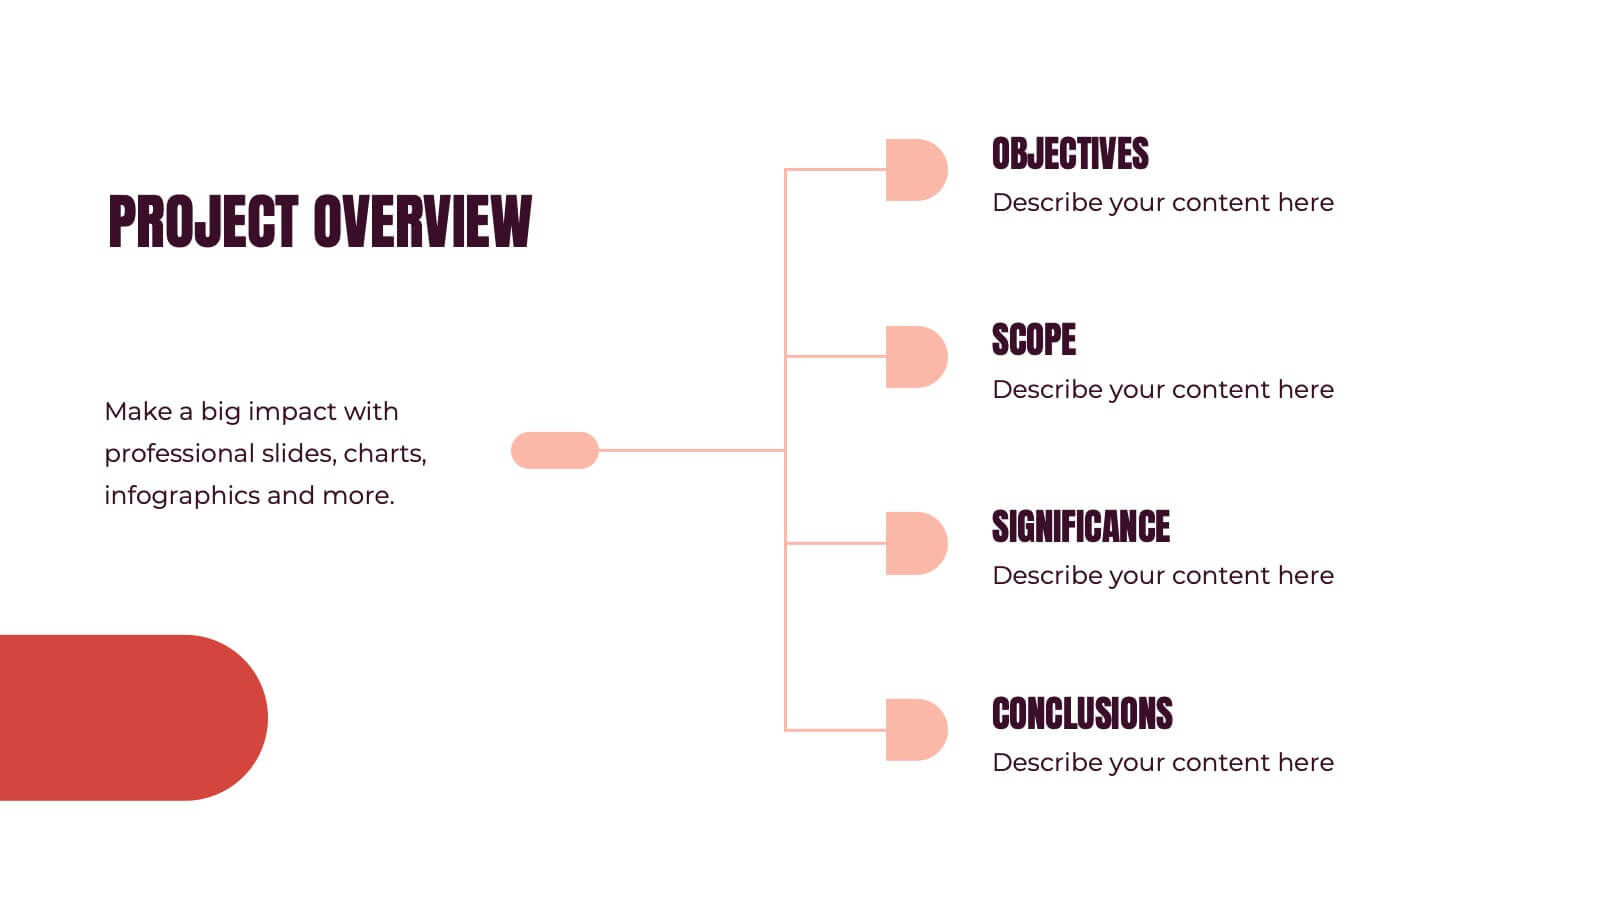
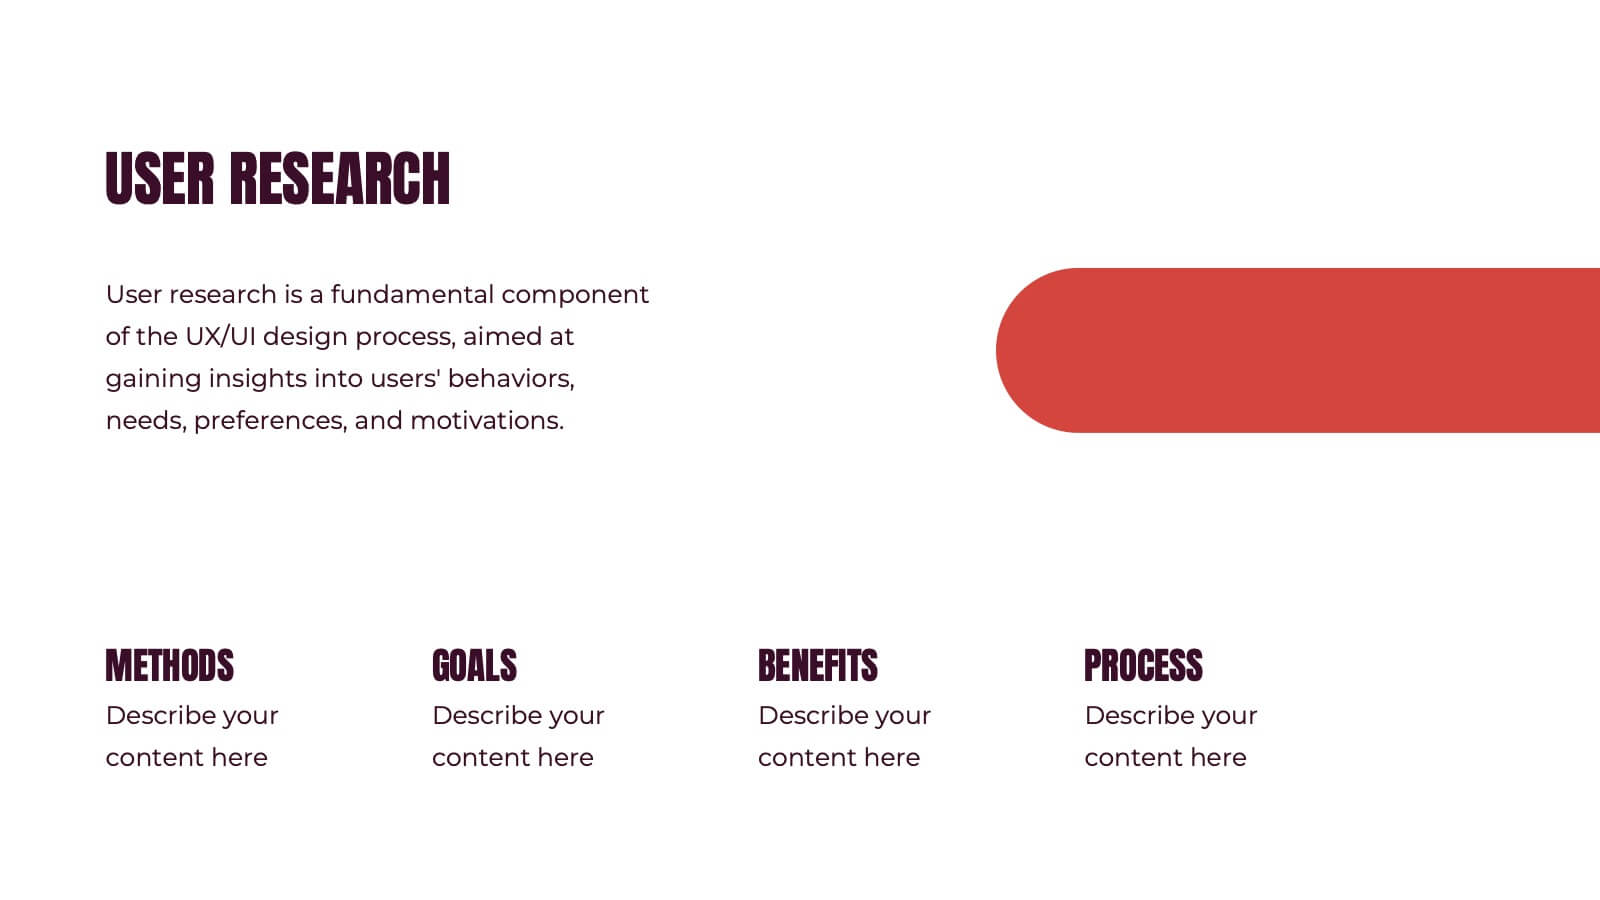
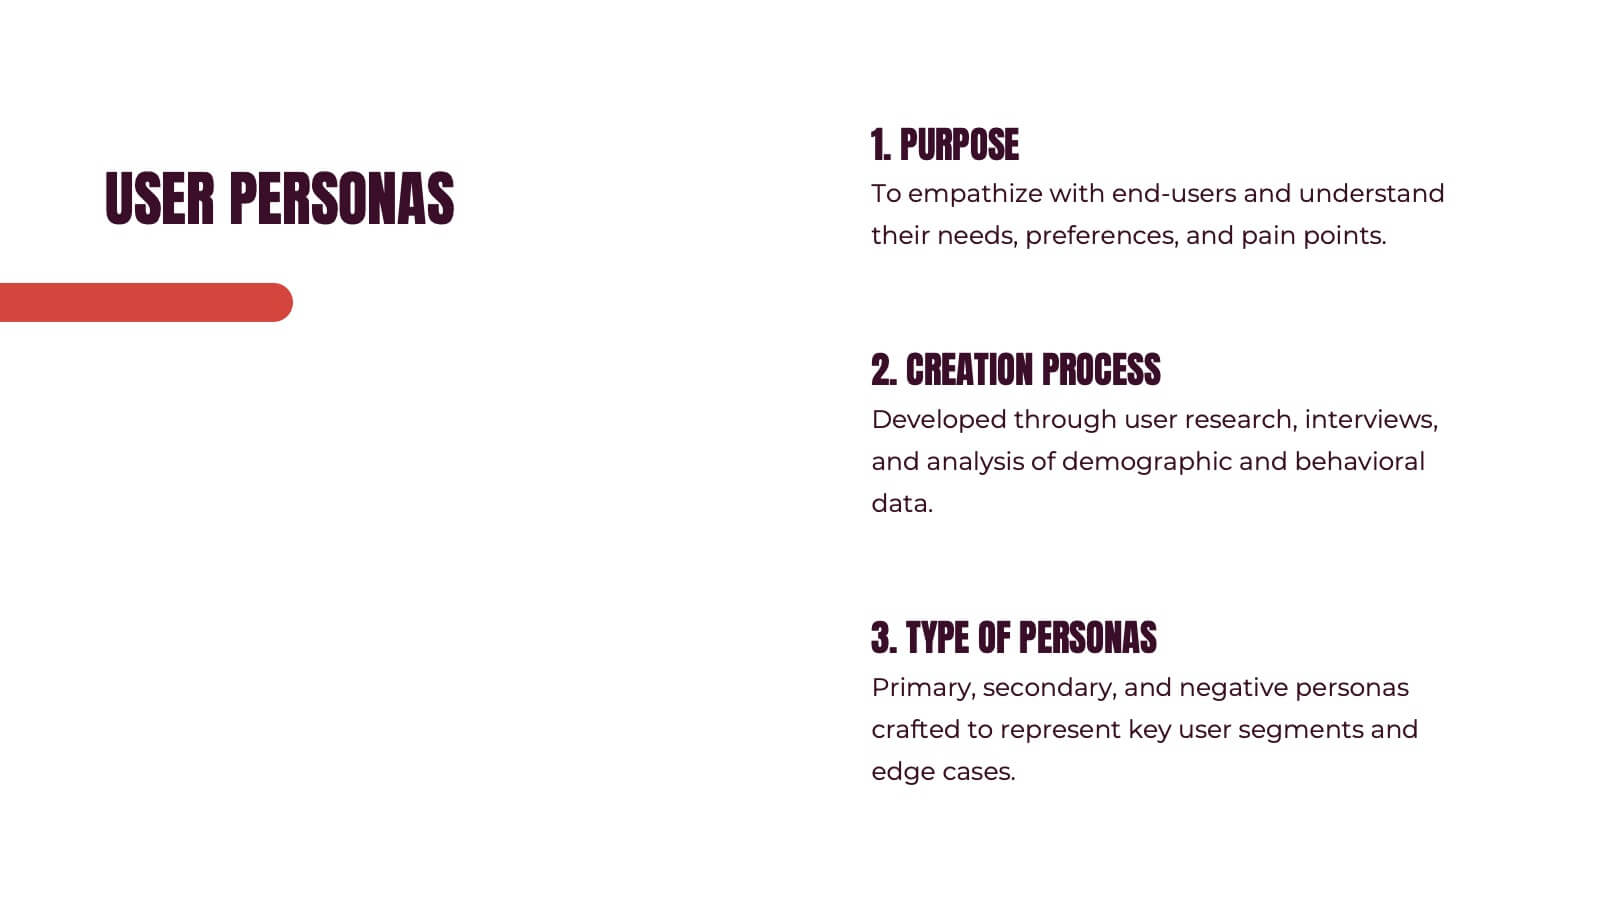
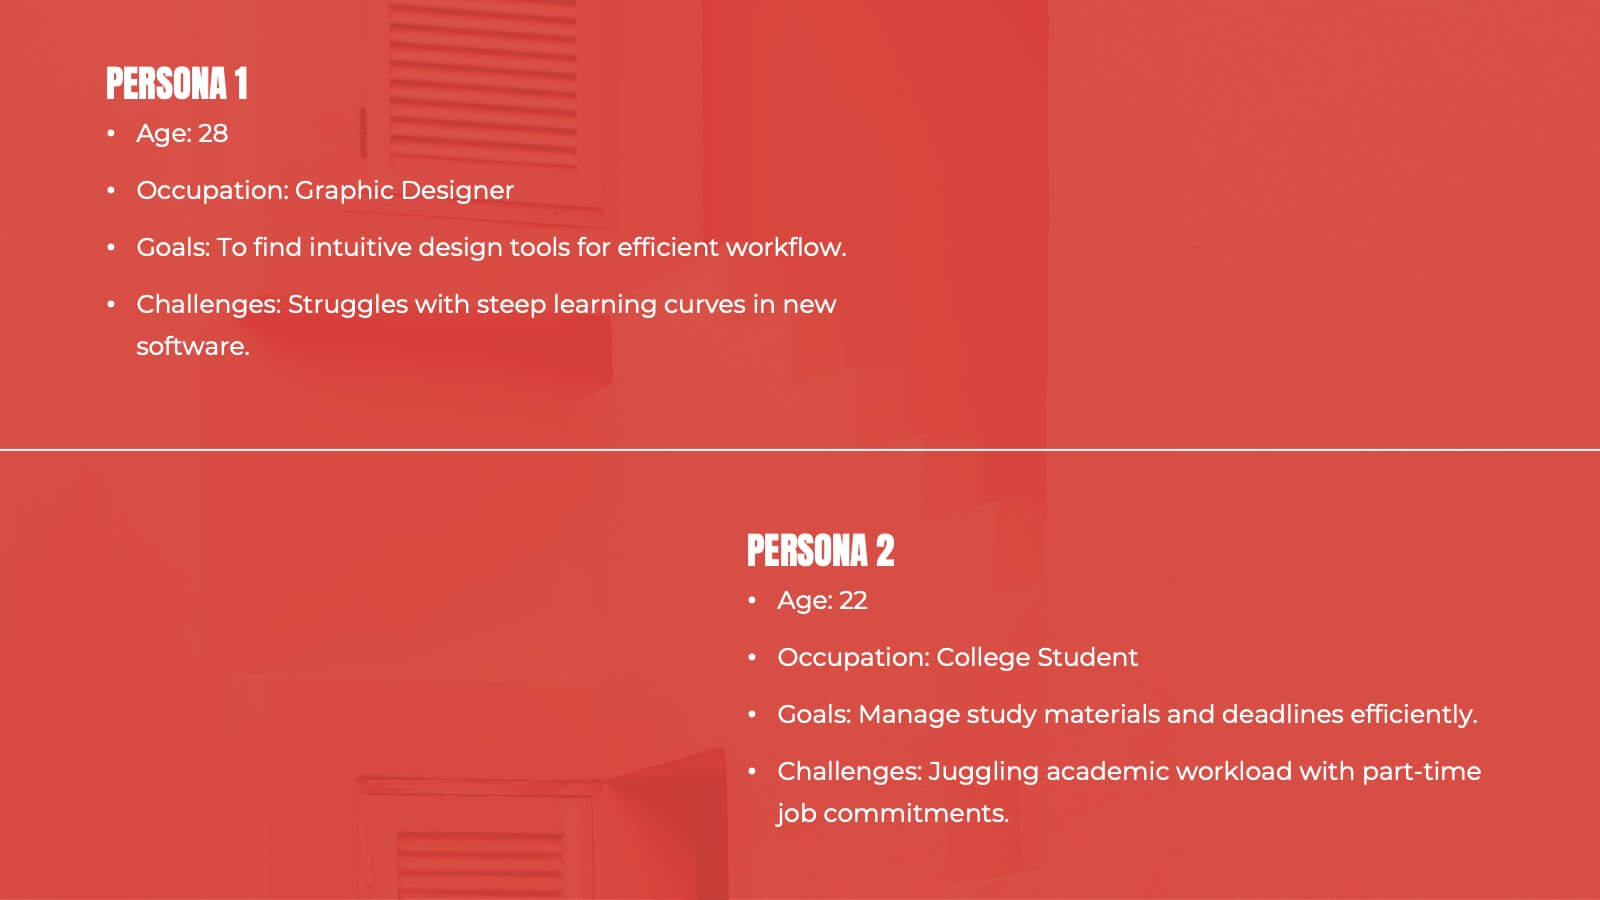
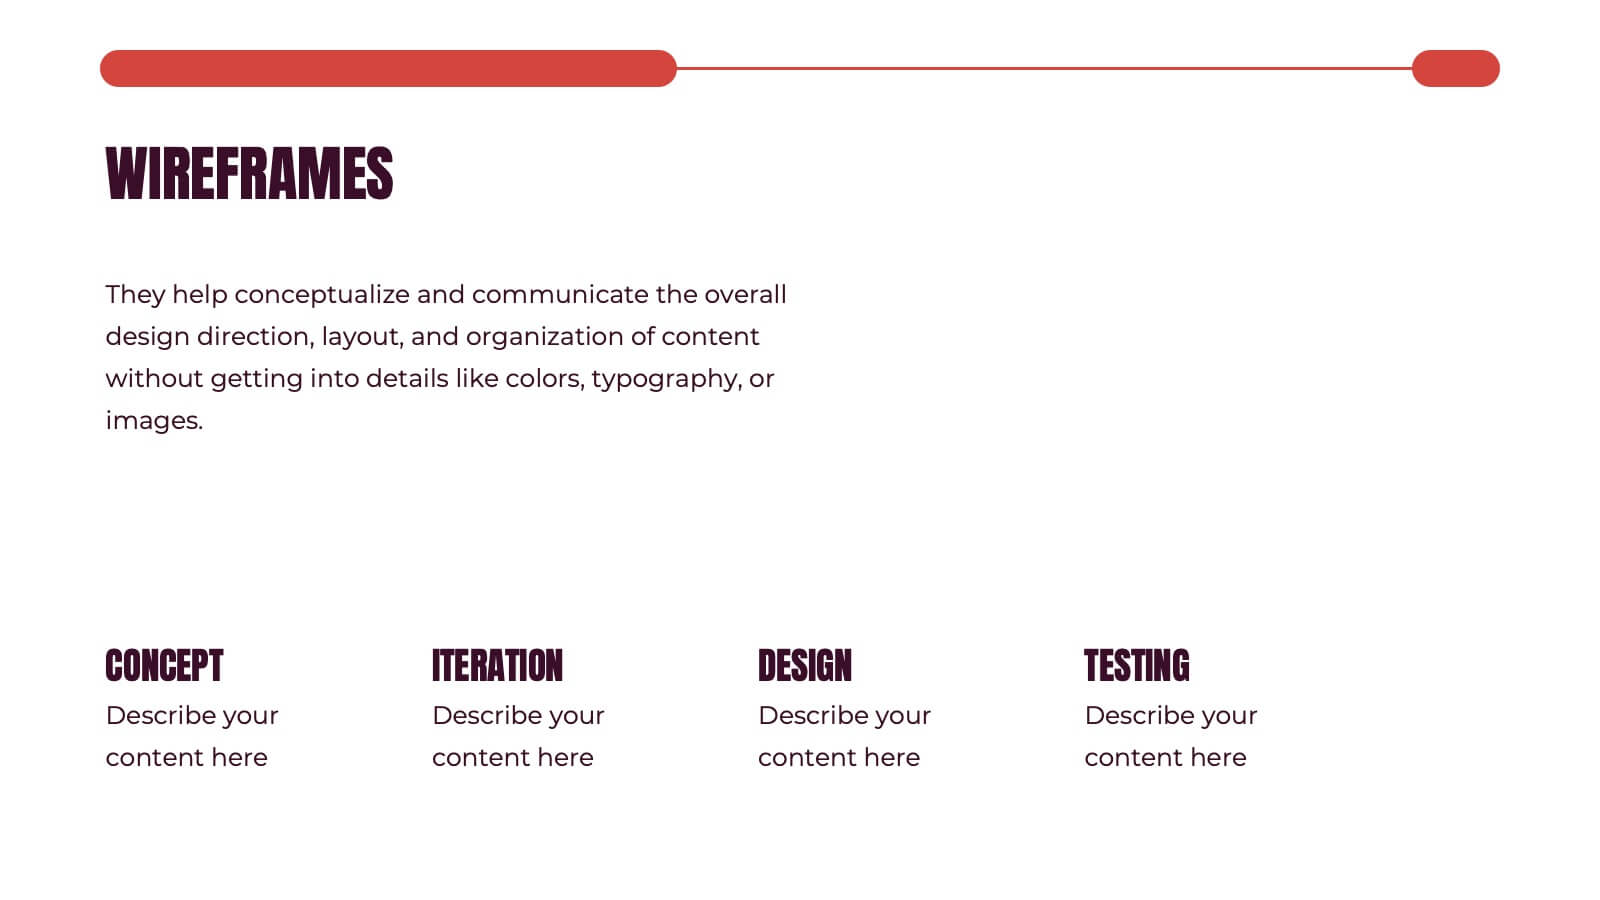
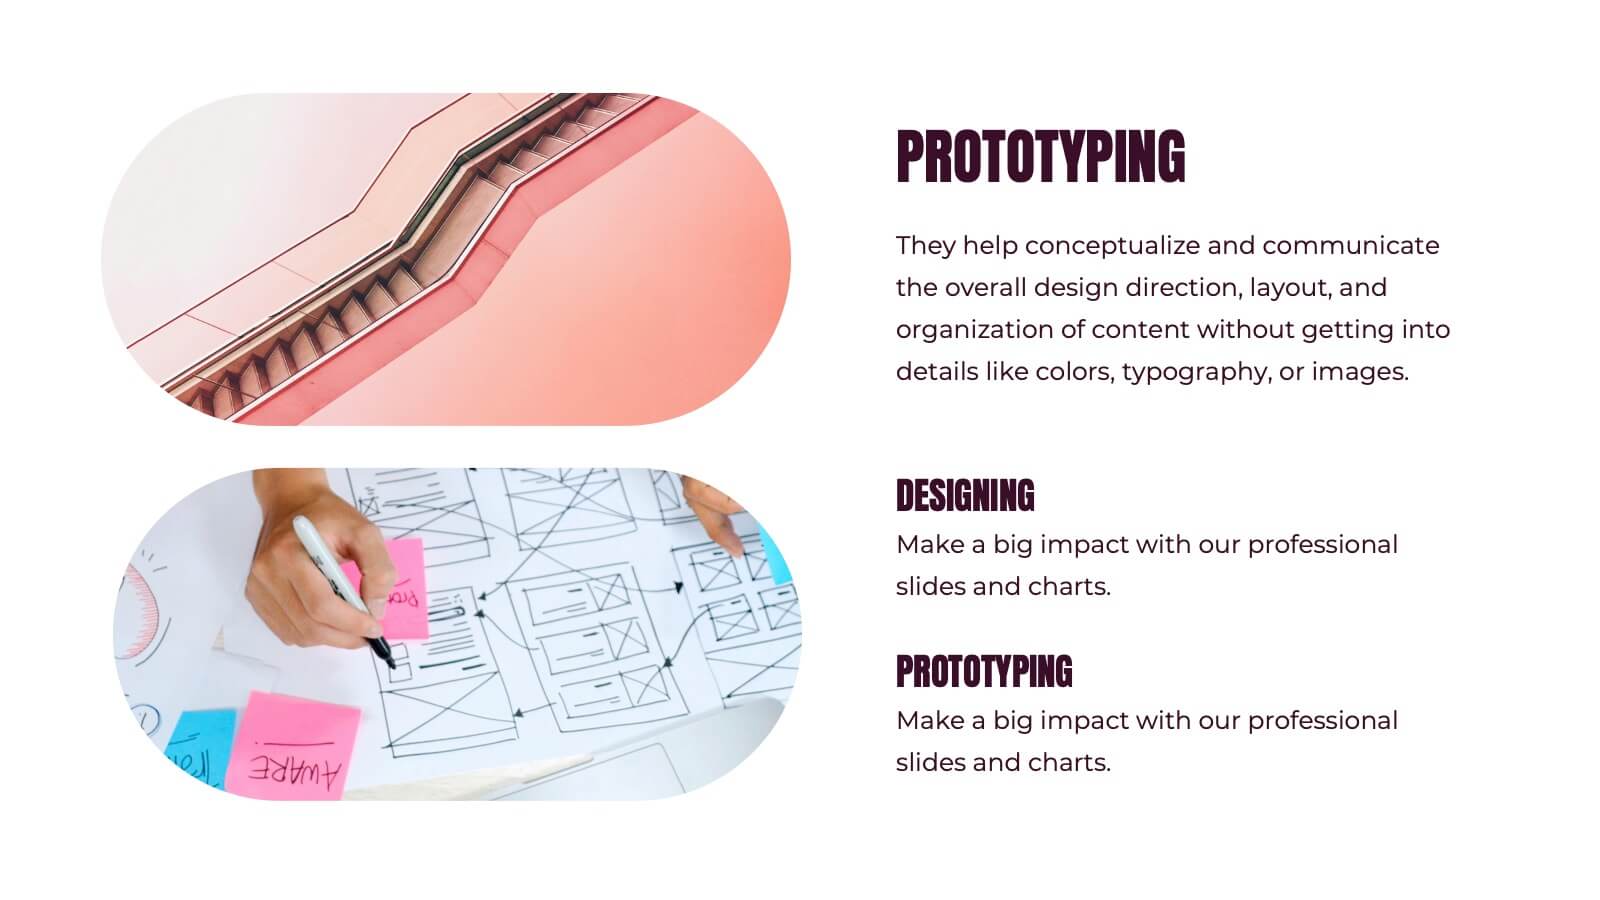
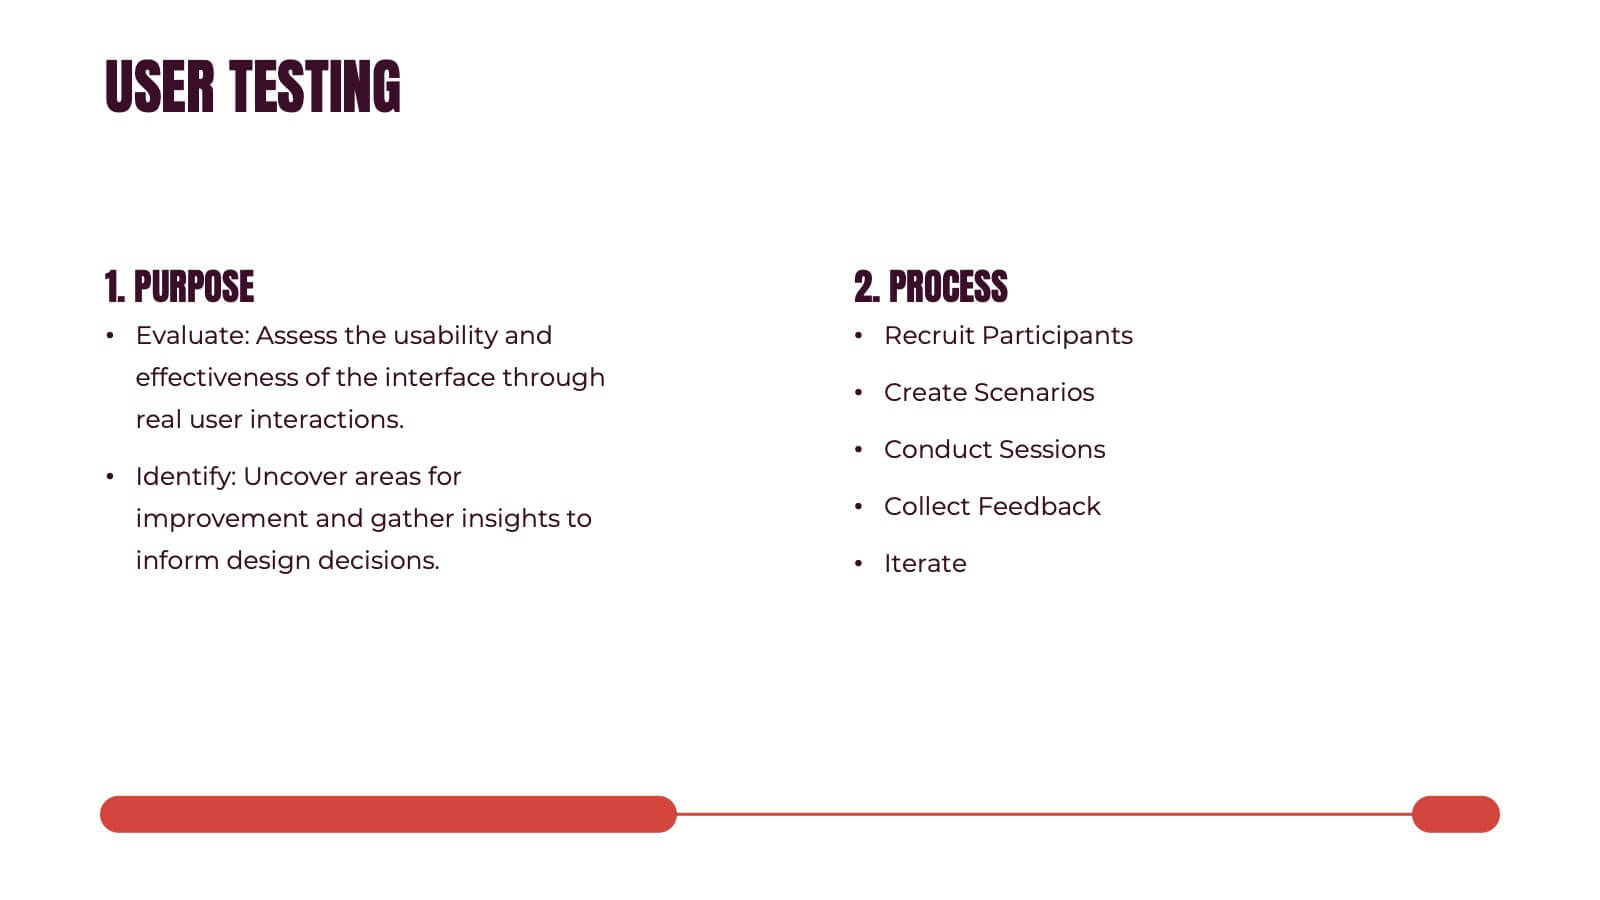
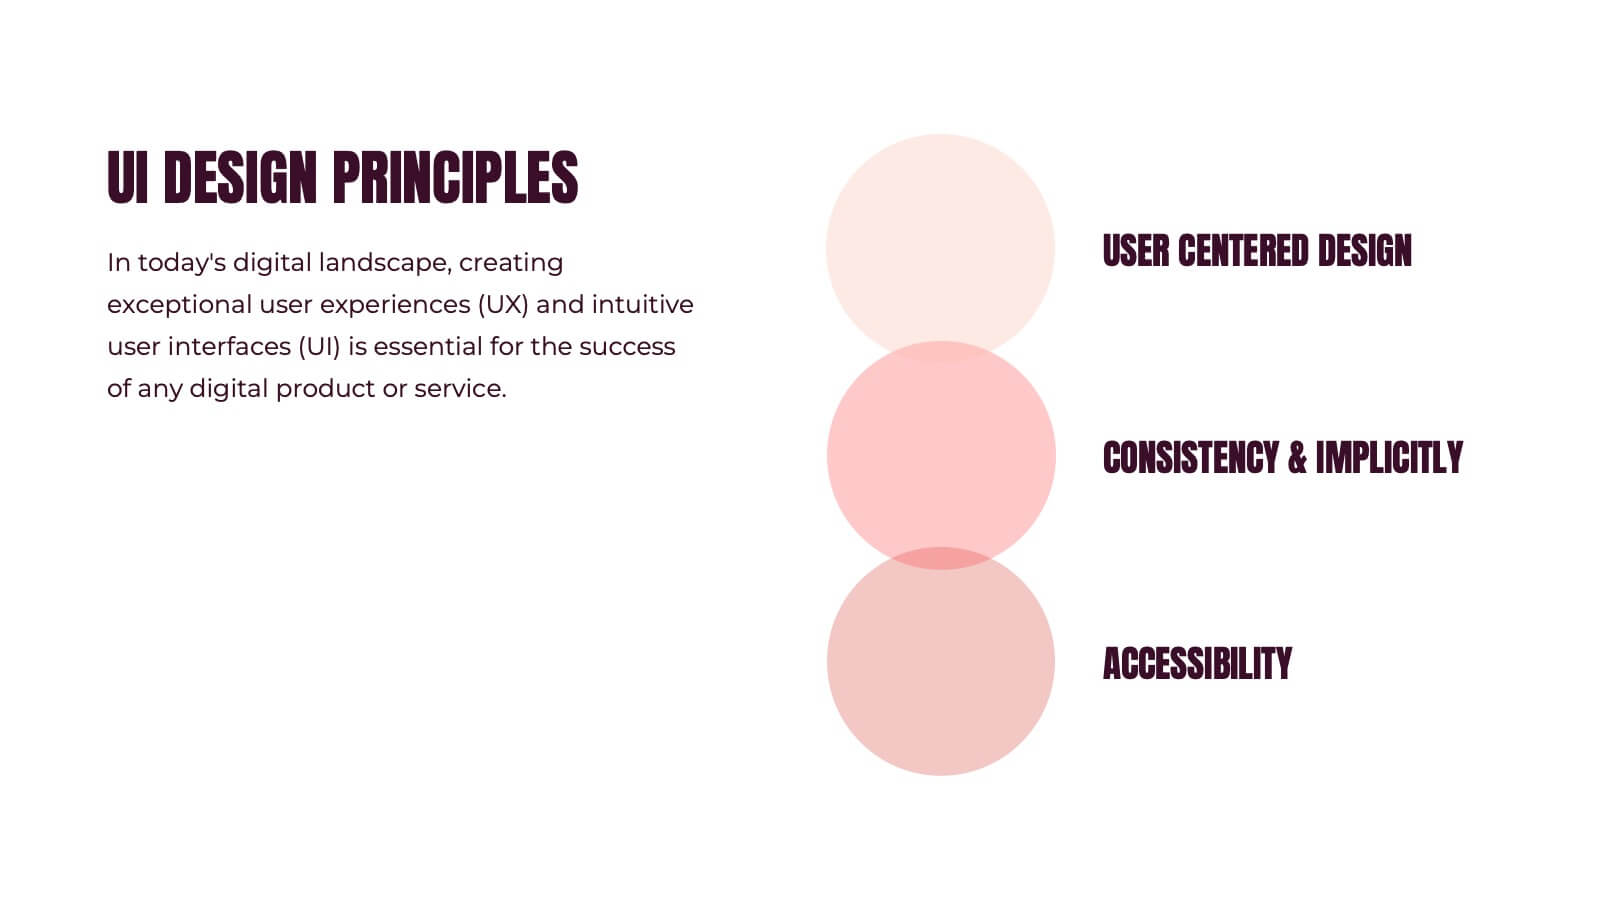
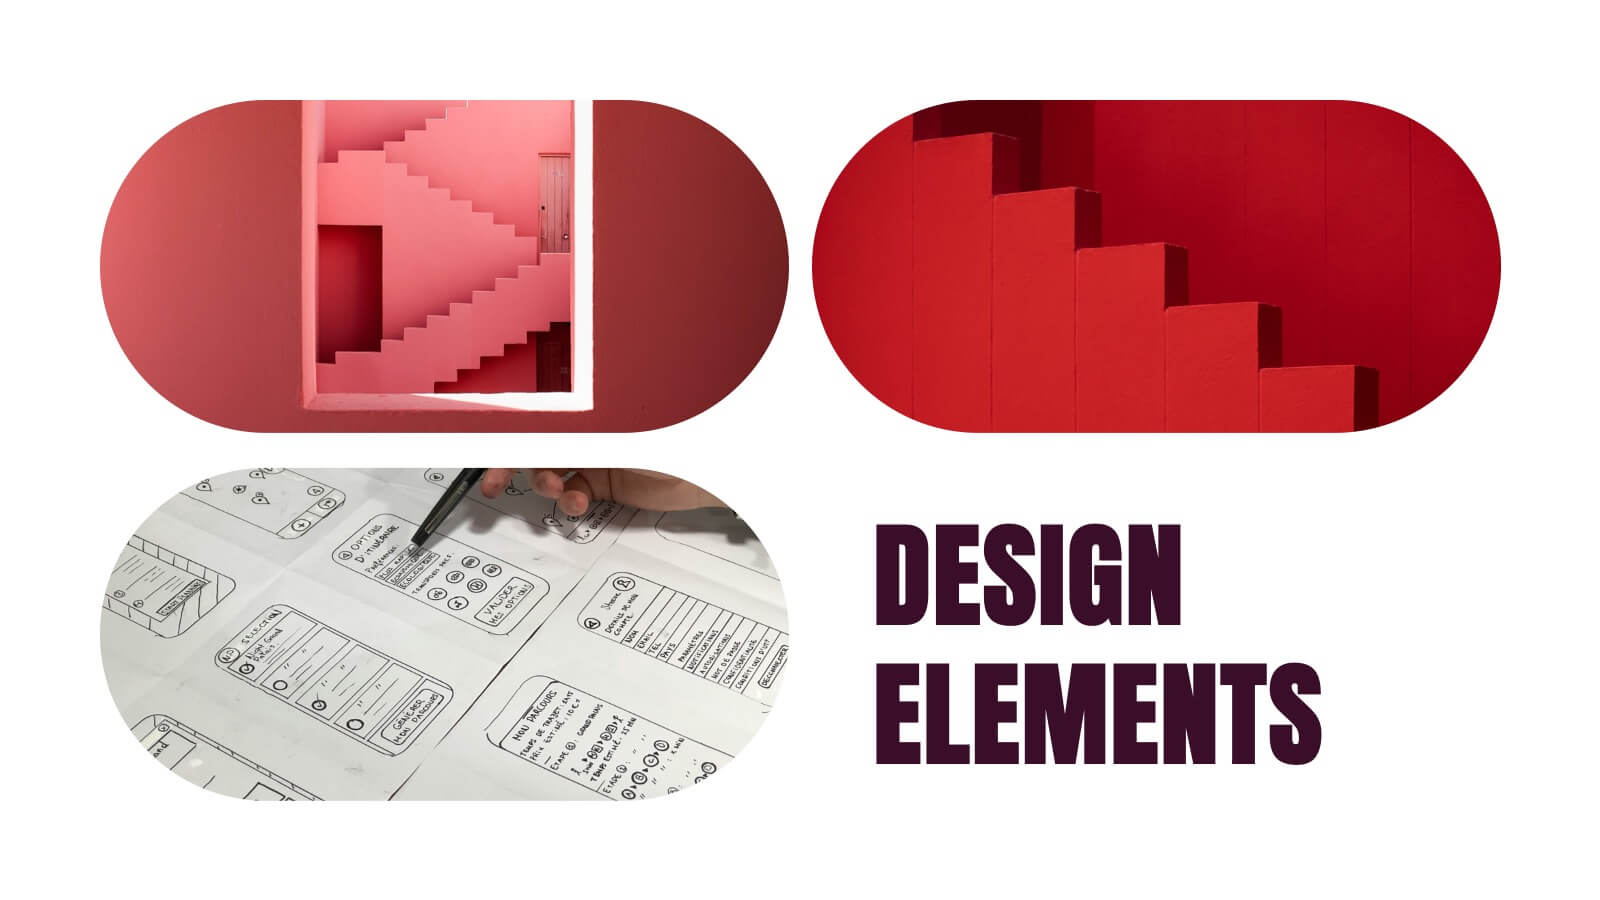
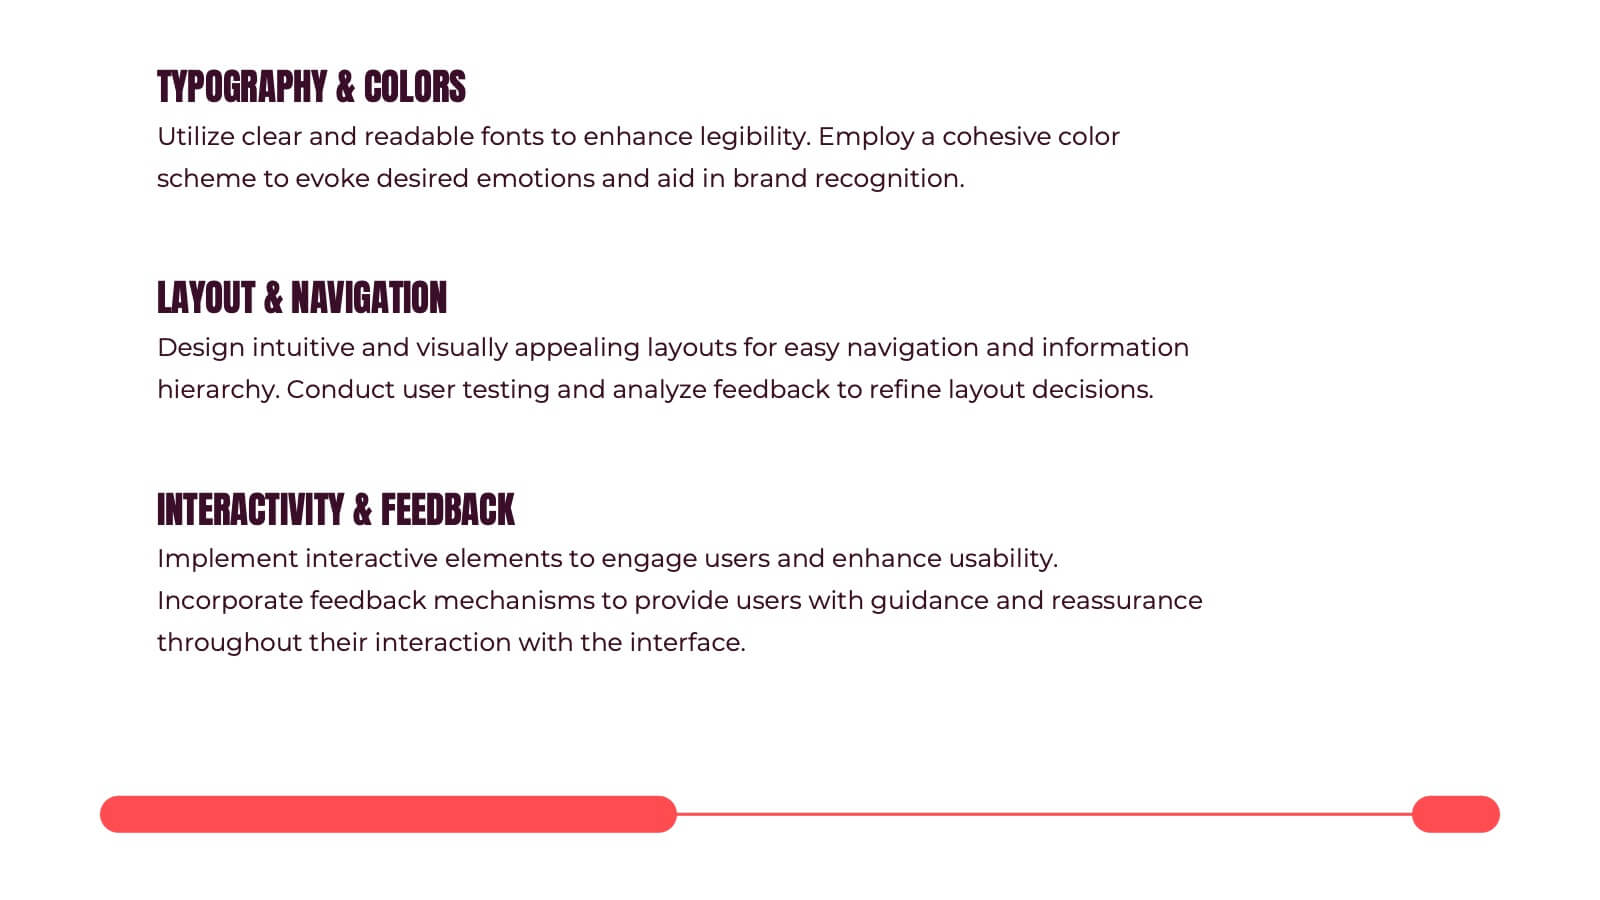
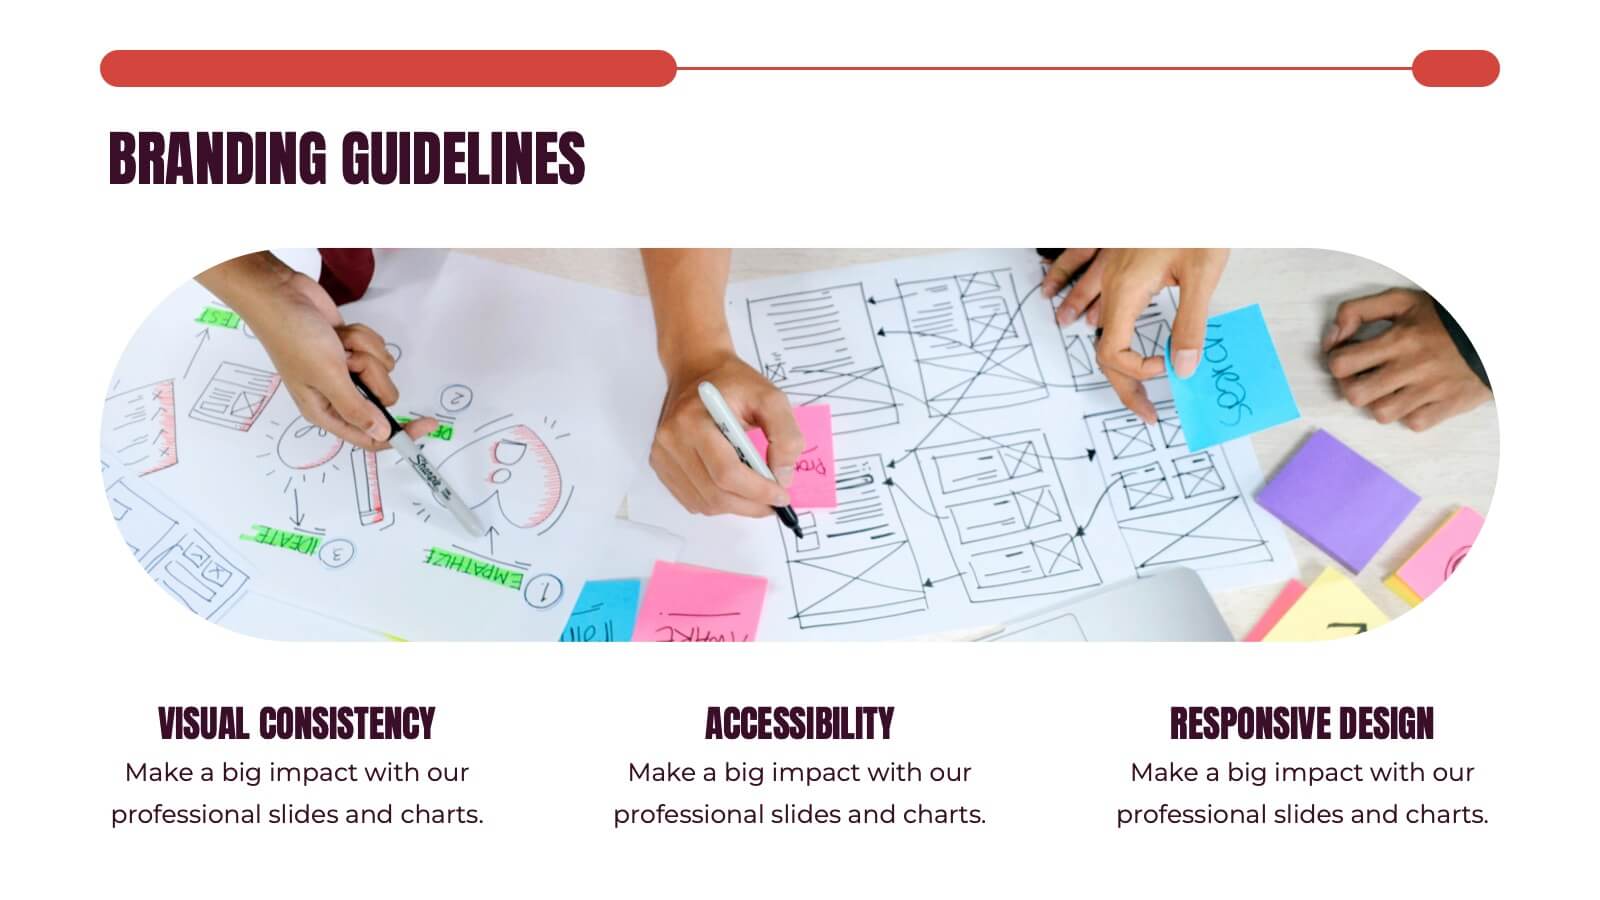
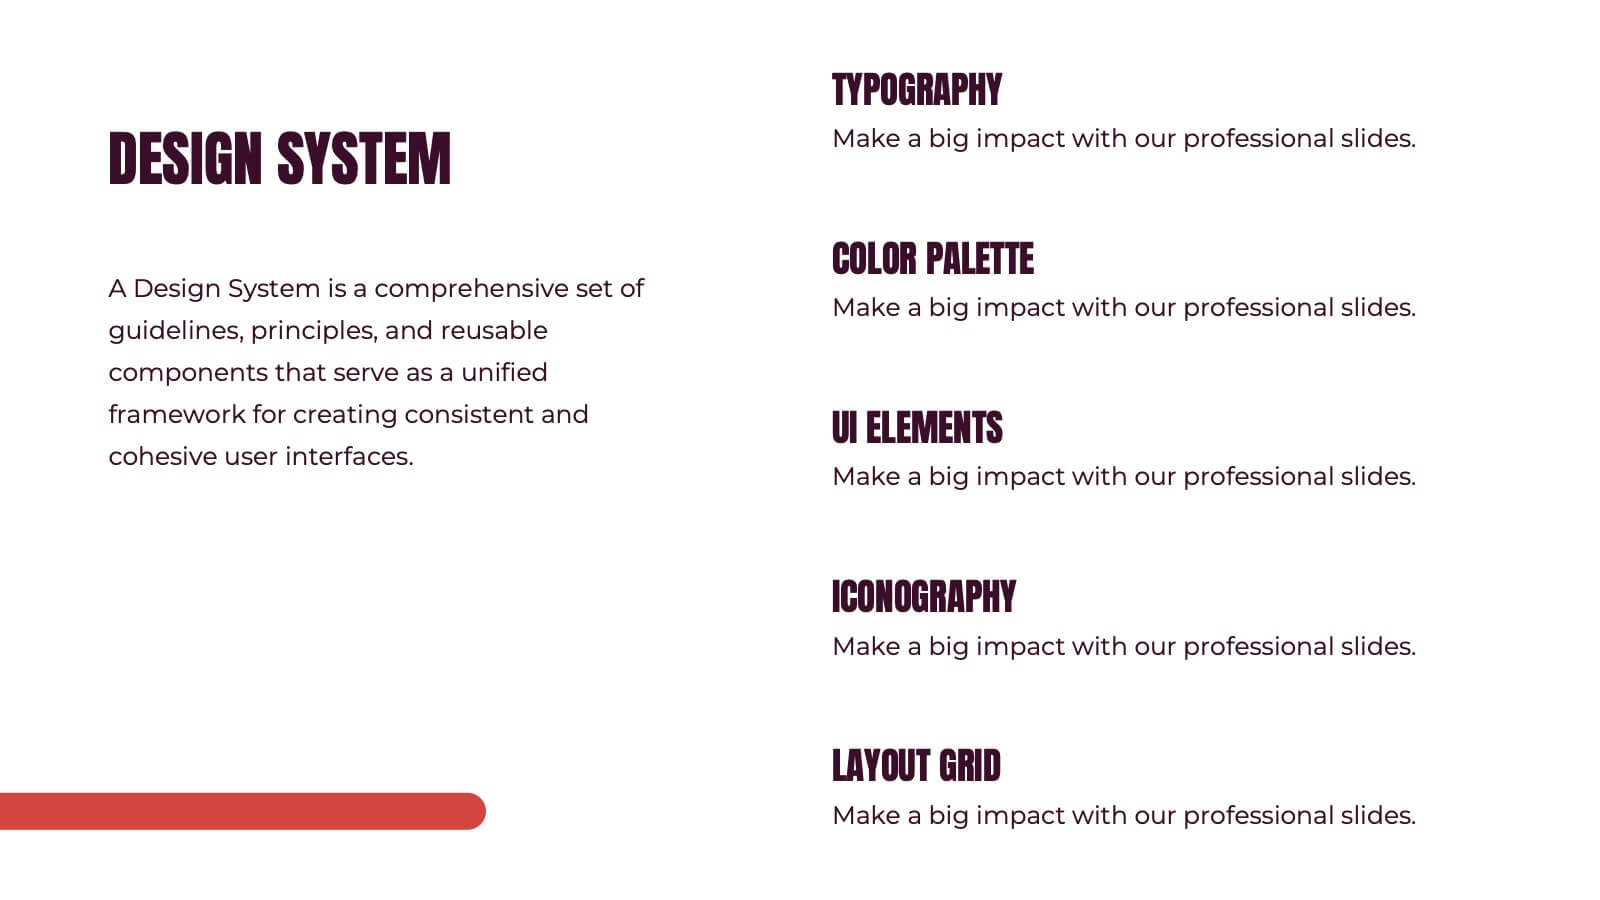
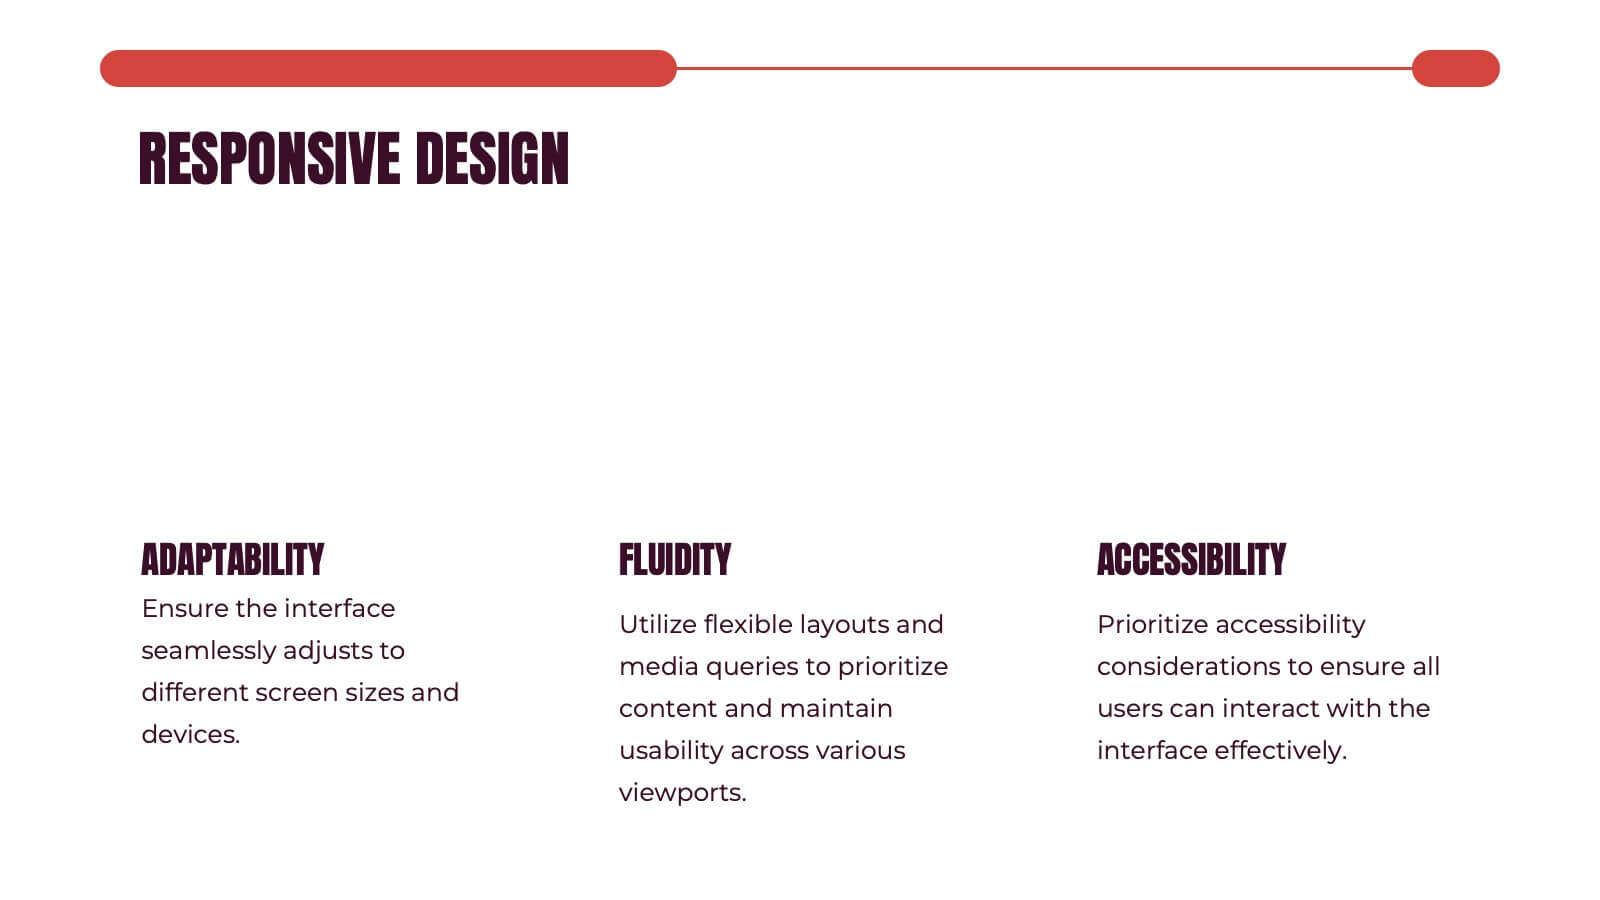
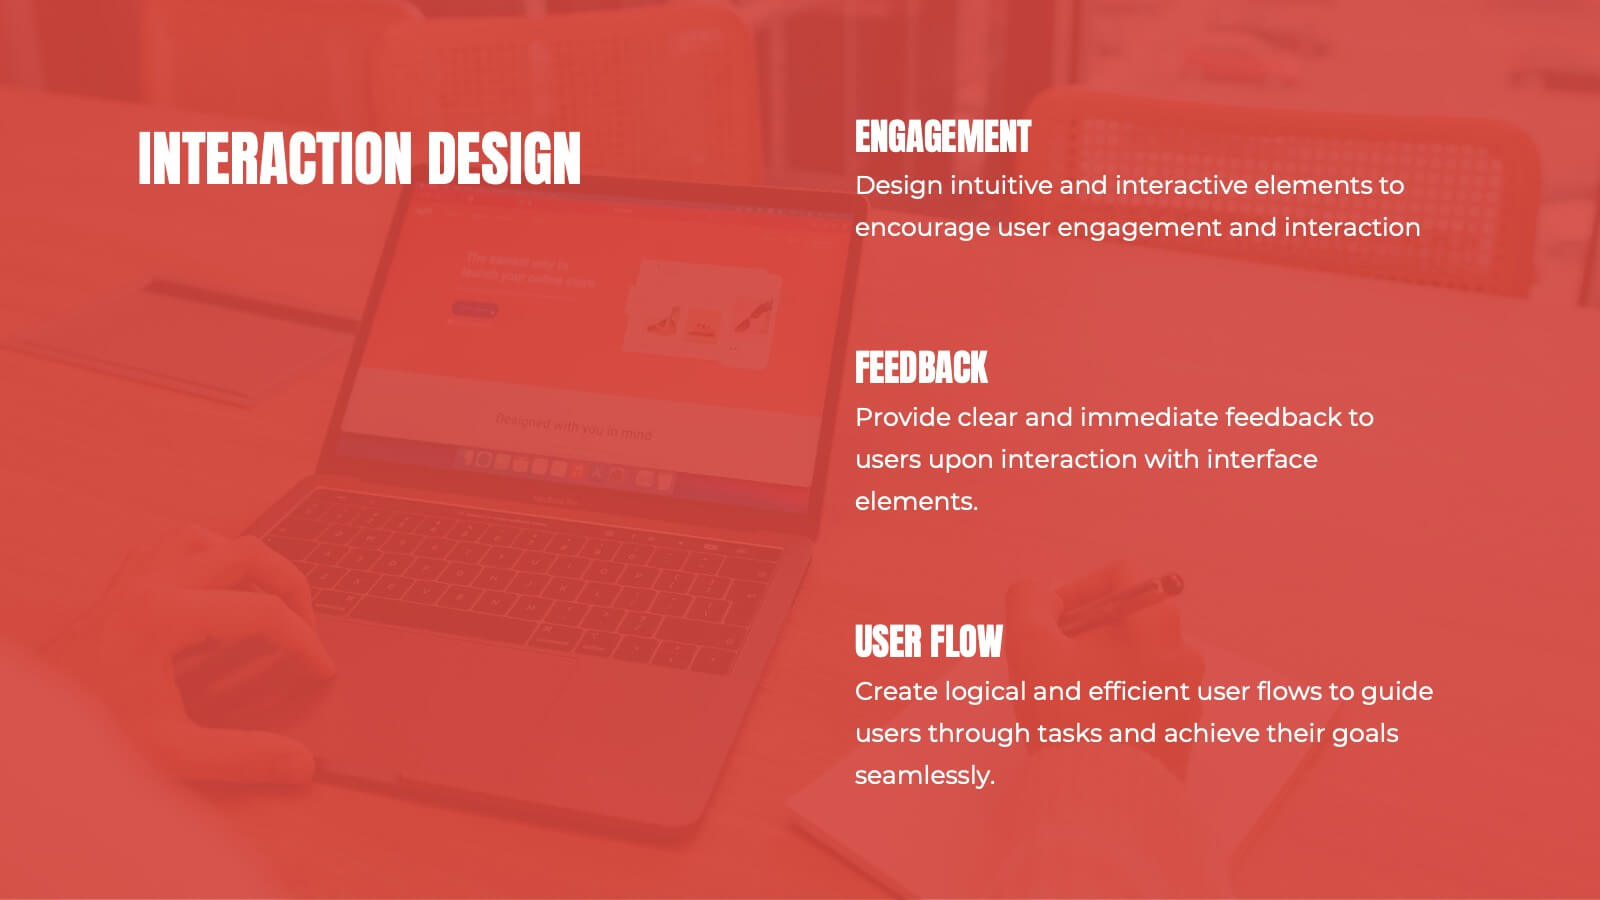
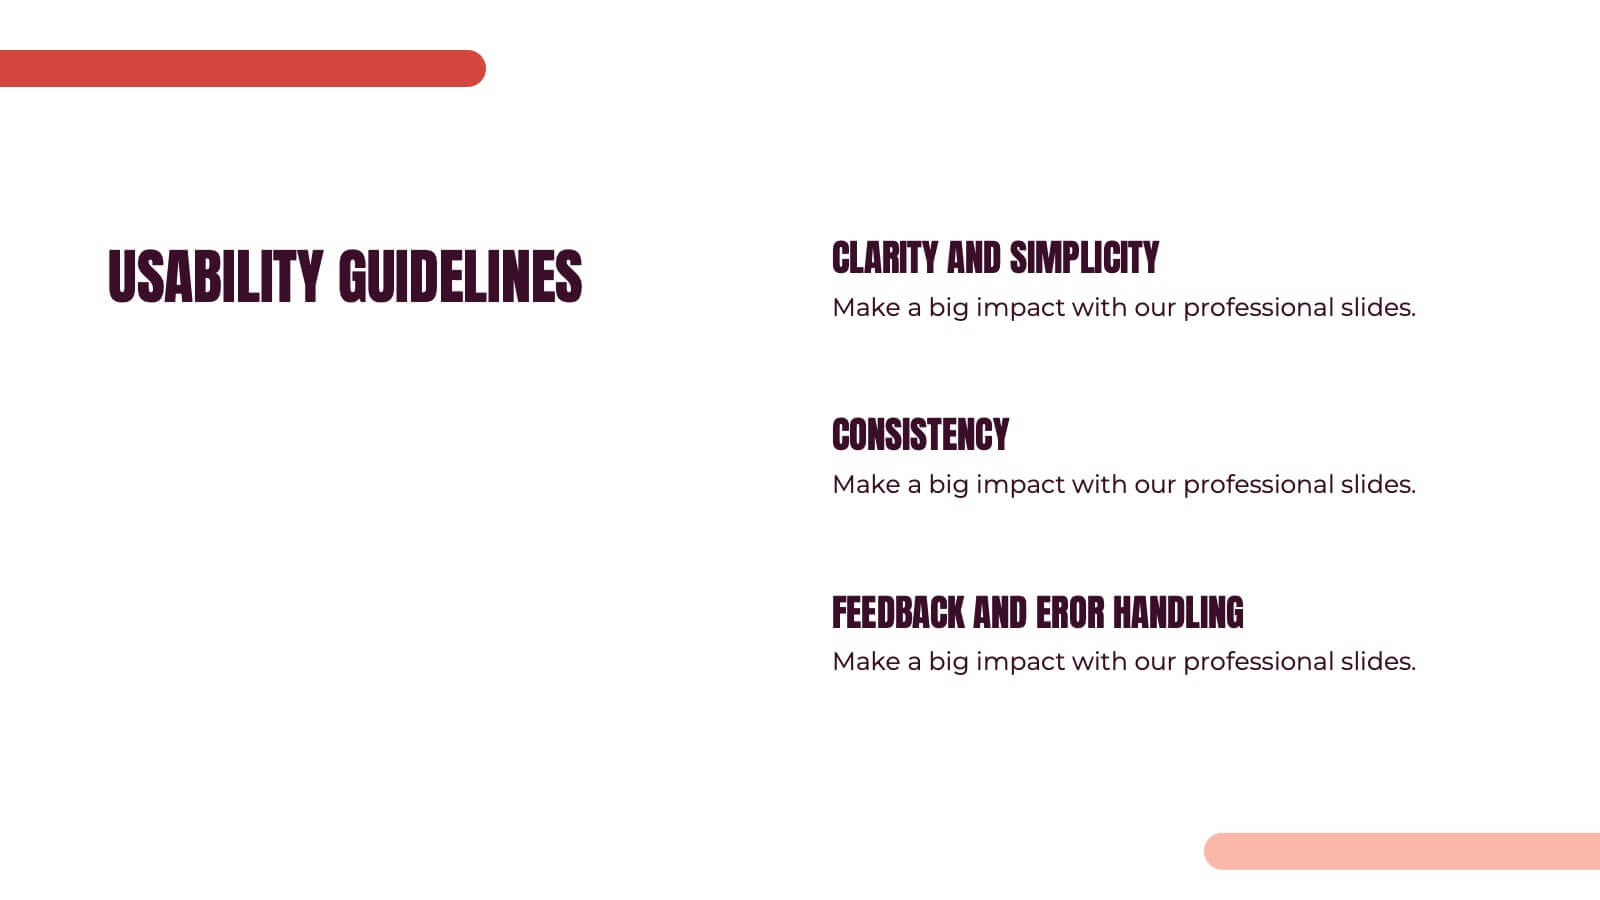
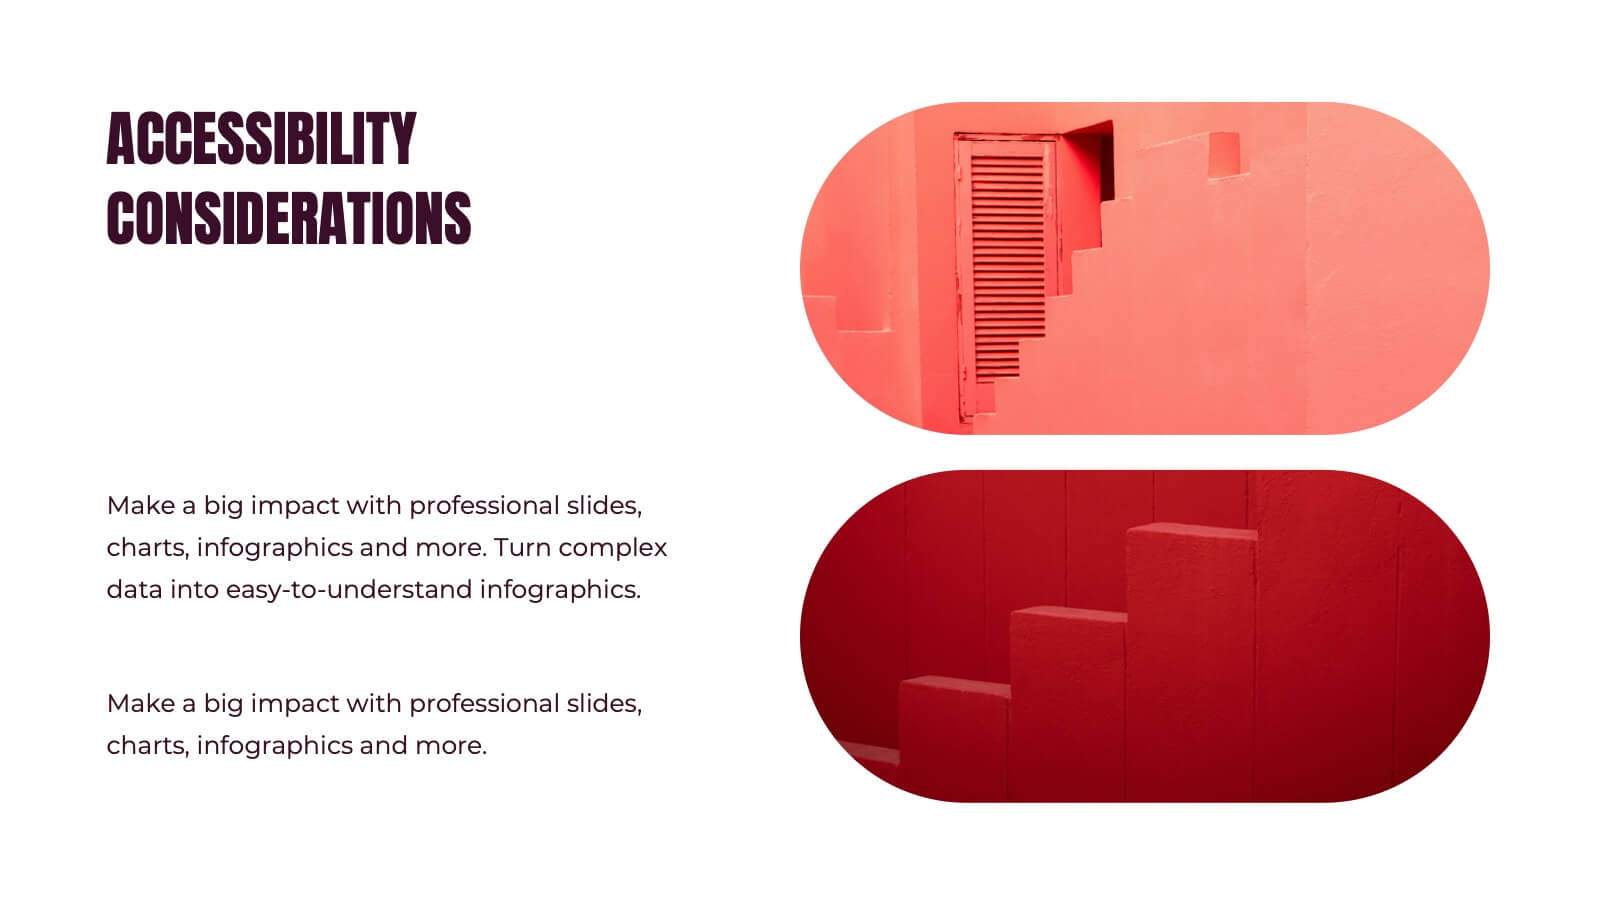
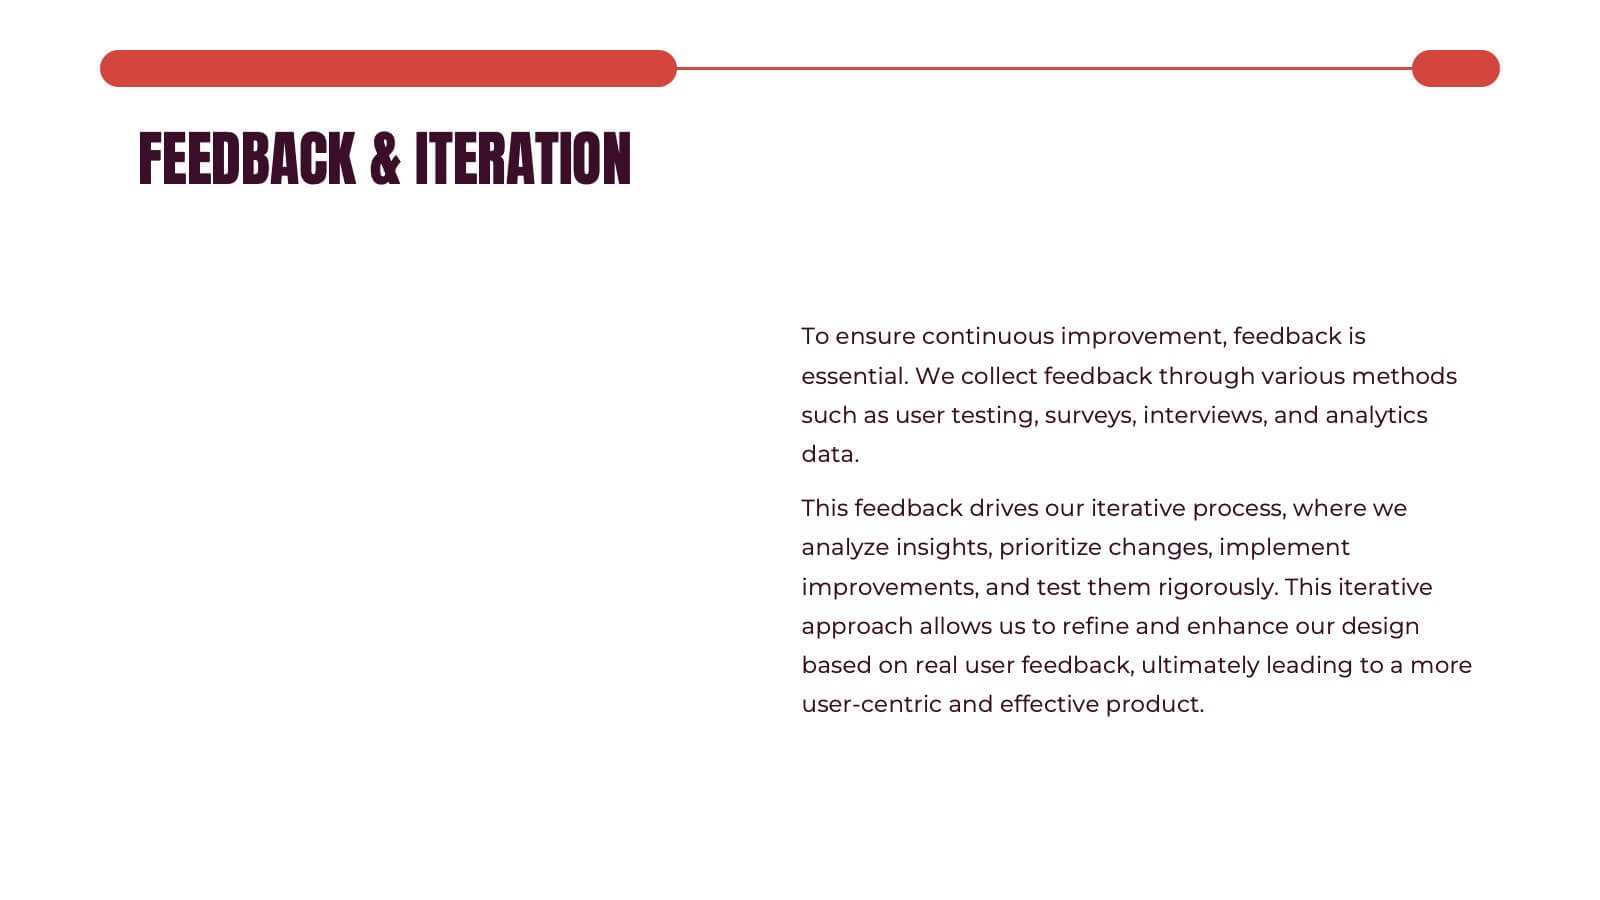
Kismet UX Design Presentation
Dive into the world of design with this stunning presentation template! Perfect for explaining user experience concepts, this template covers everything from wireframes to prototyping. It's designed to captivate your audience with visually engaging slides and clear, concise information. Compatible with PowerPoint, Keynote, and Google Slides for effortless use across platforms.


22 diapositivas
Jade Graphic Design Project Plan Presentation
Unleash creativity with this vibrant Graphic Design Project template! Perfect for showcasing your design process, prototypes, and assets, it keeps the audience captivated with clean visuals and a fresh, modern look. Whether you're outlining color palettes or final designs, every slide exudes style. Ideal for PowerPoint, Keynote, and Google Slides!


5 diapositivas
New Venture Pitch Deck Structure Presentation
Outline your pitch with clarity using the New Venture Pitch Deck Structure Presentation. Designed for startups and entrepreneurs, this vertical timeline layout helps you present key sections like business model, problem/solution, and go-to-market strategy. Fully editable in PowerPoint, Canva, and Google Slides to fit your branding needs.


4 diapositivas
Budget Projection with Predictive Analysis Presentation
Visualize future financial outcomes with clarity using the Budget Projection with Predictive Analysis Presentation. This modern funnel-style layout helps break down key stages of budget forecasting, making it easy to communicate progressions and data-driven insights. Perfect for financial planning, reporting, or strategic reviews. Fully editable in PowerPoint, Google Slides, Keynote, and Canva.


6 diapositivas
Psychology Mind Map Template Presentation
Unlock the brain’s potential with this smart and sleek visual! Perfect for organizing complex concepts, this mind map template helps you visualize psychological theories, thoughts, or data connections in a head-shaped layout using colored hexagons. Easily editable and professionally designed, it works seamlessly in PowerPoint, Keynote, and Google Slides.


21 diapositivas
Fablelight Digital Agency Strategy Plan Presentation
This sleek and modern presentation template is designed to effectively communicate a strategic plan for any professional agency. It includes sections for mission and vision, team structure, services offered, and a detailed creative process. Dive into market analysis, industry trends, and case studies to showcase expertise and success stories. Strategy development, campaign execution, and measurement analytics are highlighted to demonstrate goal-oriented planning. Client testimonials, partnerships, social impact initiatives, and awards provide credibility and enhance trust. Fully customizable and compatible with PowerPoint, Keynote, and Google Slides.


8 diapositivas
Impressive Business Metrics by Numbers
Highlight your company’s key wins with the Impressive Business Metrics by Numbers Presentation. This data-driven slide layout emphasizes three core metrics using bold numbering, modern icons, and clear titles—perfect for showcasing KPIs, milestones, or achievements. Ideal for reports, pitches, and performance reviews. Fully editable in PowerPoint, Keynote, and Google Slides.


8 diapositivas
Checklist and Action Item List
Bring order to your tasks with this modern checklist design, ideal for highlighting project milestones, team assignments, or key deliverables. Featuring three editable points with accompanying icons, this layout ensures clarity and professionalism in every update. Fully customizable in PowerPoint, Keynote, and Google Slides.