


Características


¿Tienes alguna pregunta?
Recomendar


8 diapositivas
Airline Business Strategy Presentation
Leverage key insights into the aviation sector with the "Aviation Industry Market Analysis" presentation template. This design allows professionals in the aviation industry to effectively communicate market trends and forecasts. Its compatibility with PowerPoint, Keynote, and Google Slides ensures a versatile use across different platforms, making it ideal for industry analyses, investor meetings, or internal strategy discussions.


5 diapositivas
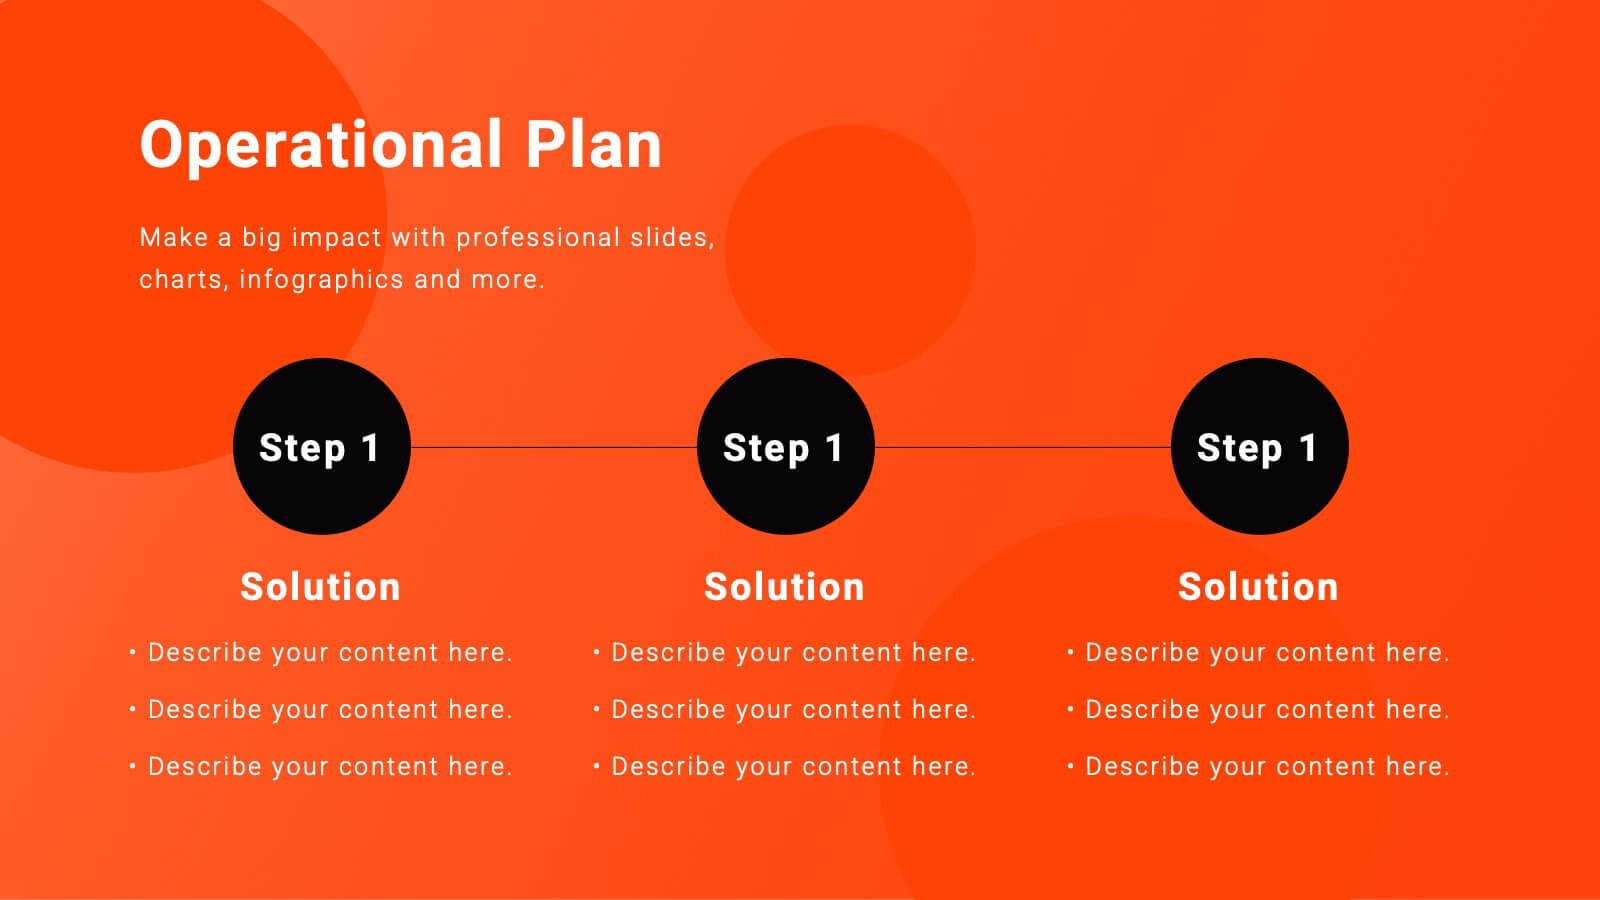
Messaging Strategy and Flow Presentation
Communicate with clarity using this streamlined messaging strategy and flow presentation template. Designed to visualize the stages of message planning—from audience segmentation to final delivery—this layout helps teams align communication goals and channels. Ideal for marketing, PR, or internal comms presentations. Fully compatible with PowerPoint, Keynote, and Google Slides.


6 diapositivas
5 Forces Model Business Analysis Presentation
Showcase your business insights with a bold, flowing design that makes each competitive force easy to compare and understand. This presentation helps you break down market pressures, highlight strategic opportunities, and communicate analysis with clarity and confidence. Fully editable and compatible with PowerPoint, Keynote, and Google Slides.


2 diapositivas
Creative Title Slide Presentation
Bring your audience in with a burst of personality using this bold, playful cover-style presentation slide. Designed to spotlight a creative message, it uses vibrant shapes and striking color to set an energetic tone while keeping your title front-and-center. Fully compatible with PowerPoint, Keynote, and Google Slides.


8 diapositivas
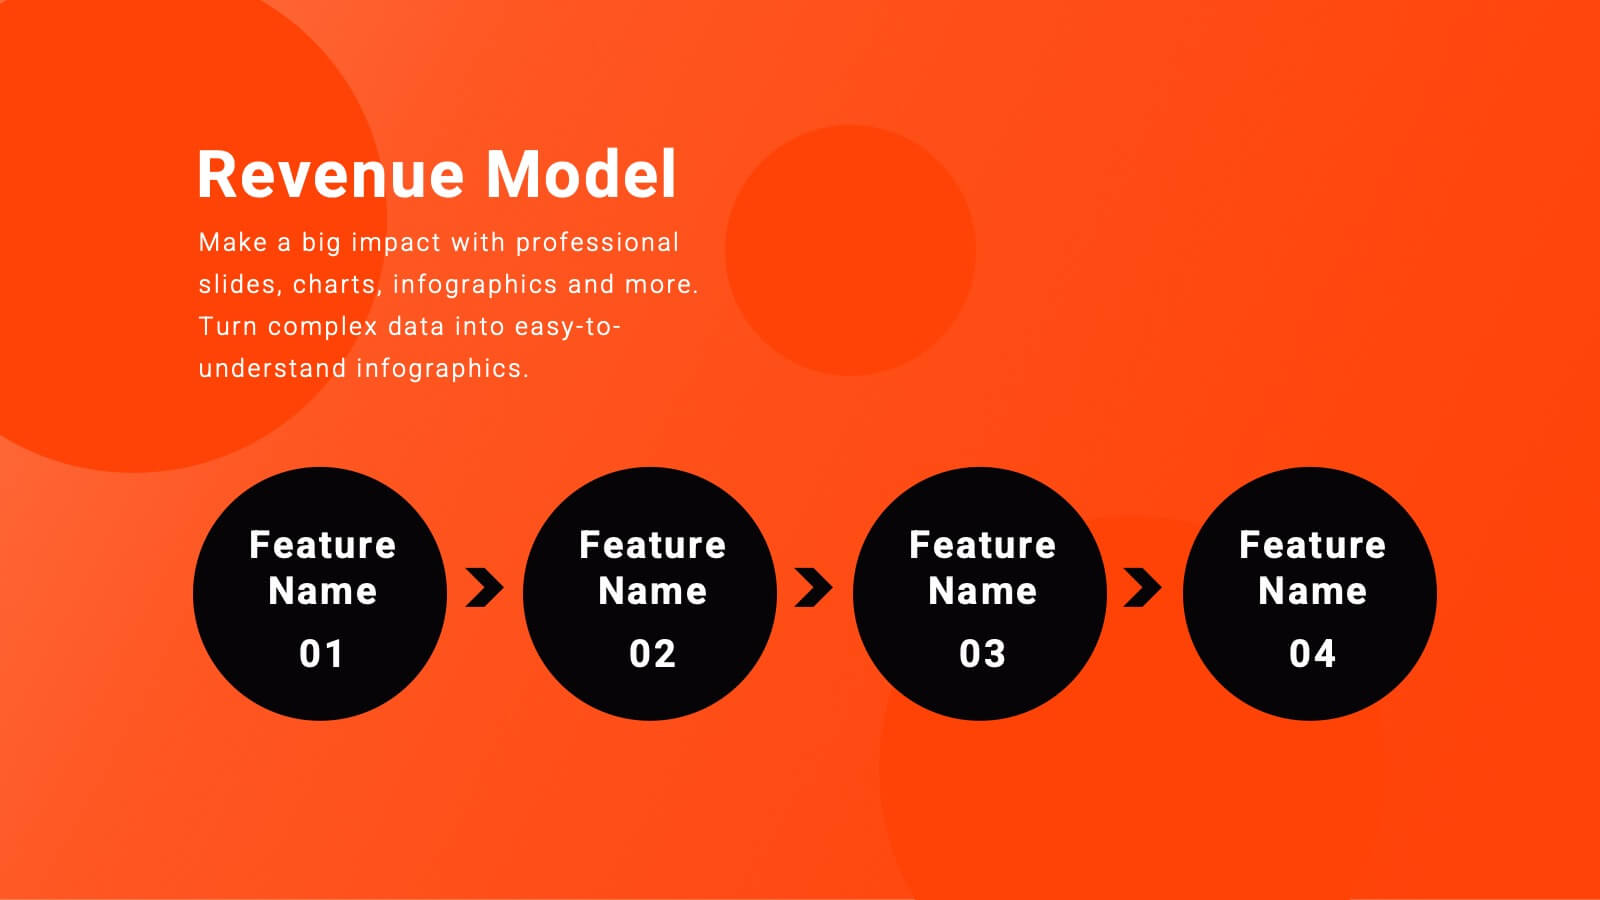
AI Trends and Future Technology Presentation
Step into the future with this sleek, modern template designed to visualize cutting-edge concepts in artificial intelligence. Featuring futuristic robot graphics and a clean circular flow layout, this design is perfect for showcasing tech trends, automation strategies, or AI-driven innovations. Each section is color-coded and icon-supported for easy customization. Ideal for tech startups, AI researchers, and innovation consultants. Fully editable in PowerPoint, Keynote, and Google Slides.


4 diapositivas
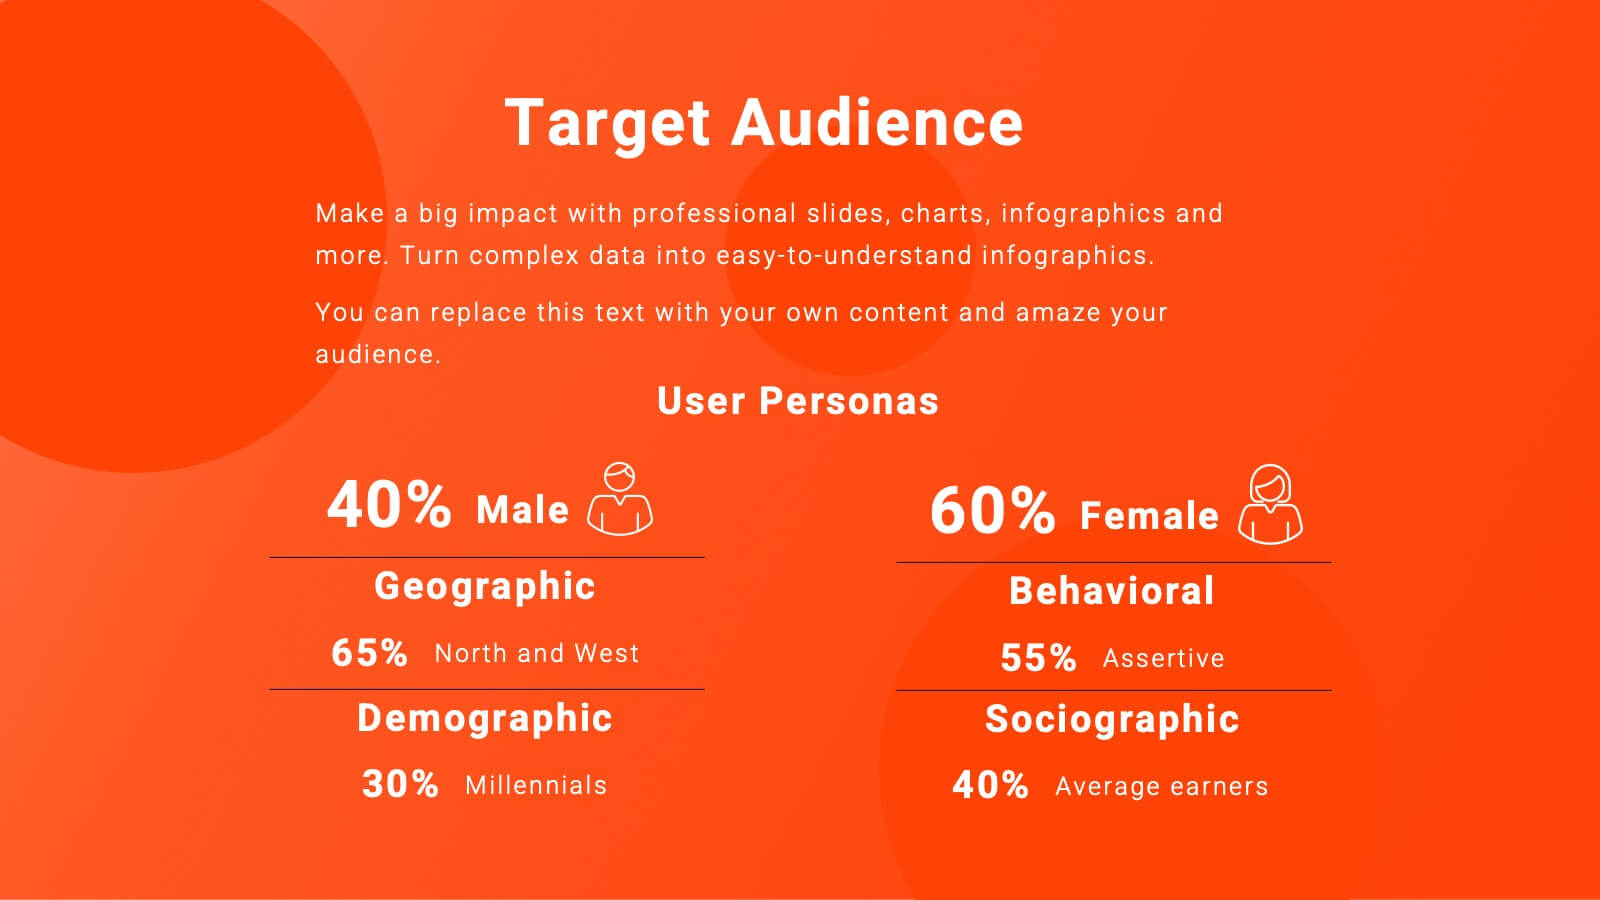
Customer Buyer Persona Profile Presentation
Bring your audience into the mind of your ideal customer with a clean, story-driven layout that highlights demographics, motivations, and everyday habits. This presentation helps you communicate who you’re targeting and why it matters, creating clarity for marketing and product teams. Fully compatible with PowerPoint, Keynote, and Google Slides.


7 diapositivas
One-Page Startup Model Canvas
Launch and refine your business idea with clarity using the One-Page Startup Model Canvas Presentation. This slide presents all key startup elements—Partners, Activities, Value Propositions, Customer Segments, Revenue Streams, and more—in a smart puzzle-piece layout that simplifies complex planning. Perfect for founders and pitch decks. Fully customizable in PowerPoint, Keynote, and Google Slides.


6 diapositivas
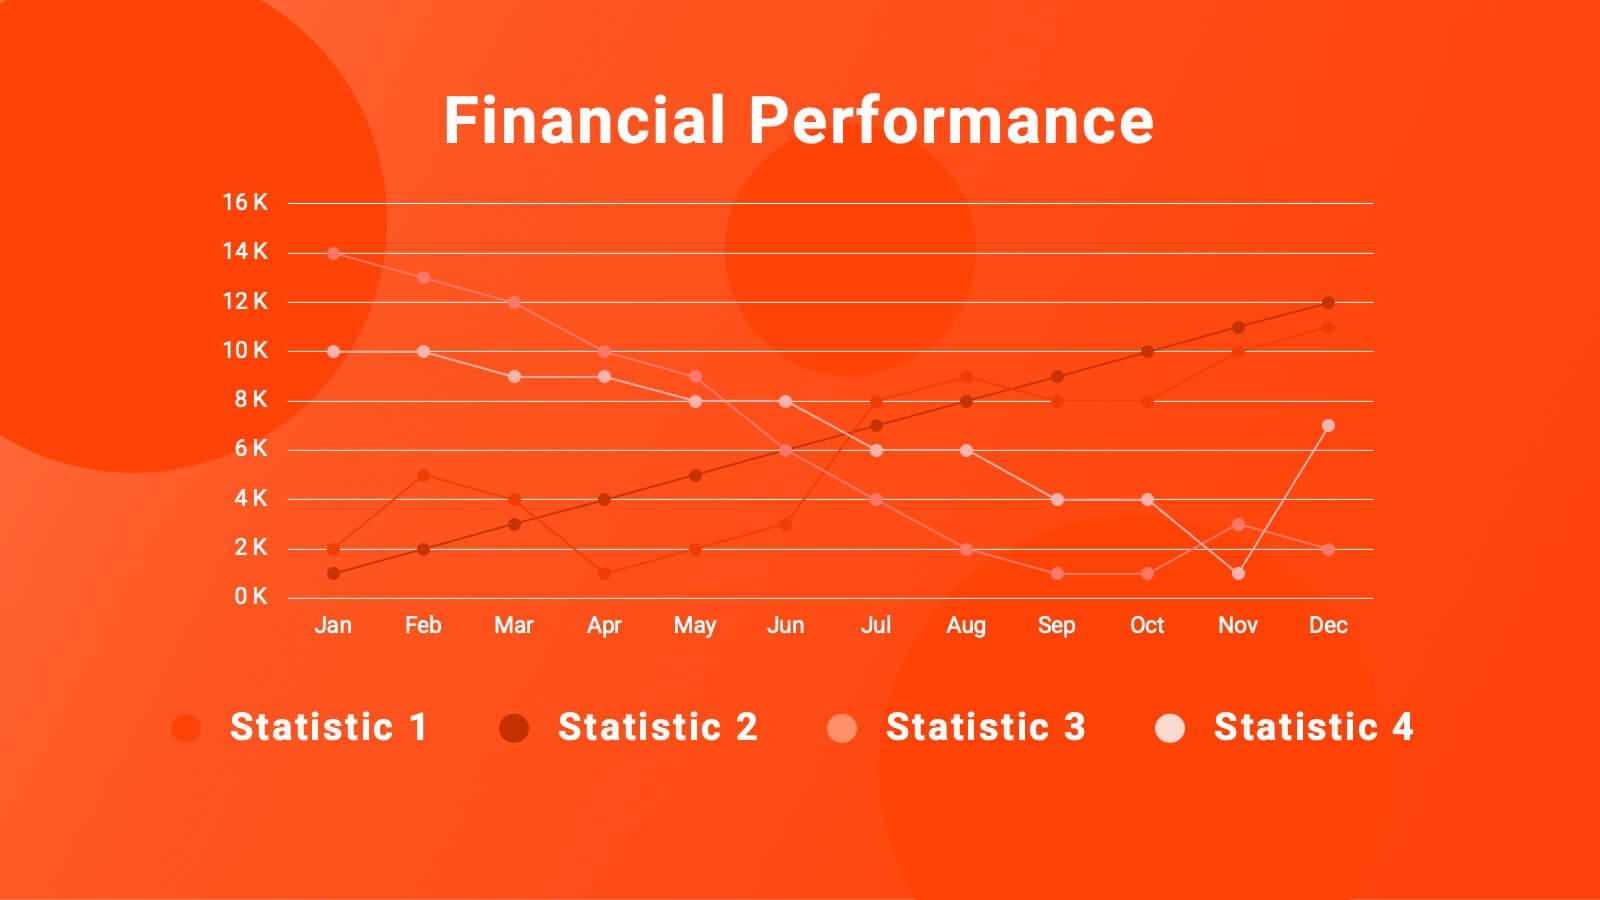
Financial Health Overview Dashboard Presentation
Simplify financial reporting with this Financial Health Overview Dashboard. Designed for analysts, executives, and consultants, it features a visual summary of key metrics and performance insights. Fully editable with icon placeholders and balanced layout. Ideal for PowerPoint, Keynote, and Google Slides presentations that demand clarity in financial storytelling.


5 diapositivas
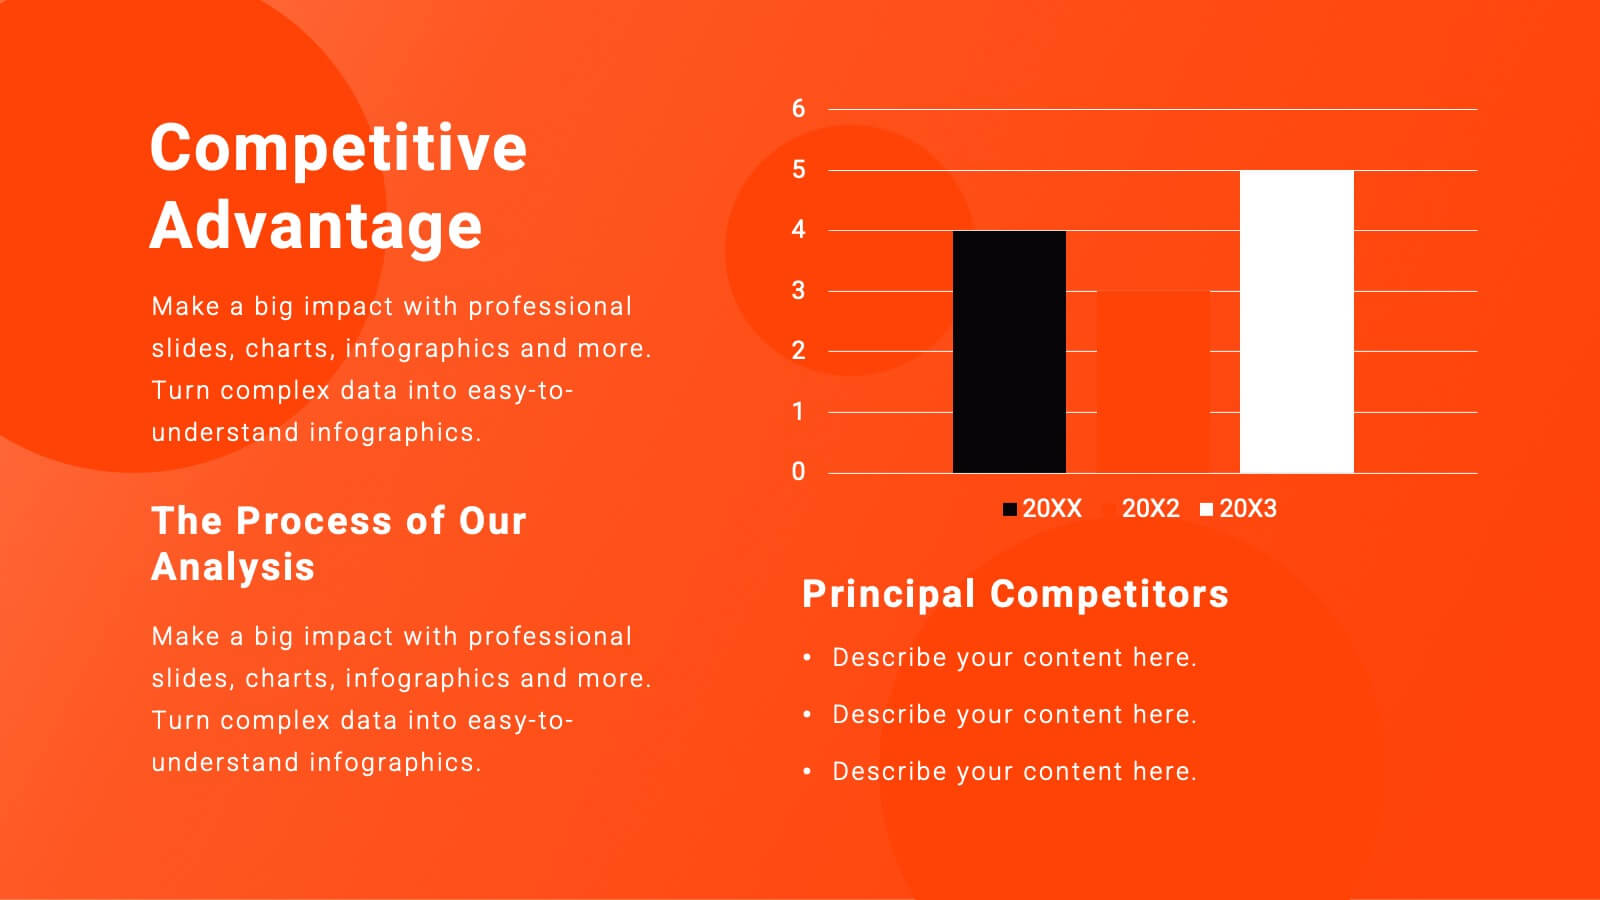
Comparison Table for Feature Mapping Presentation
Compare your product features with ease using this Comparison Table for Feature Mapping presentation. Ideal for highlighting similarities and differences across multiple offerings, this layout uses clean visuals and color-coded elements to show feature availability per product. Perfect for product teams, marketing, or internal decision-making. Compatible with PowerPoint, Canva, and Google Slides.


5 diapositivas
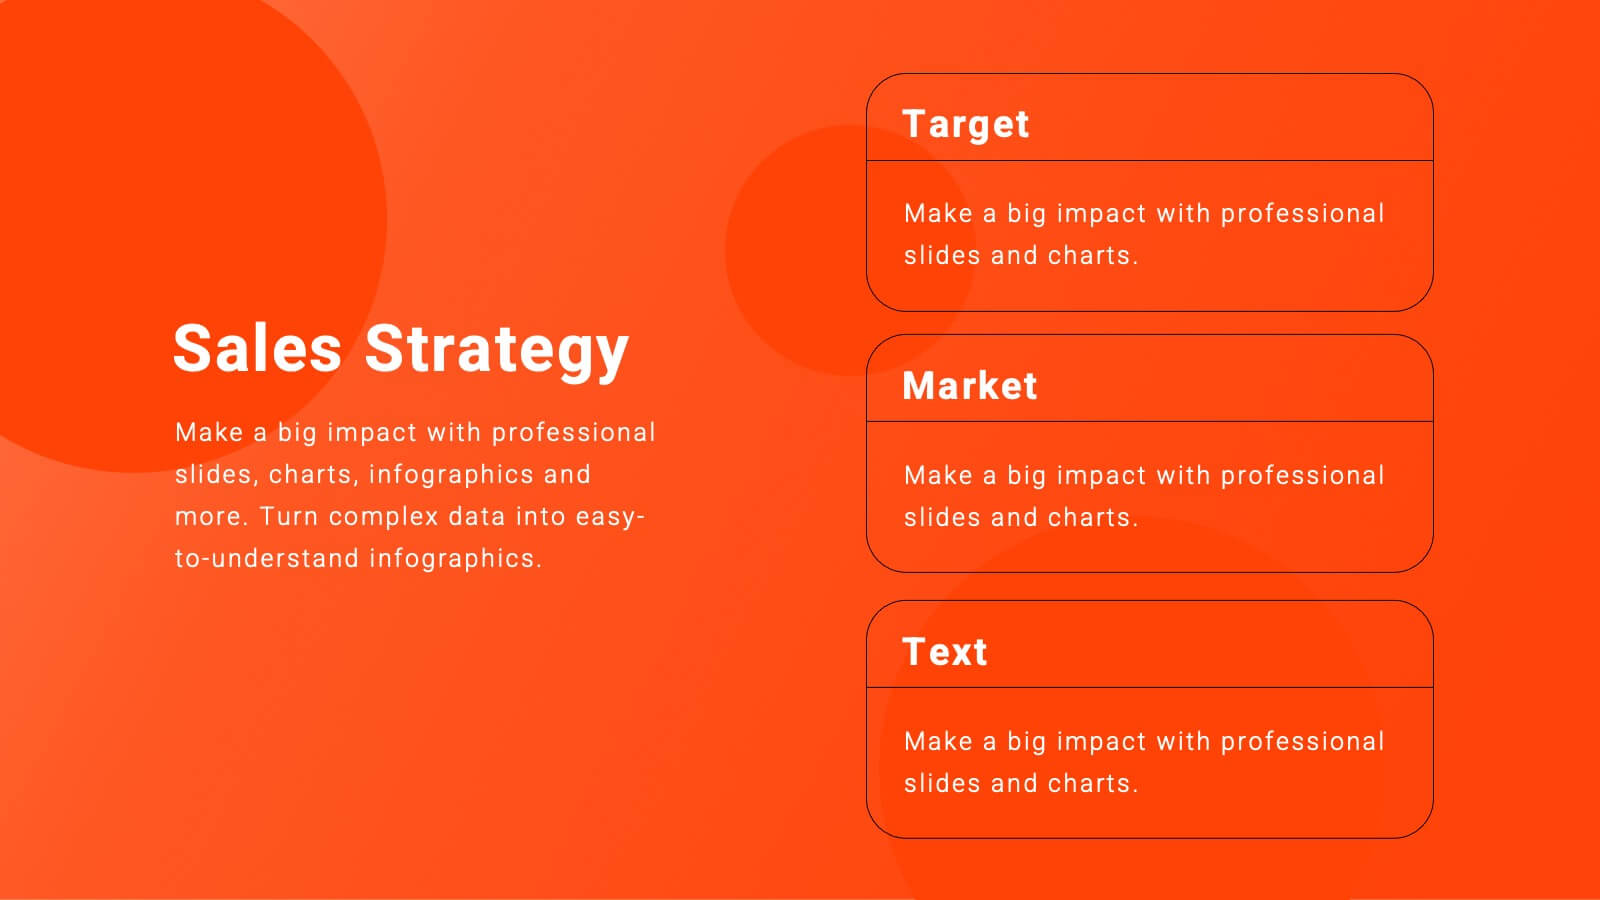
Purpose-Driven Mission and Values Presentation
Present your organization’s core purpose and guiding principles with this Purpose-Driven Mission and Values presentation. This clean, flag-style layout is perfect for showcasing five key pillars such as integrity, collaboration, or innovation. Easily customizable in Canva, PowerPoint, or Google Slides to align with your brand.


6 diapositivas
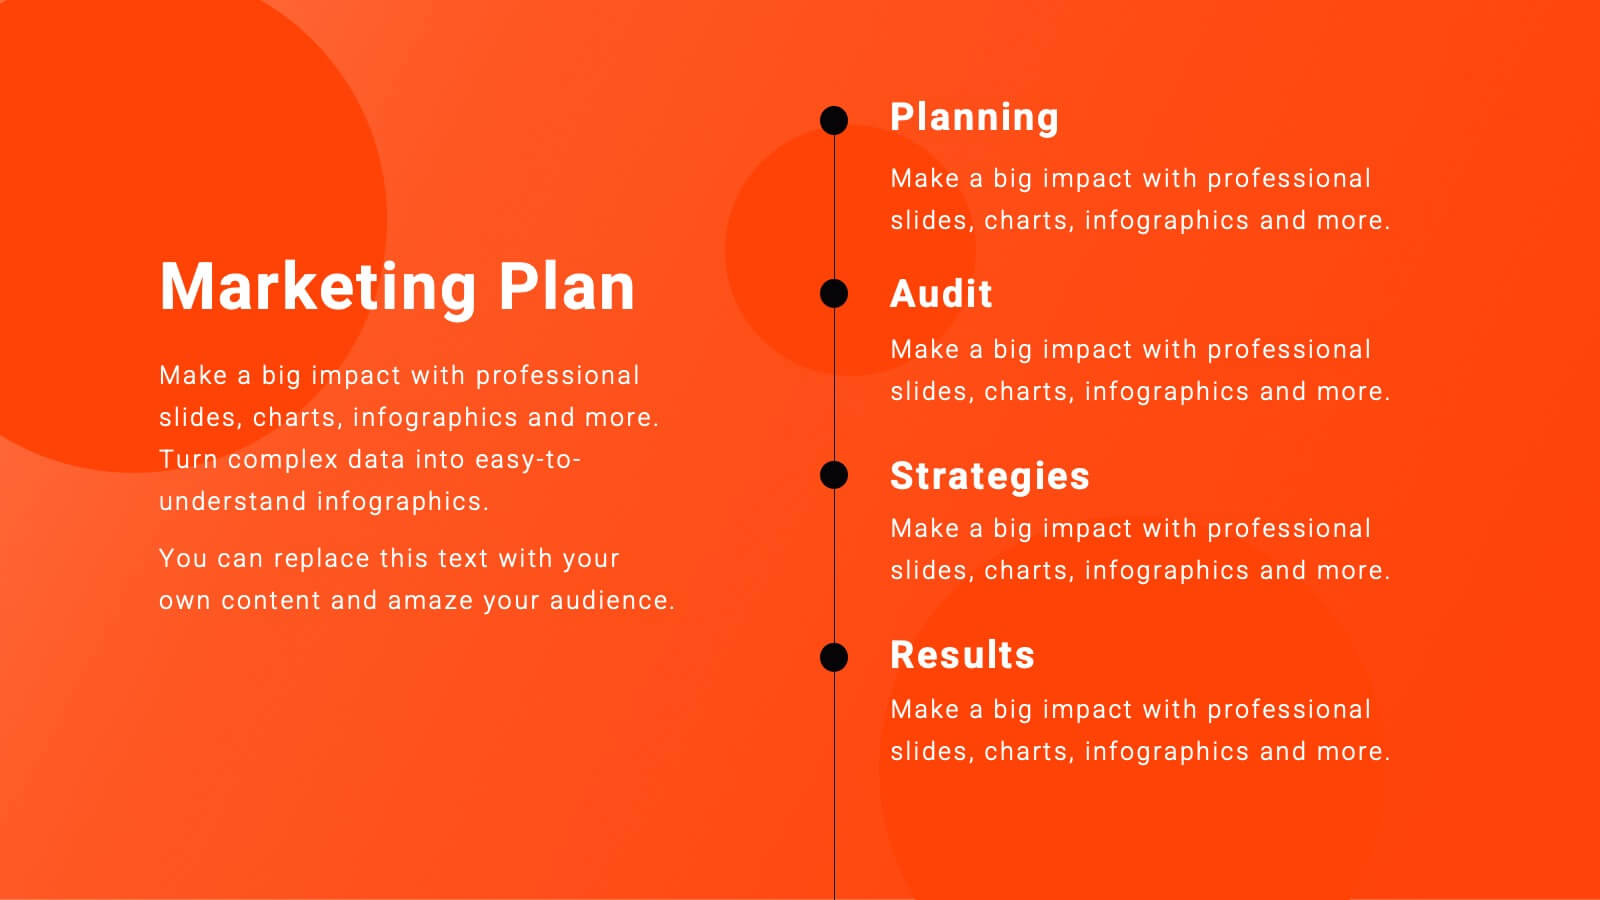
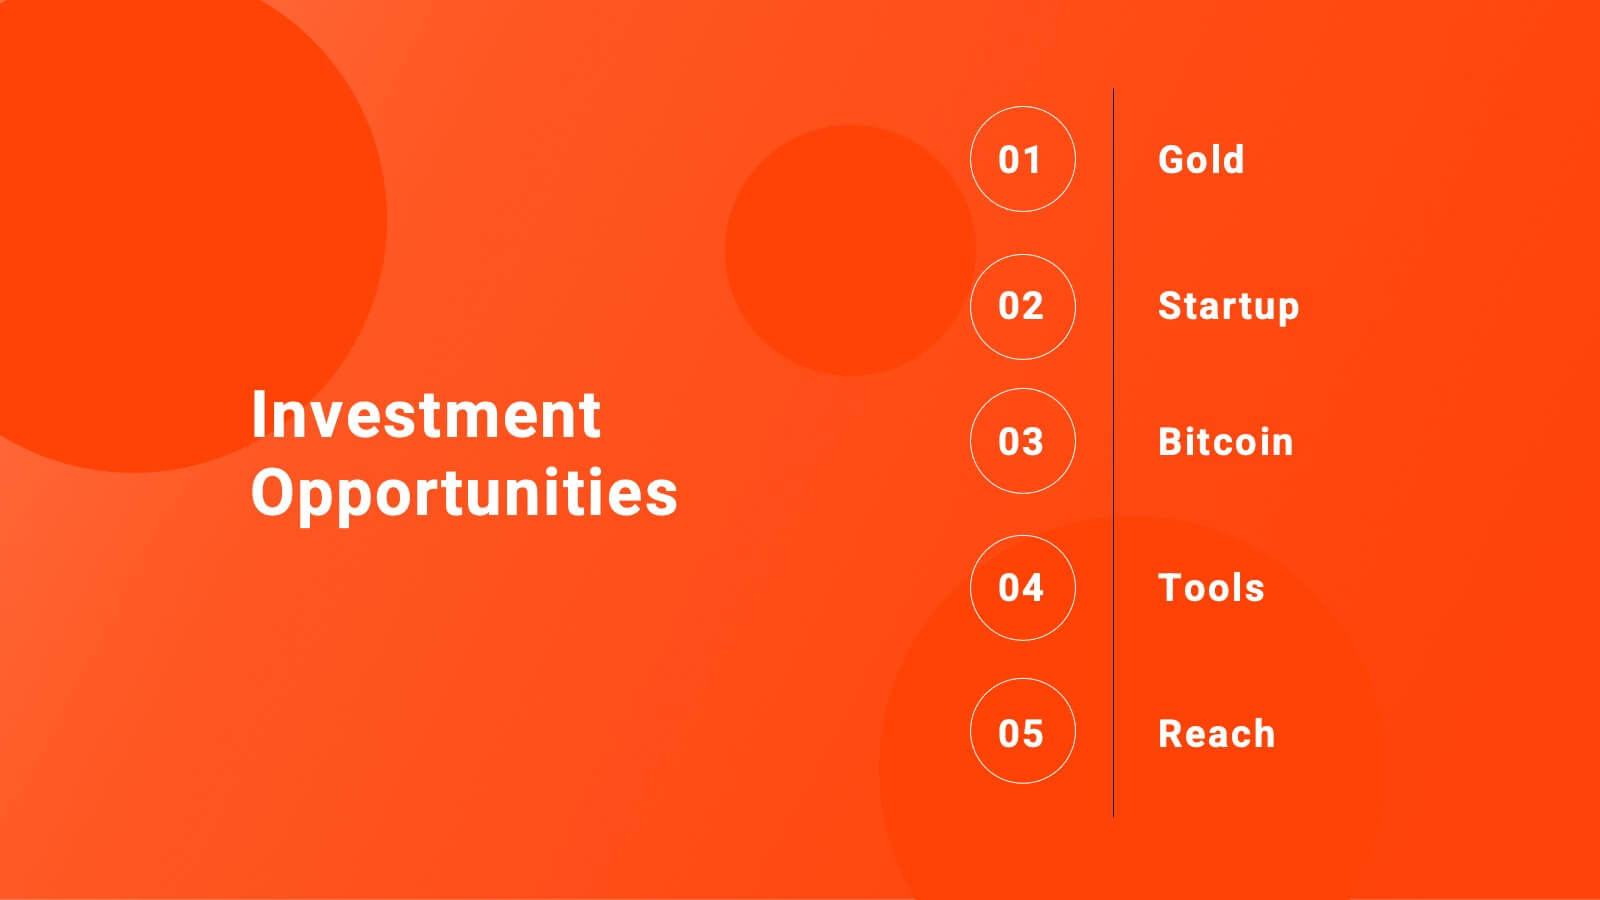
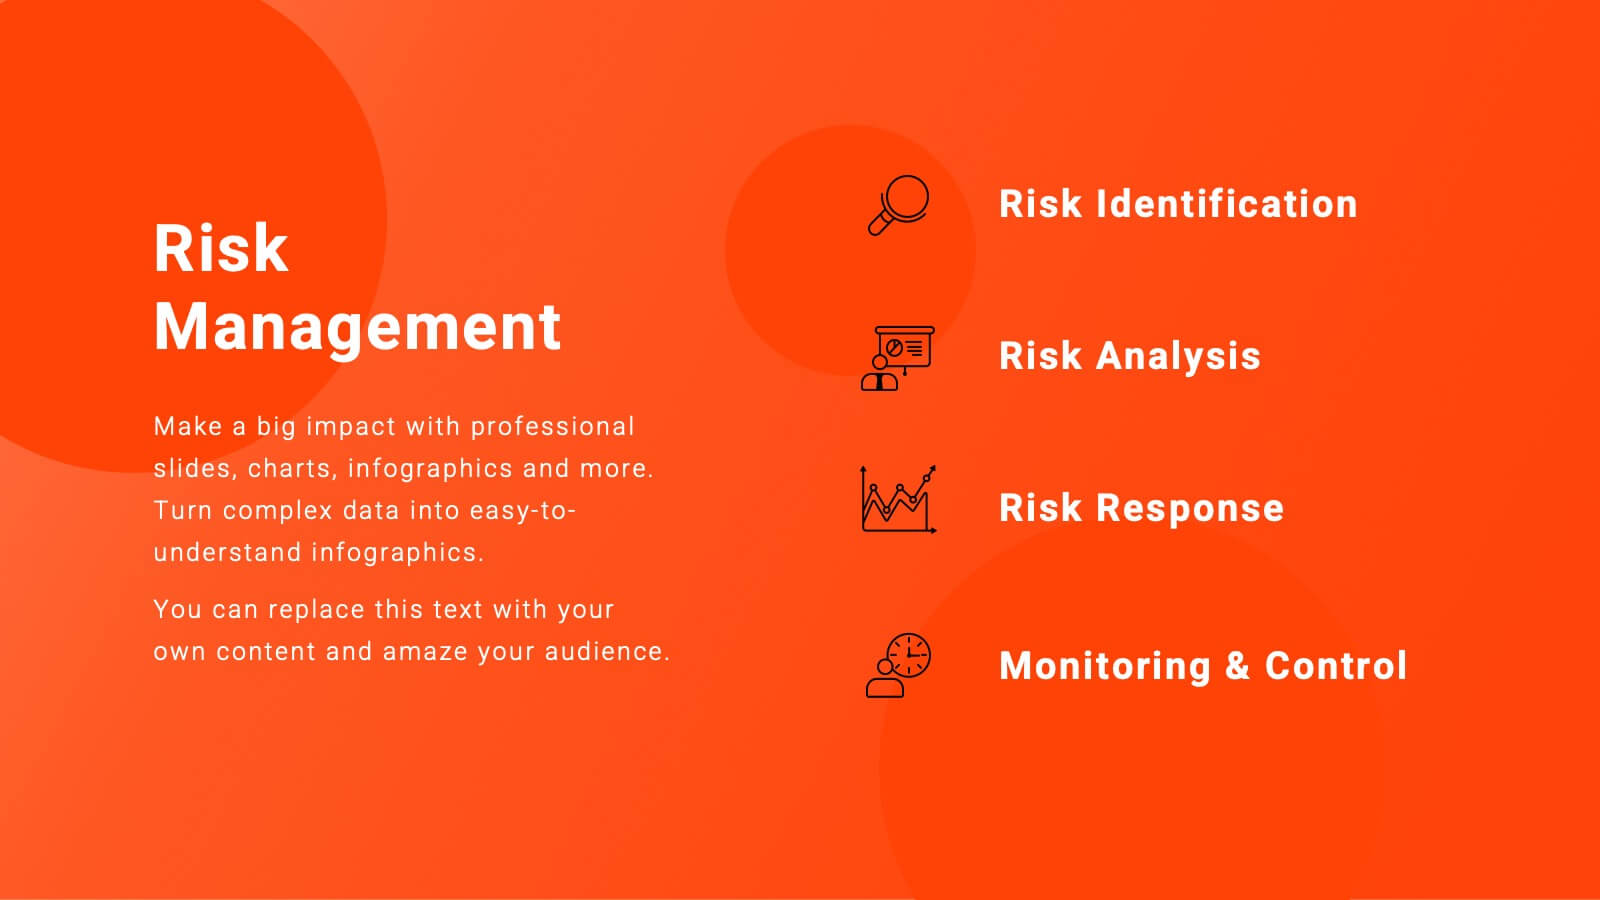
Prioritized Business List Format
Streamline your priorities with this clean and structured list layout, perfect for project steps, goals, or ranking business initiatives. Featuring five connected stages with icons, this editable design highlights key information in an easy-to-follow format. Fully customizable in PowerPoint, Keynote, and Google Slides.


5 diapositivas
User Experience Survey Findings Presentation
Present key insights from your user research in a clean and impactful way with this survey findings slide. Designed to highlight percentages and categories clearly, it helps your audience quickly understand what users value most. Ideal for UX reports and product feedback reviews. Fully compatible with PowerPoint, Keynote, and Google Slides.


4 diapositivas
Aviation Logistics and Scheduling Presentation
Coordinate timelines and optimize operations with the Aviation Logistics and Scheduling presentation. This layout uses a control tower illustration to visualize four key scheduling points—ideal for showcasing flight operations, airport coordination, or air traffic planning. Great for logistics teams, airline operations managers, or aviation consultants. Fully editable in PowerPoint, Keynote, and Google Slides.


22 diapositivas
Virtus Qualitative Research Findings Presentation
This qualitative research findings template features a modern design with geometric shapes and a professional palette of blue, gold, and black. It’s structured to showcase research details effectively, covering objectives, methodology, findings, limitations, and future directions. Compatible with PowerPoint, Keynote, and Google Slides for seamless presentations.


20 diapositivas
Fenrir Investor Pitch Presentation
Deliver a compelling and persuasive pitch with this sleek and professional investor pitch deck! It covers essential sections like problem and solution, market opportunity, business model, financials, and growth strategy to ensure your vision is clearly communicated. Ideal for startup fundraising or business presentations, this template is fully compatible with PowerPoint, Keynote, and Google Slides.


23 diapositivas
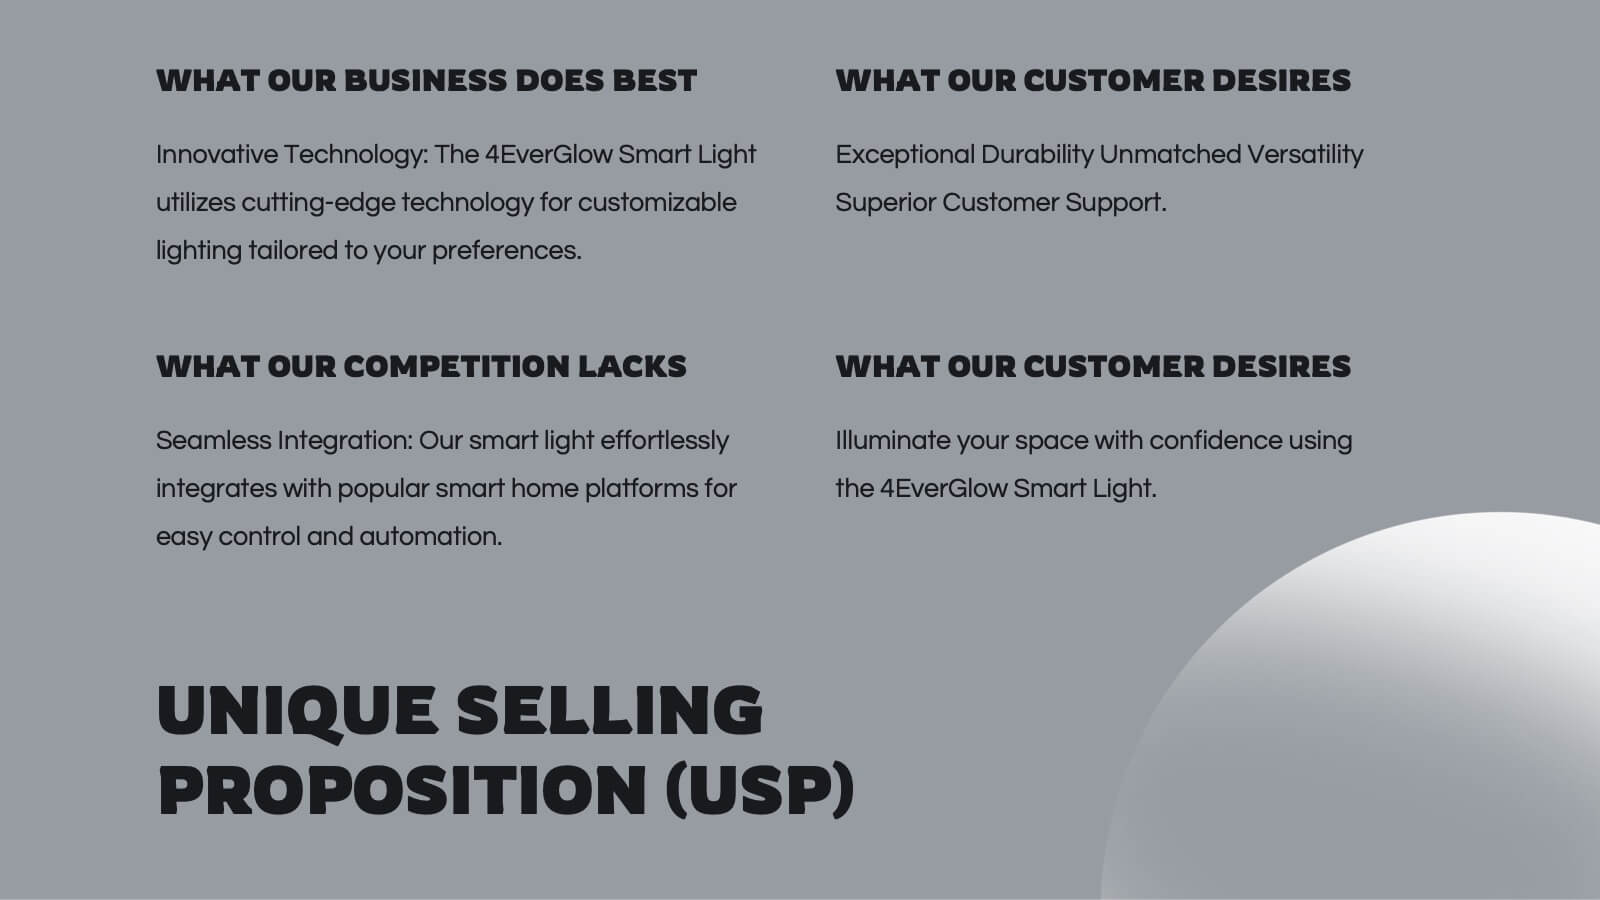
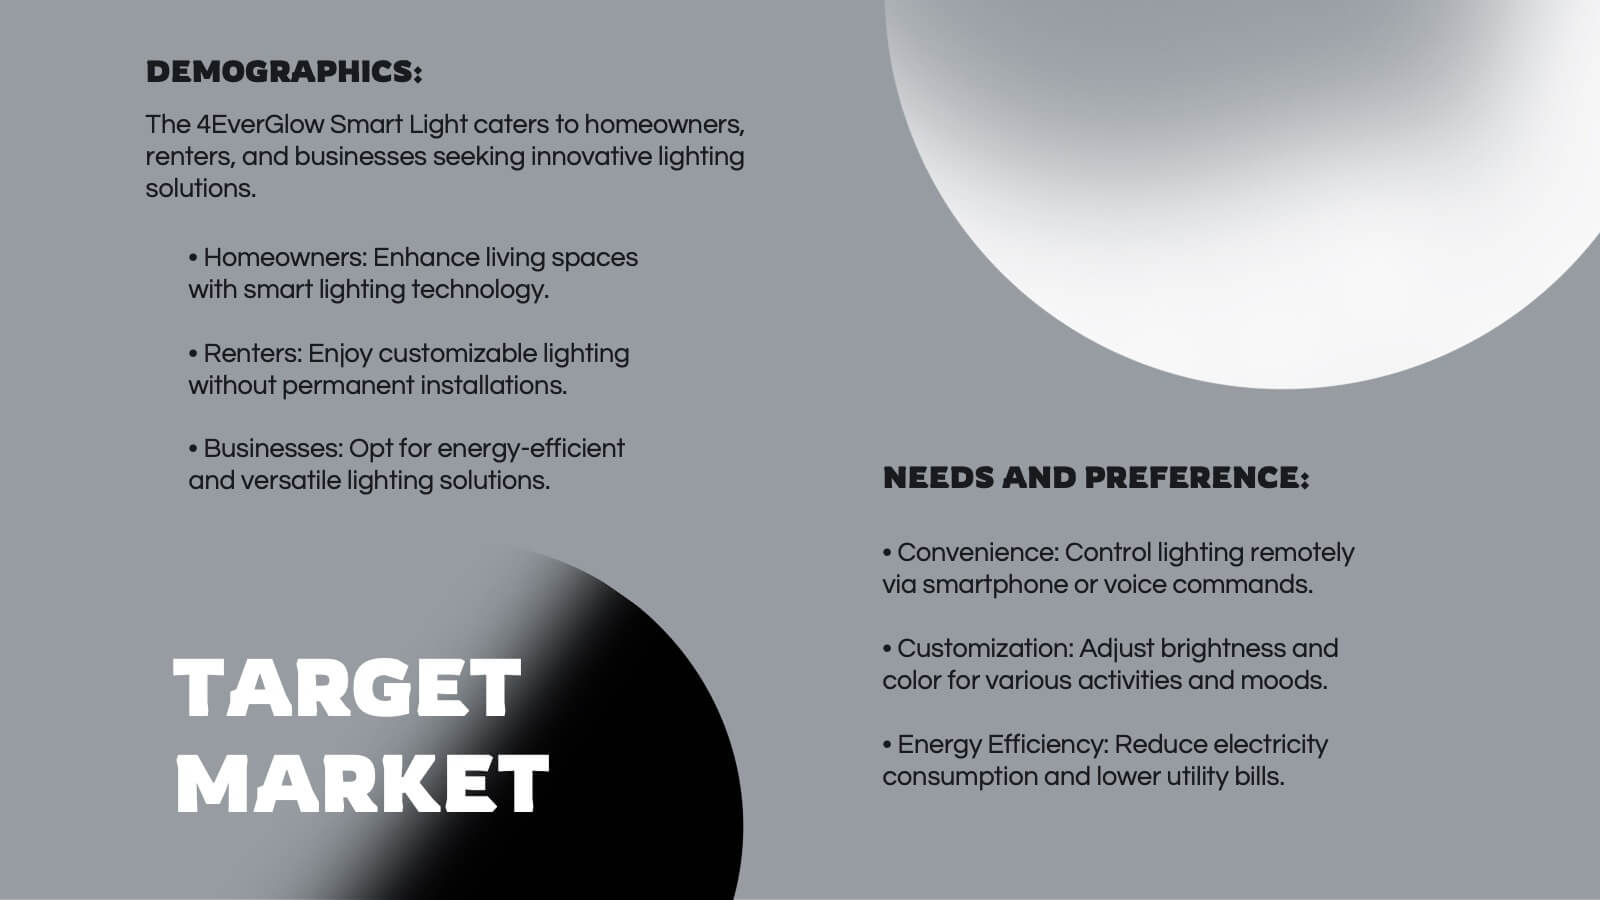
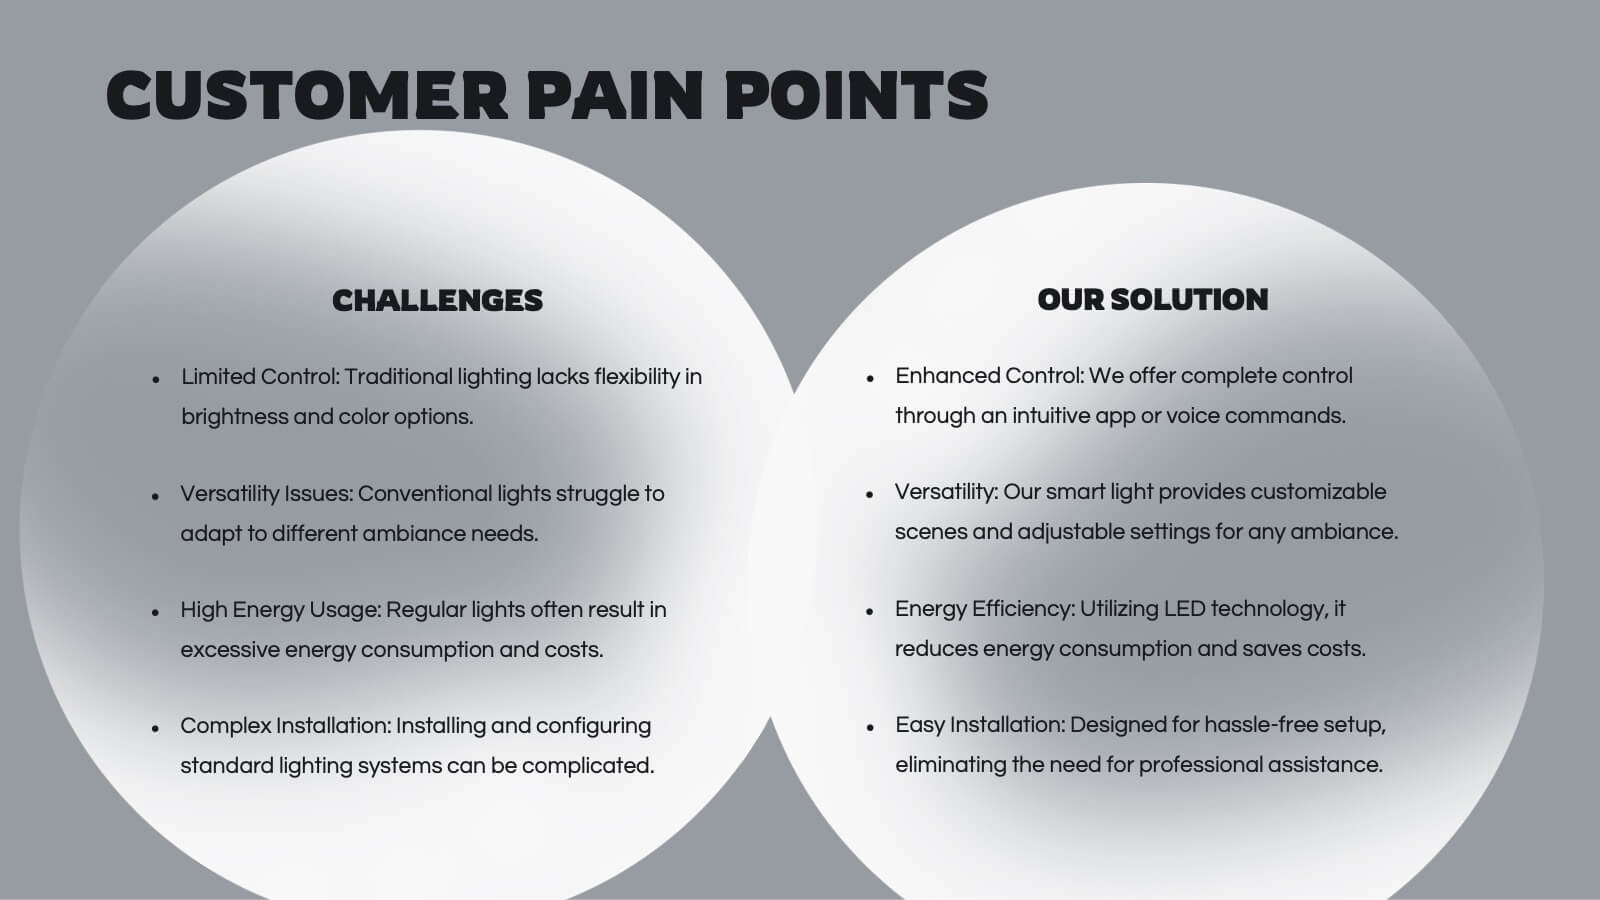
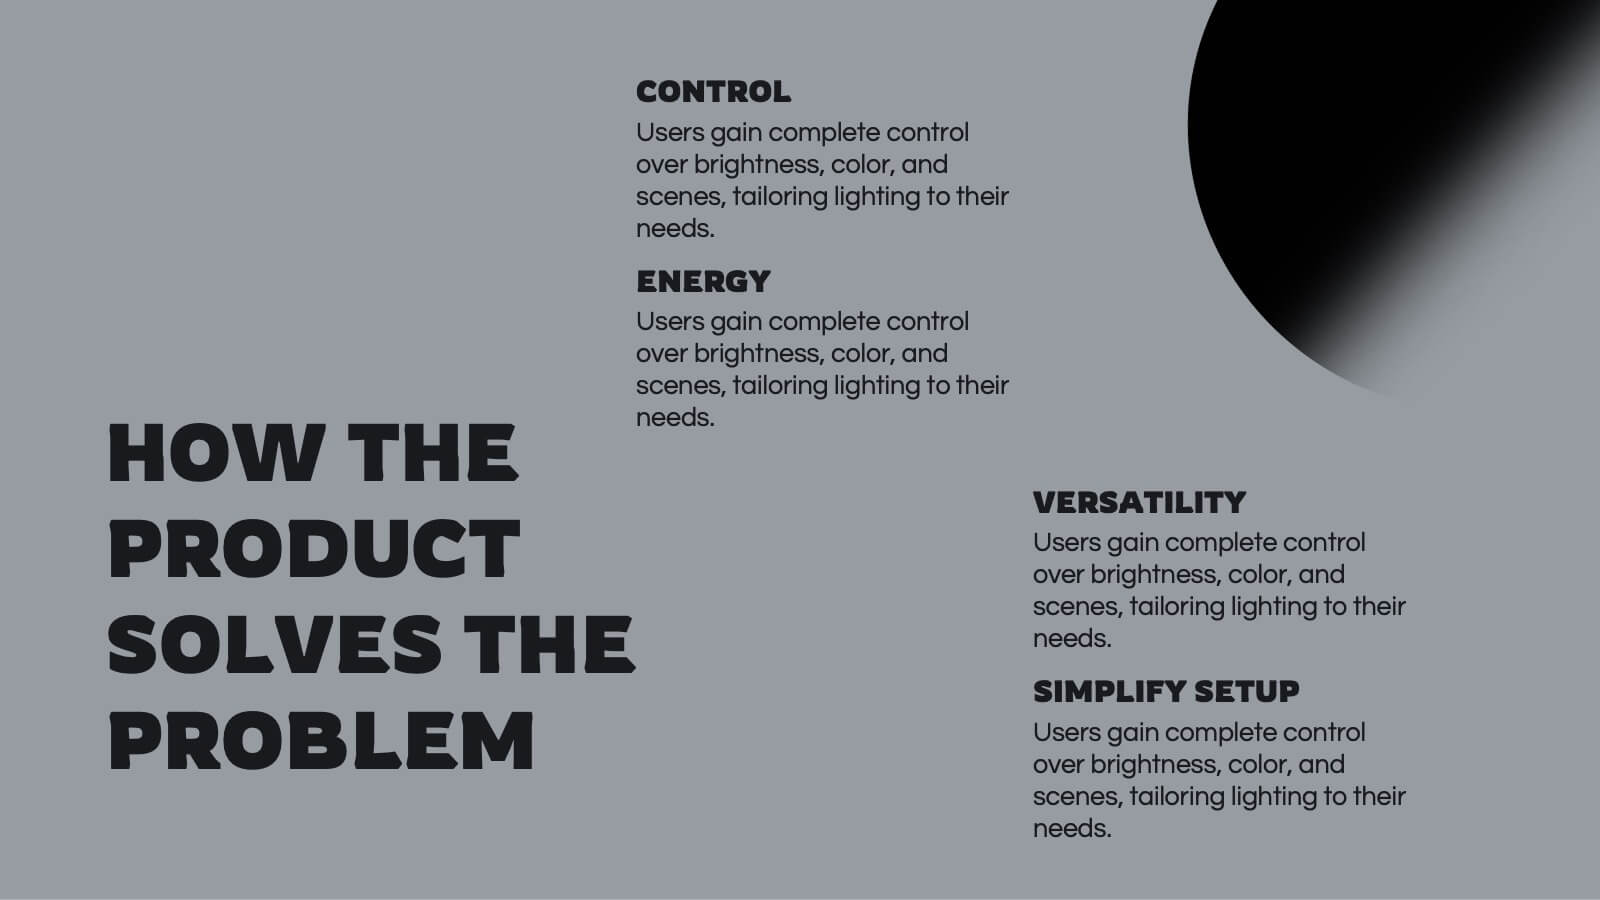
Kitsune Startup Strategy Presentation
This startup strategy template is designed for clear communication of business vision, target market, and unique value proposition. It also includes slides for marketing strategies, team introduction, and financial overview. Its clean, professional layout makes it ideal for investors or stakeholders. Compatible with PowerPoint, Keynote, and Google Slides for easy customization.


21 diapositivas
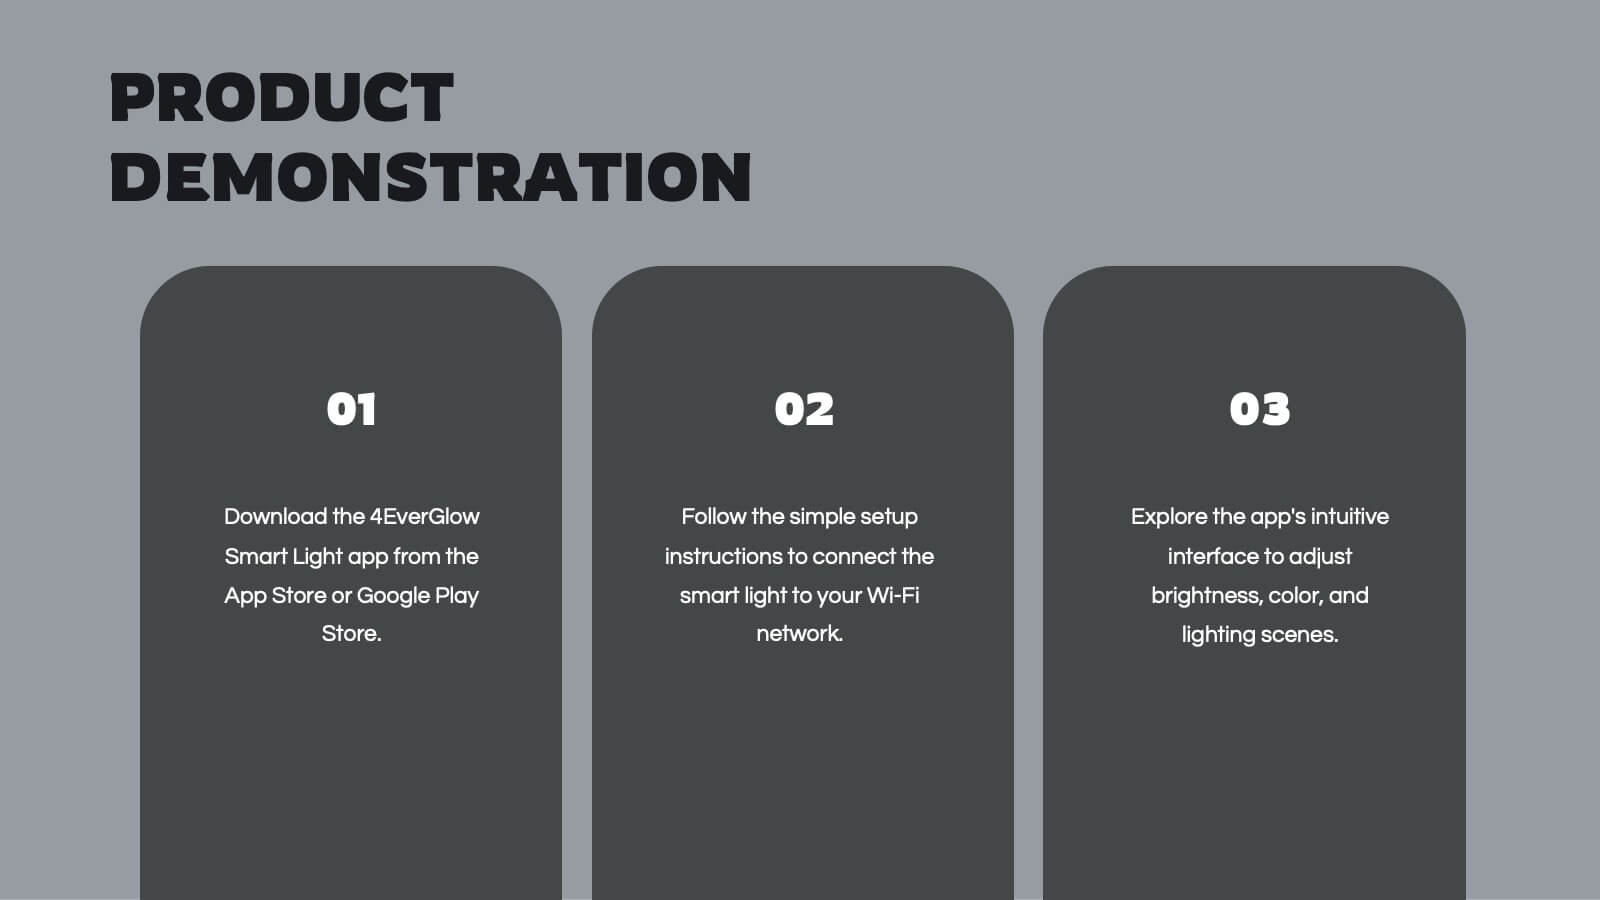
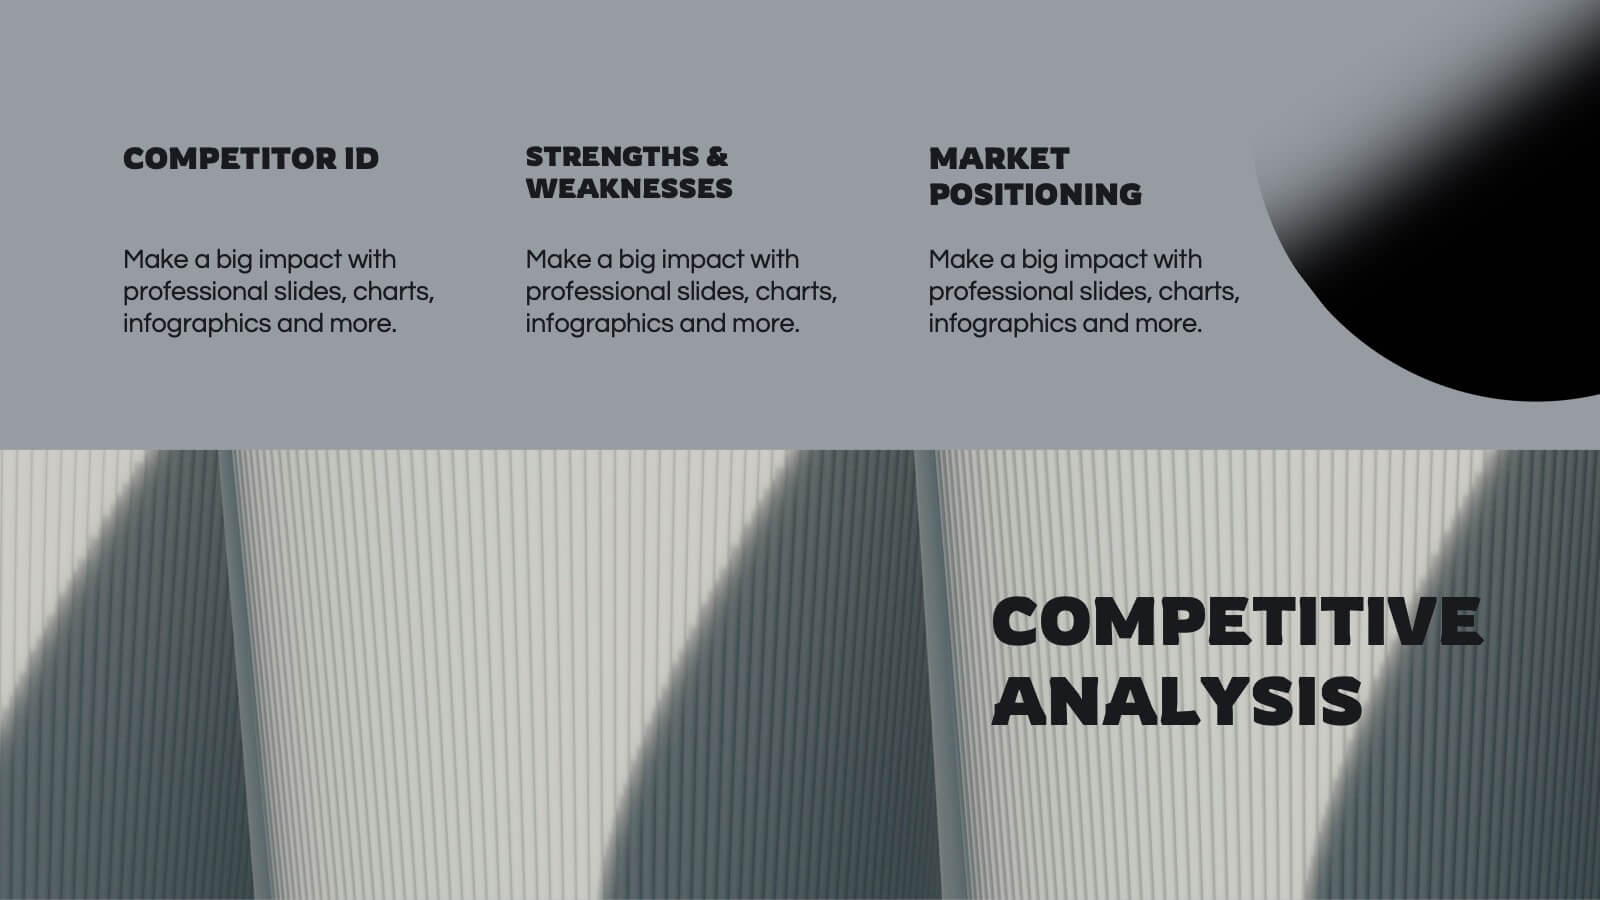
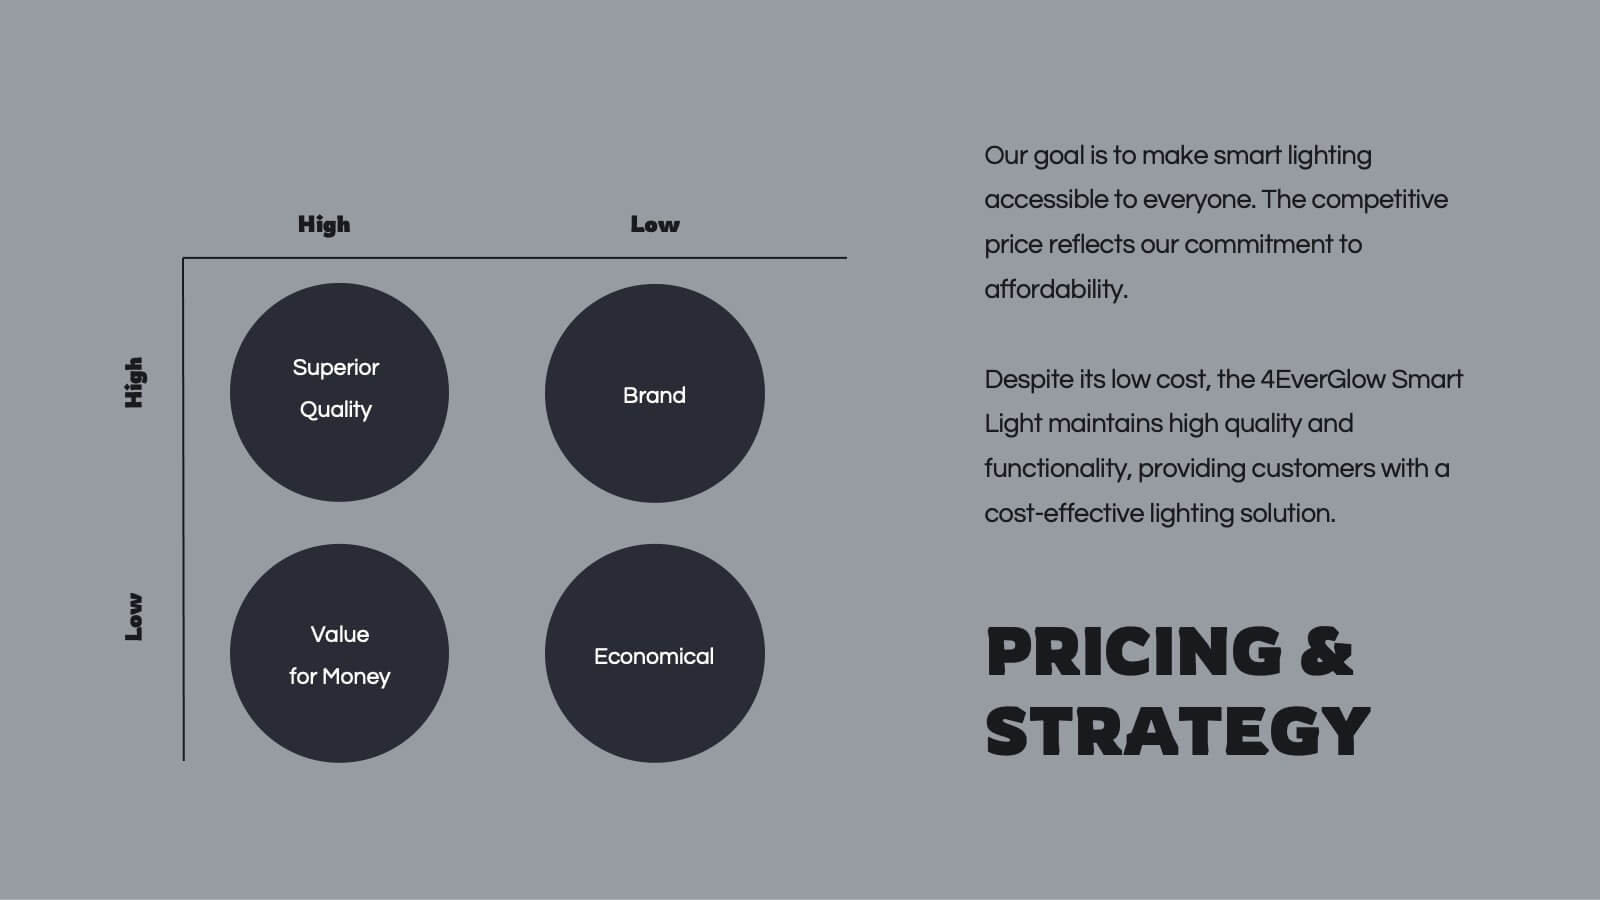
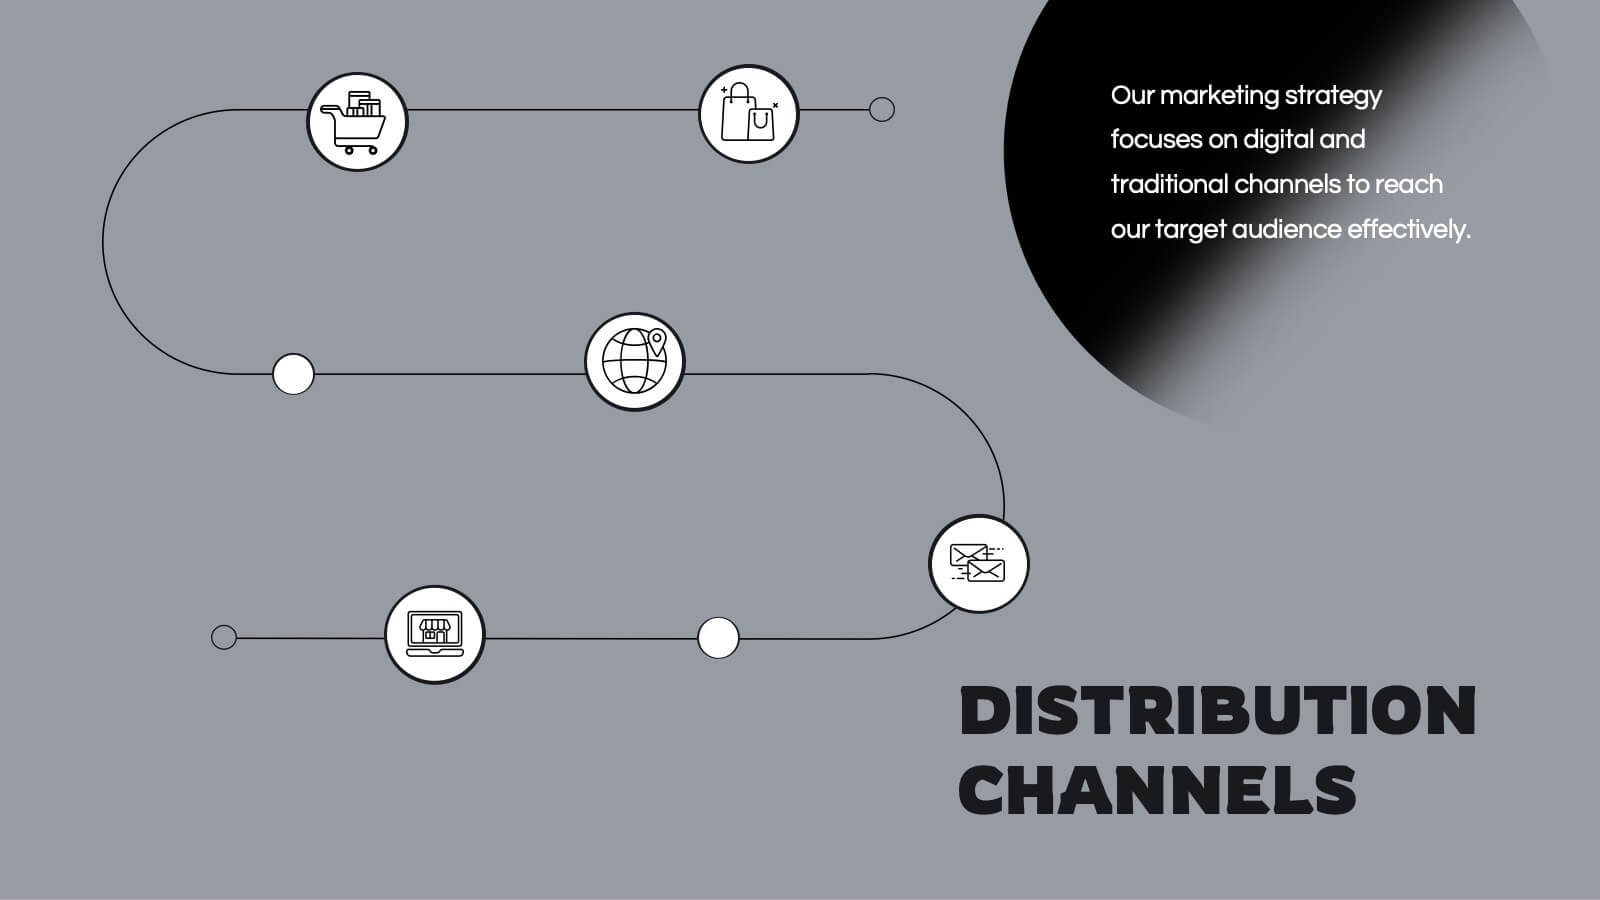
Spinel Product Strategy Report Presentation
Take your product strategy to the next level with this polished, spinel-inspired presentation! Designed to effectively communicate your product's goals, market analysis, and strategy roadmap, this template is both visually striking and easy to navigate. Its sharp design ensures a professional touch. Compatible with PowerPoint, Keynote, and Google Slides.