


Características


¿Tienes alguna pregunta?
Recomendar


4 diapositivas
Frequently Asked Questions (FAQ) Presentation
Enhance your FAQ section with this modern and visually structured presentation slide. Featuring a bold question mark icon, this template allows you to clearly organize and present key questions and answers in a professional and engaging format. Perfect for customer service, business proposals, and informational presentations, this slide is fully customizable with editable text, colors, and layouts. Compatible with PowerPoint, Keynote, and Google Slides for easy integration.

20 diapositivas
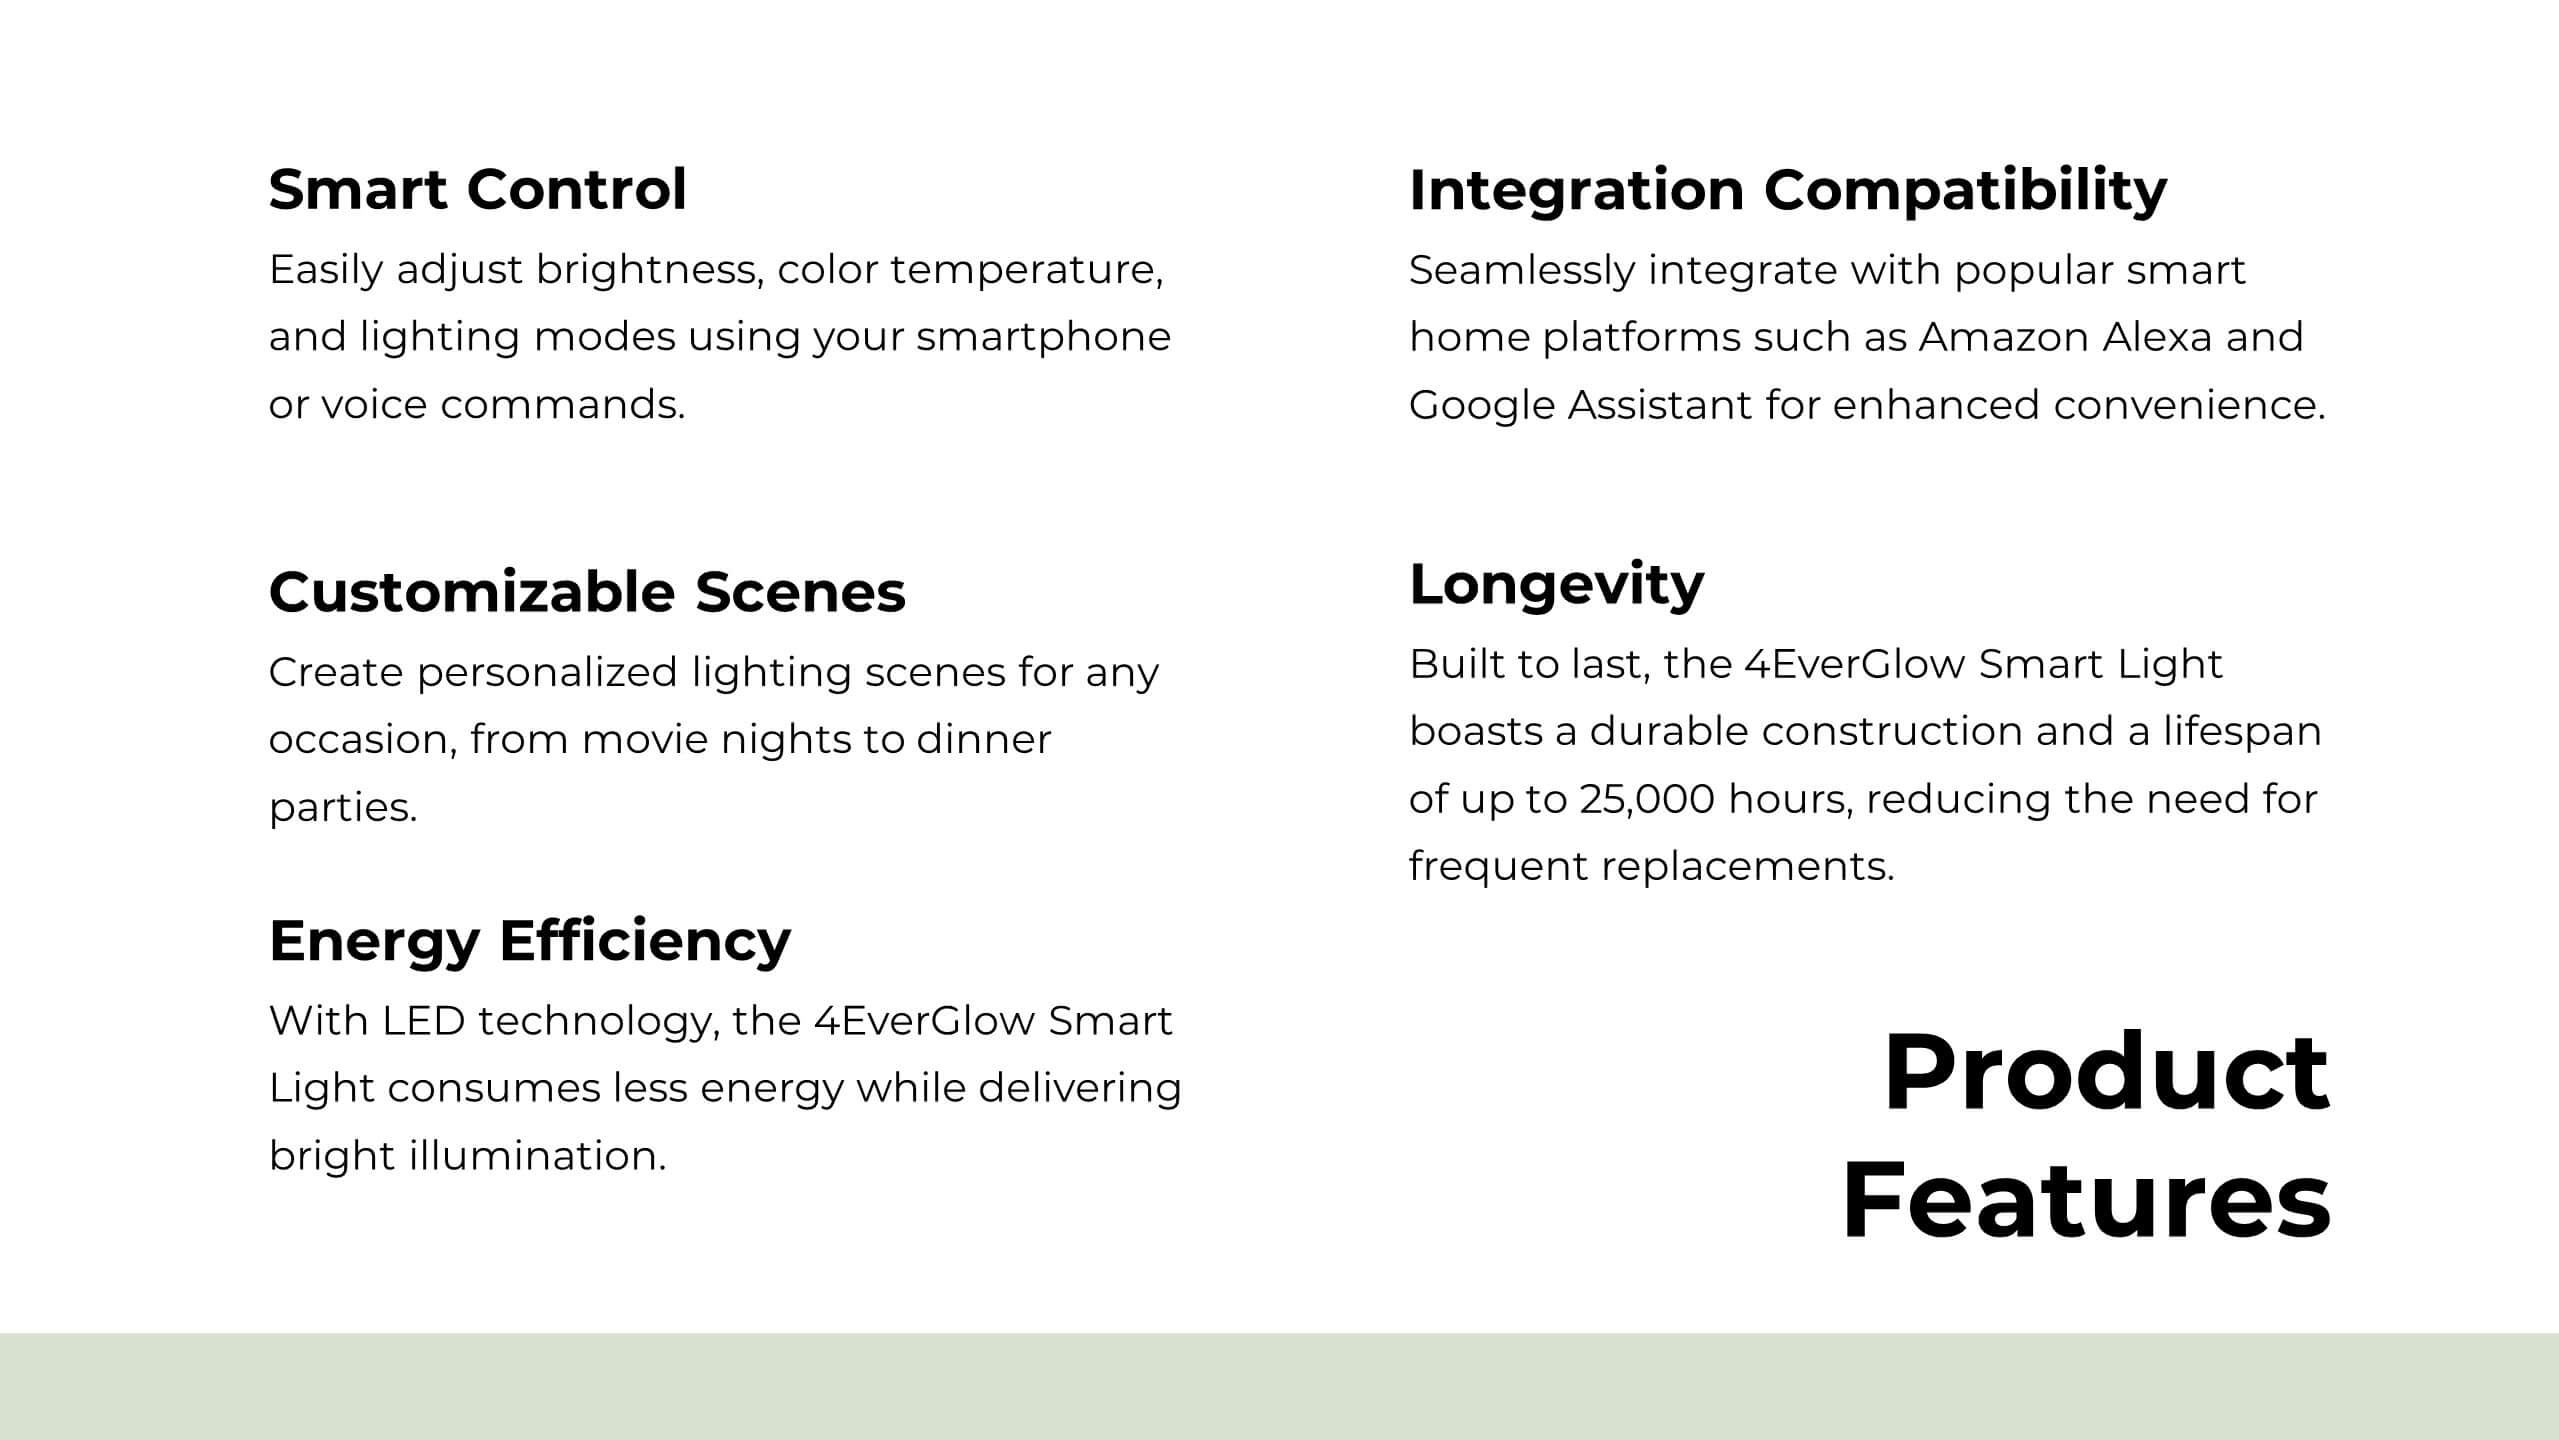
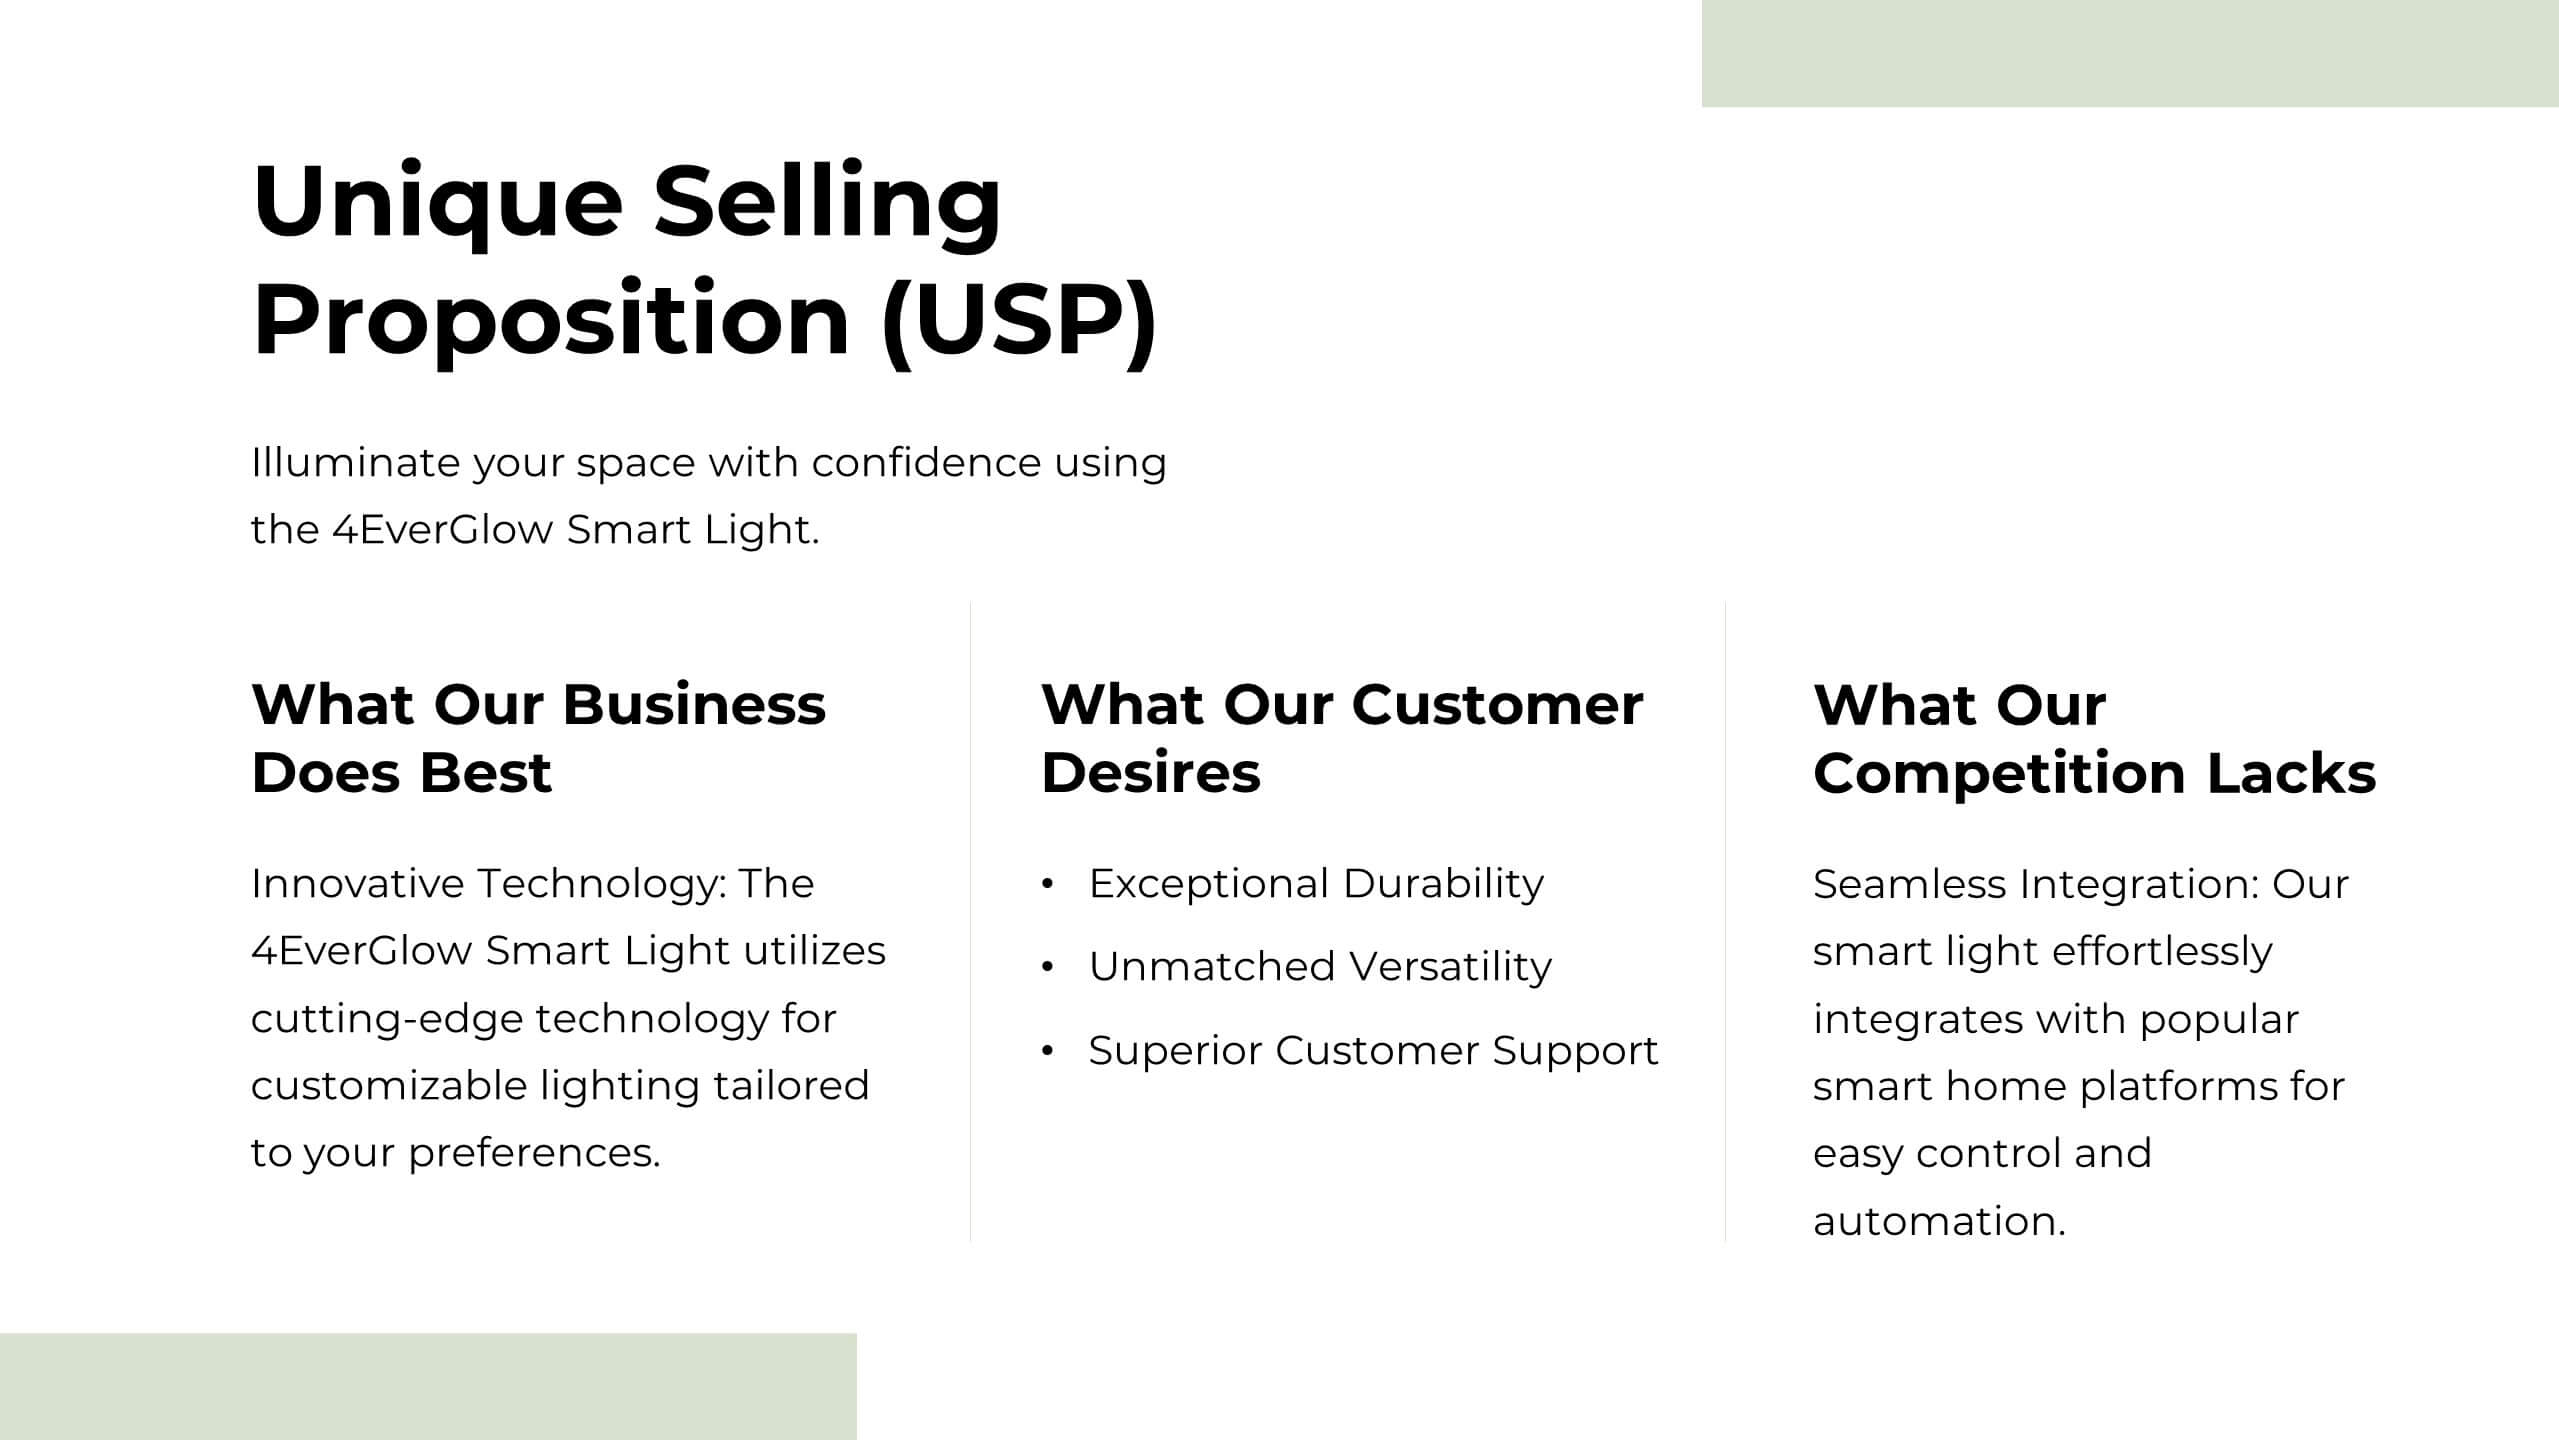
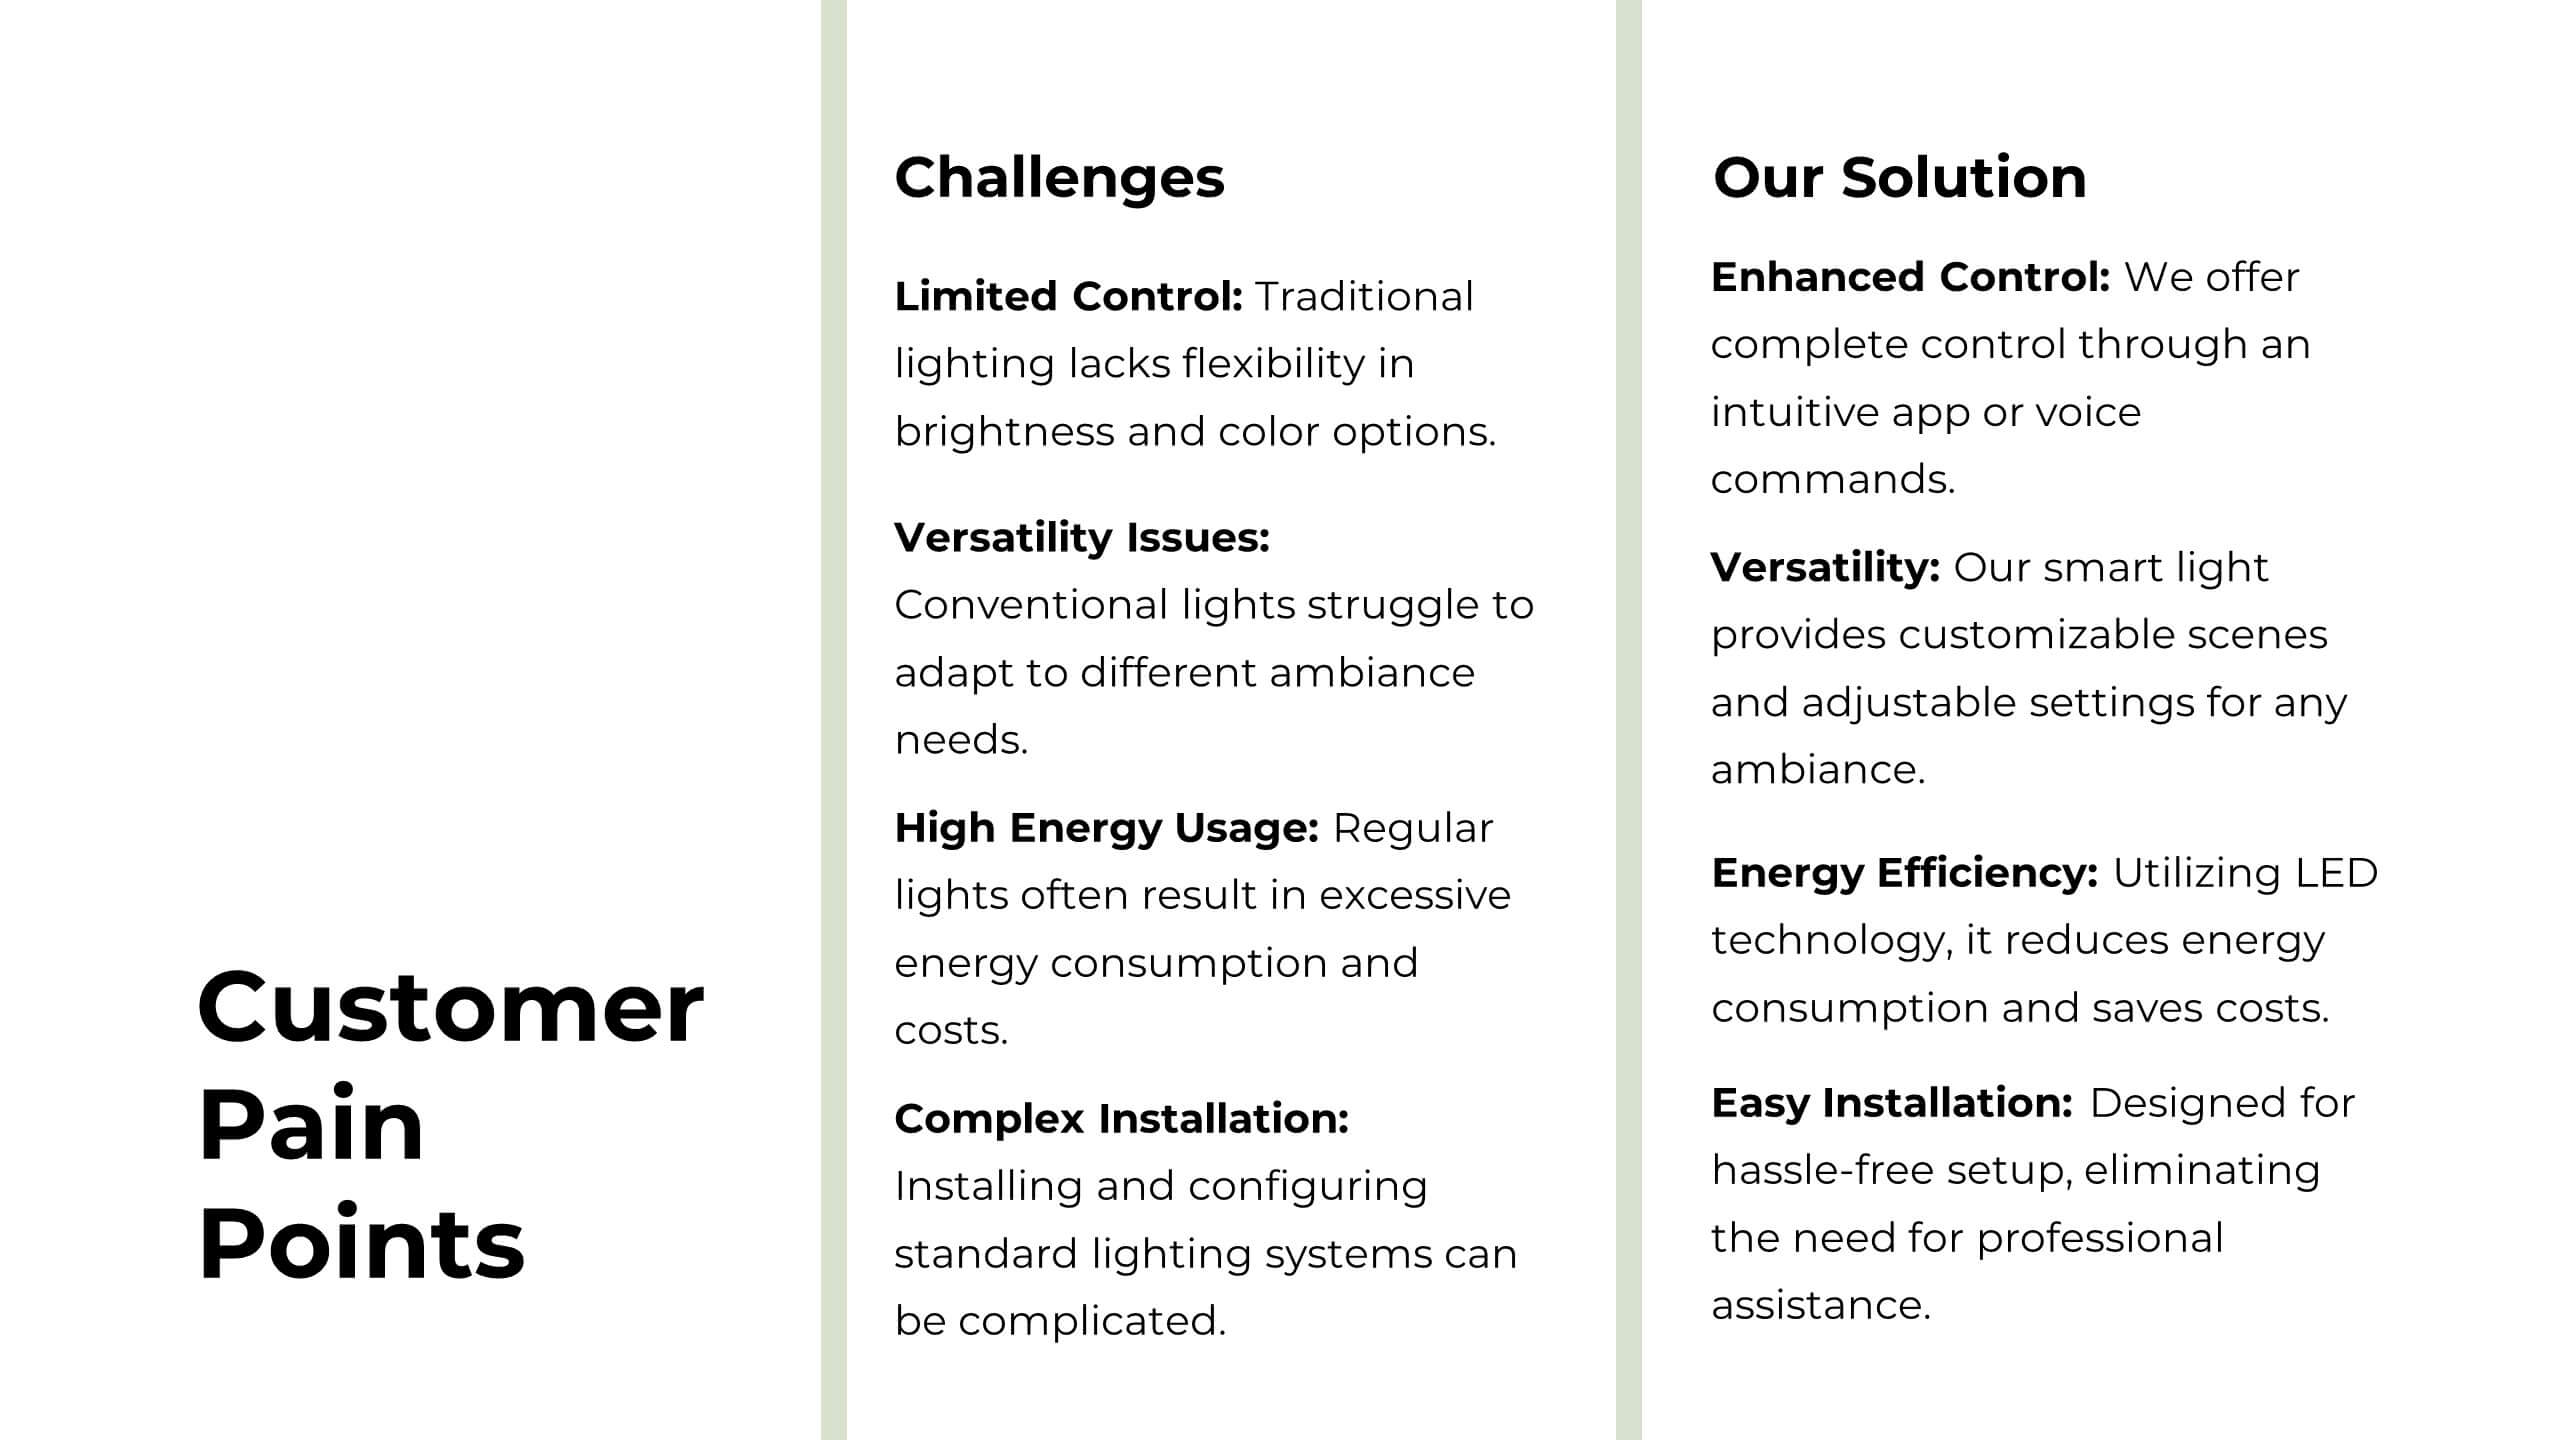
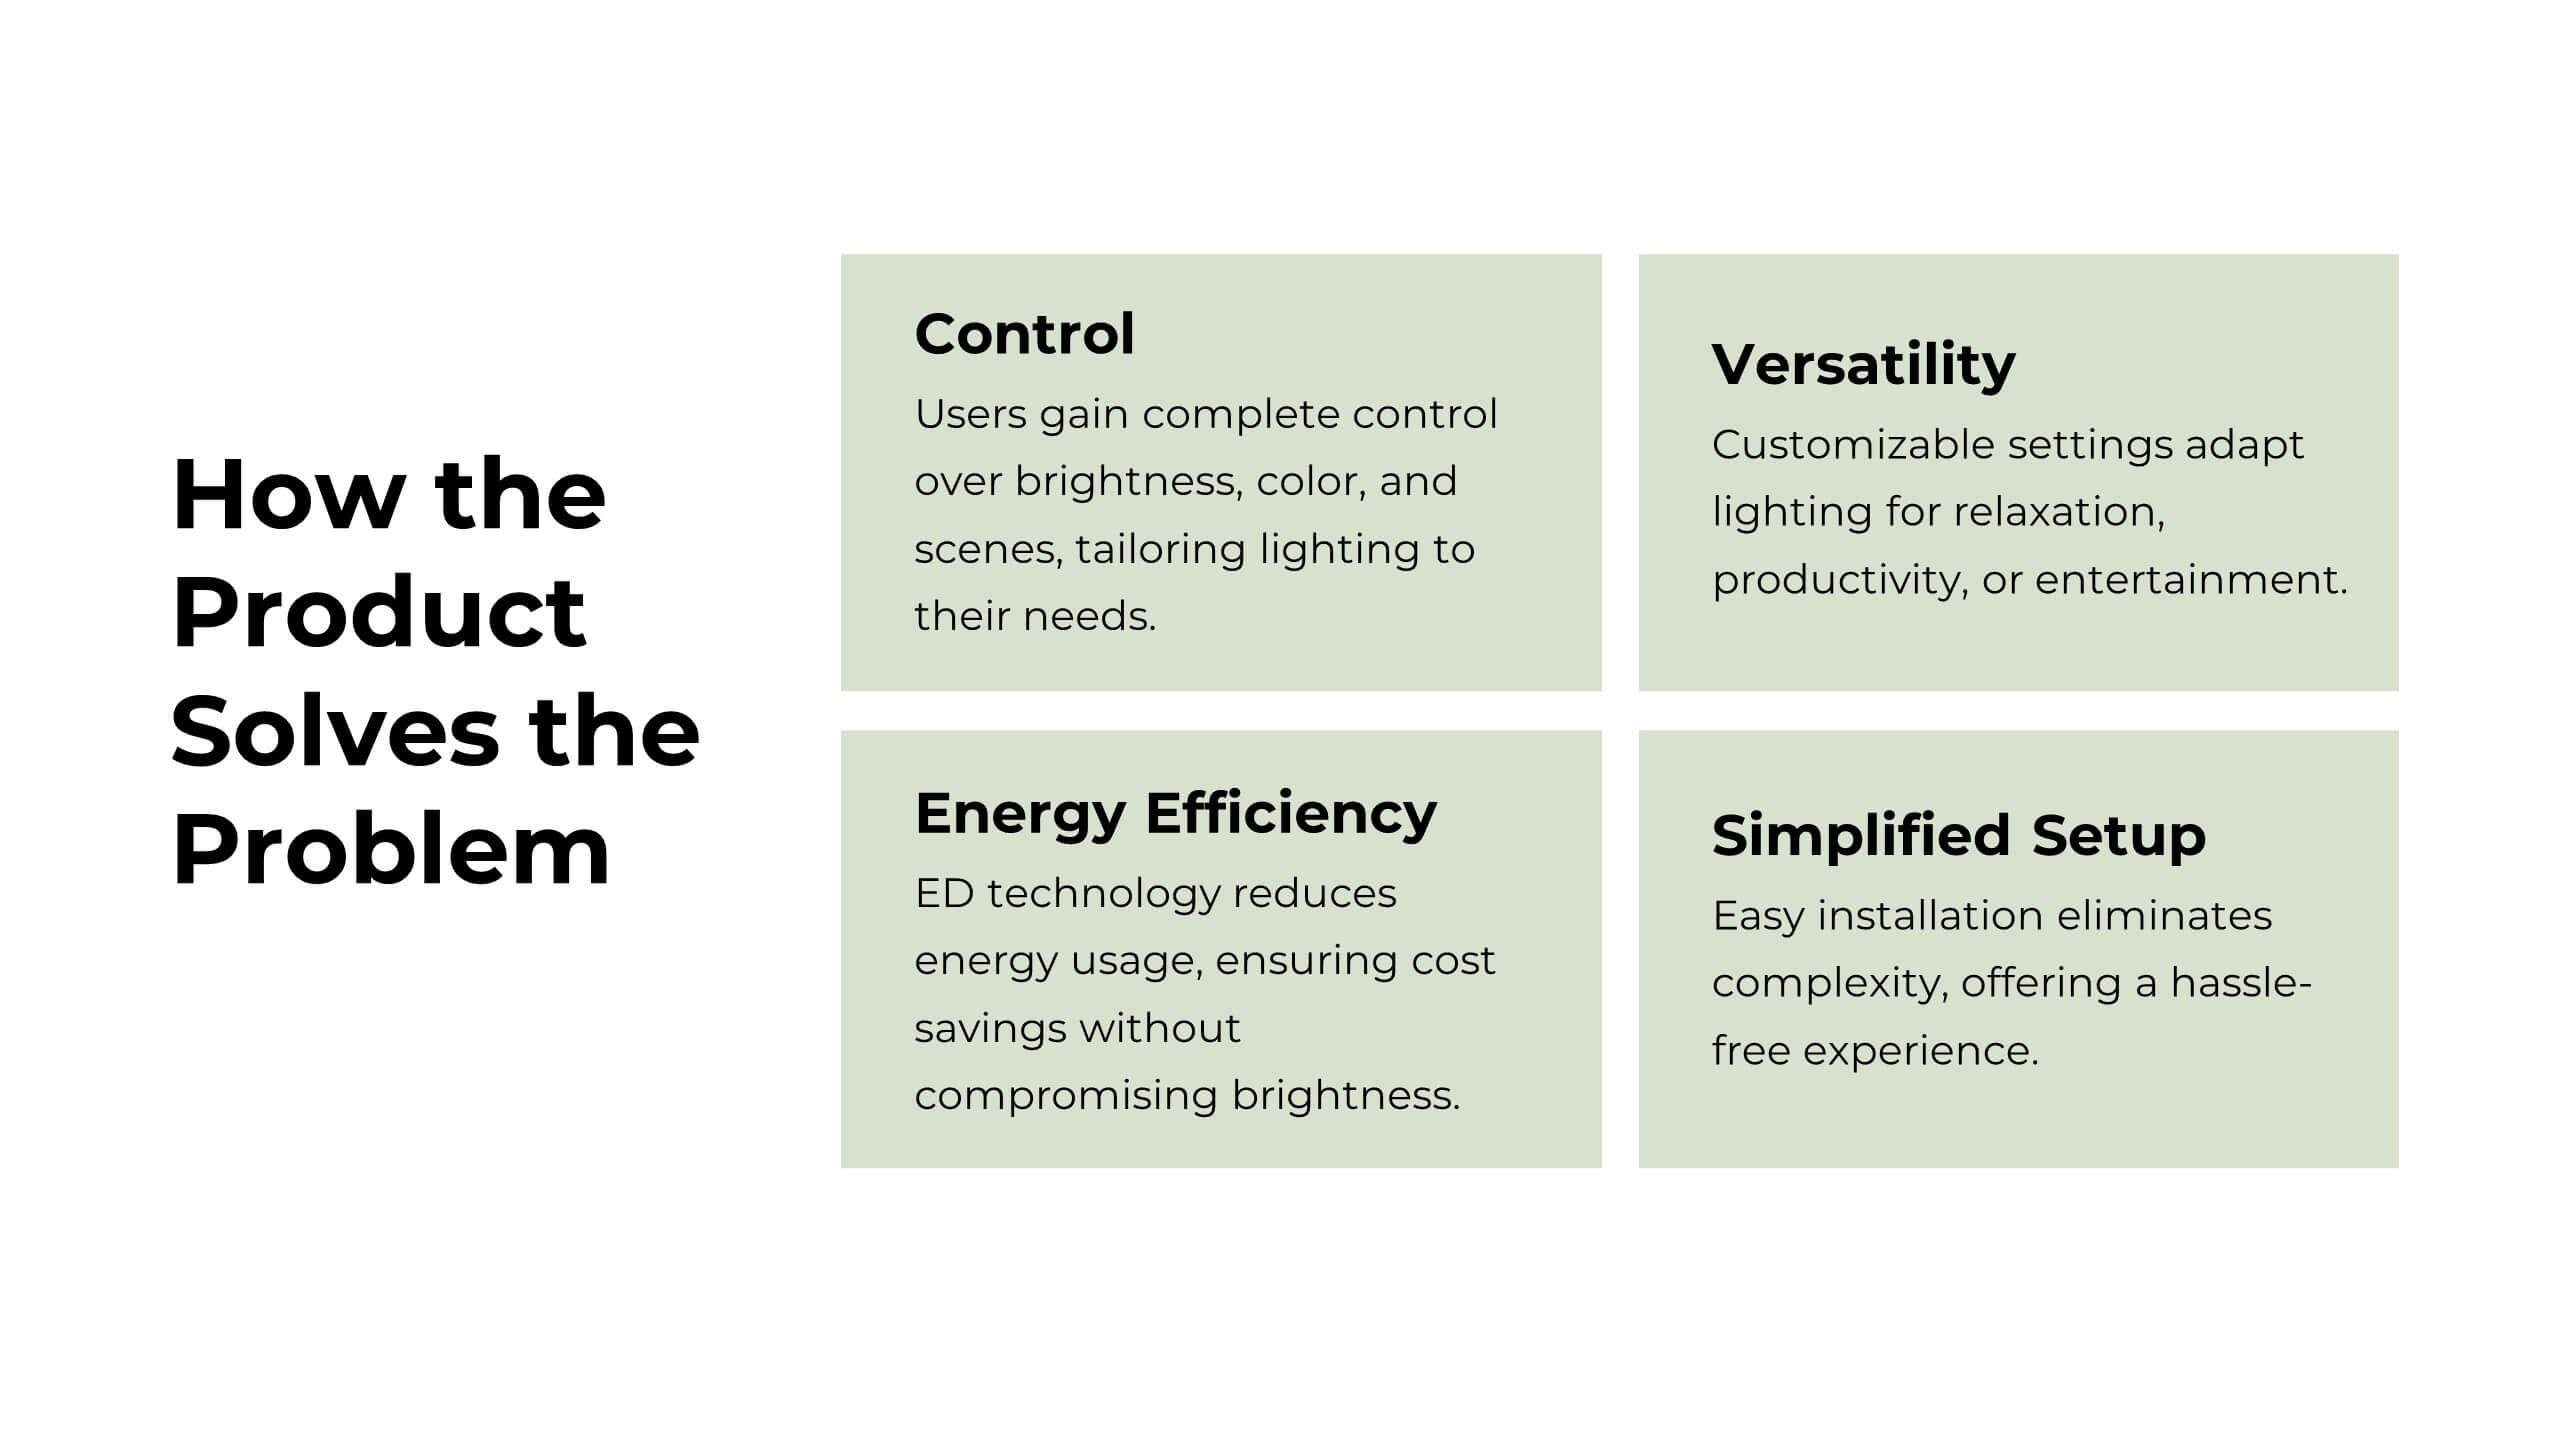
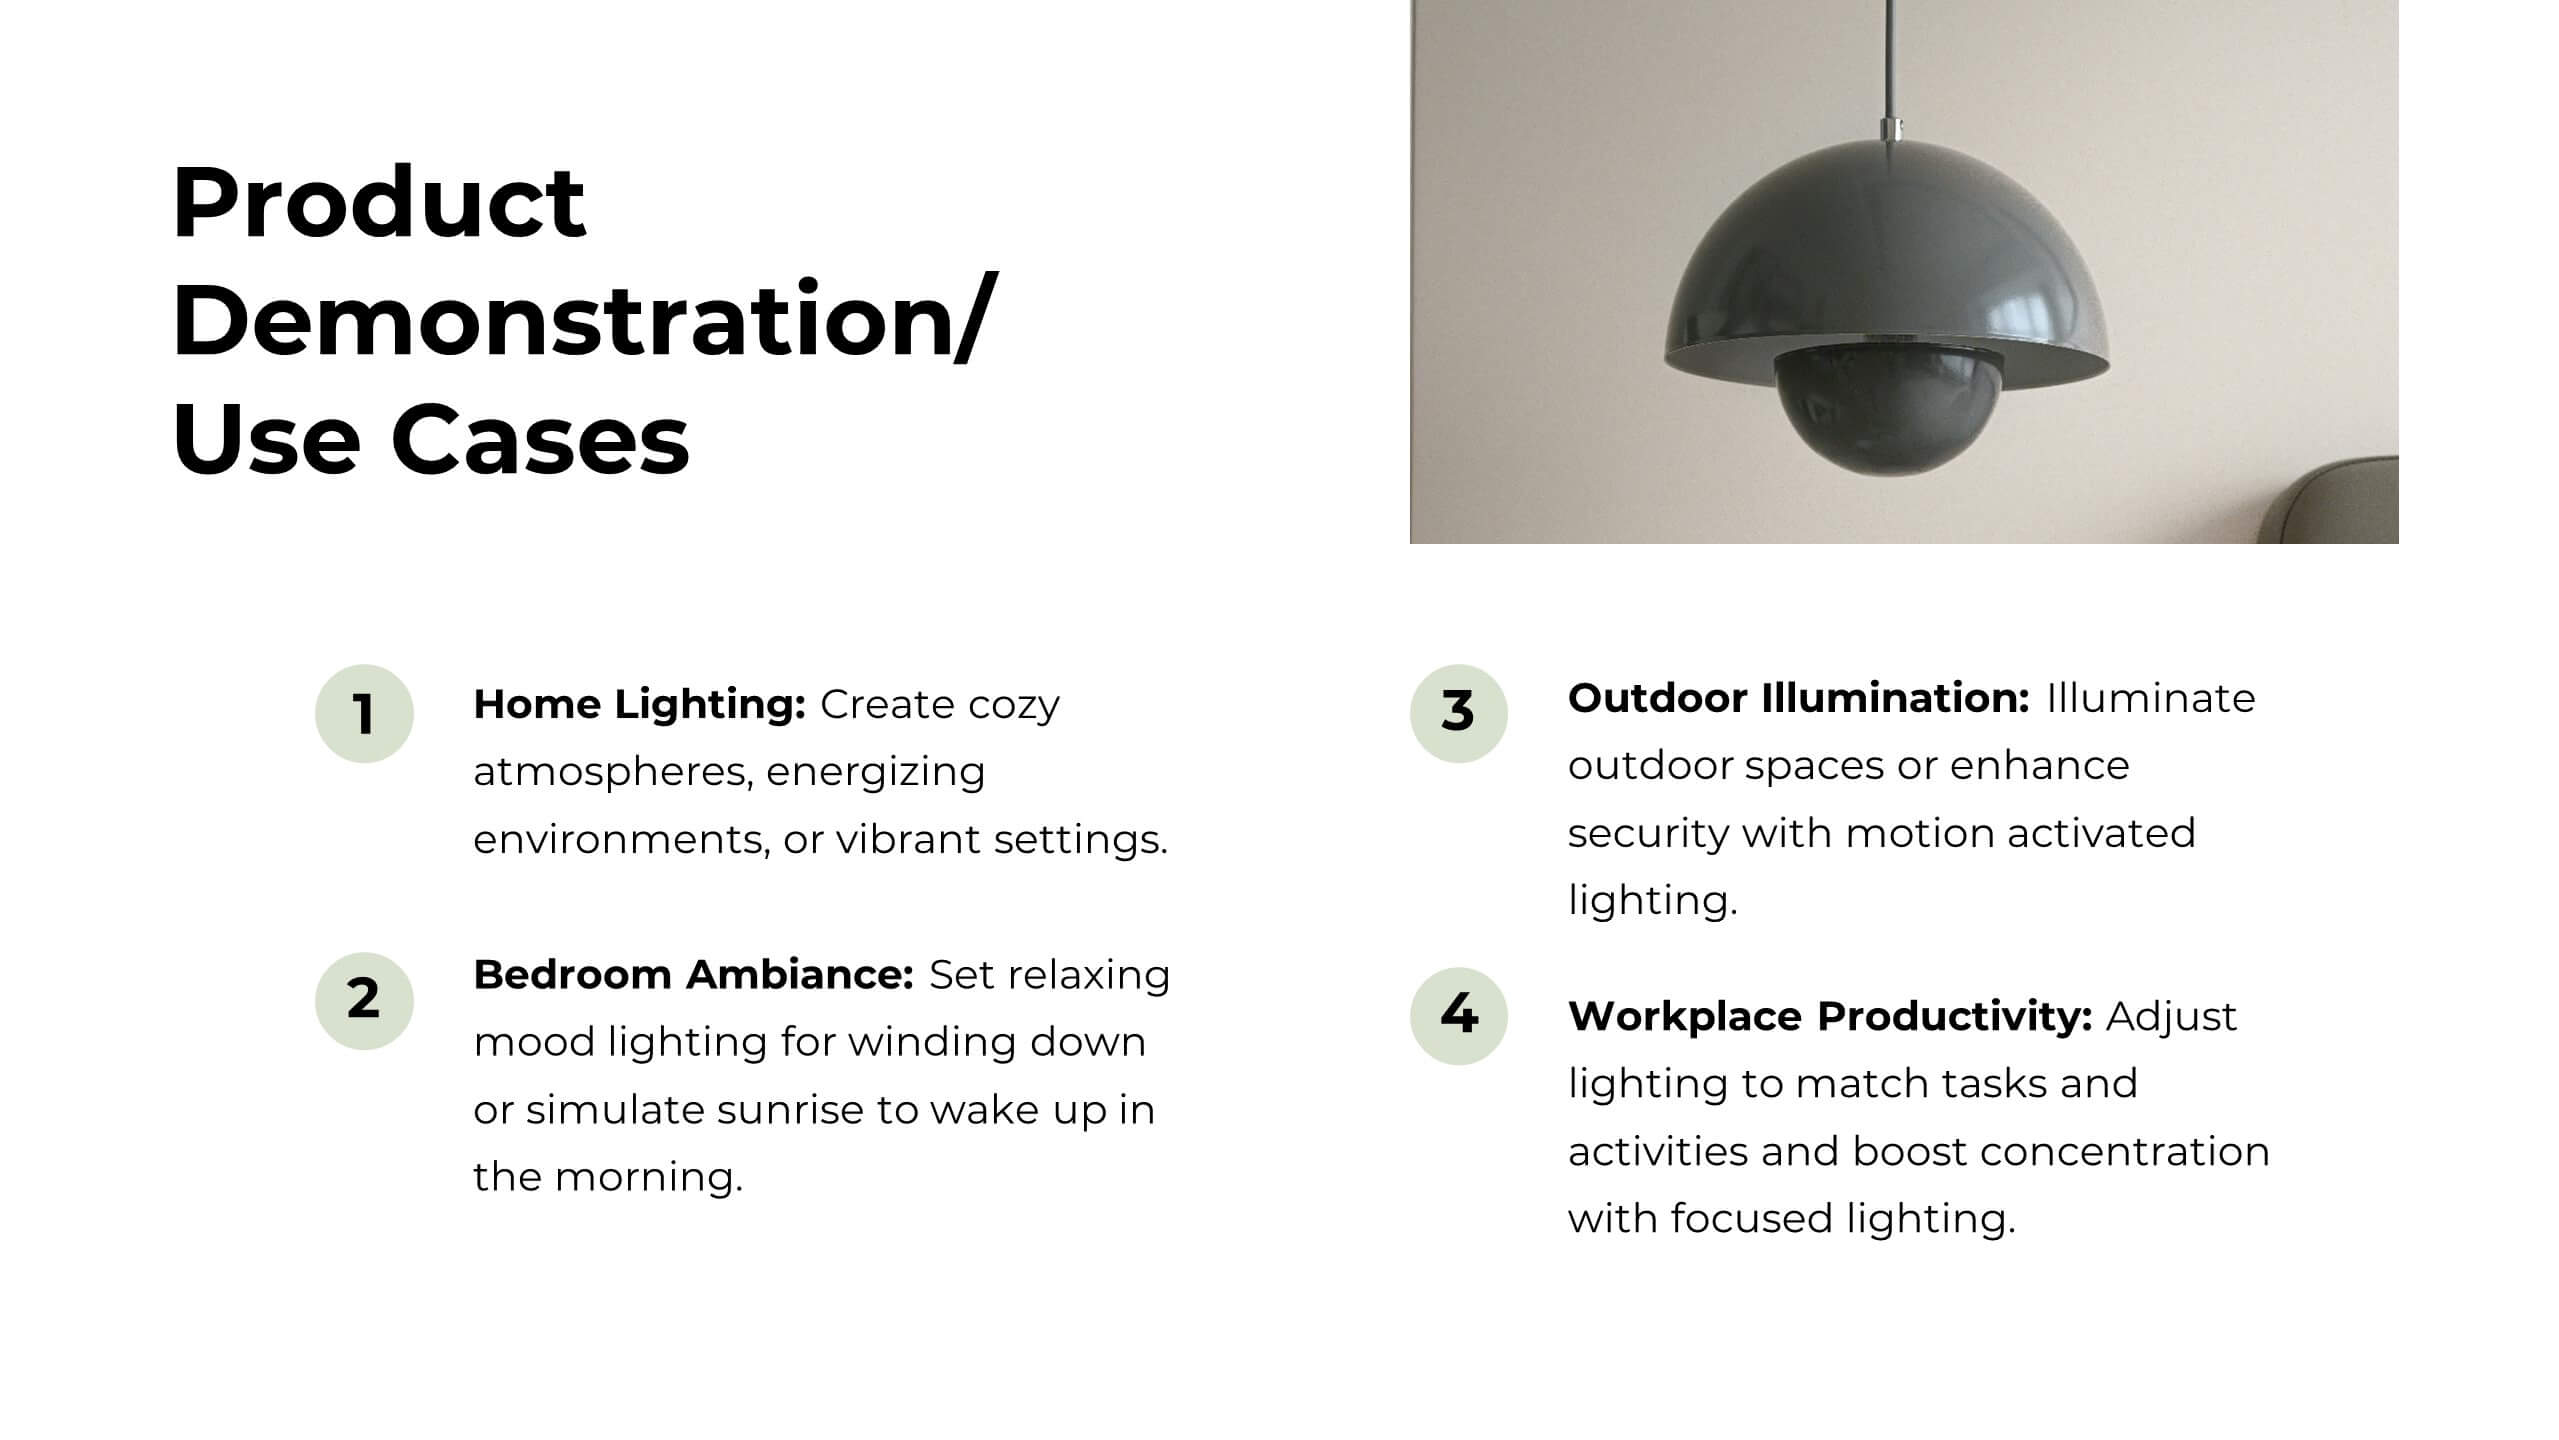
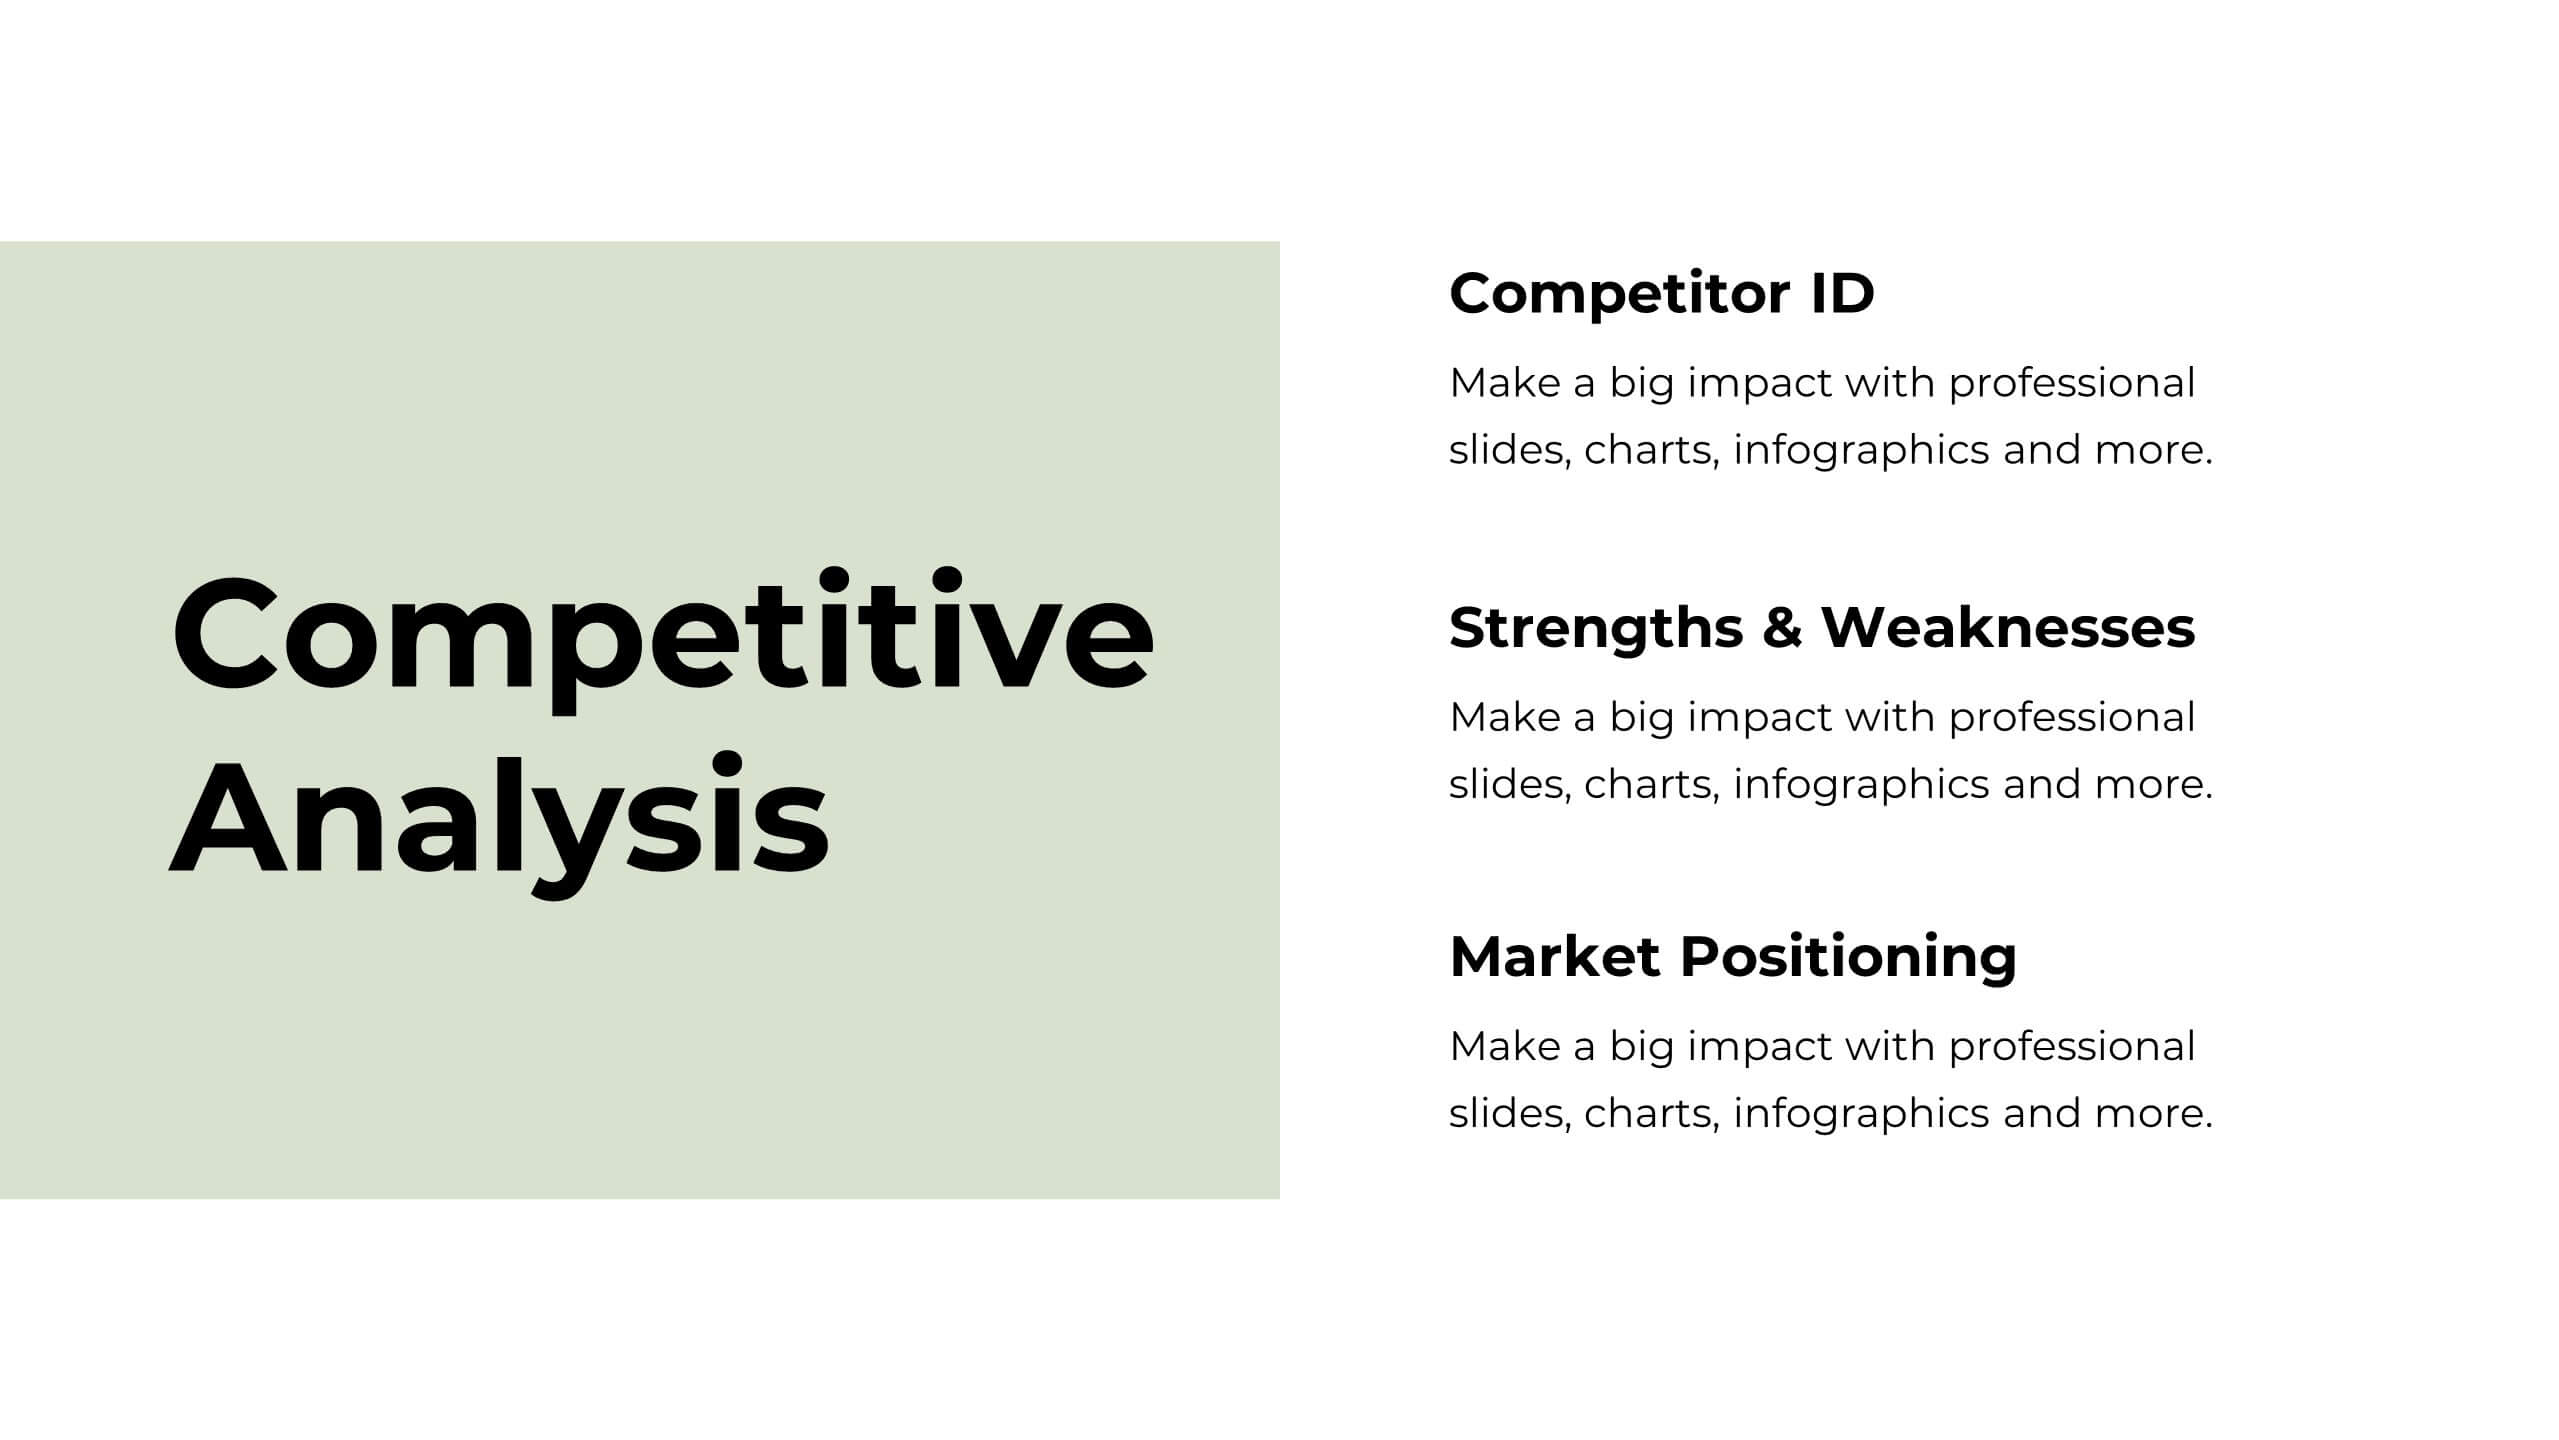
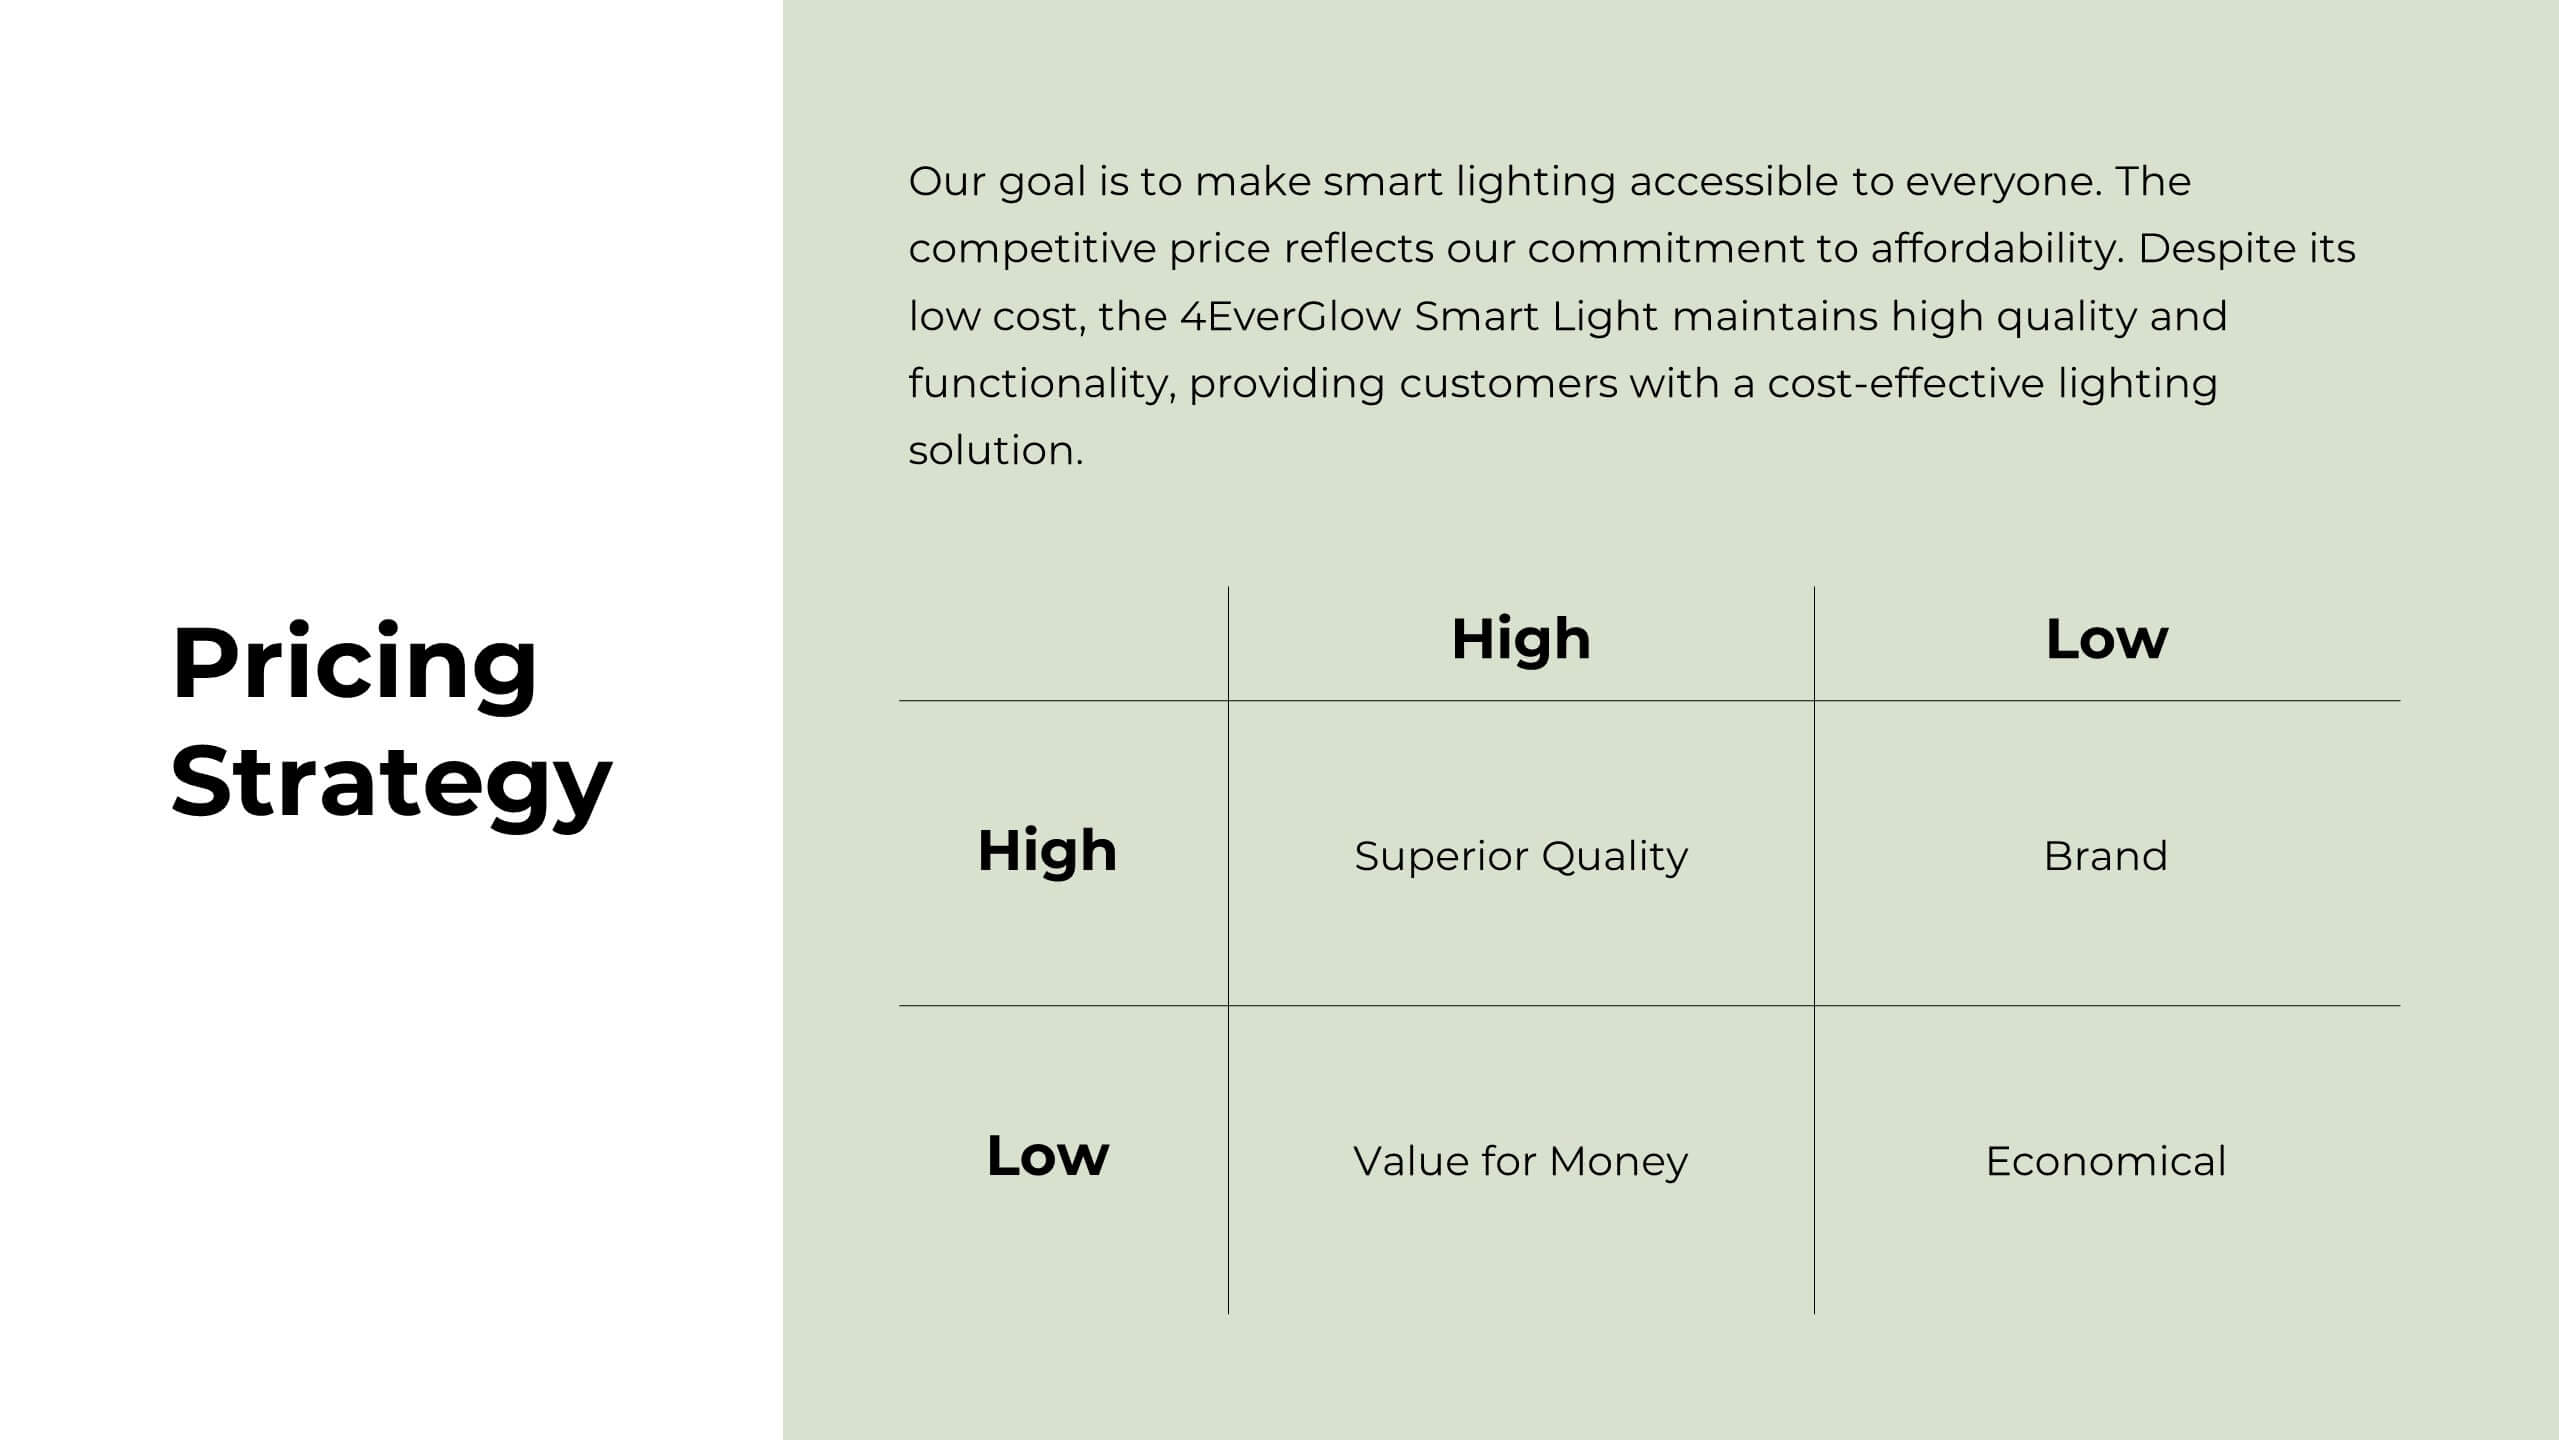
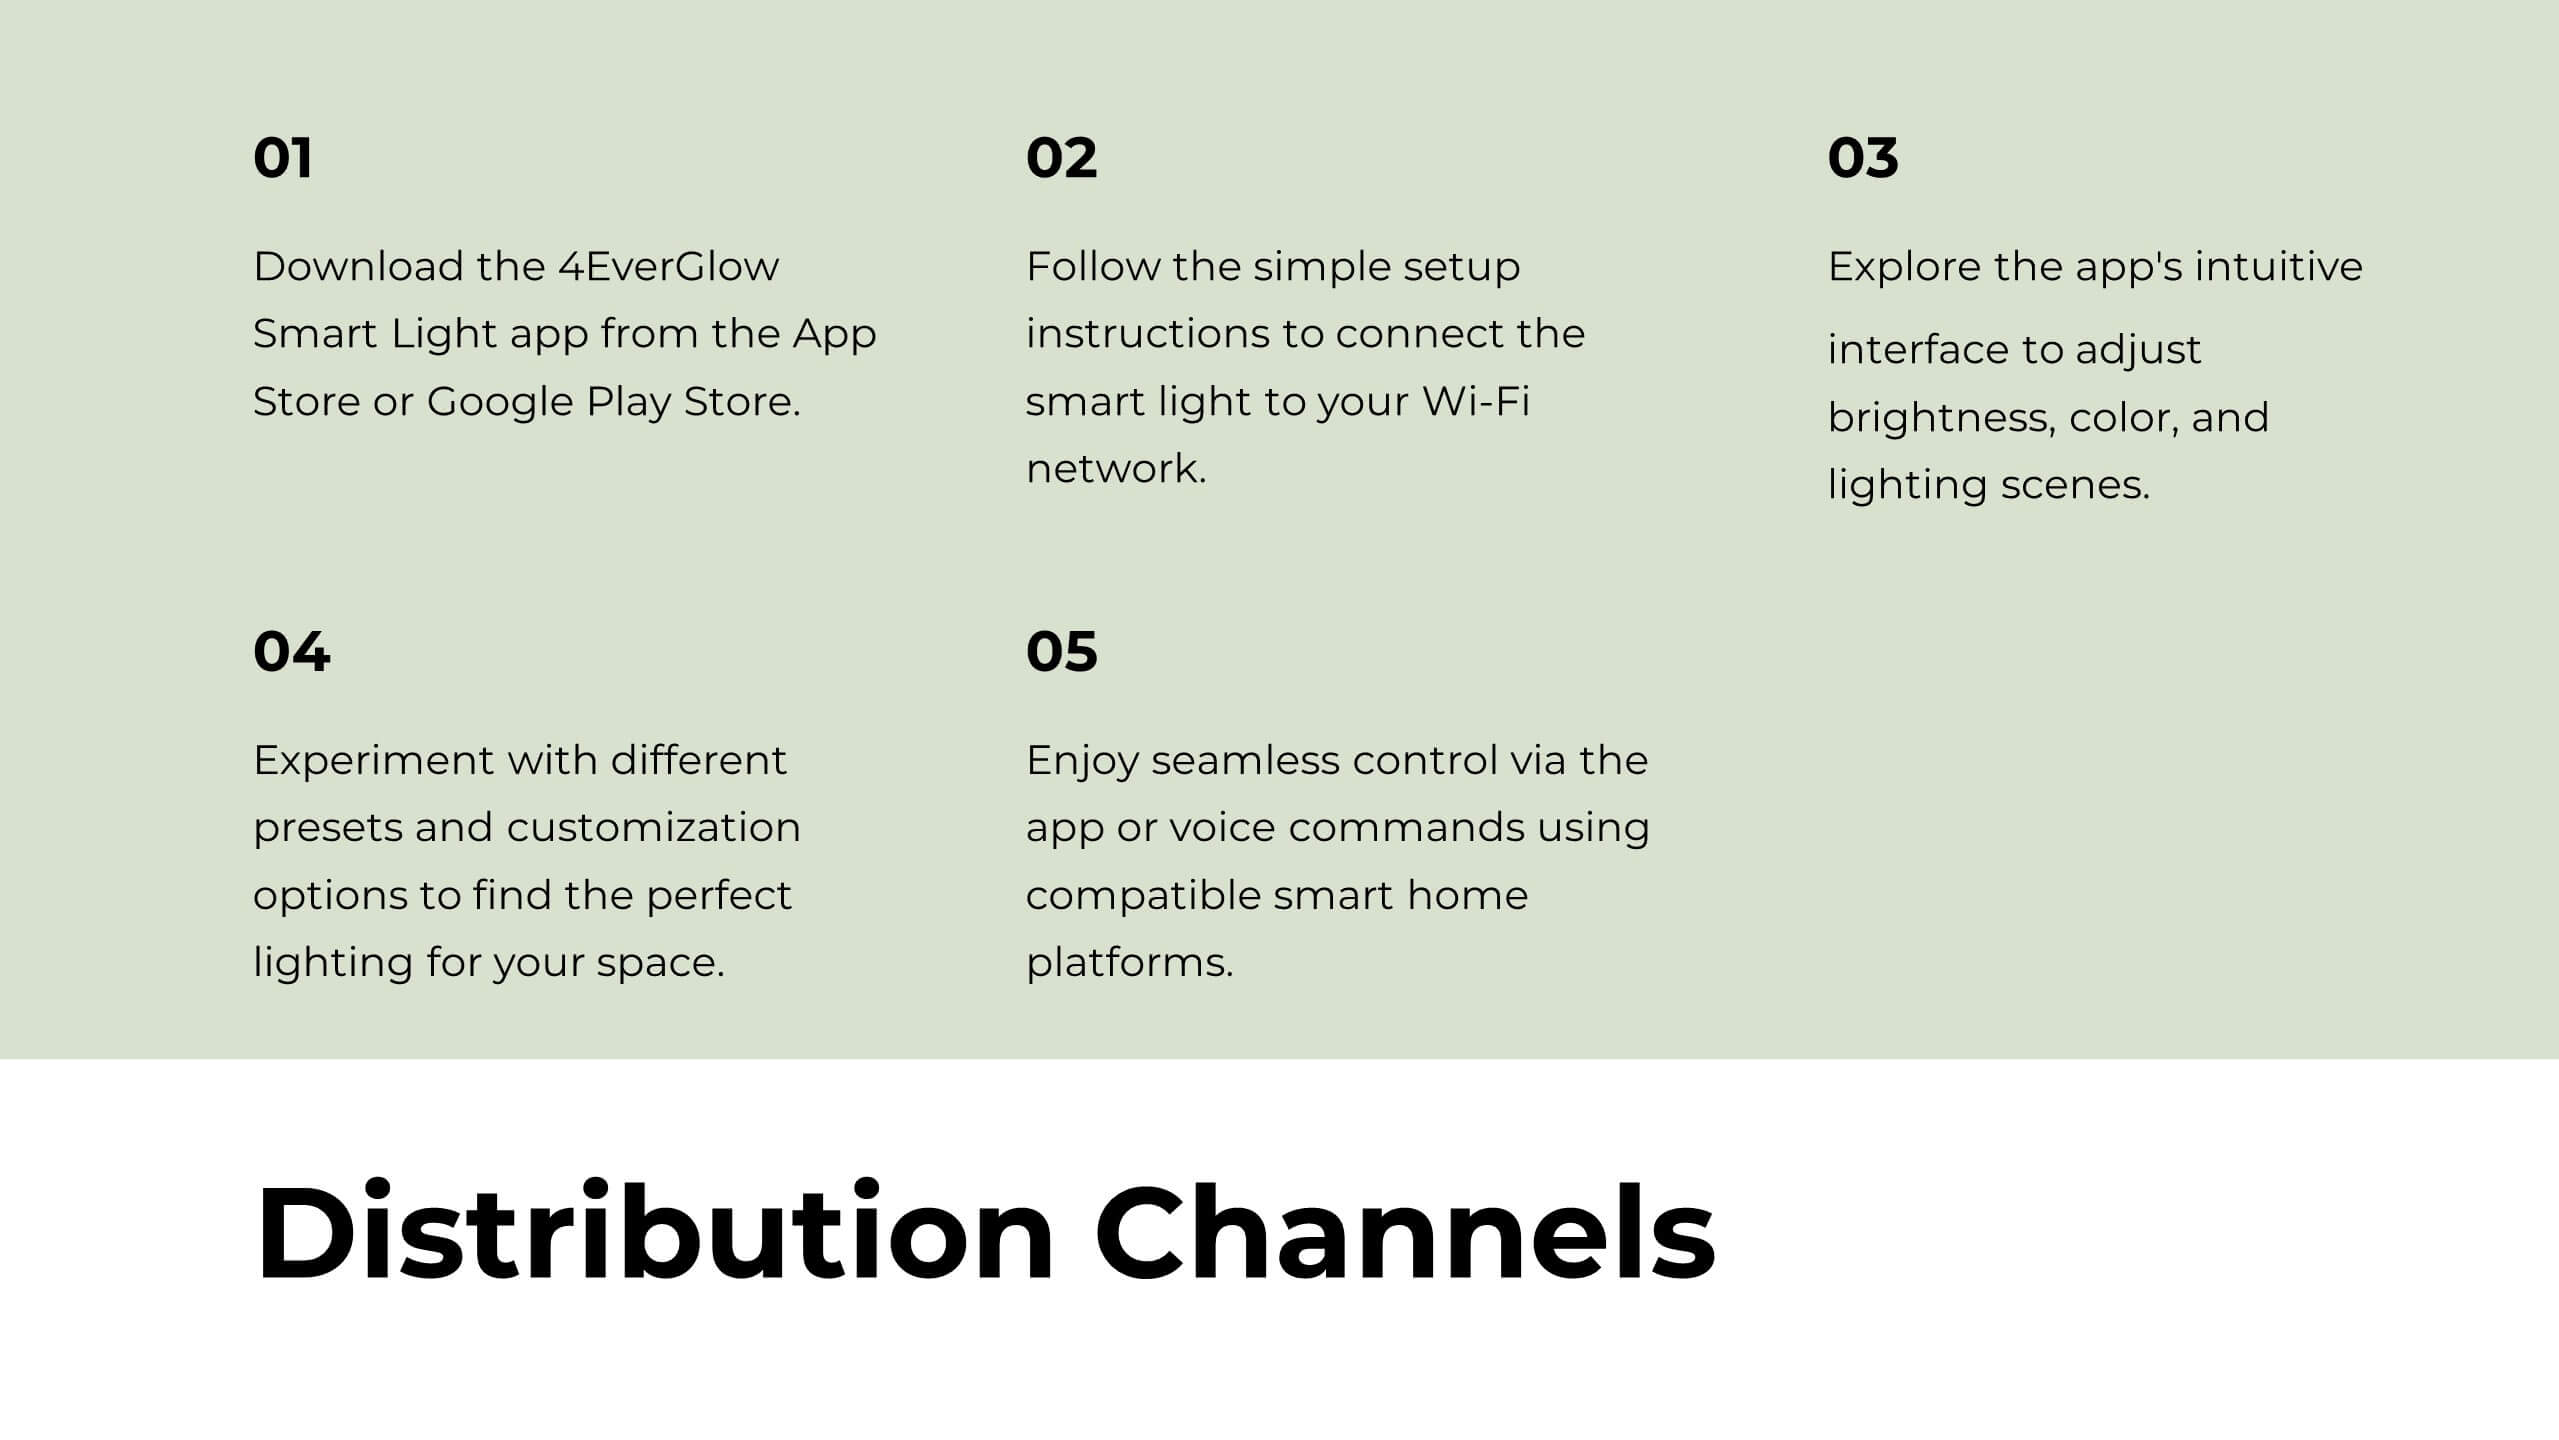
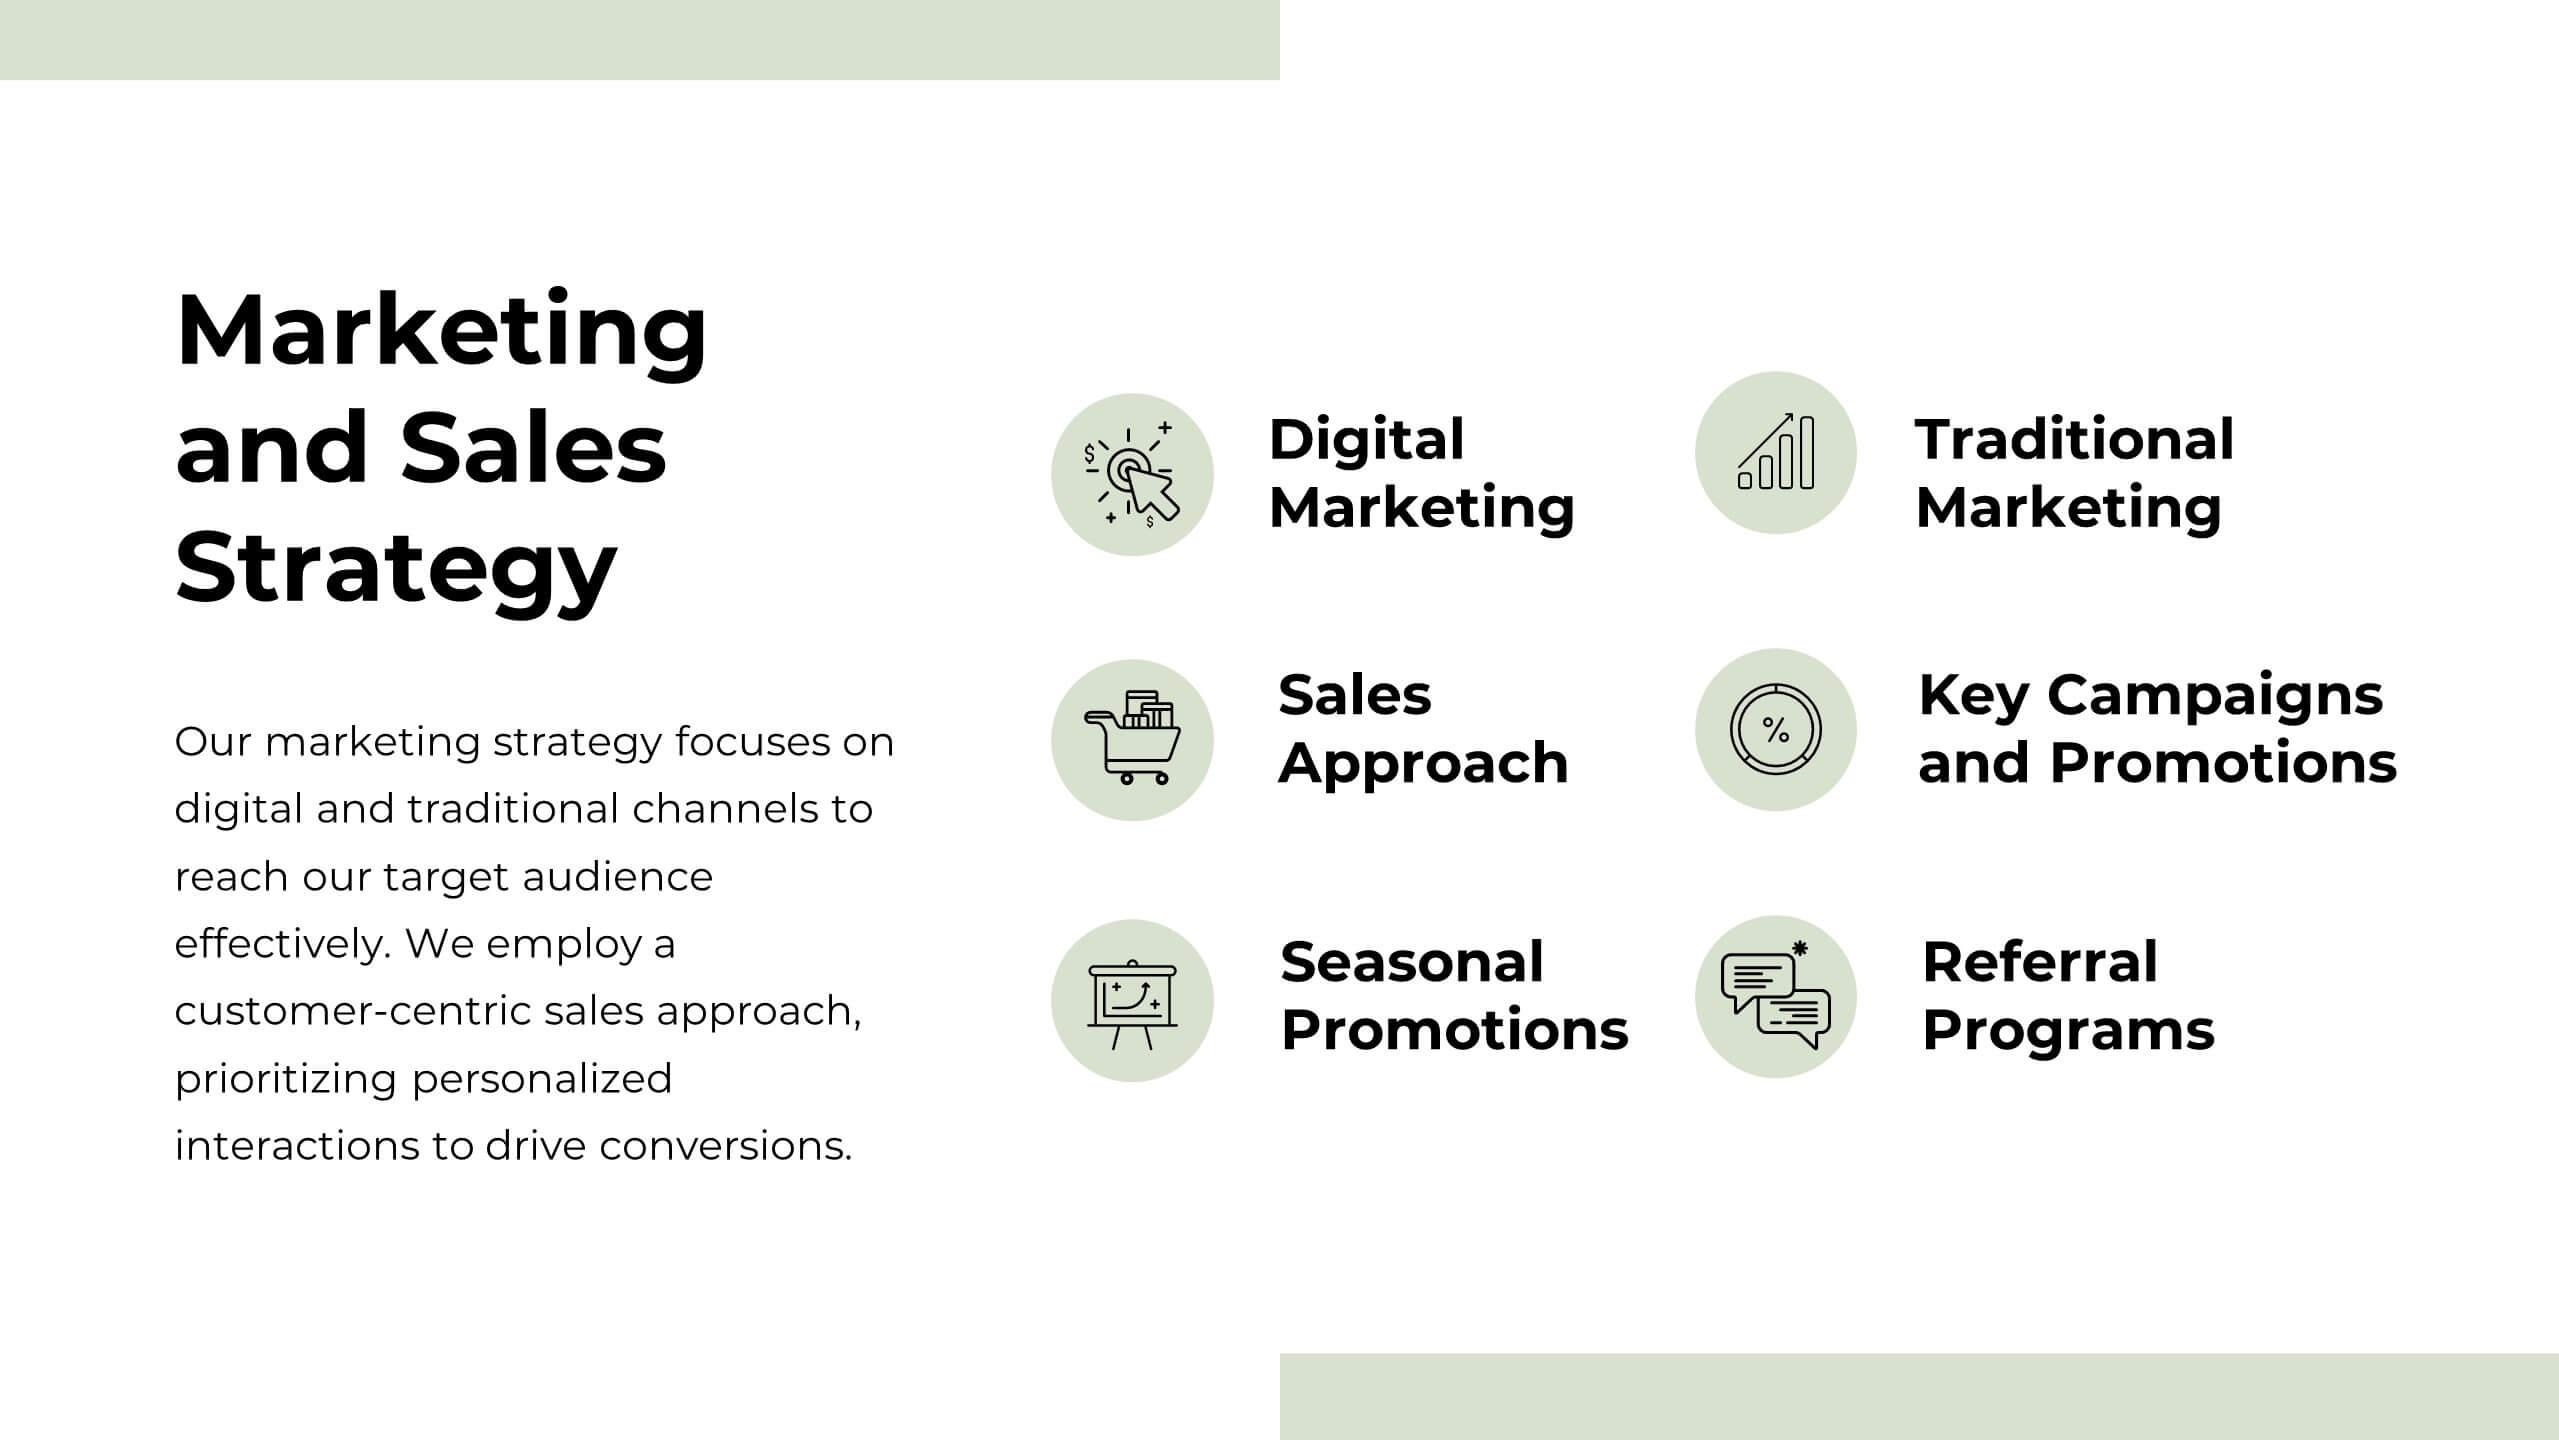
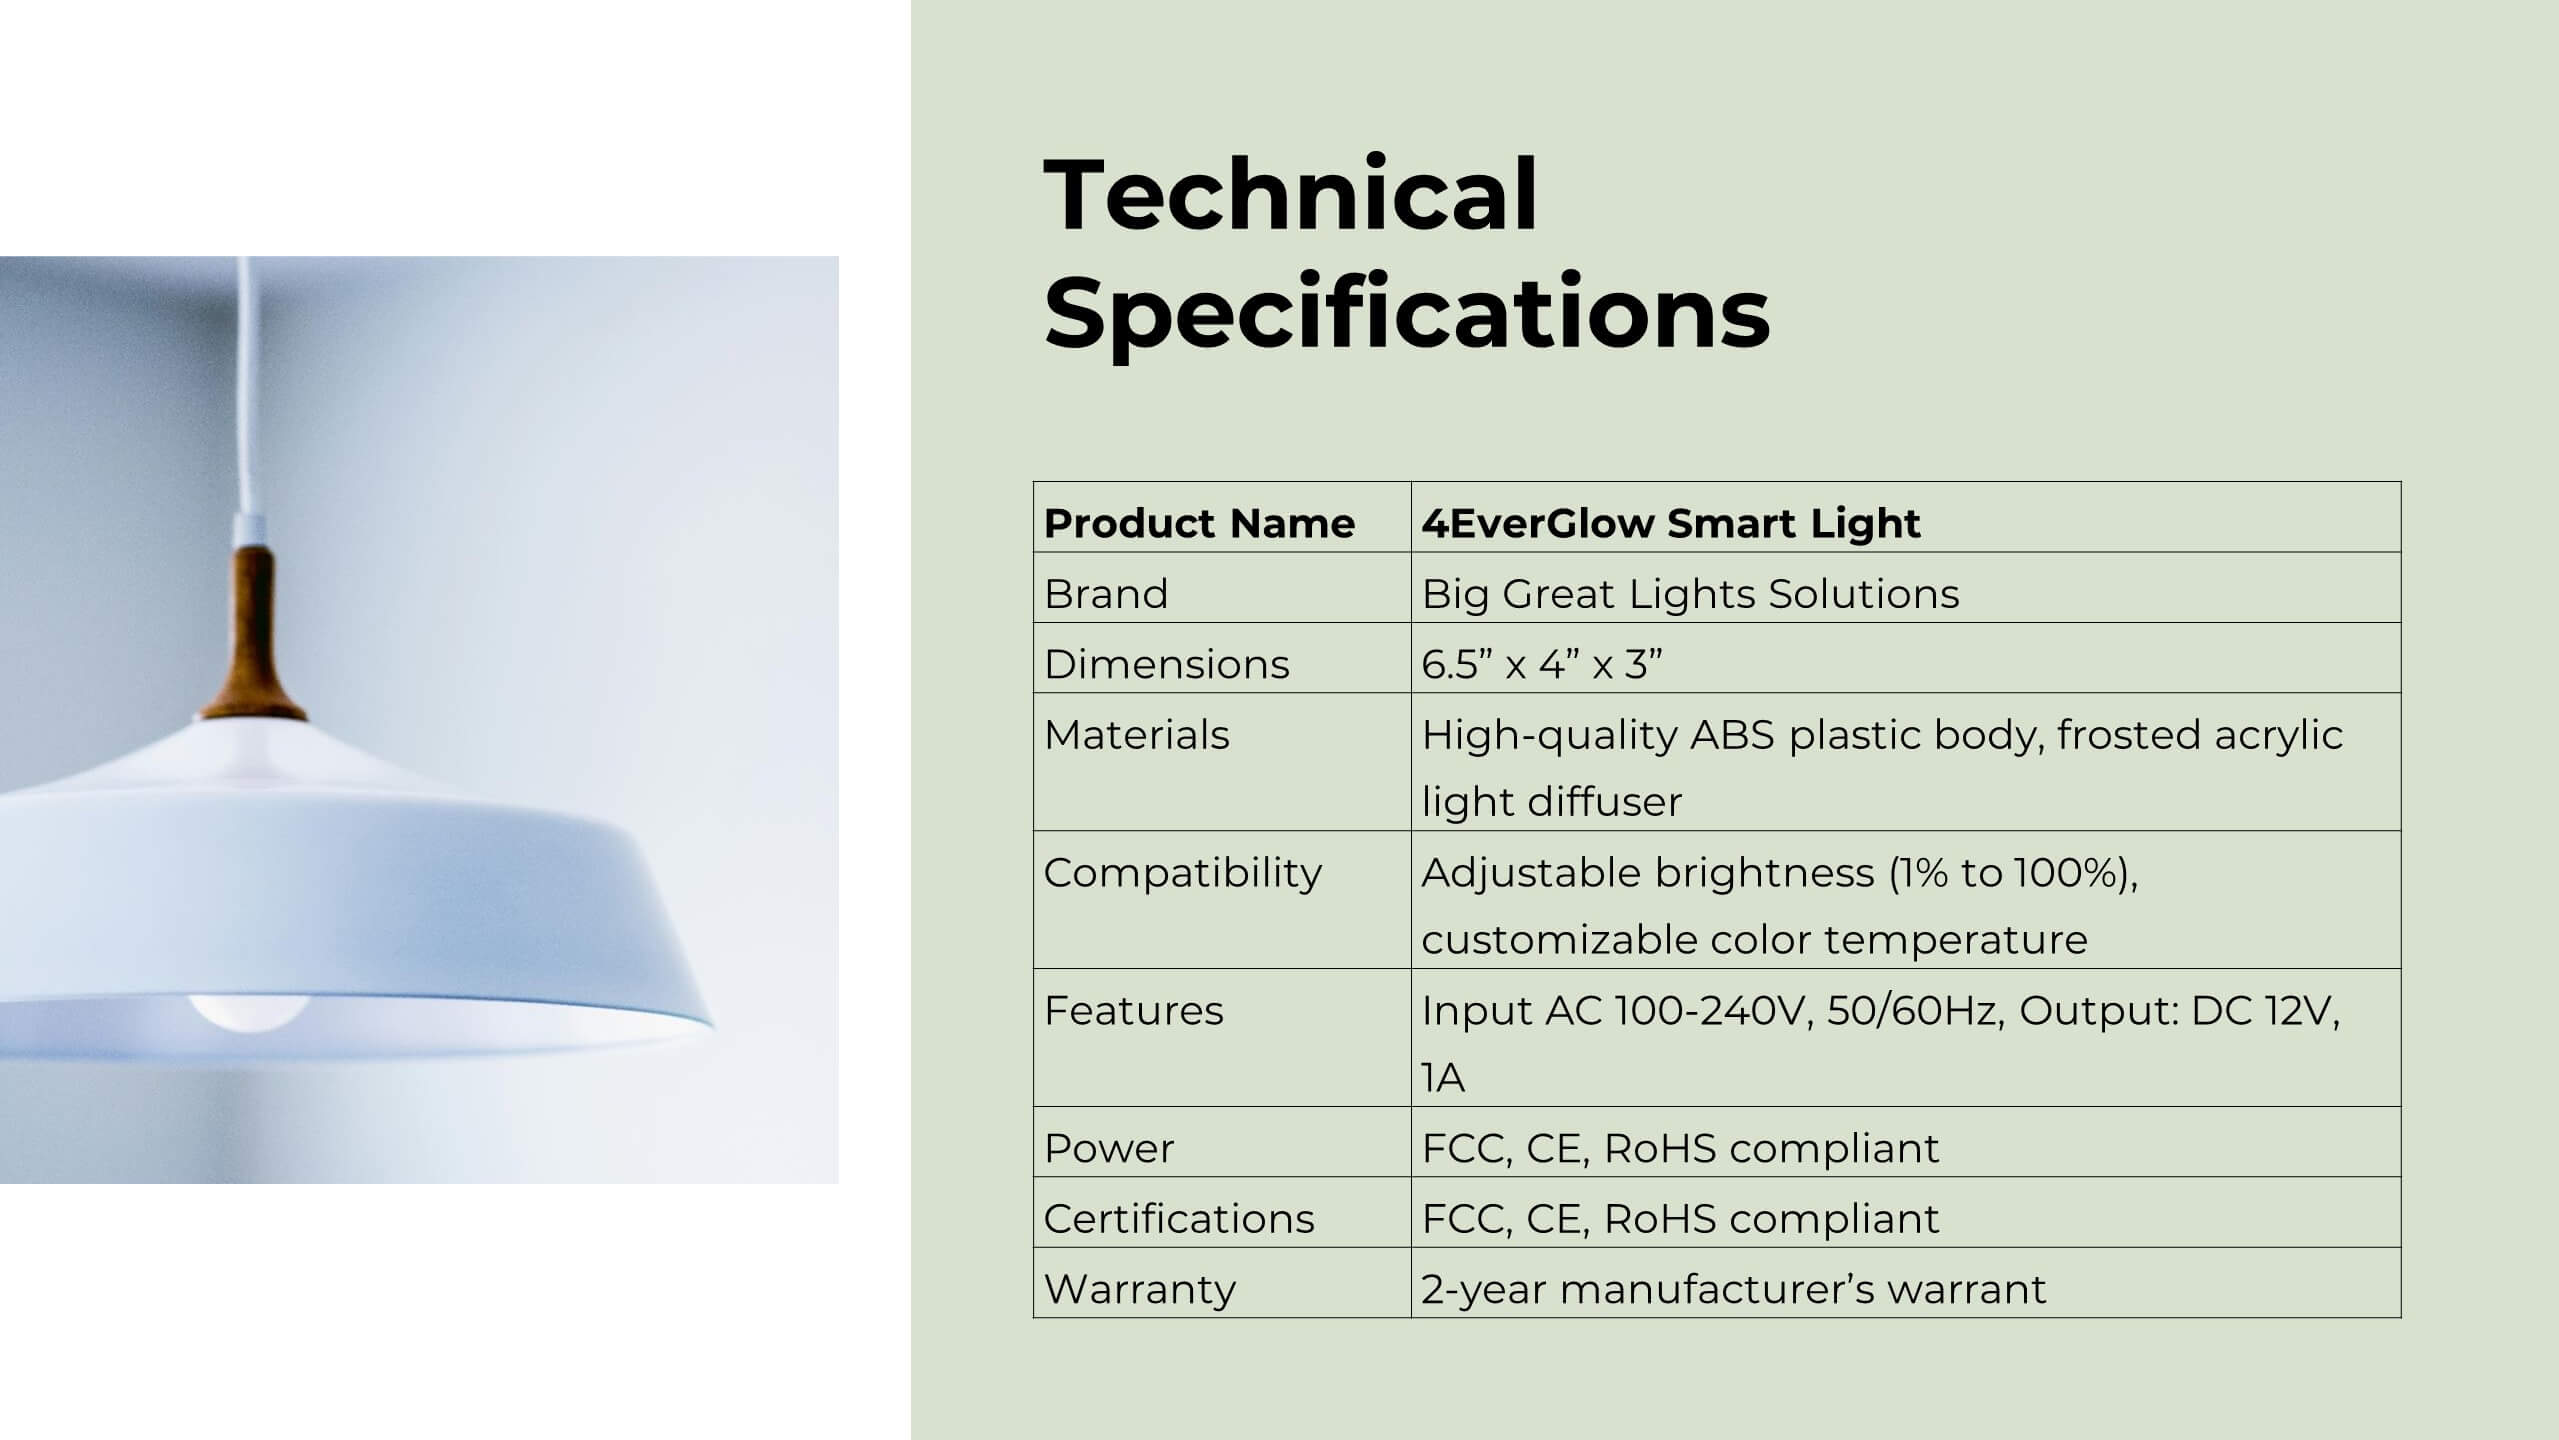
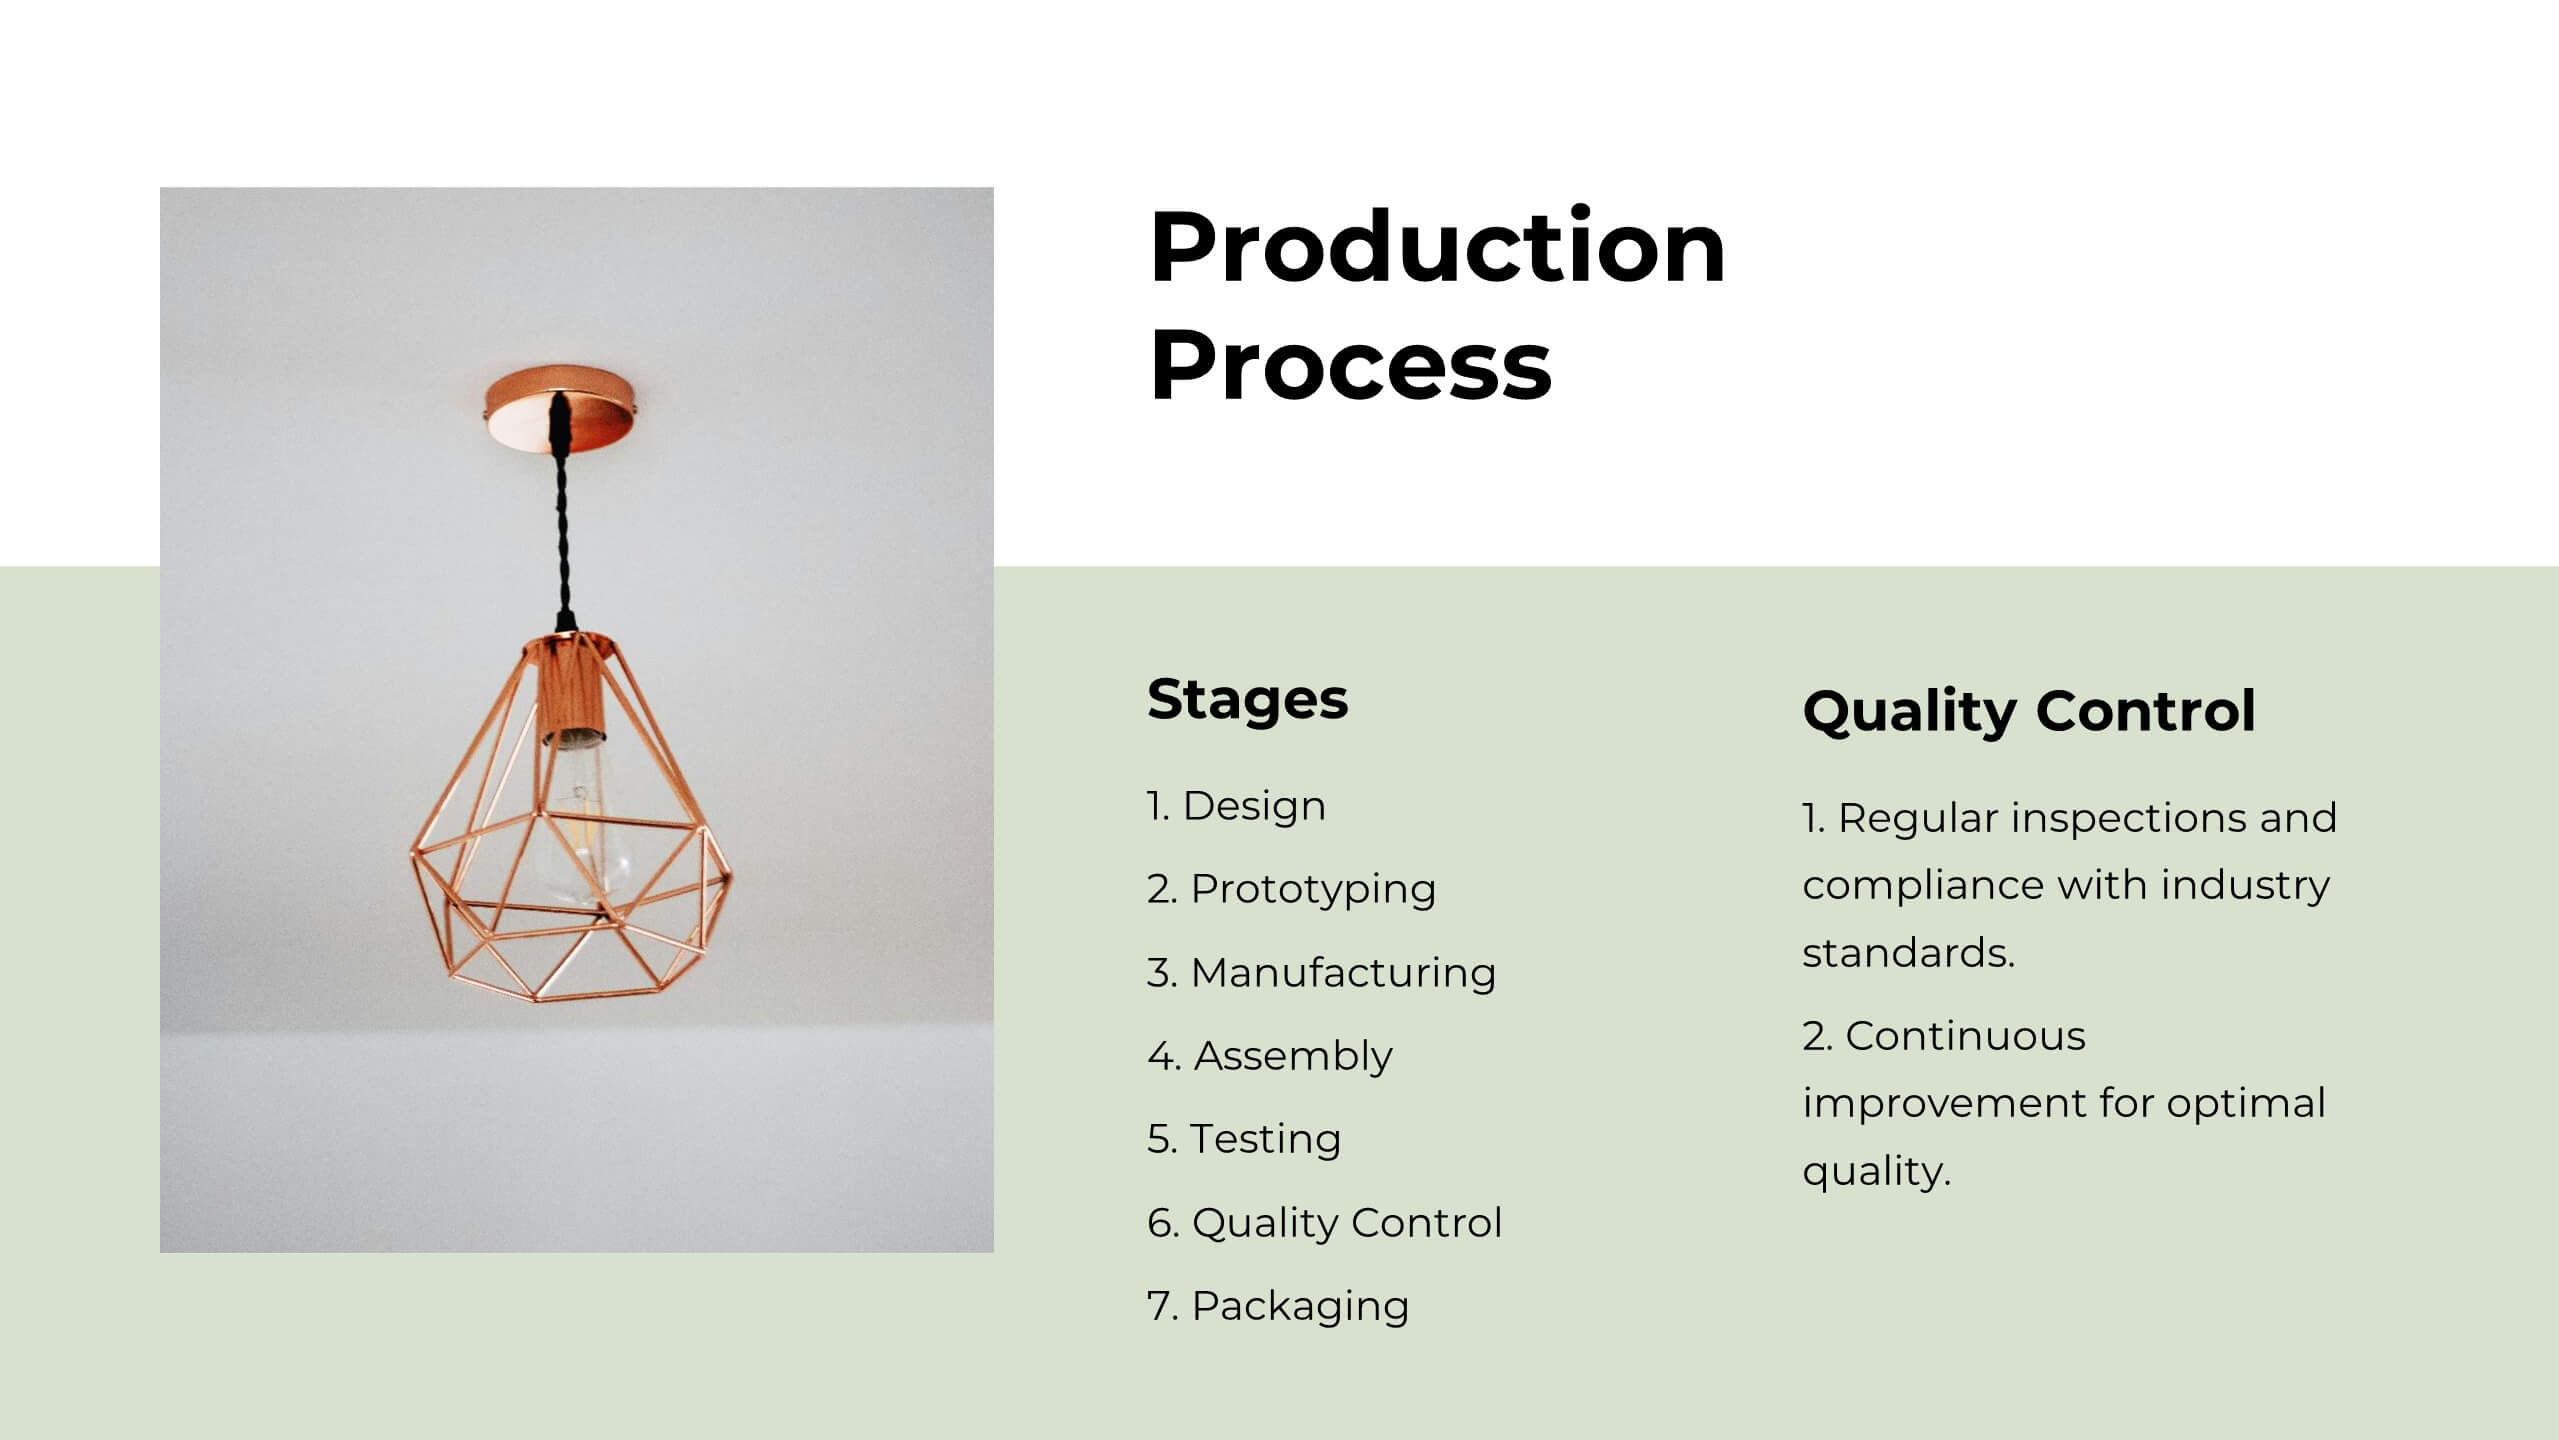
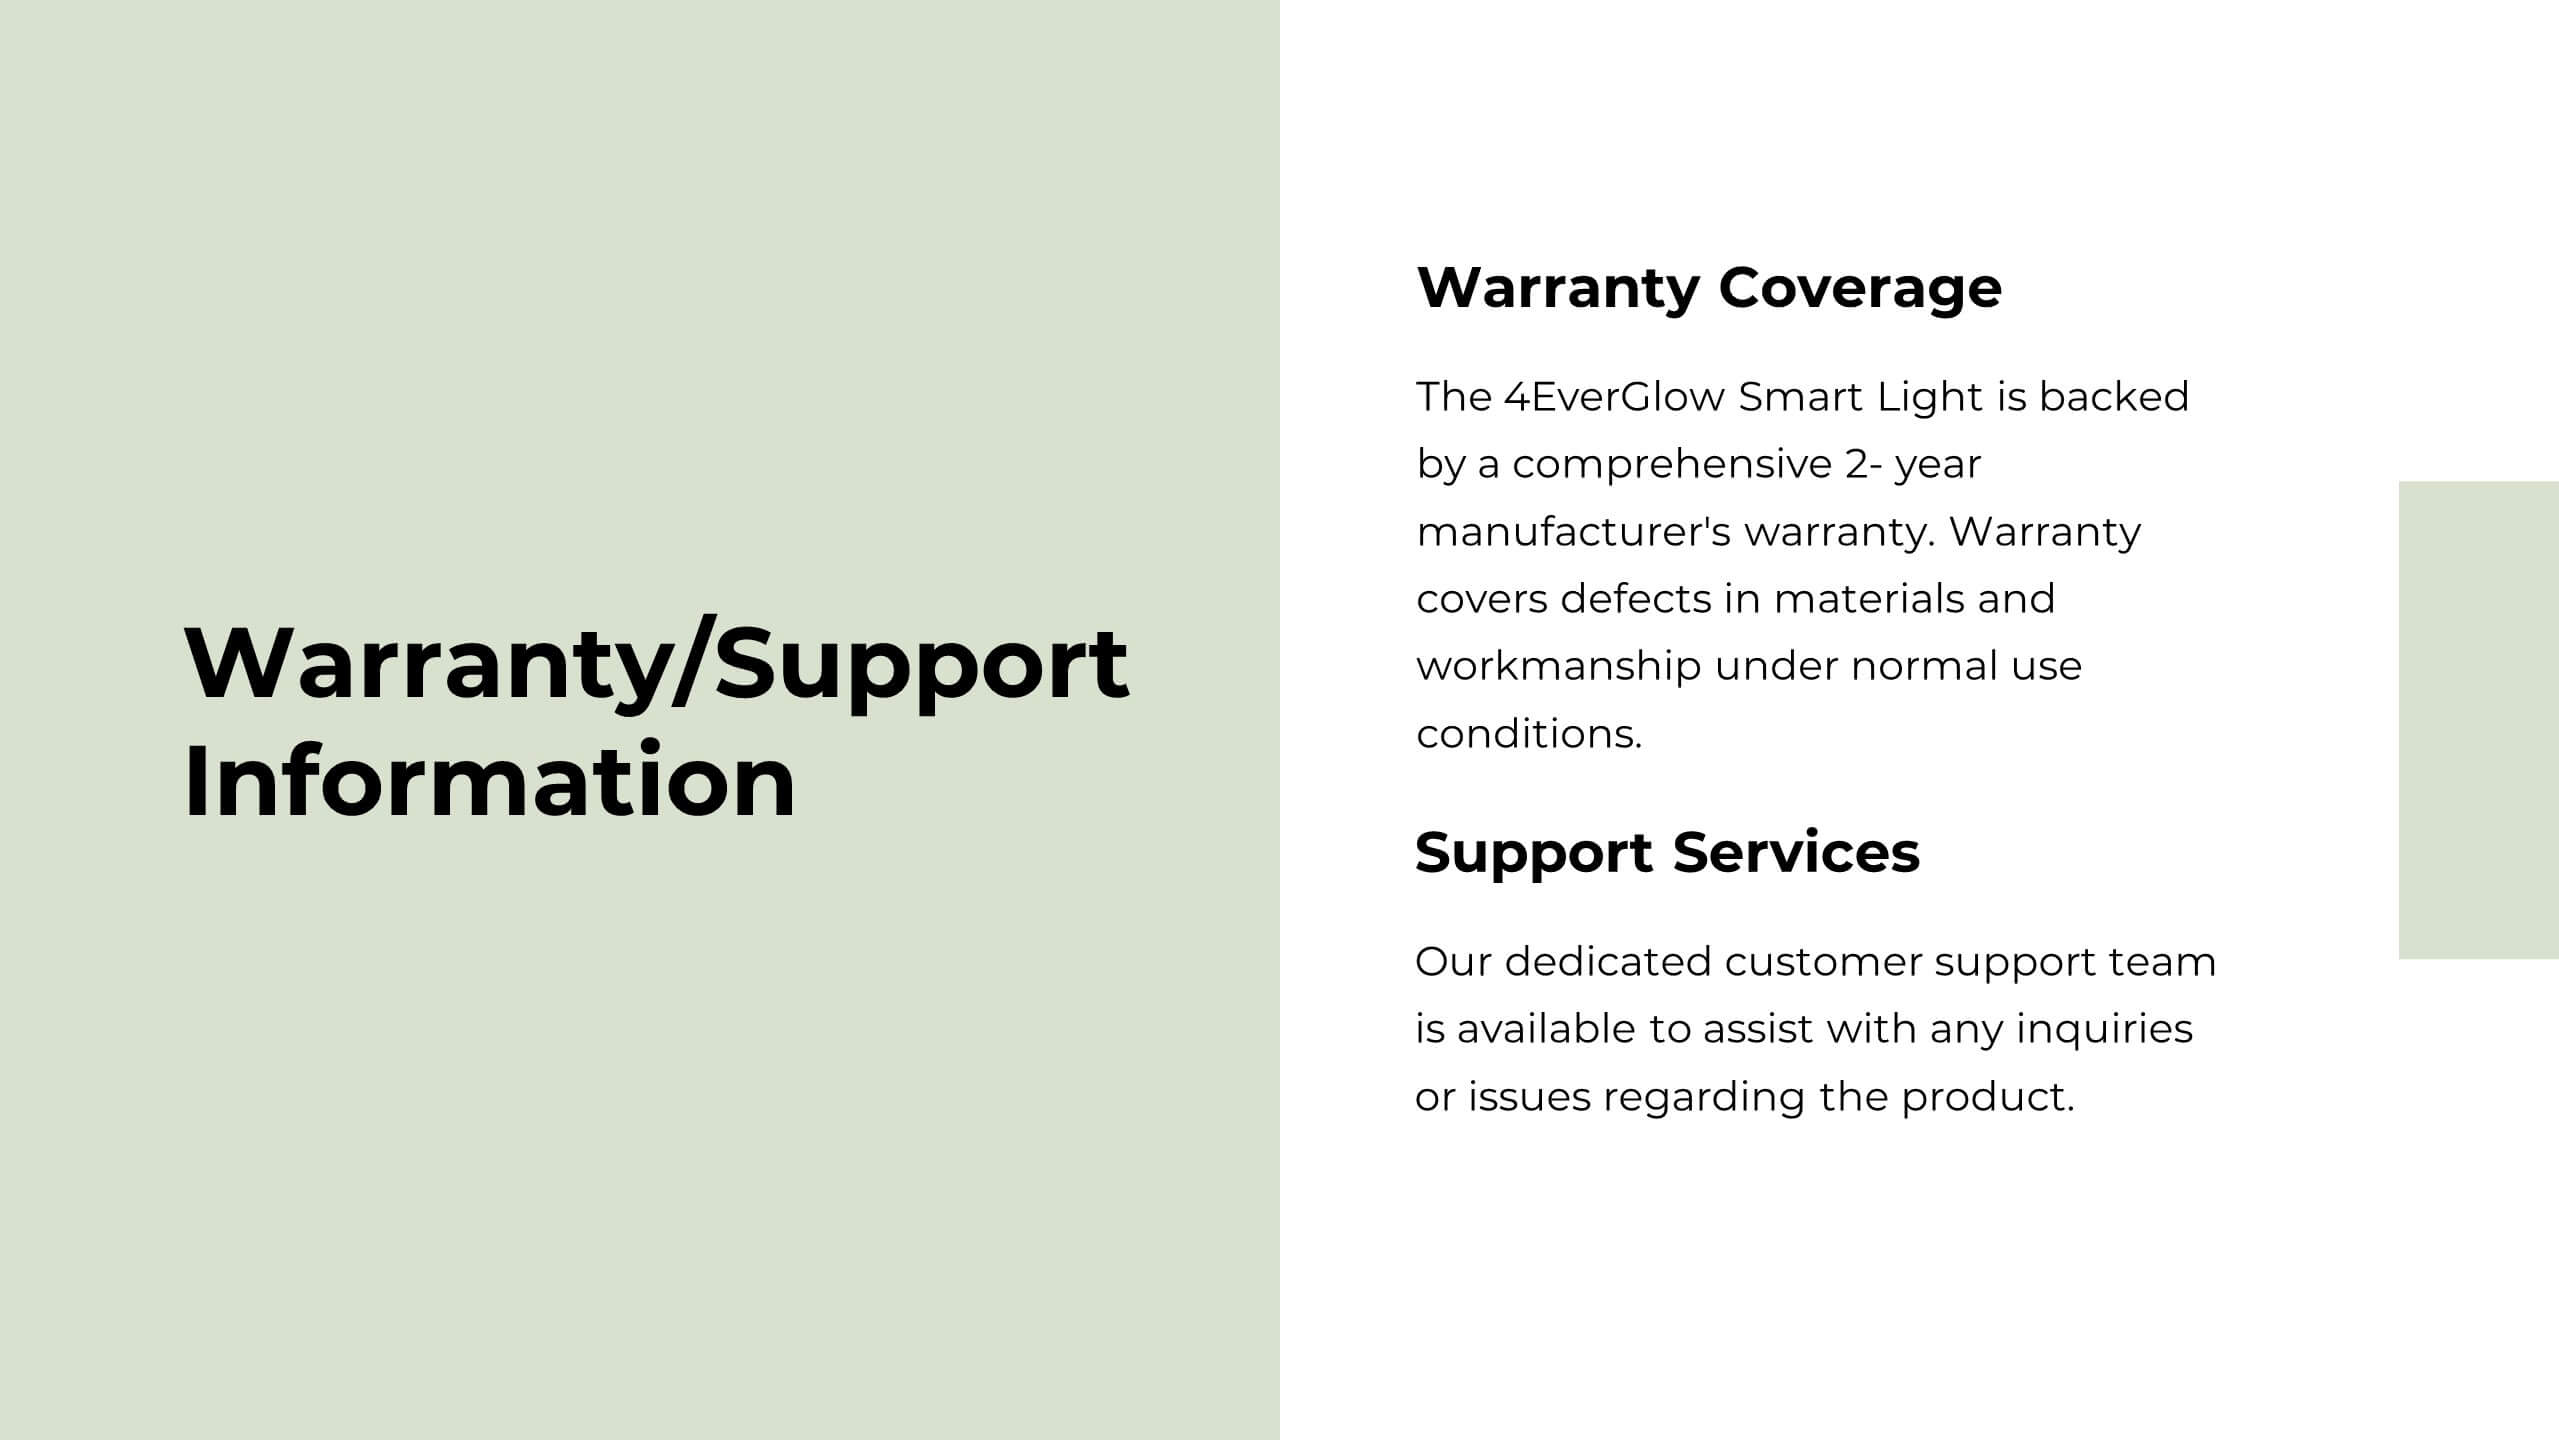
Glint Product Launch Presentation
Develop your product with confidence using this detailed product development plan template! Perfect for outlining features, market analysis, and competitive advantages. Ensure your team's efforts are aligned and maximize the impact of your product launch. Compatible with PowerPoint, Keynote, and Google Slides, it’s your ideal companion for successful product development.


4 diapositivas
Social and Professional Networking
Visualize global connections and collaborative ecosystems with this Social and Professional Networking presentation. Ideal for HR teams, marketers, or networking strategists, it showcases relationship-building and engagement across key hubs. Fully customizable in PowerPoint, Keynote, and Google Slides for maximum flexibility in any professional setting.


10 diapositivas
IT Infrastructure and Support
Present your tech strategy with clarity using this IT infrastructure and support slide. Featuring a segmented donut chart and coordinated icon-labeled sections, it's perfect for visualizing network components, system layers, or support processes. Ideal for CIOs, IT managers, and tech teams, and fully editable in PowerPoint, Keynote, or Google Slides.


21 diapositivas
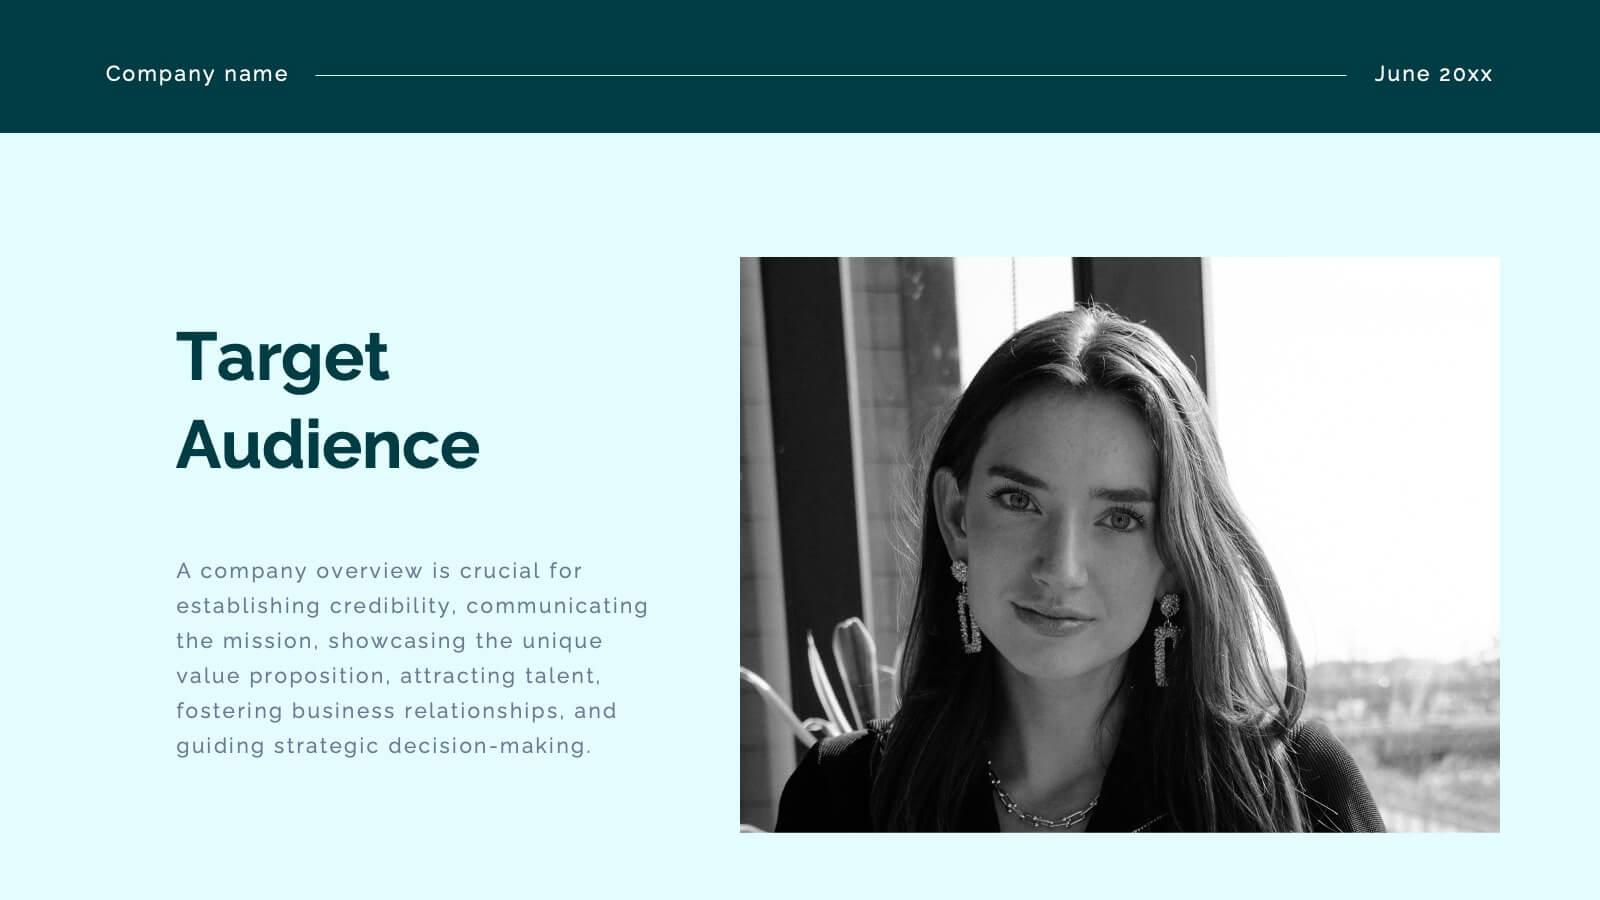
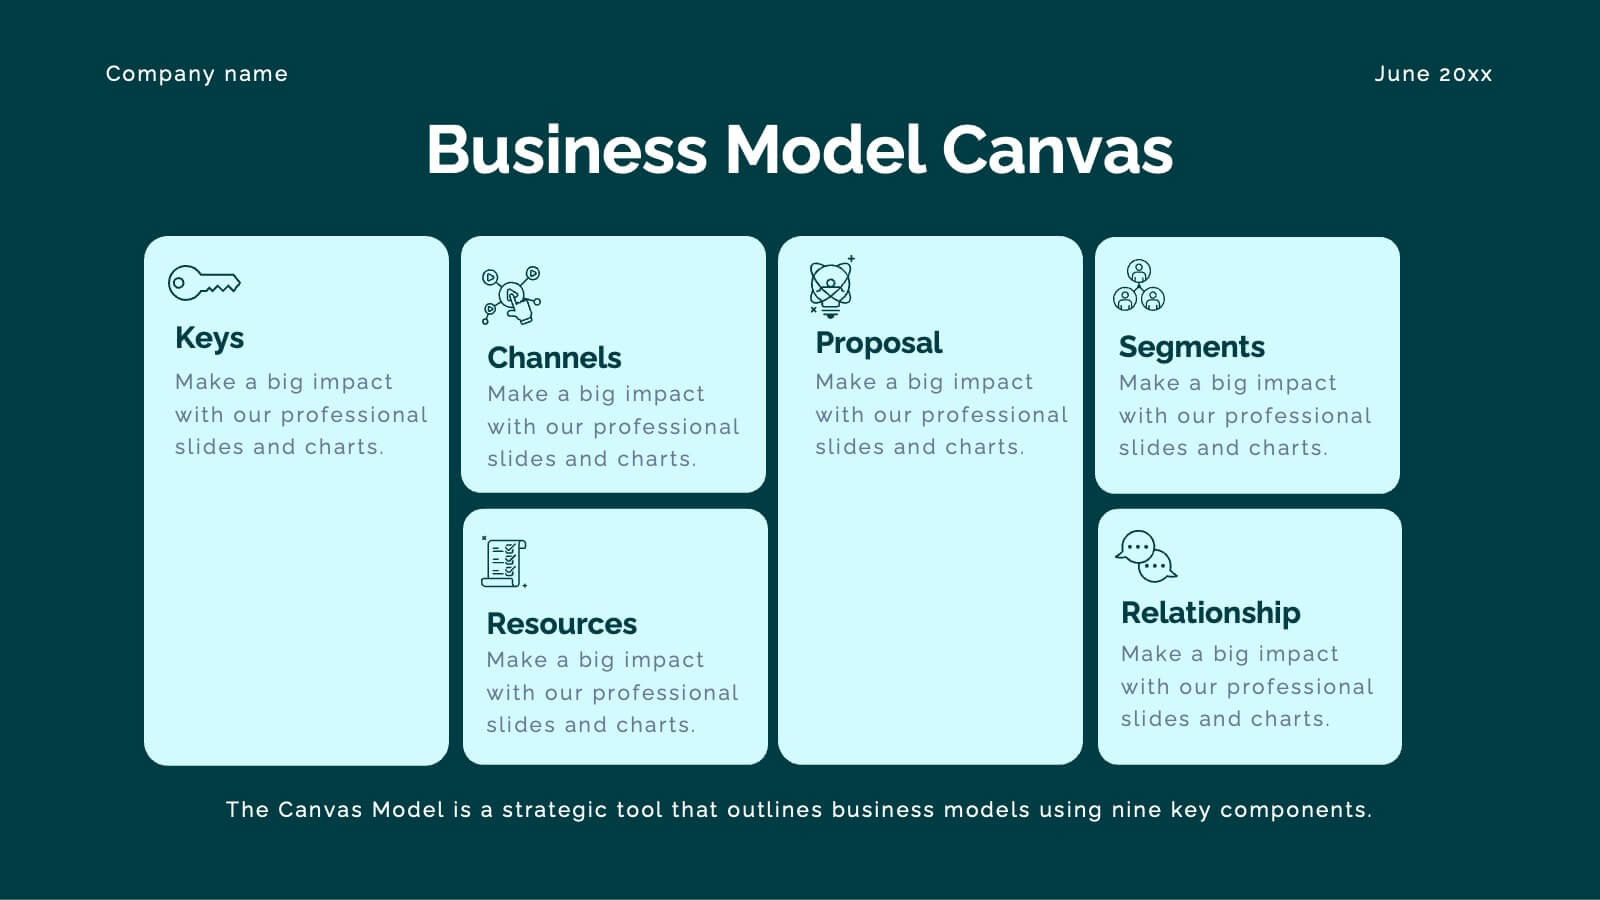
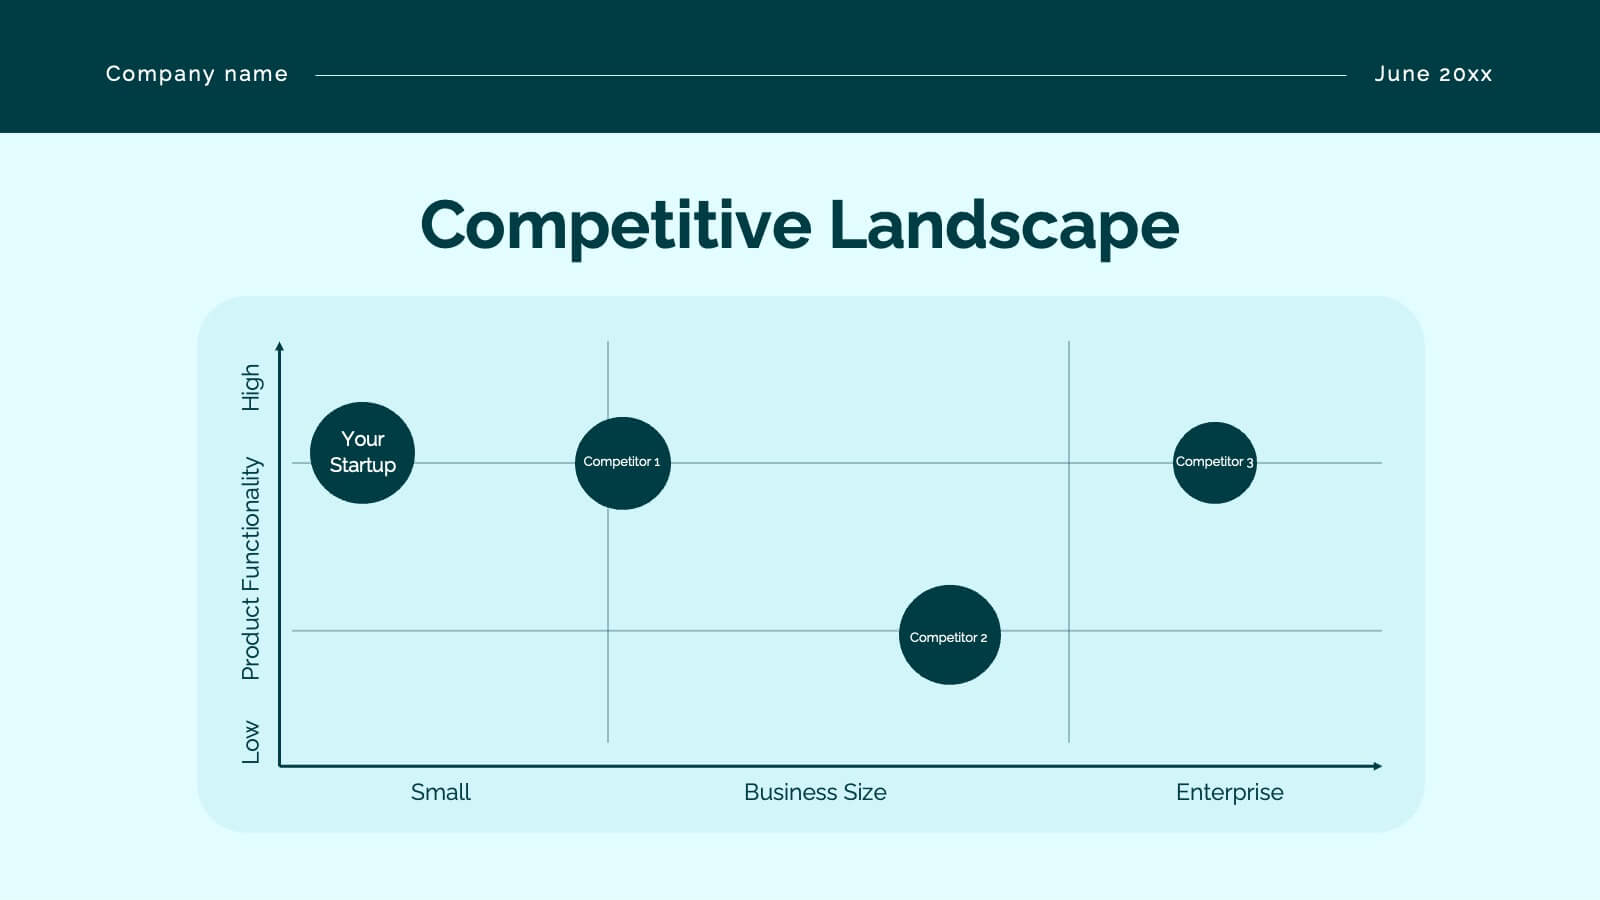
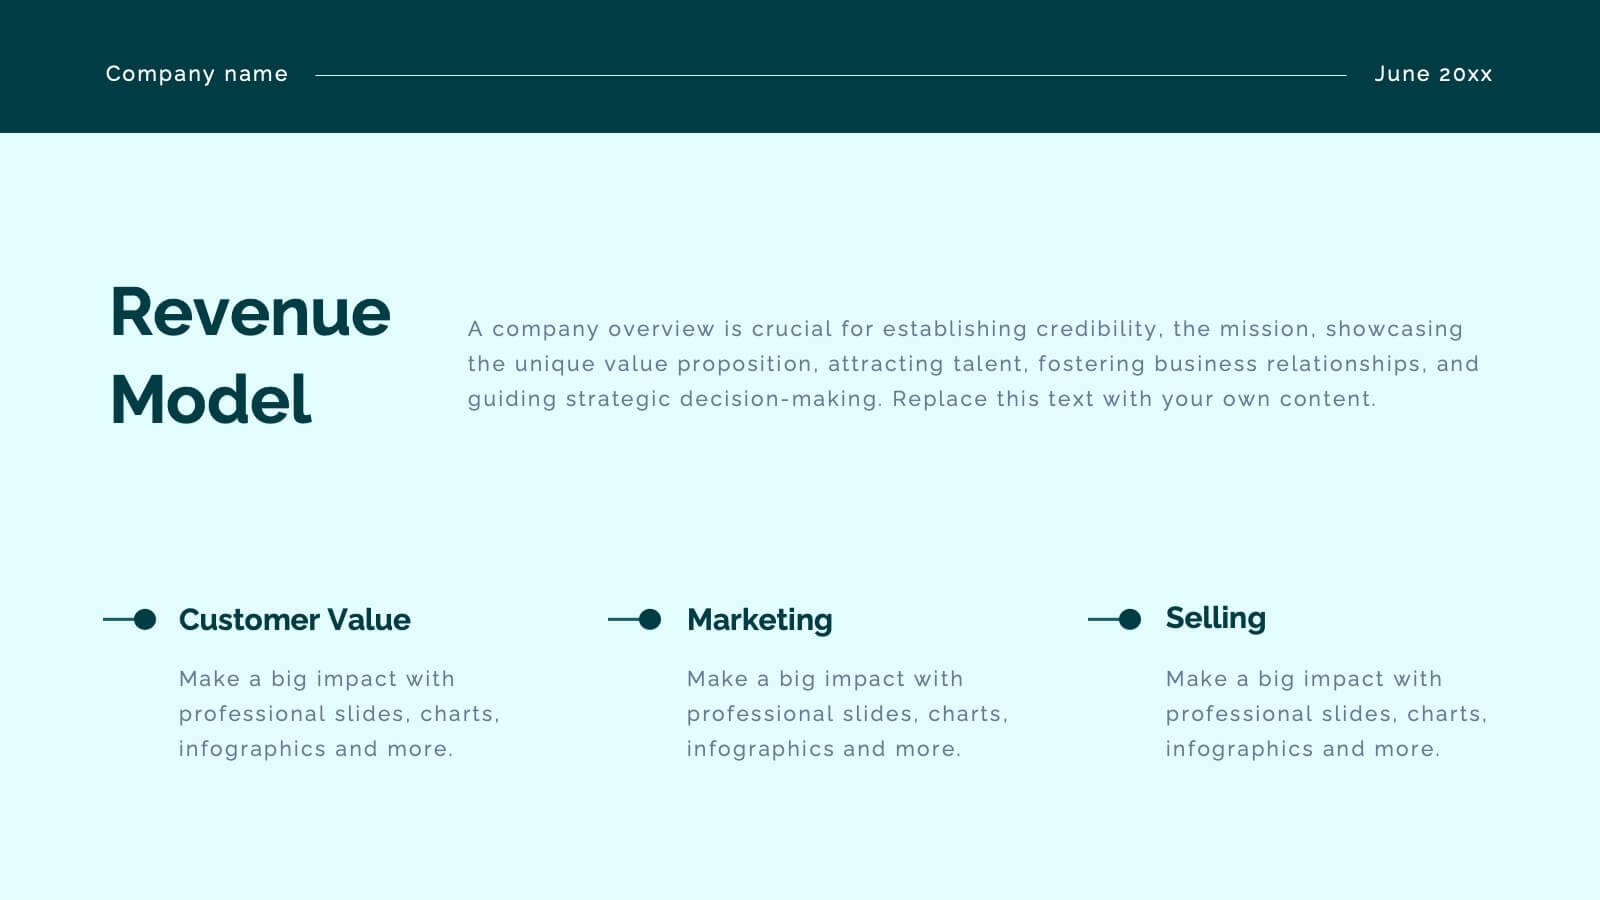
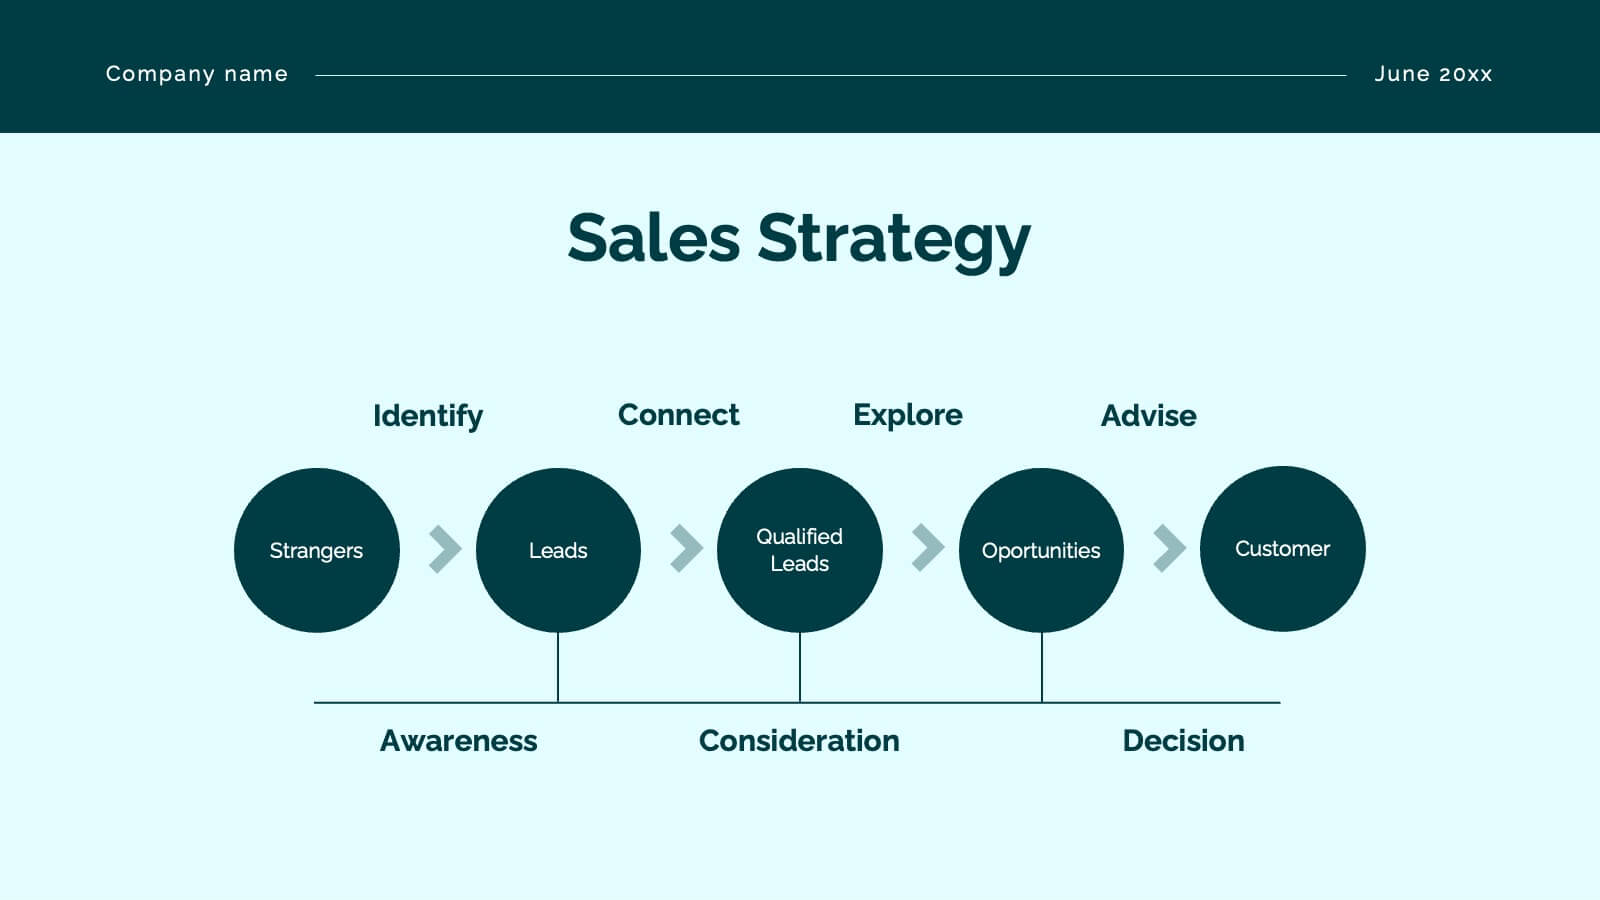
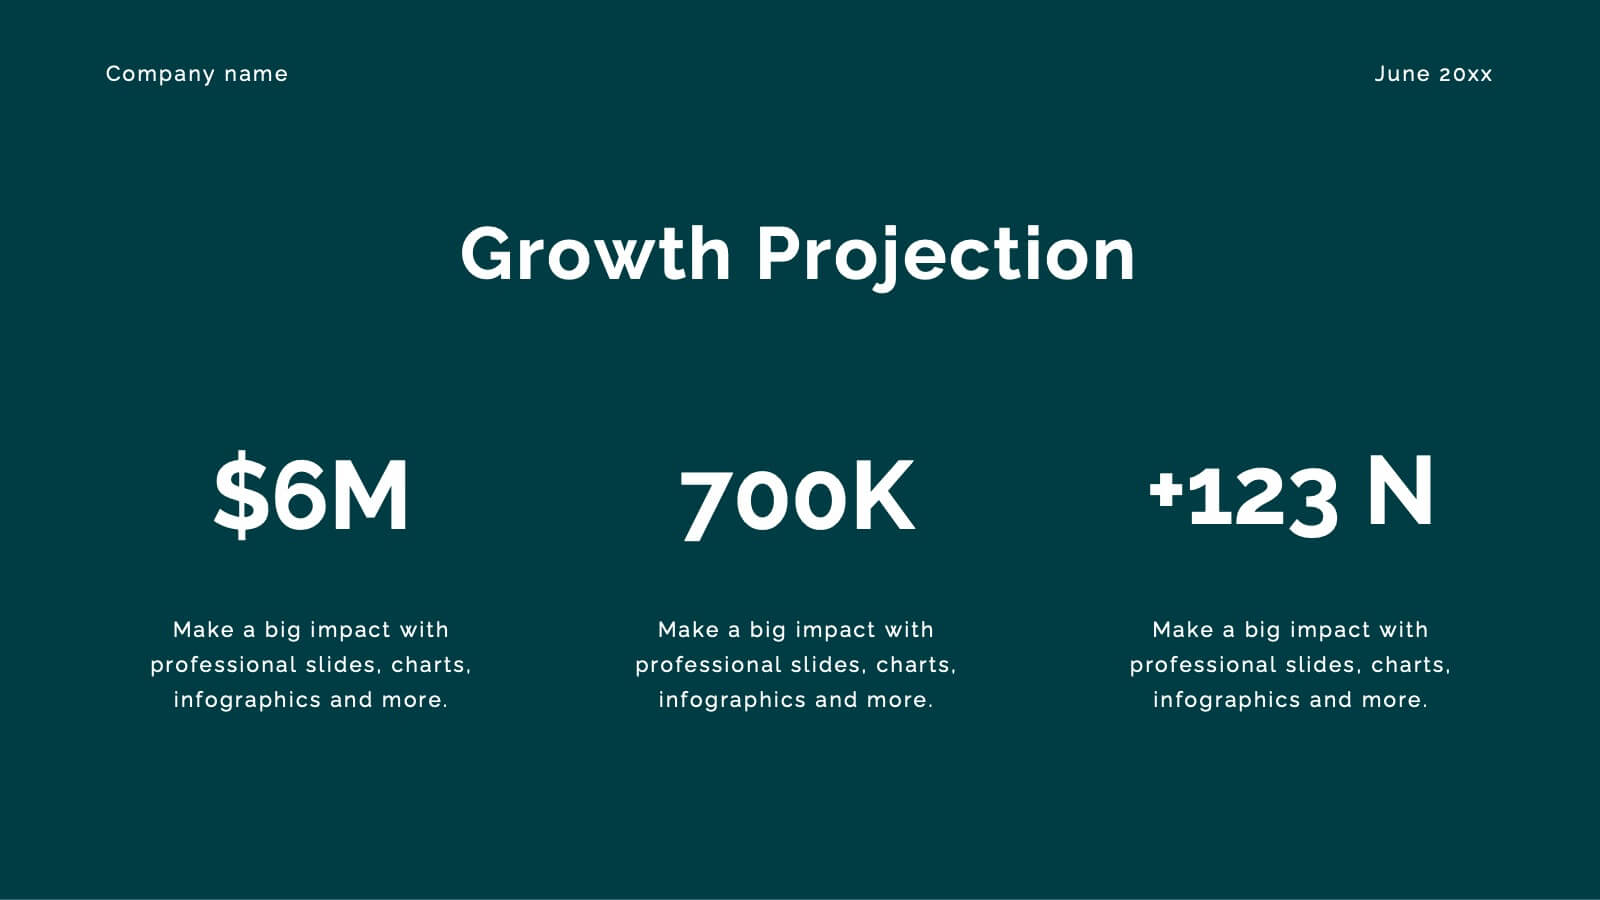
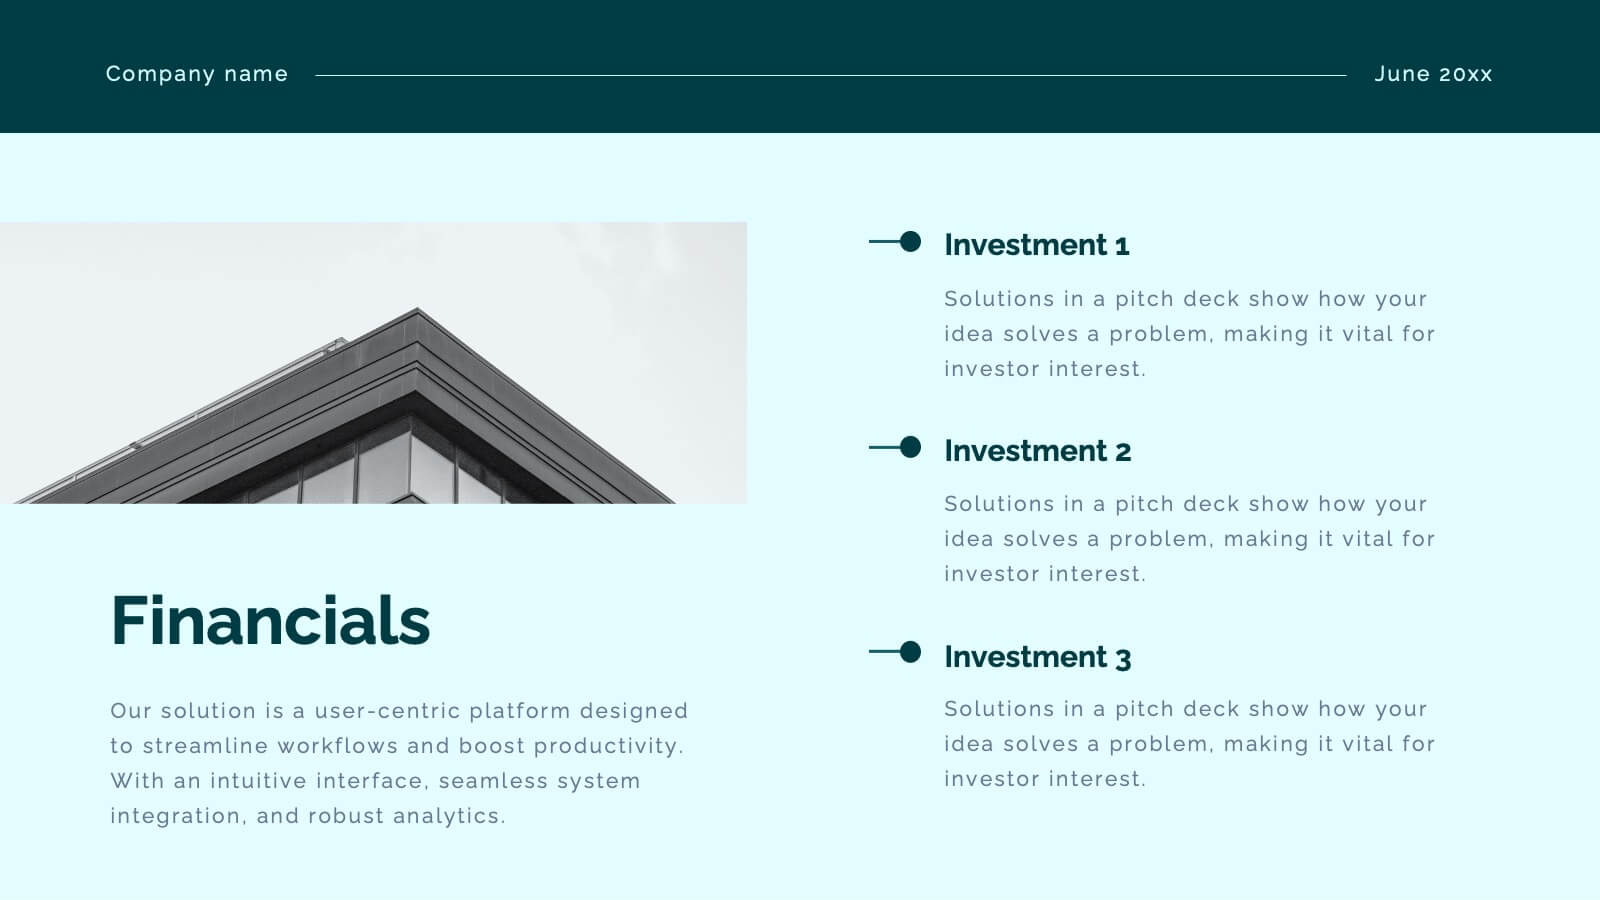
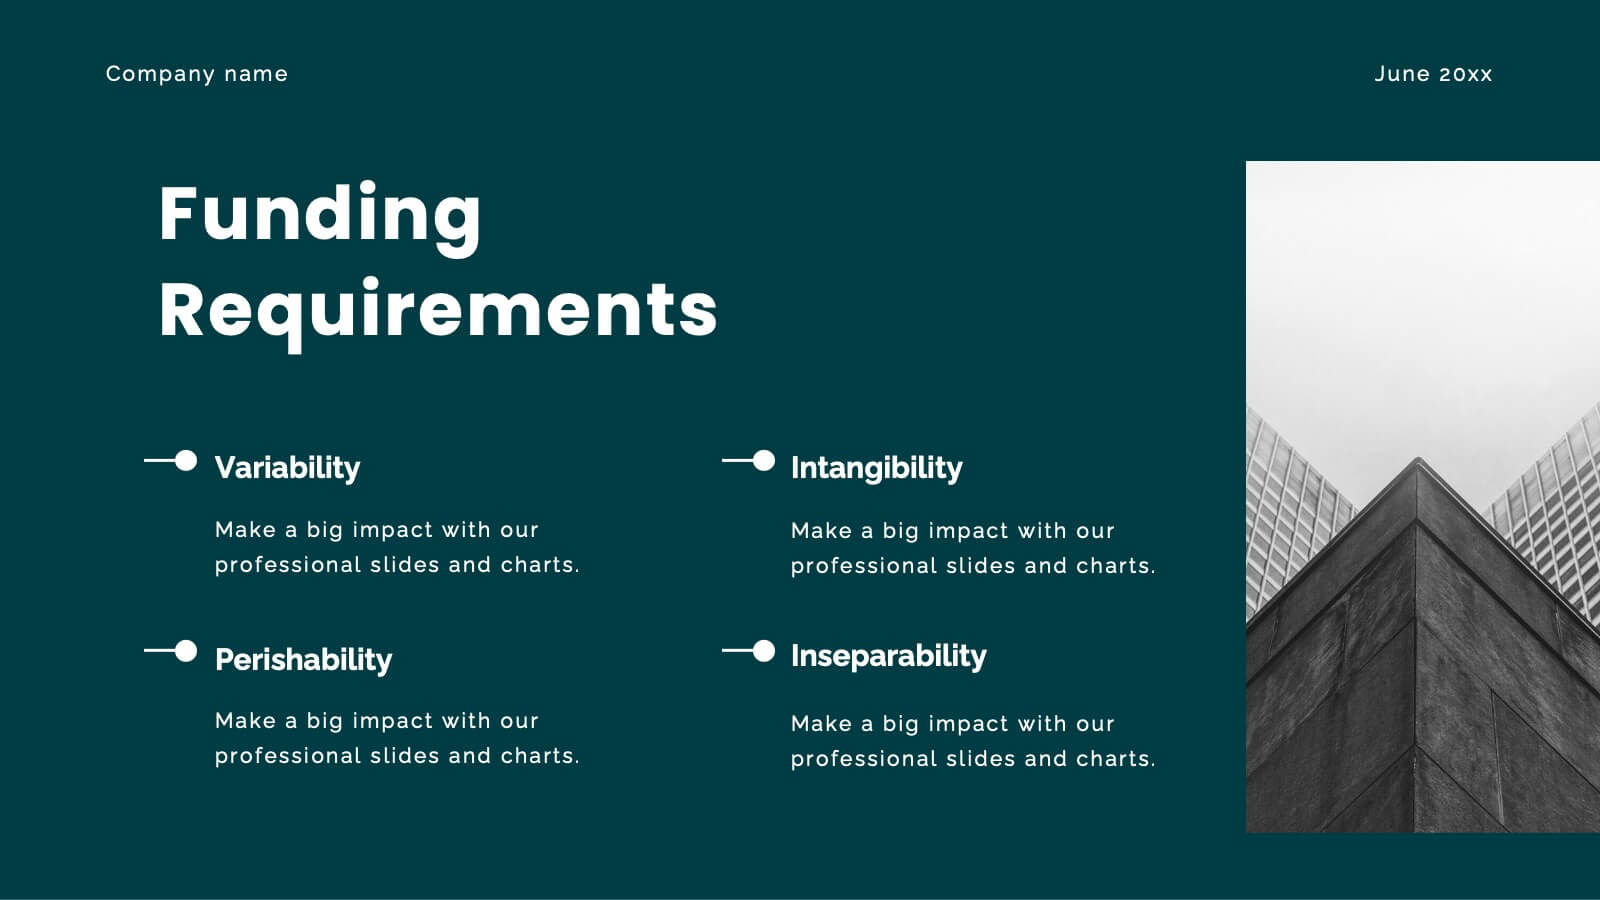
Planetar Startup Strategy Presentation
This Startup Strategy Presentation offers a modern and structured layout to showcase your startup’s mission, vision, market analysis, and financial projections. Designed for entrepreneurs and investors, it includes sections on customer needs, growth plans, and milestones. Fully customizable and compatible with PowerPoint, Keynote, and Google Slides.


6 diapositivas
Social Science Infographics
The "Social Science" infographic template is an intellectually stimulating and visually engaging tool, thoughtfully designed for PowerPoint, Keynote, and Google Slides. This template is a brilliant resource for educators, researchers, and students who seek to present the multifaceted aspects of social sciences in a clear and compelling manner. This template skillfully encompasses various disciplines within social science, such as anthropology, sociology, psychology, and political science. It presents key theories, methodologies, and findings in an organized and digestible format. This makes it an invaluable aid for academic presentations, research proposals, or educational discussions, facilitating a deeper understanding of human society and social relationships. The design is as thought-provoking as the subject it represents, with a color scheme that stimulates intellectual curiosity while maintaining clarity and focus. This not only enhances the visual appeal of the presentation but also complements the analytical and reflective nature of social science. Whether used in a lecture hall, a conference, or a study group, this template ensures that the complex world of "Social Science" is presented in an engaging, informative, and visually captivating manner.


4 diapositivas
Social Media Analytics Dashboard Presentation
Easily monitor and report on your content performance with the Social Media Analytics Dashboard Presentation. This sleek, modular layout combines key metrics like items, uploads, comments, and feeds with a vertical bar chart to visualize insights across platforms. Ideal for campaign reviews, stakeholder updates, or team reporting. Fully customizable in PowerPoint, Keynote, and Google Slides.


5 diapositivas
Workout Benefits Infographics
Engaging in regular workouts and physical exercise offers numerous benefits for both physical and mental well-being. These vertical infographic templates aim to motivate and educate individuals about the positive impact of workouts on physical health, mental well-being, and overall quality of life. These infographics are the perfect tools to be used in presentations, educational material, or fitness campaigns, this template helps inspire and inform viewers about the significant benefits of incorporating workouts into their daily routines. Compatible with Powerpoint, Keynote, and Google Slides.


6 diapositivas
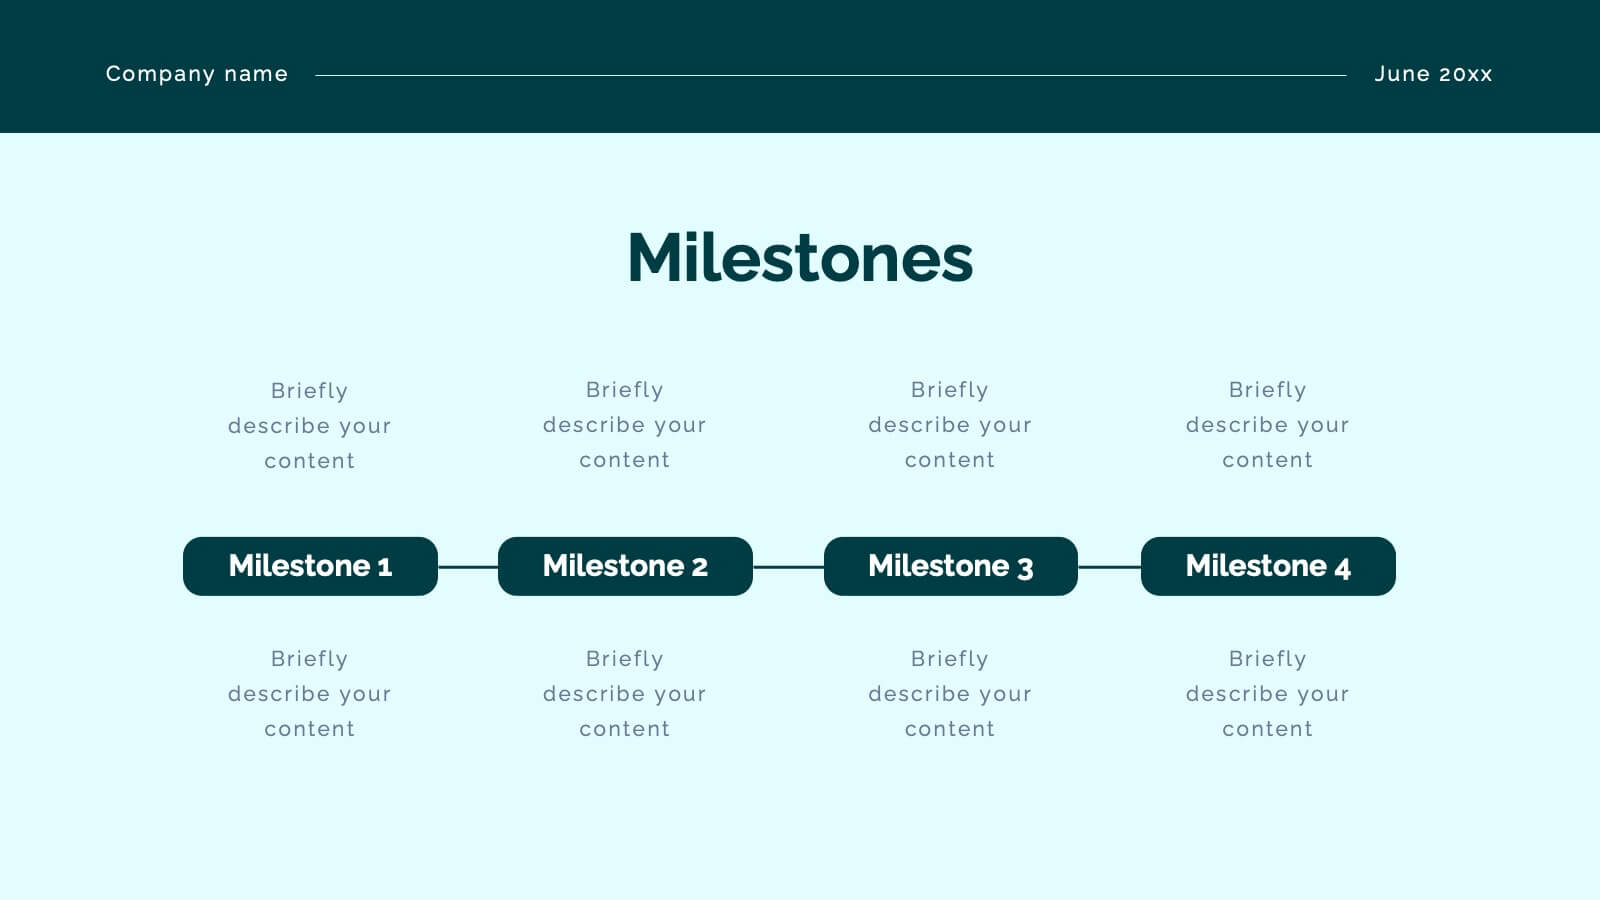
Project Milestone Infographic
A project milestone is a significant event or point of progress during the execution of a project. This infographic template represents the completion of a specific phase or task and can be used as a reference point to track the project's progress and measure its success. This template will help project teams stay on track, align their efforts, and provide stakeholders with a clear understanding of the project's status. The infographic is designed to help project managers, team members, and stakeholders track and understand the project's development at a glance. This template is compatible with Powerpoint, Keynote, and Google Slides.


7 diapositivas
Social Network Infographic Presentation
A Social Network Infographic is a visual representation of data that shows the connections and relationships between individuals, groups, or organizations within a social network. Use this template to illustrate the structure of a social network, and to analyze patterns and trends in the interactions between users. This Infographic includes a visual representation of networking, in graphs and diagram, with icons representing individuals and lines representing connections between them. This template can be customized with different colors, fonts, and text in Powerpoint, Keynote, and Google Slides.


26 diapositivas
Jacob Free Powerpoint Template
Are you looking for a classy designer template? Then the Jacob is for you. The Jacob template is a chic, beautiful, modern and easy to use template. It's suitable for all types of businesses, from small business accounts, to large corporate companies and even personal use. It has a very hip aesthetic, with pink tones giving it a very fresh appealing look. The pictures and charts are easy to understand as well as easy to read without too much confusion on reading informative content. Easy to use high quality charts and graphs makes this template best for all types of businesses.


7 diapositivas
System Solution Infographic Presentation
A System Solution infographic is a visual representation of a proposed solution to a specific problem or challenge within a system or organization. This template can be used to provide a clear and informative overview of the proposed solution, highlighting its key features, benefits, and potential impact. This infographic includes flowcharts, diagrams, and fun graphs to illustrate how the solution will work within the existing system. This template can be a useful tool for organizations who are seeking to implement a new solution or address a specific challenge within an existing system.

23 diapositivas
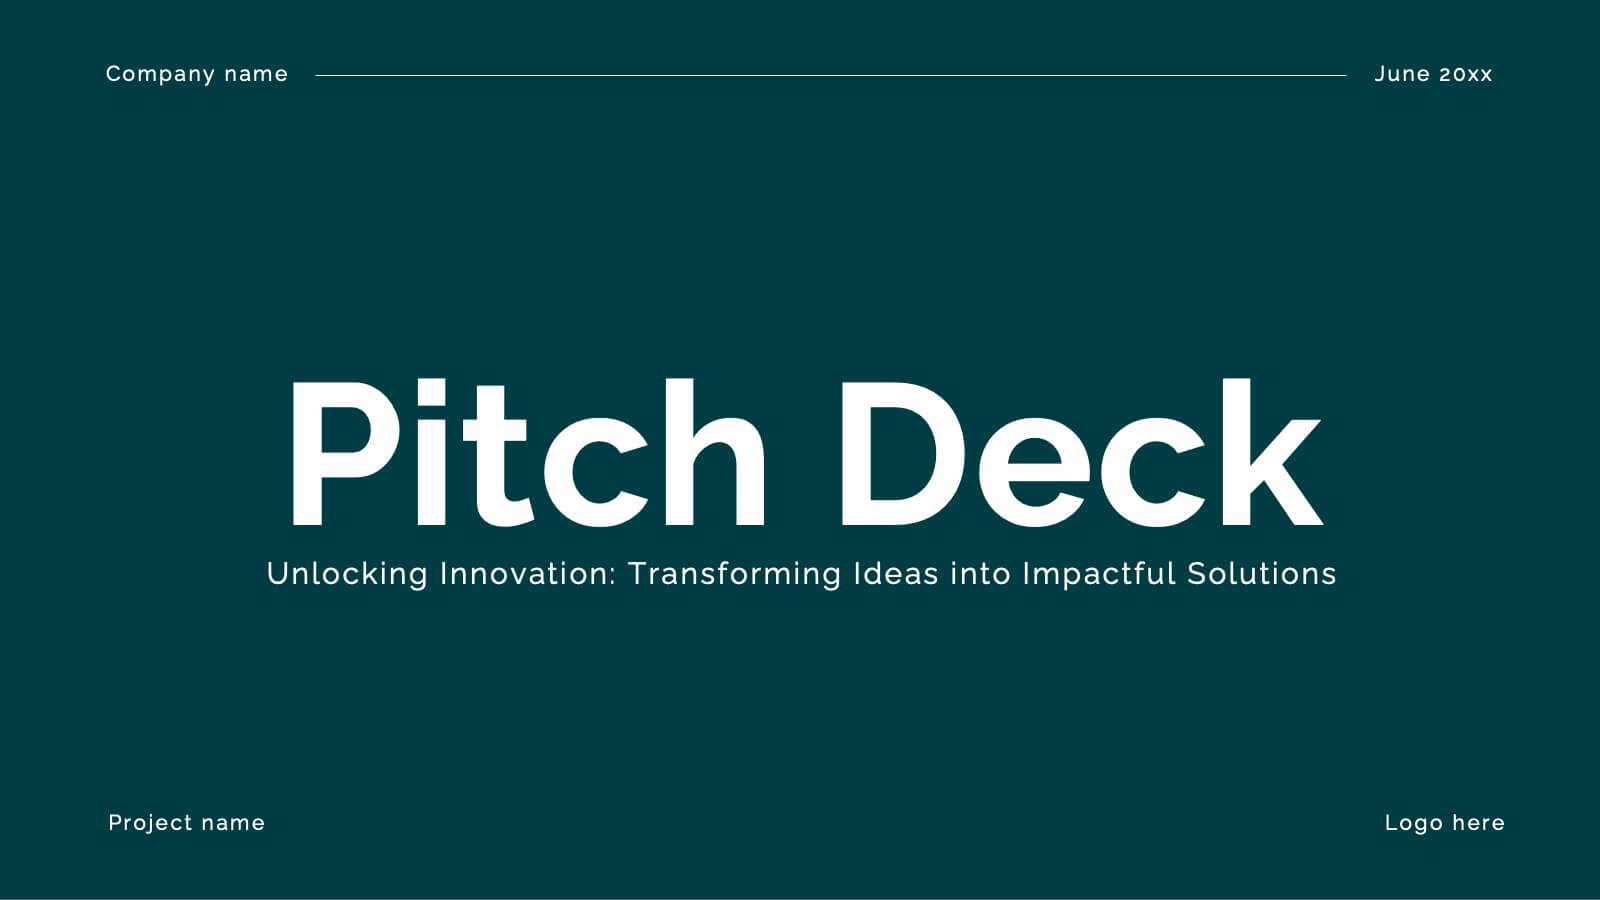
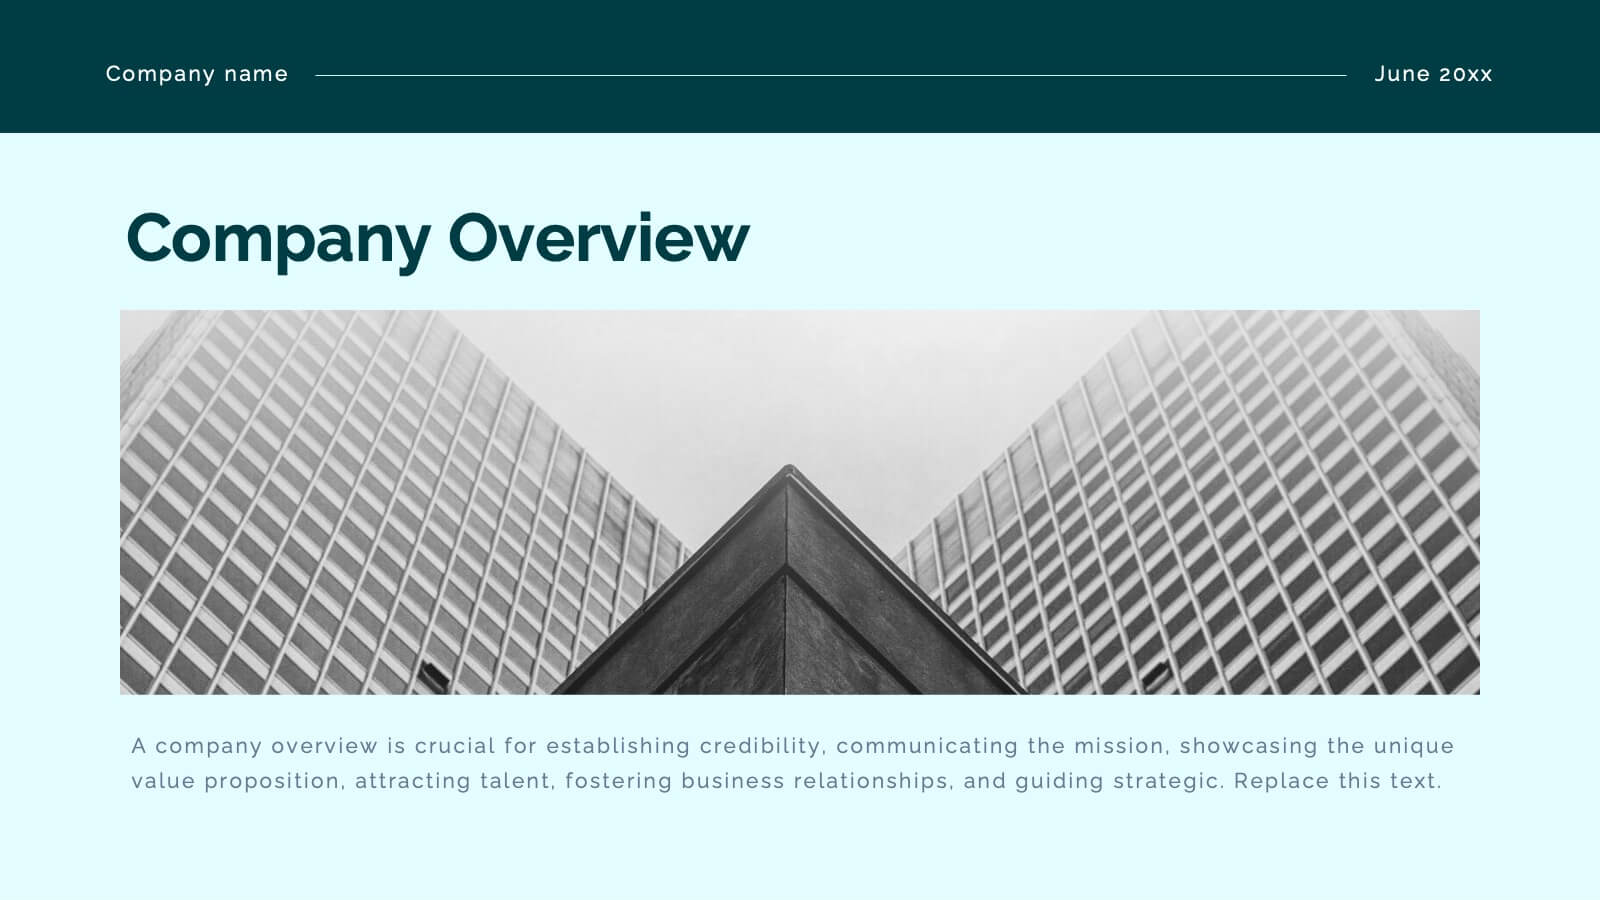
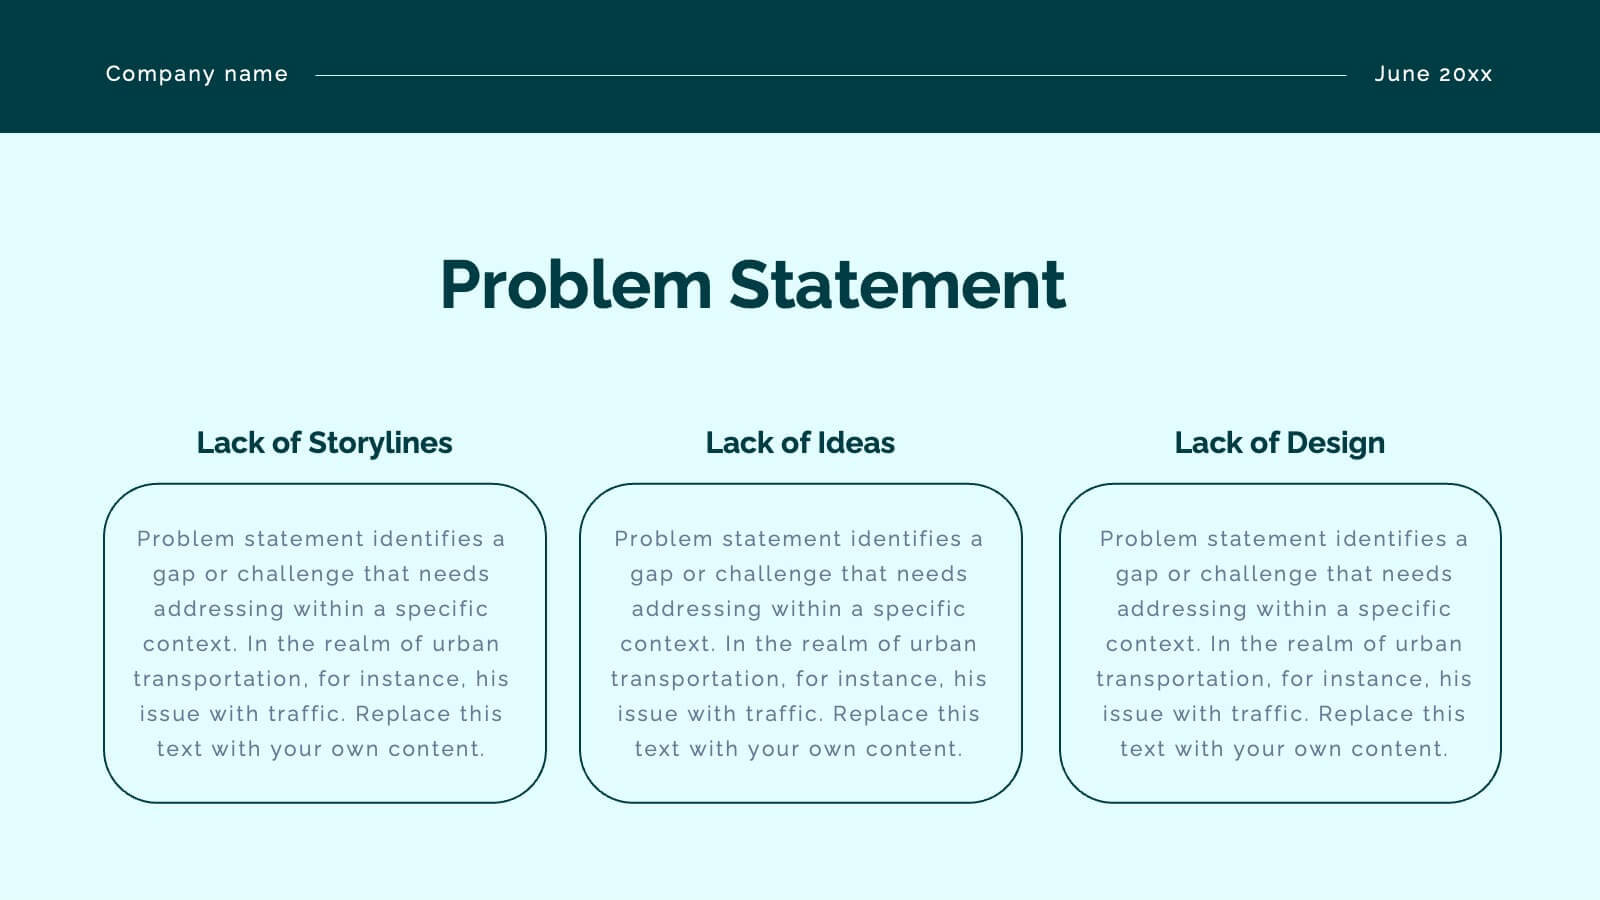
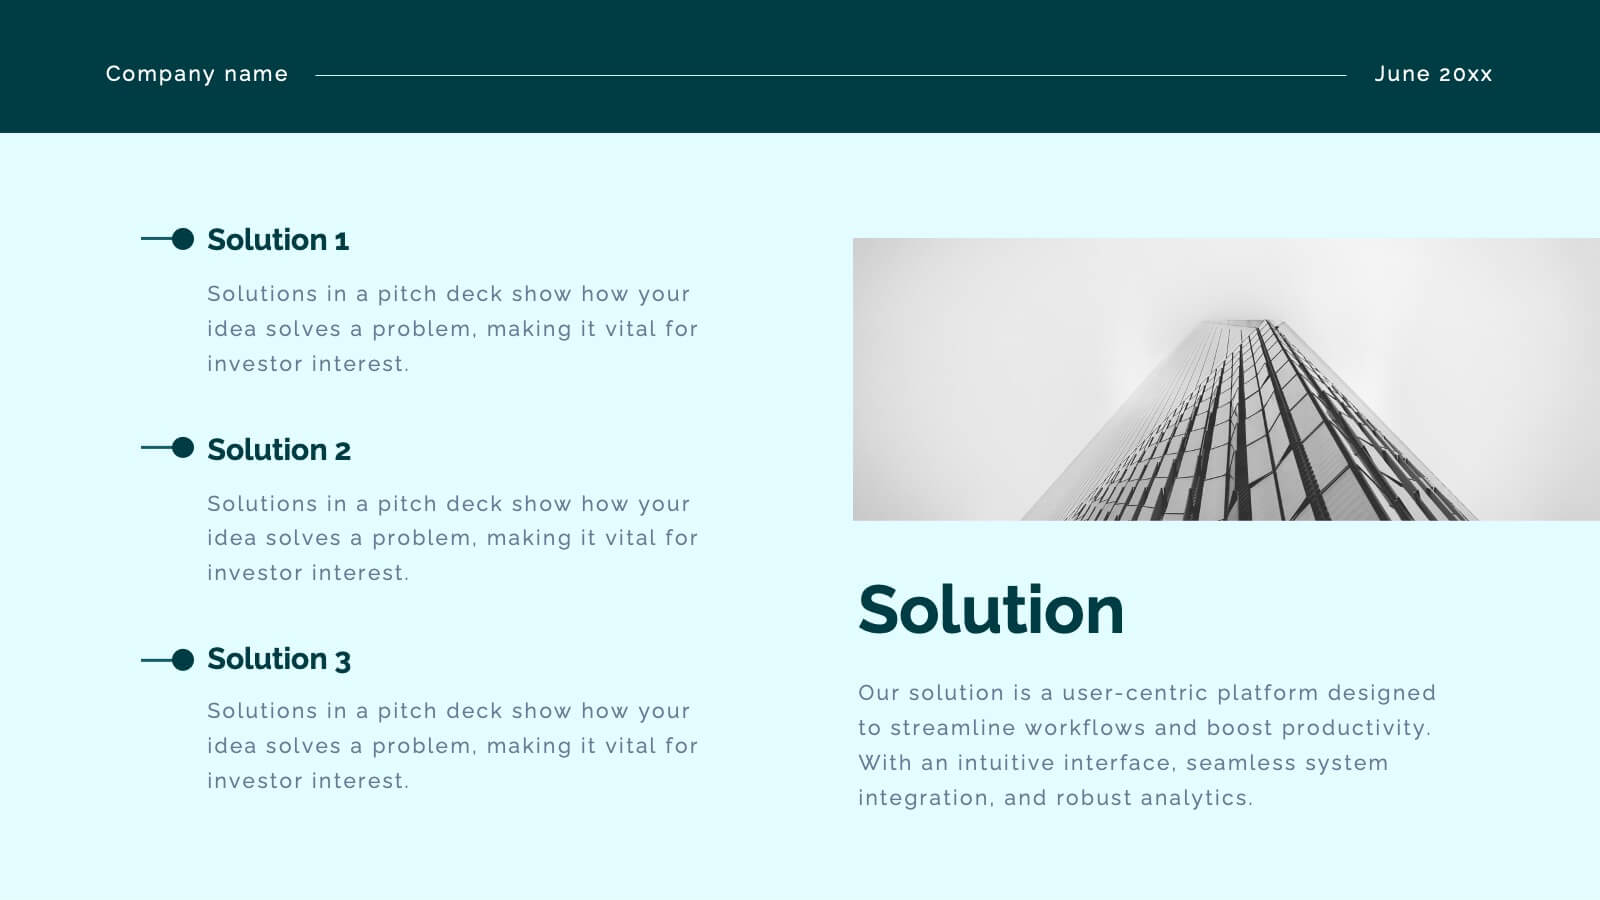
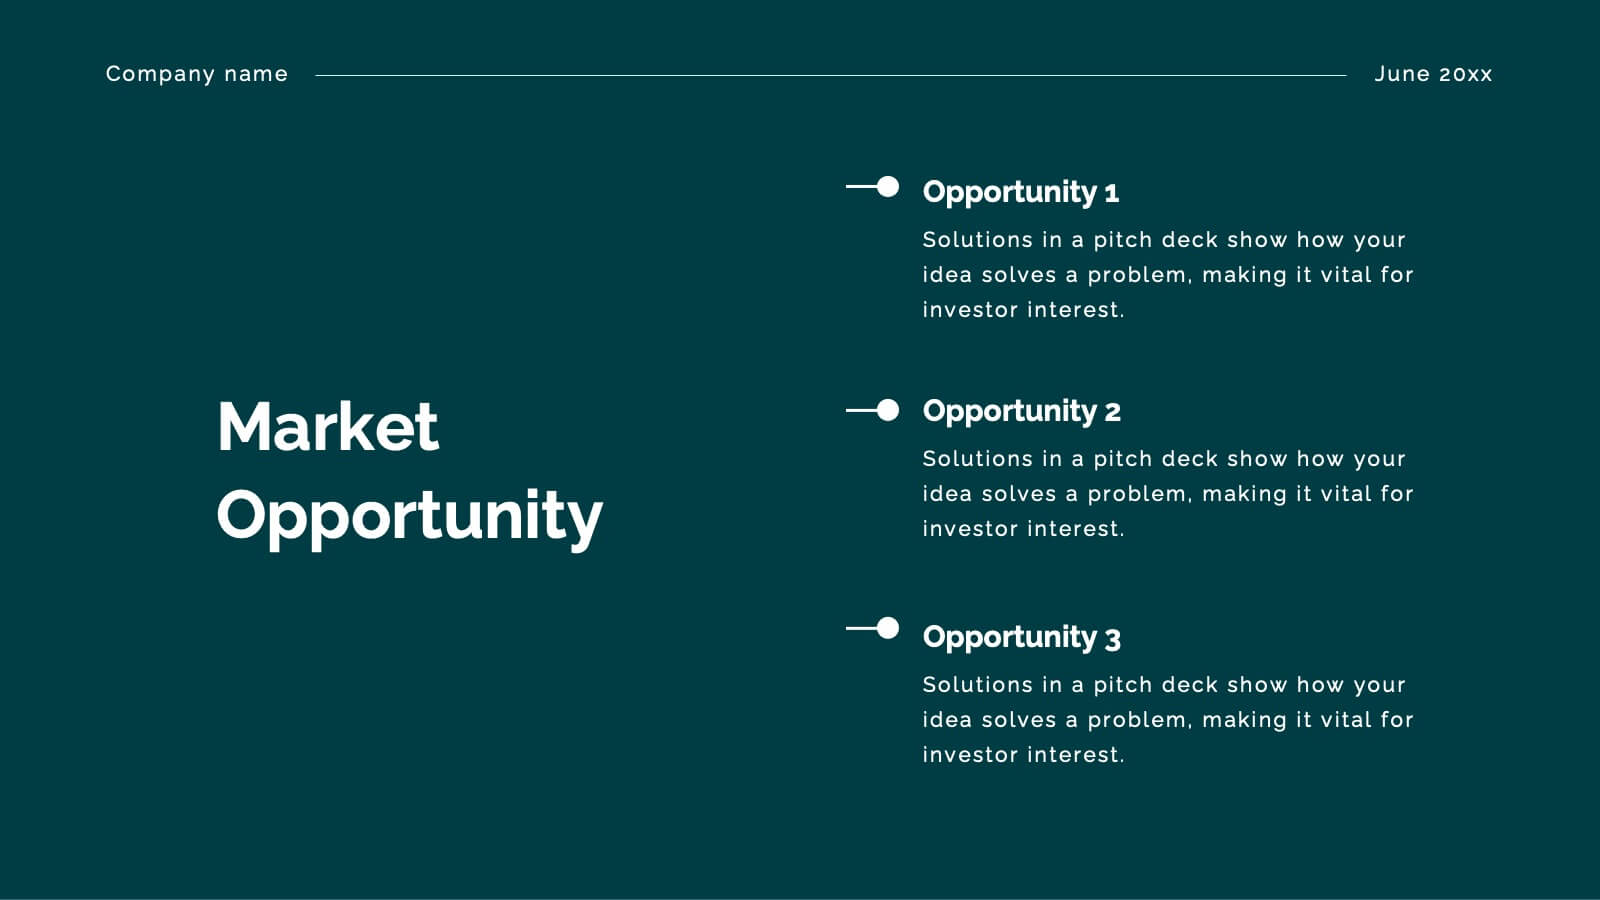
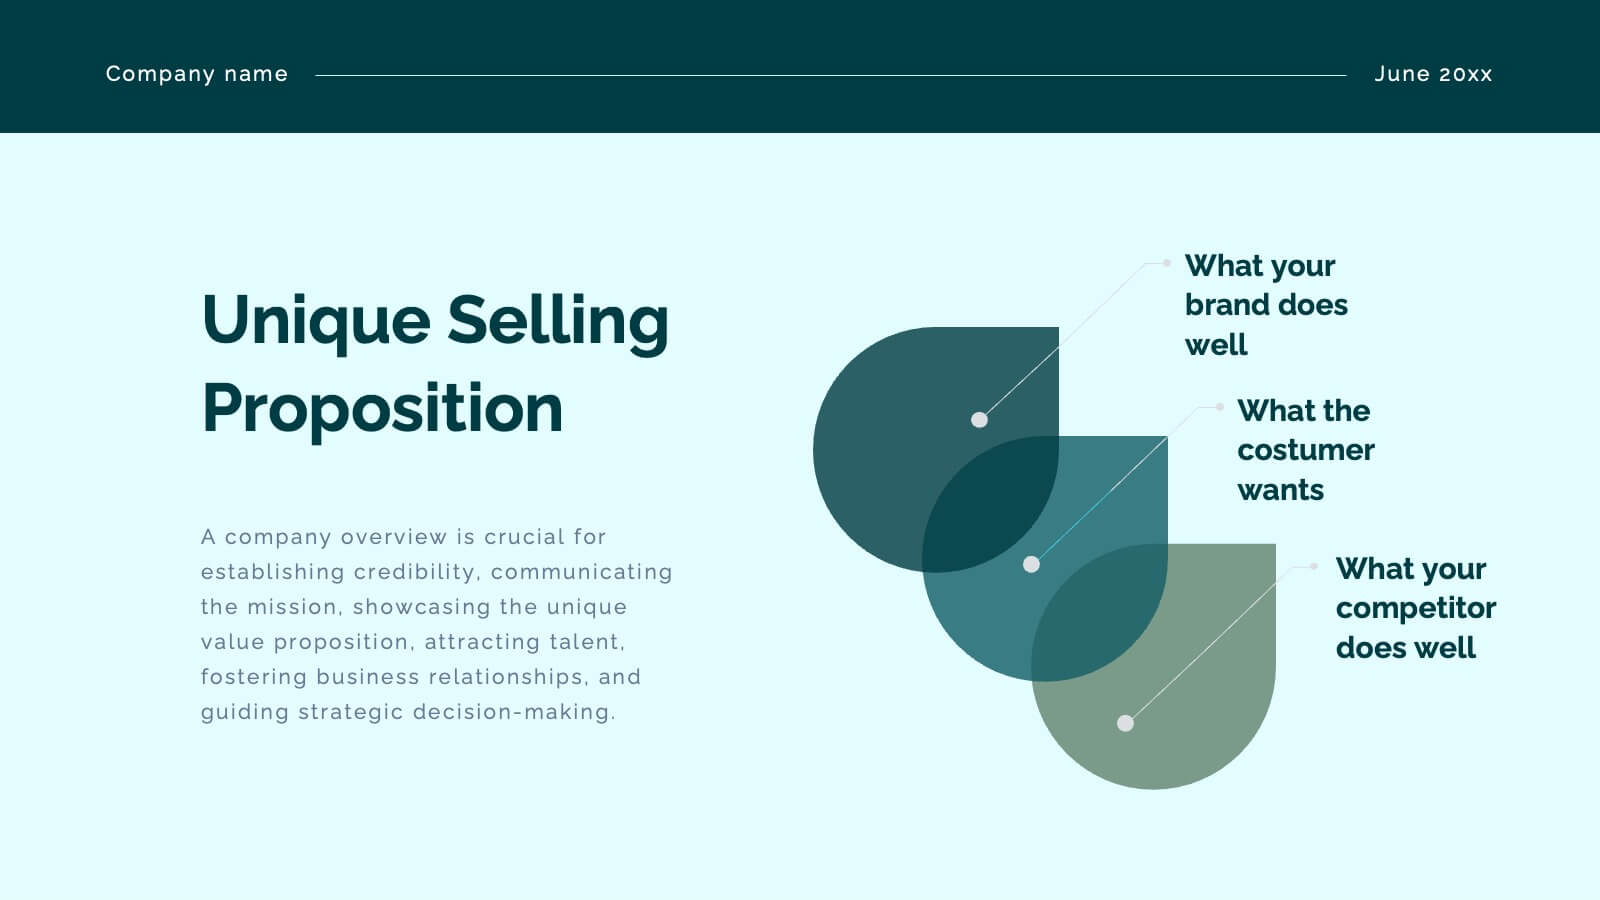
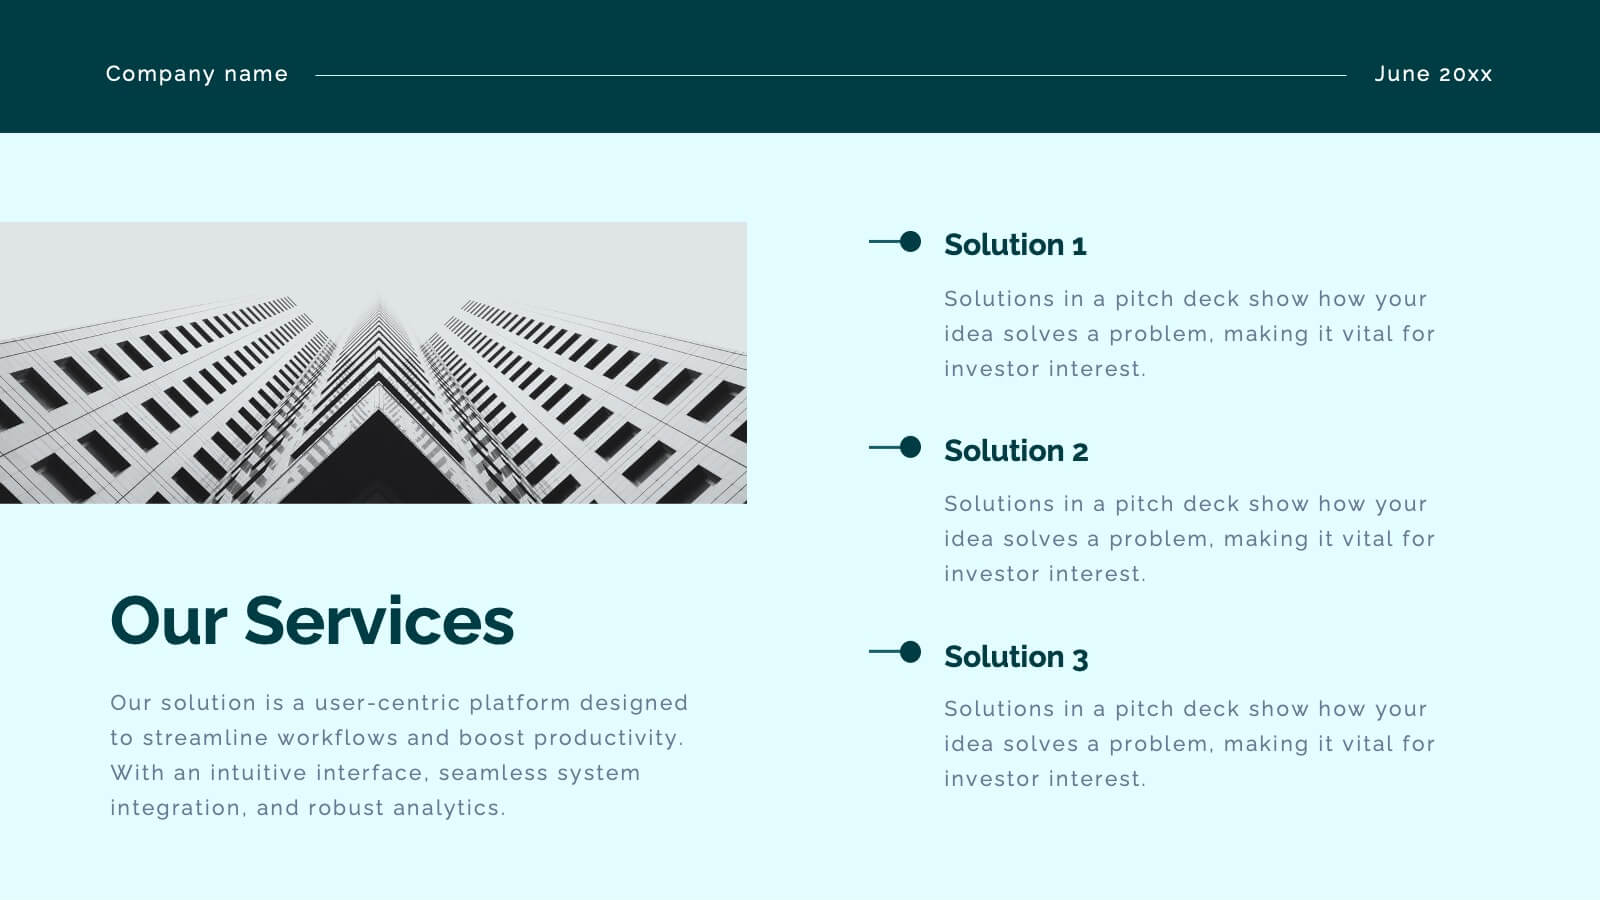
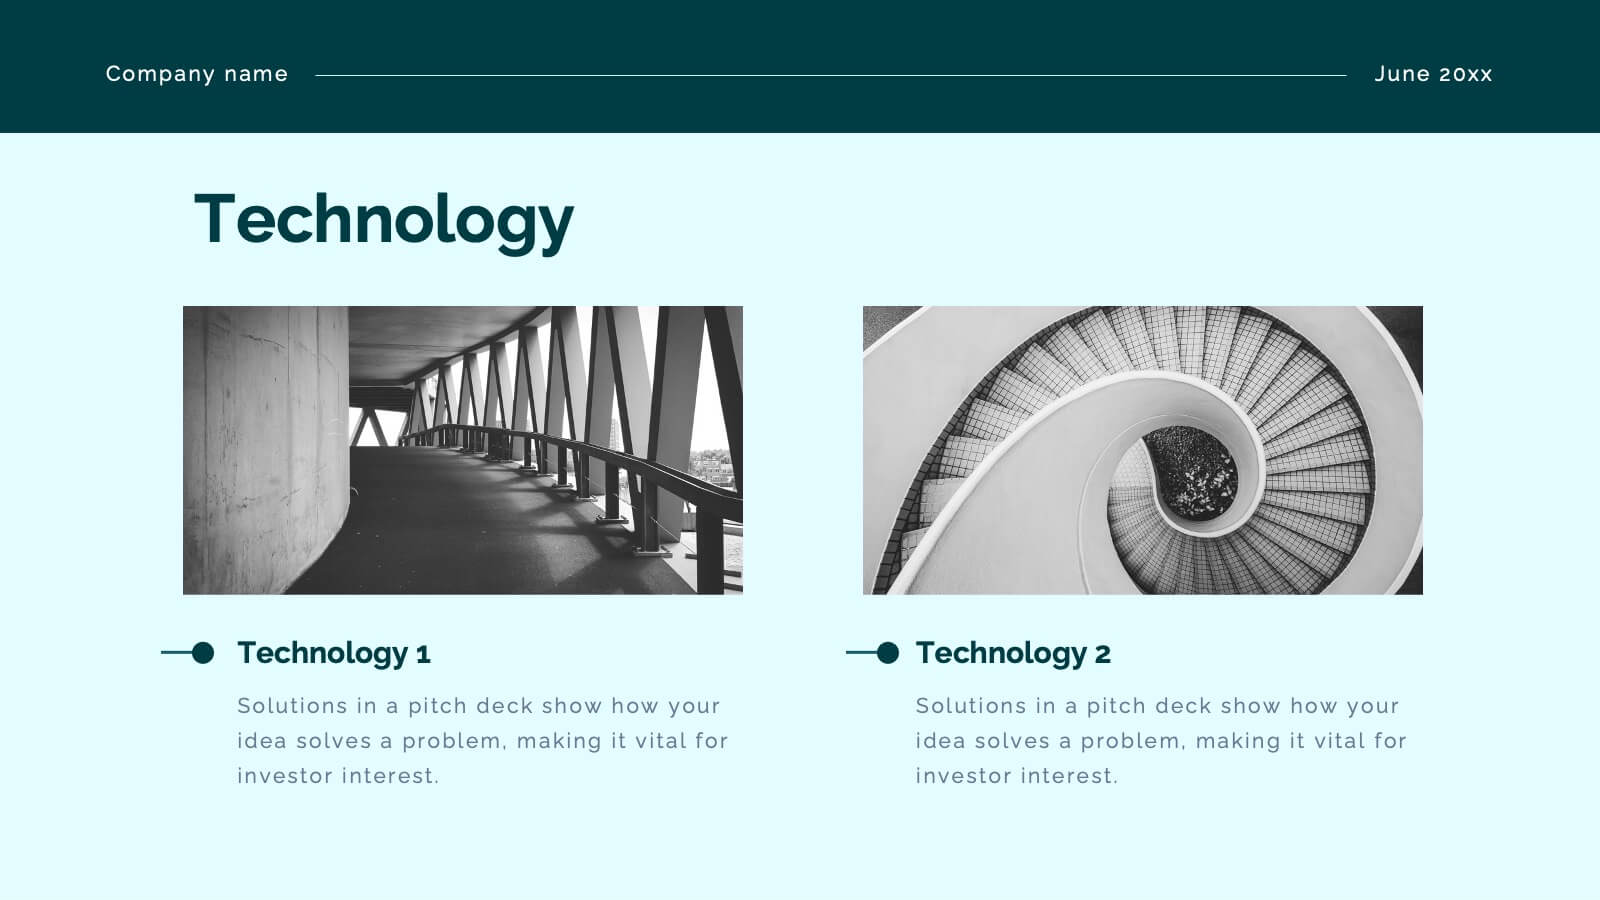
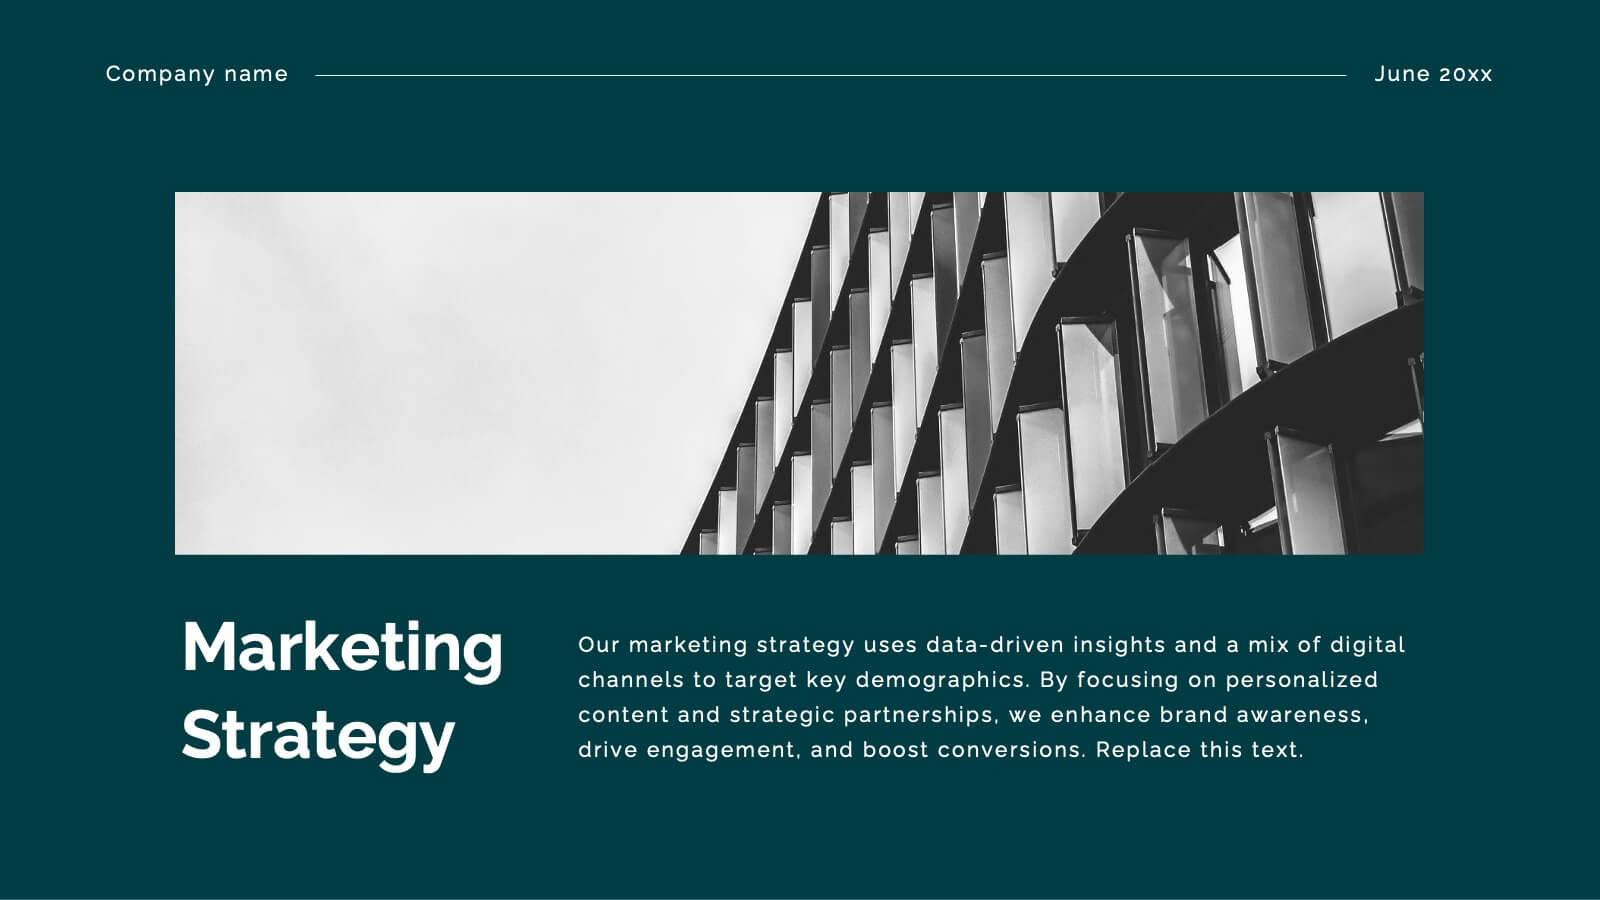
Crest Investor Pitch Presentation Presentation
Unleash your potential with this powerful pitch deck template! Tailored for presenting innovative business ideas, it features slides for company overview, market opportunity, competitive landscape, and financial projections. Clearly communicate your value proposition and impress investors with professional design and concise content. Compatible with PowerPoint, Keynote, and Google Slides for seamless presentations on any platform.


5 diapositivas
Survey Findings and Summary Report Presentation
Present survey data clearly with this layered, step-style layout. Each section is color-coded with matching icons for quick insight into key findings. Ideal for summarizing feedback, analytics, or market research. Fully editable in Canva, PowerPoint, or Google Slides—perfect for making data-driven presentations engaging and easy to follow.


7 diapositivas
Product Innovation Infographic
Illuminate the path to creativity with our Product Innovation infographic, specifically designed for Powerpoint, Keynote, and Google Slides. This engaging infographic is an excellent resource for professionals seeking to present the innovation process in an accessible format. The eye-catching design breaks down complex ideas into digestible segments, perfect for sparking discussions on product development and creative brainstorming sessions. Our Product Innovation infographic is a versatile tool, offering a visual representation of the stages of innovation. It's ideal for educators, business leaders, and entrepreneurs who aim to inspire and educate their audience on the intricacies of innovative thinking. Each element of the infographic is crafted to encourage audience engagement, making it easier to convey the nuances of product innovation strategies. Compatibility with major presentation platforms ensures that this infographic can be seamlessly integrated into your slide deck. Use it to enhance your message and captivate your audience with a clear visual journey through the innovation process. Add this infographic to your presentation toolkit to bring your vision of innovation to life.


6 diapositivas
Organizational Goals and SMART Objectives Presentation
Align your business vision with clarity using this Organizational Goals and SMART Objectives slide. Designed to visually represent each SMART component—Specific, Measurable, Achievable, Relevant, and Time-bound—it helps communicate strategic goals in a simple and effective format. Fully editable in Canva, PowerPoint, and Google Slides for maximum flexibility.


10 diapositivas
4 Stages of Strategic Execution Process Presentation
Clarify your strategy with the 4 Stages of Strategic Execution Process Presentation. This visually layered circle layout walks your audience through each key stage of execution—ideal for planning, operations, and team alignment. Each step is color-coded and fully editable, ensuring your message stays focused. Compatible with PowerPoint, Keynote, Google Slides, and Canva.