


Características


¿Tienes alguna pregunta?
Recomendar


5 diapositivas
Lean Six Sigma Business Strategy
Present your continuous improvement plan with this visually compelling Lean Six Sigma pyramid slide. Each layer represents a key phase—Define, Measure, Analyze, Improve, and Control—making it ideal for team training, process mapping, or performance reviews. Fully editable in PowerPoint, Keynote, and Google Slides.


21 diapositivas
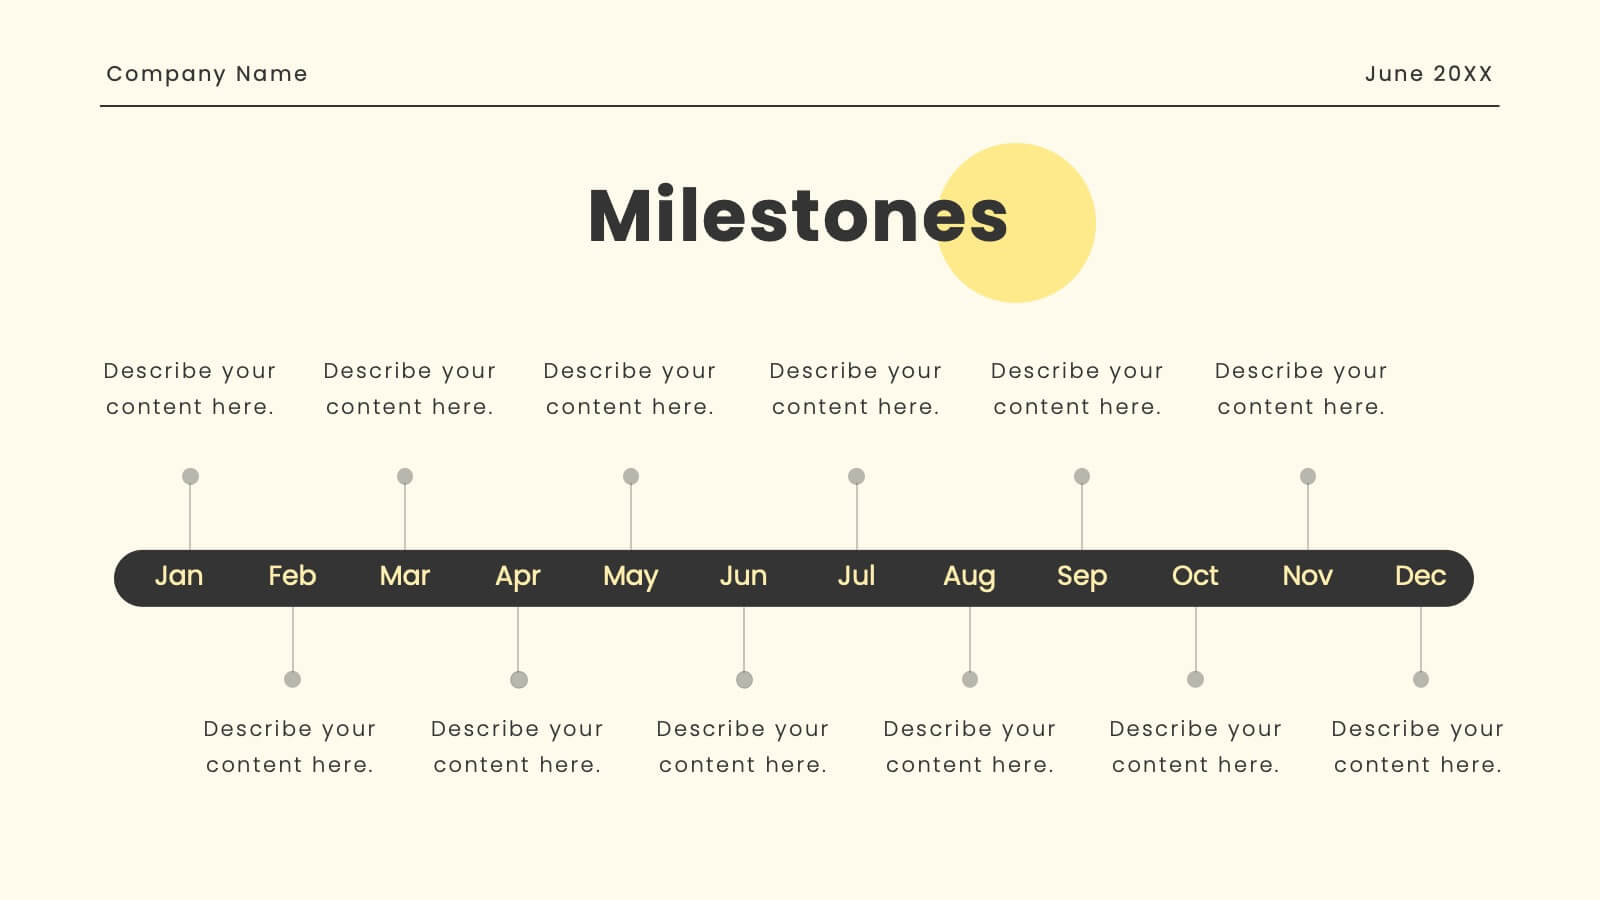
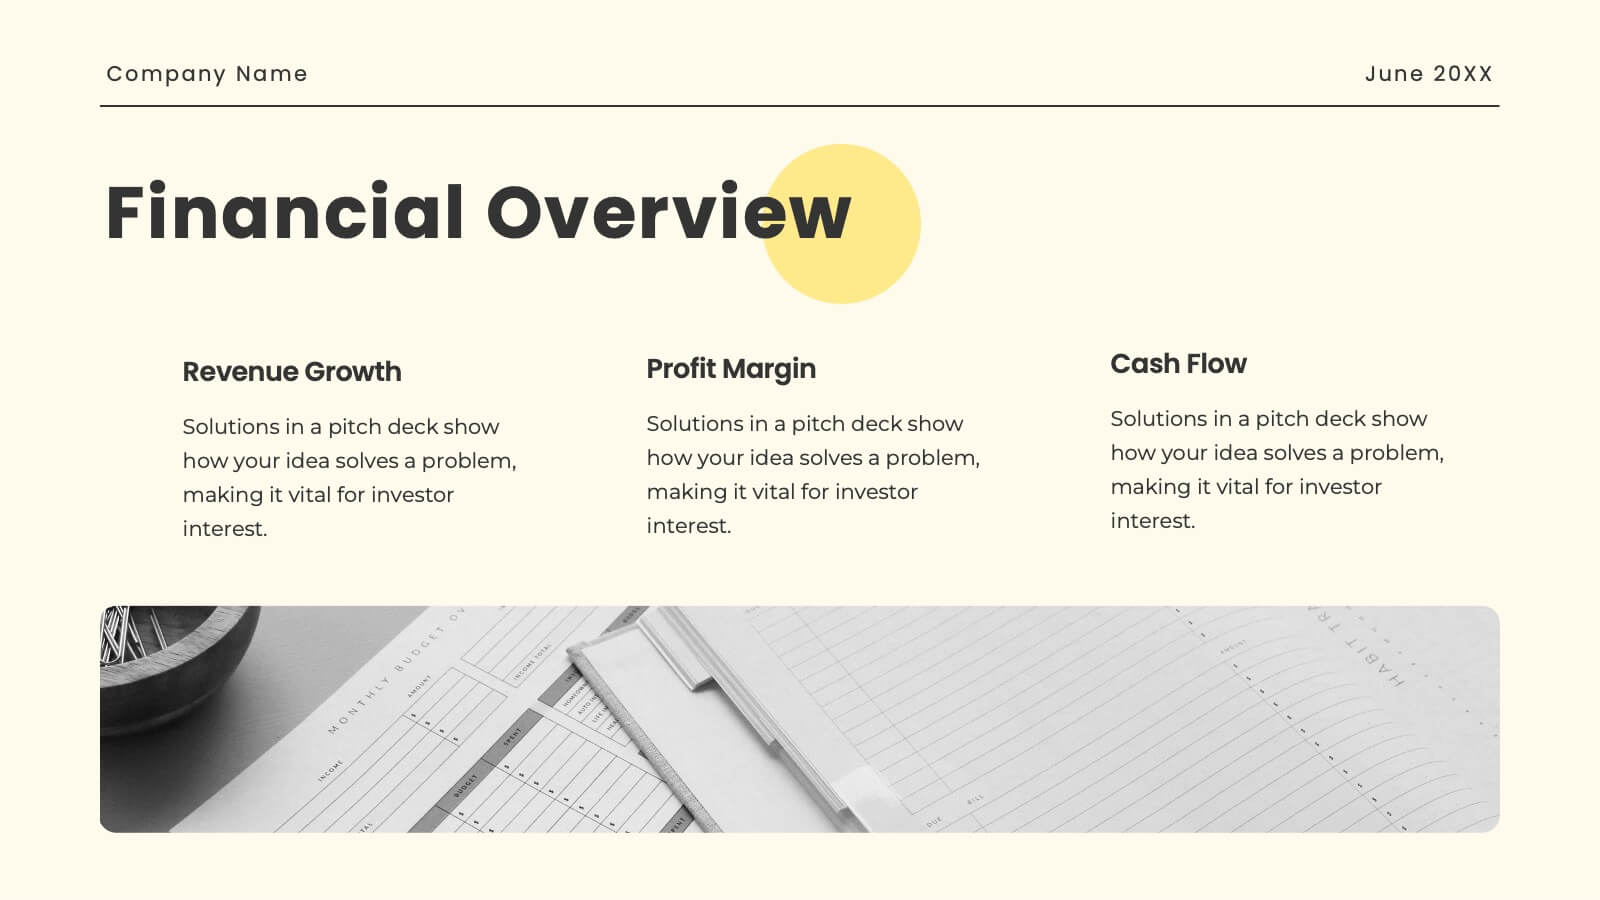
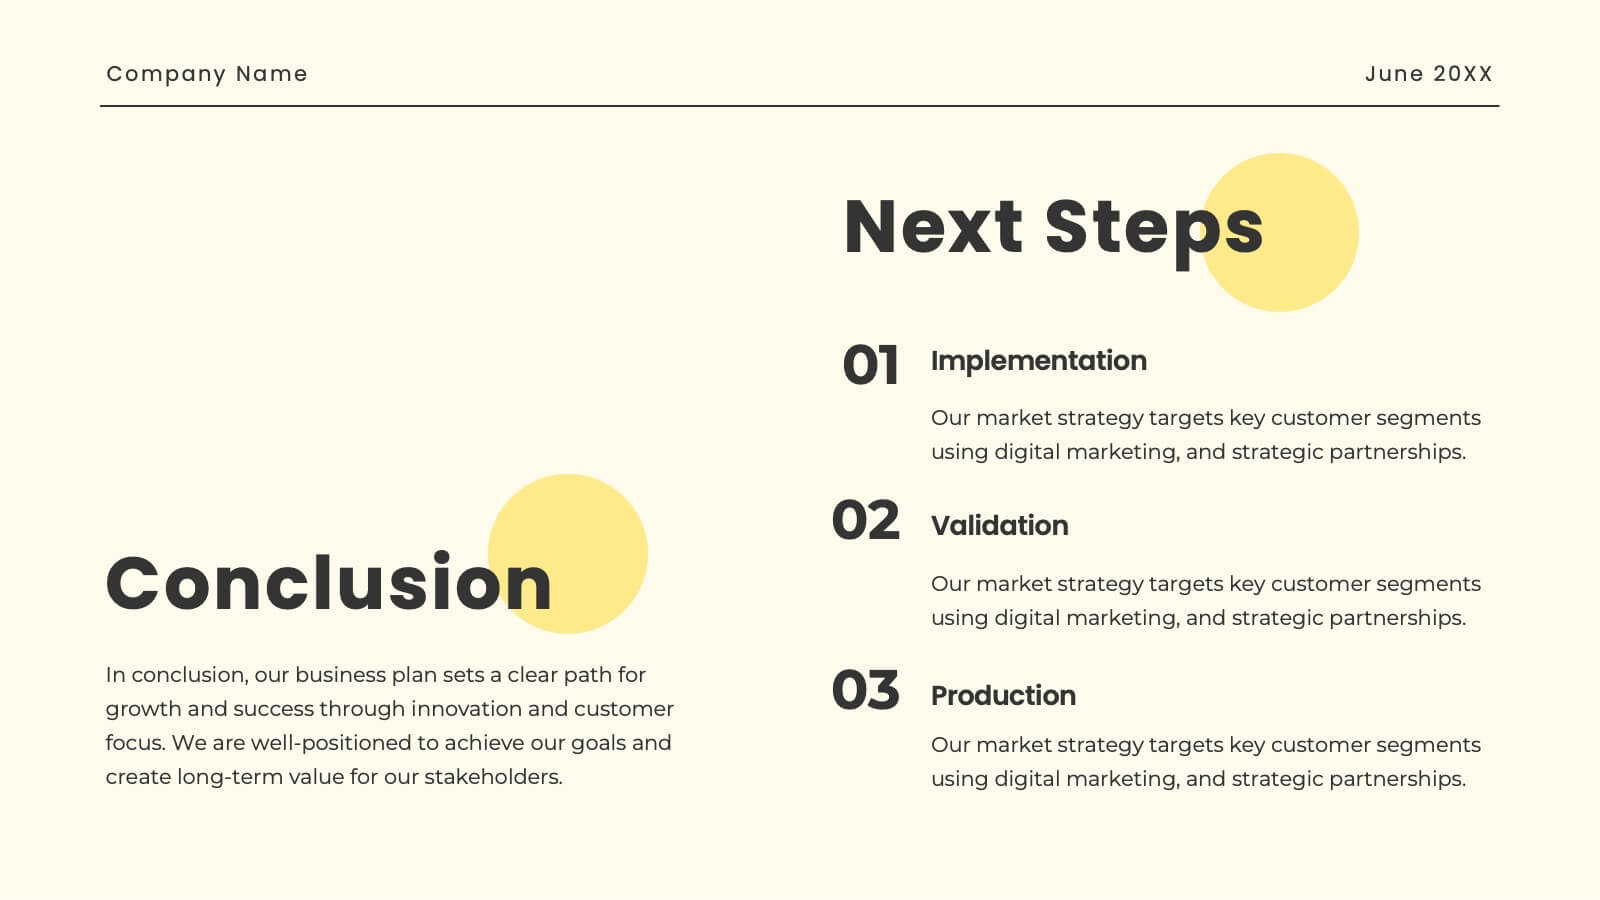
Nimbus Startup Growth Plan Presentation
Supercharge your startup's growth with this vibrant presentation template! Ideal for outlining your business plan, it includes slides for mission, market analysis, and financial overview. Capture investor attention with clear visuals and compelling content. Compatible with PowerPoint, Keynote, and Google Slides for a seamless presentation experience on any platform.


5 diapositivas
Business Travel Logistics Plan Presentation
Plan and present business travel operations with clarity using this Business Travel Logistics Plan Presentation. Designed around a global layout with visual transport icons, this slide helps outline travel modes, routes, and logistics points. Ideal for corporate travel managers, event organizers, and logistics teams. Fully editable in PowerPoint, Keynote, and Google Slides.


7 diapositivas
Real Estate Market Analysis Presentation
Bring energy and clarity to your insights with this dynamic slide designed to break down key market factors in a simple, visual flow. It helps you explain trends, opportunities, and performance drivers with ease, making complex real estate data feel intuitive and organized. Fully compatible with PowerPoint, Keynote, and Google Slides.


5 diapositivas
Science Myths & Facts Infographics
Science myths are misconceptions or false beliefs that are widely circulated and often accepted by people, despite being contradicted by scientific evidence. These are engaging and educational infographic templates that aims to debunk common misconceptions and provide accurate information about various scientific topics. They present a collection of myths and their corresponding facts in a visually appealing and easy-to-understand format. The infographics utilizes eye-catching visuals, such as icons, illustrations, or images, to enhance the presentation and make the information more memorable.


2 diapositivas
Business Self-Introduction Presentation
Introduce yourself with confidence using this Business Self-Introduction Slide. Perfect for networking, team meetings, and professional presentations, this template features a modern layout with a dynamic photo cutout, engaging visuals, and structured text areas. Fully customizable for PowerPoint, Keynote, and Google Slides, you can adjust colors, fonts, and content to reflect your personal or business identity.


7 diapositivas
Artificial Intelligence Education Infographic Presentation
Artificial Intelligence is an important field of study and development that has the potential to revolutionize many aspects of modern life. A great way to display your ideas in a visual manner, this AI Infographic Template can be used by businesses and corporations who want to communicate their team vision in a clear and dynamic way. This template is completely editable, allowing you to customize it with your own information and photos. It includes icons and graphs to illustrate your points, as well as text boxes and slide titles. It is compatible with Powerpoint, Keynote and Google Slides.


5 diapositivas
Collaborative Learning Techniques Overview Presentation
Highlight team-based education methods with the Collaborative Learning Techniques Overview Presentation. This layout is perfect for mapping out peer-led discussions, group projects, or cooperative learning strategies using a visual 4-step flow. The clean, screen-themed icons make it ideal for educators, trainers, or eLearning creators. Fully editable in Canva, PowerPoint, Keynote, and Google Slides.


21 diapositivas
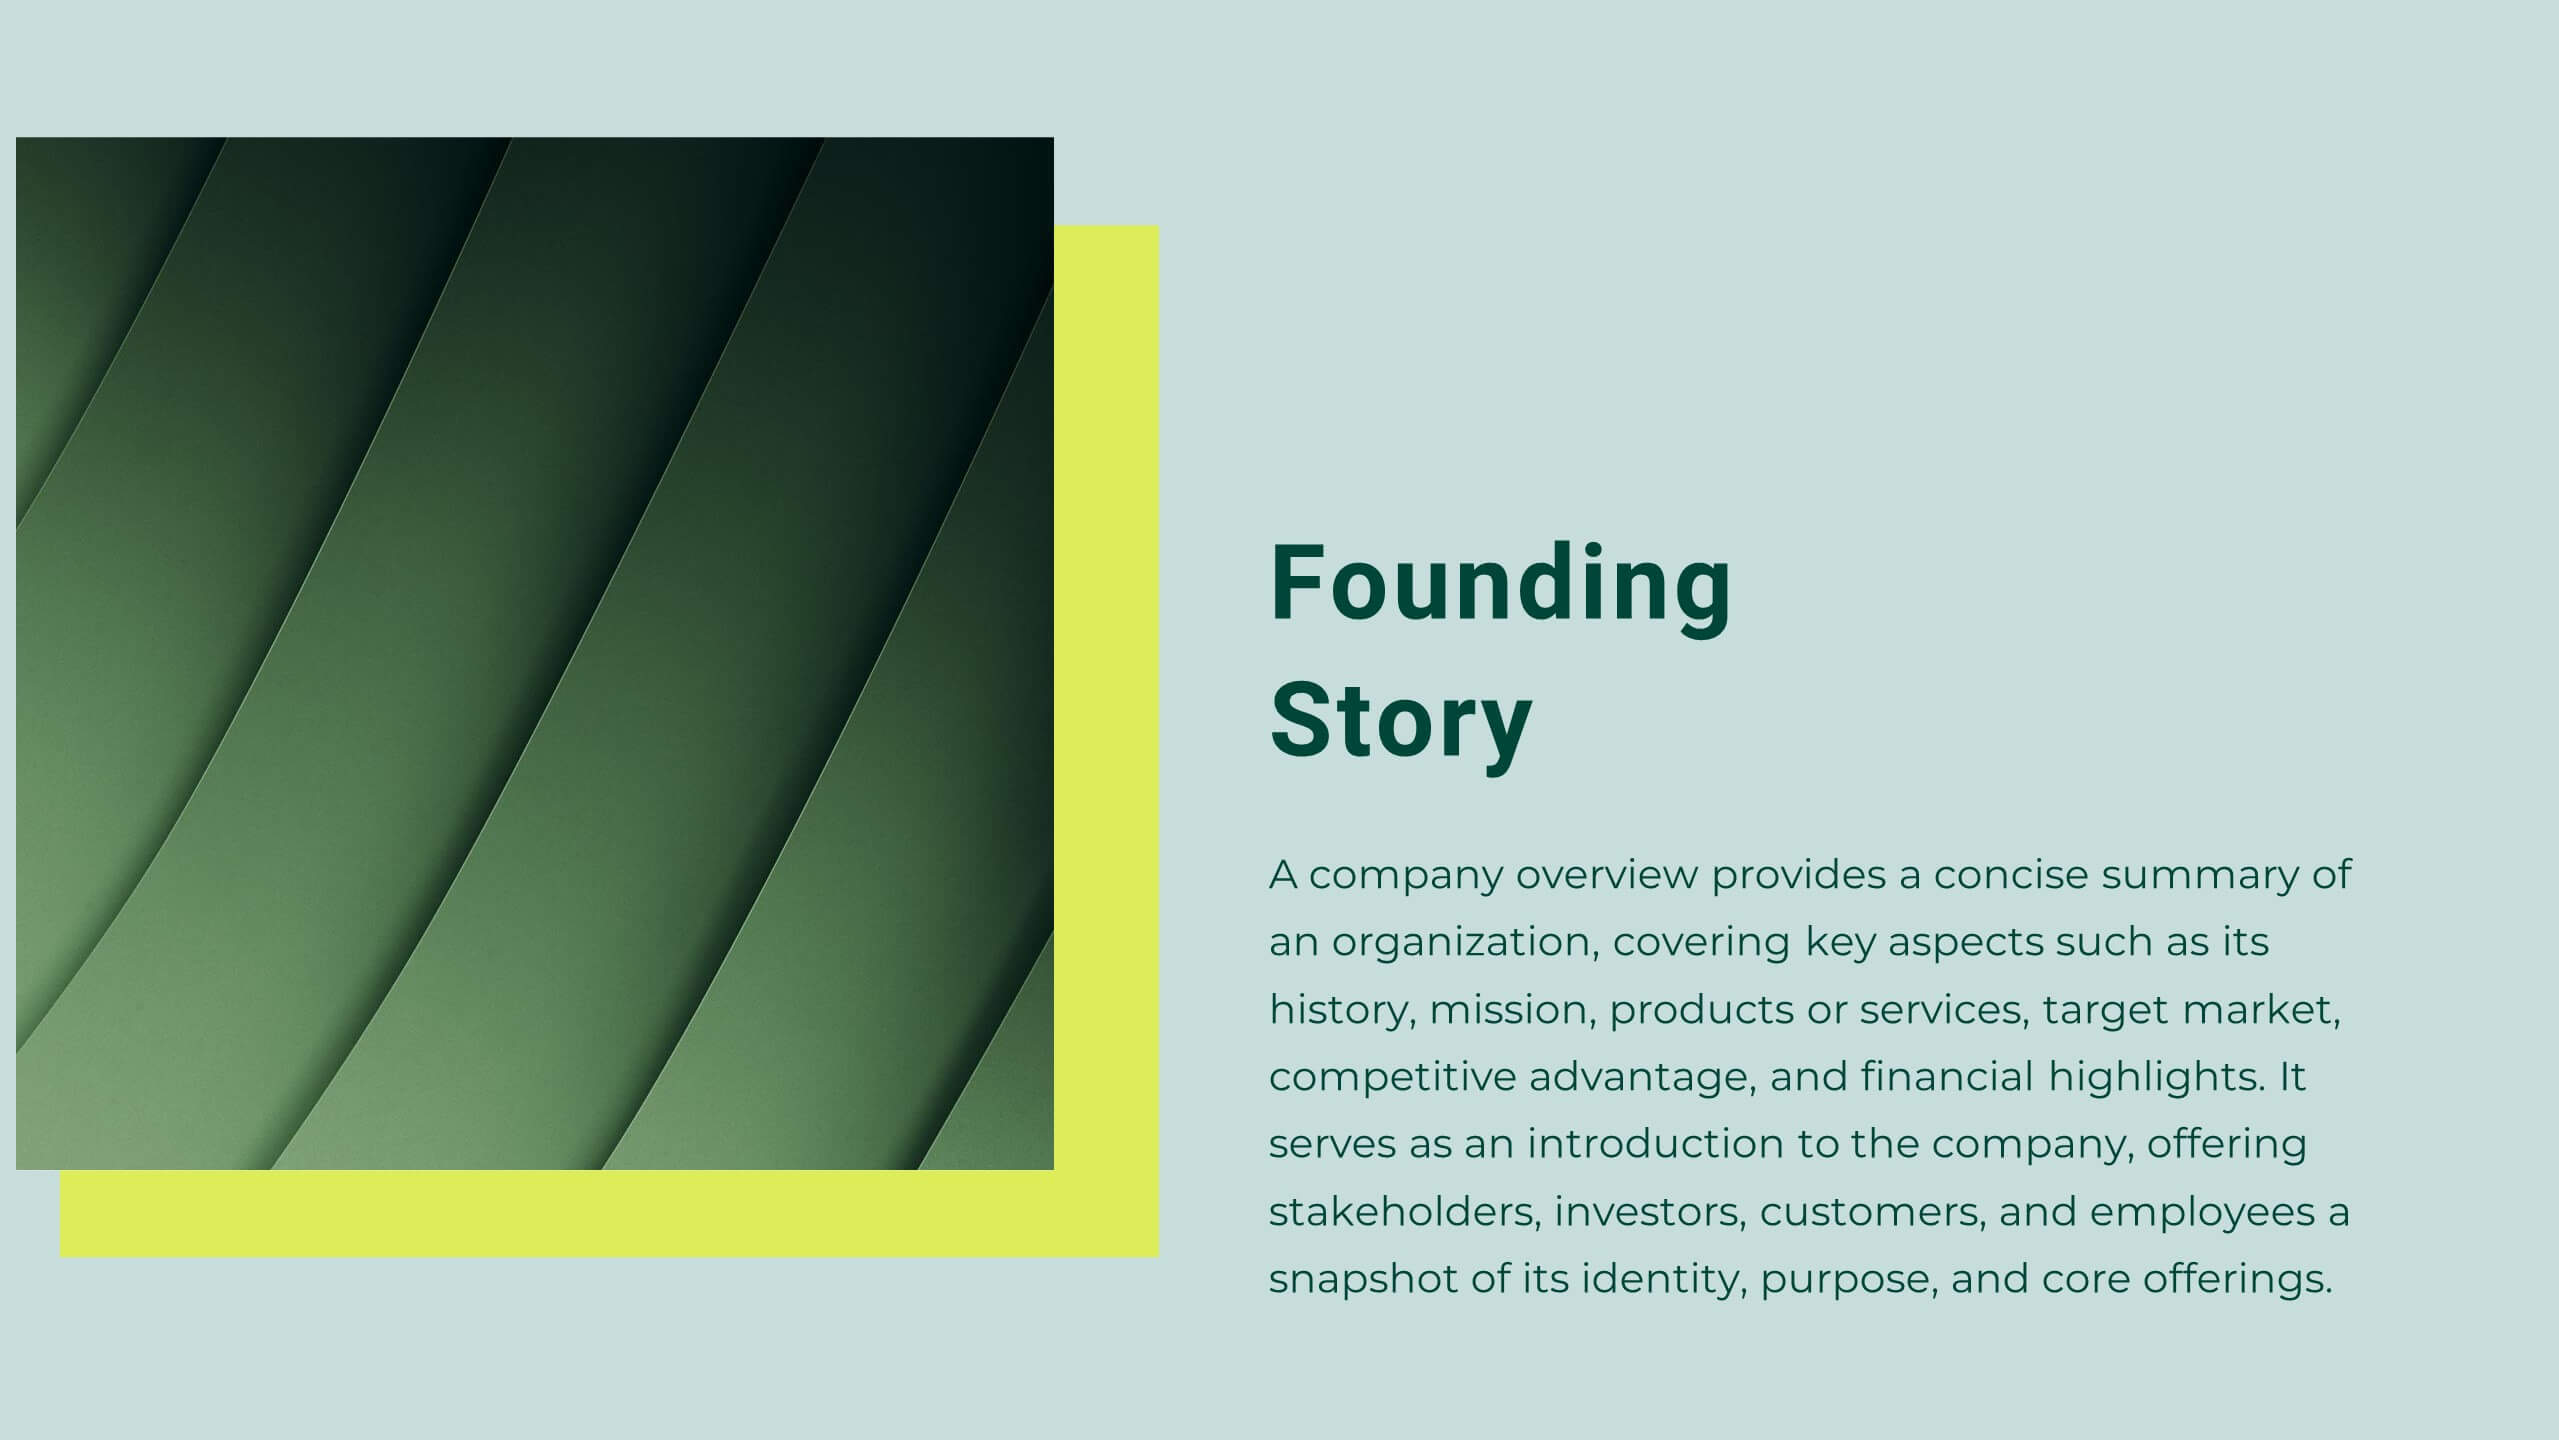
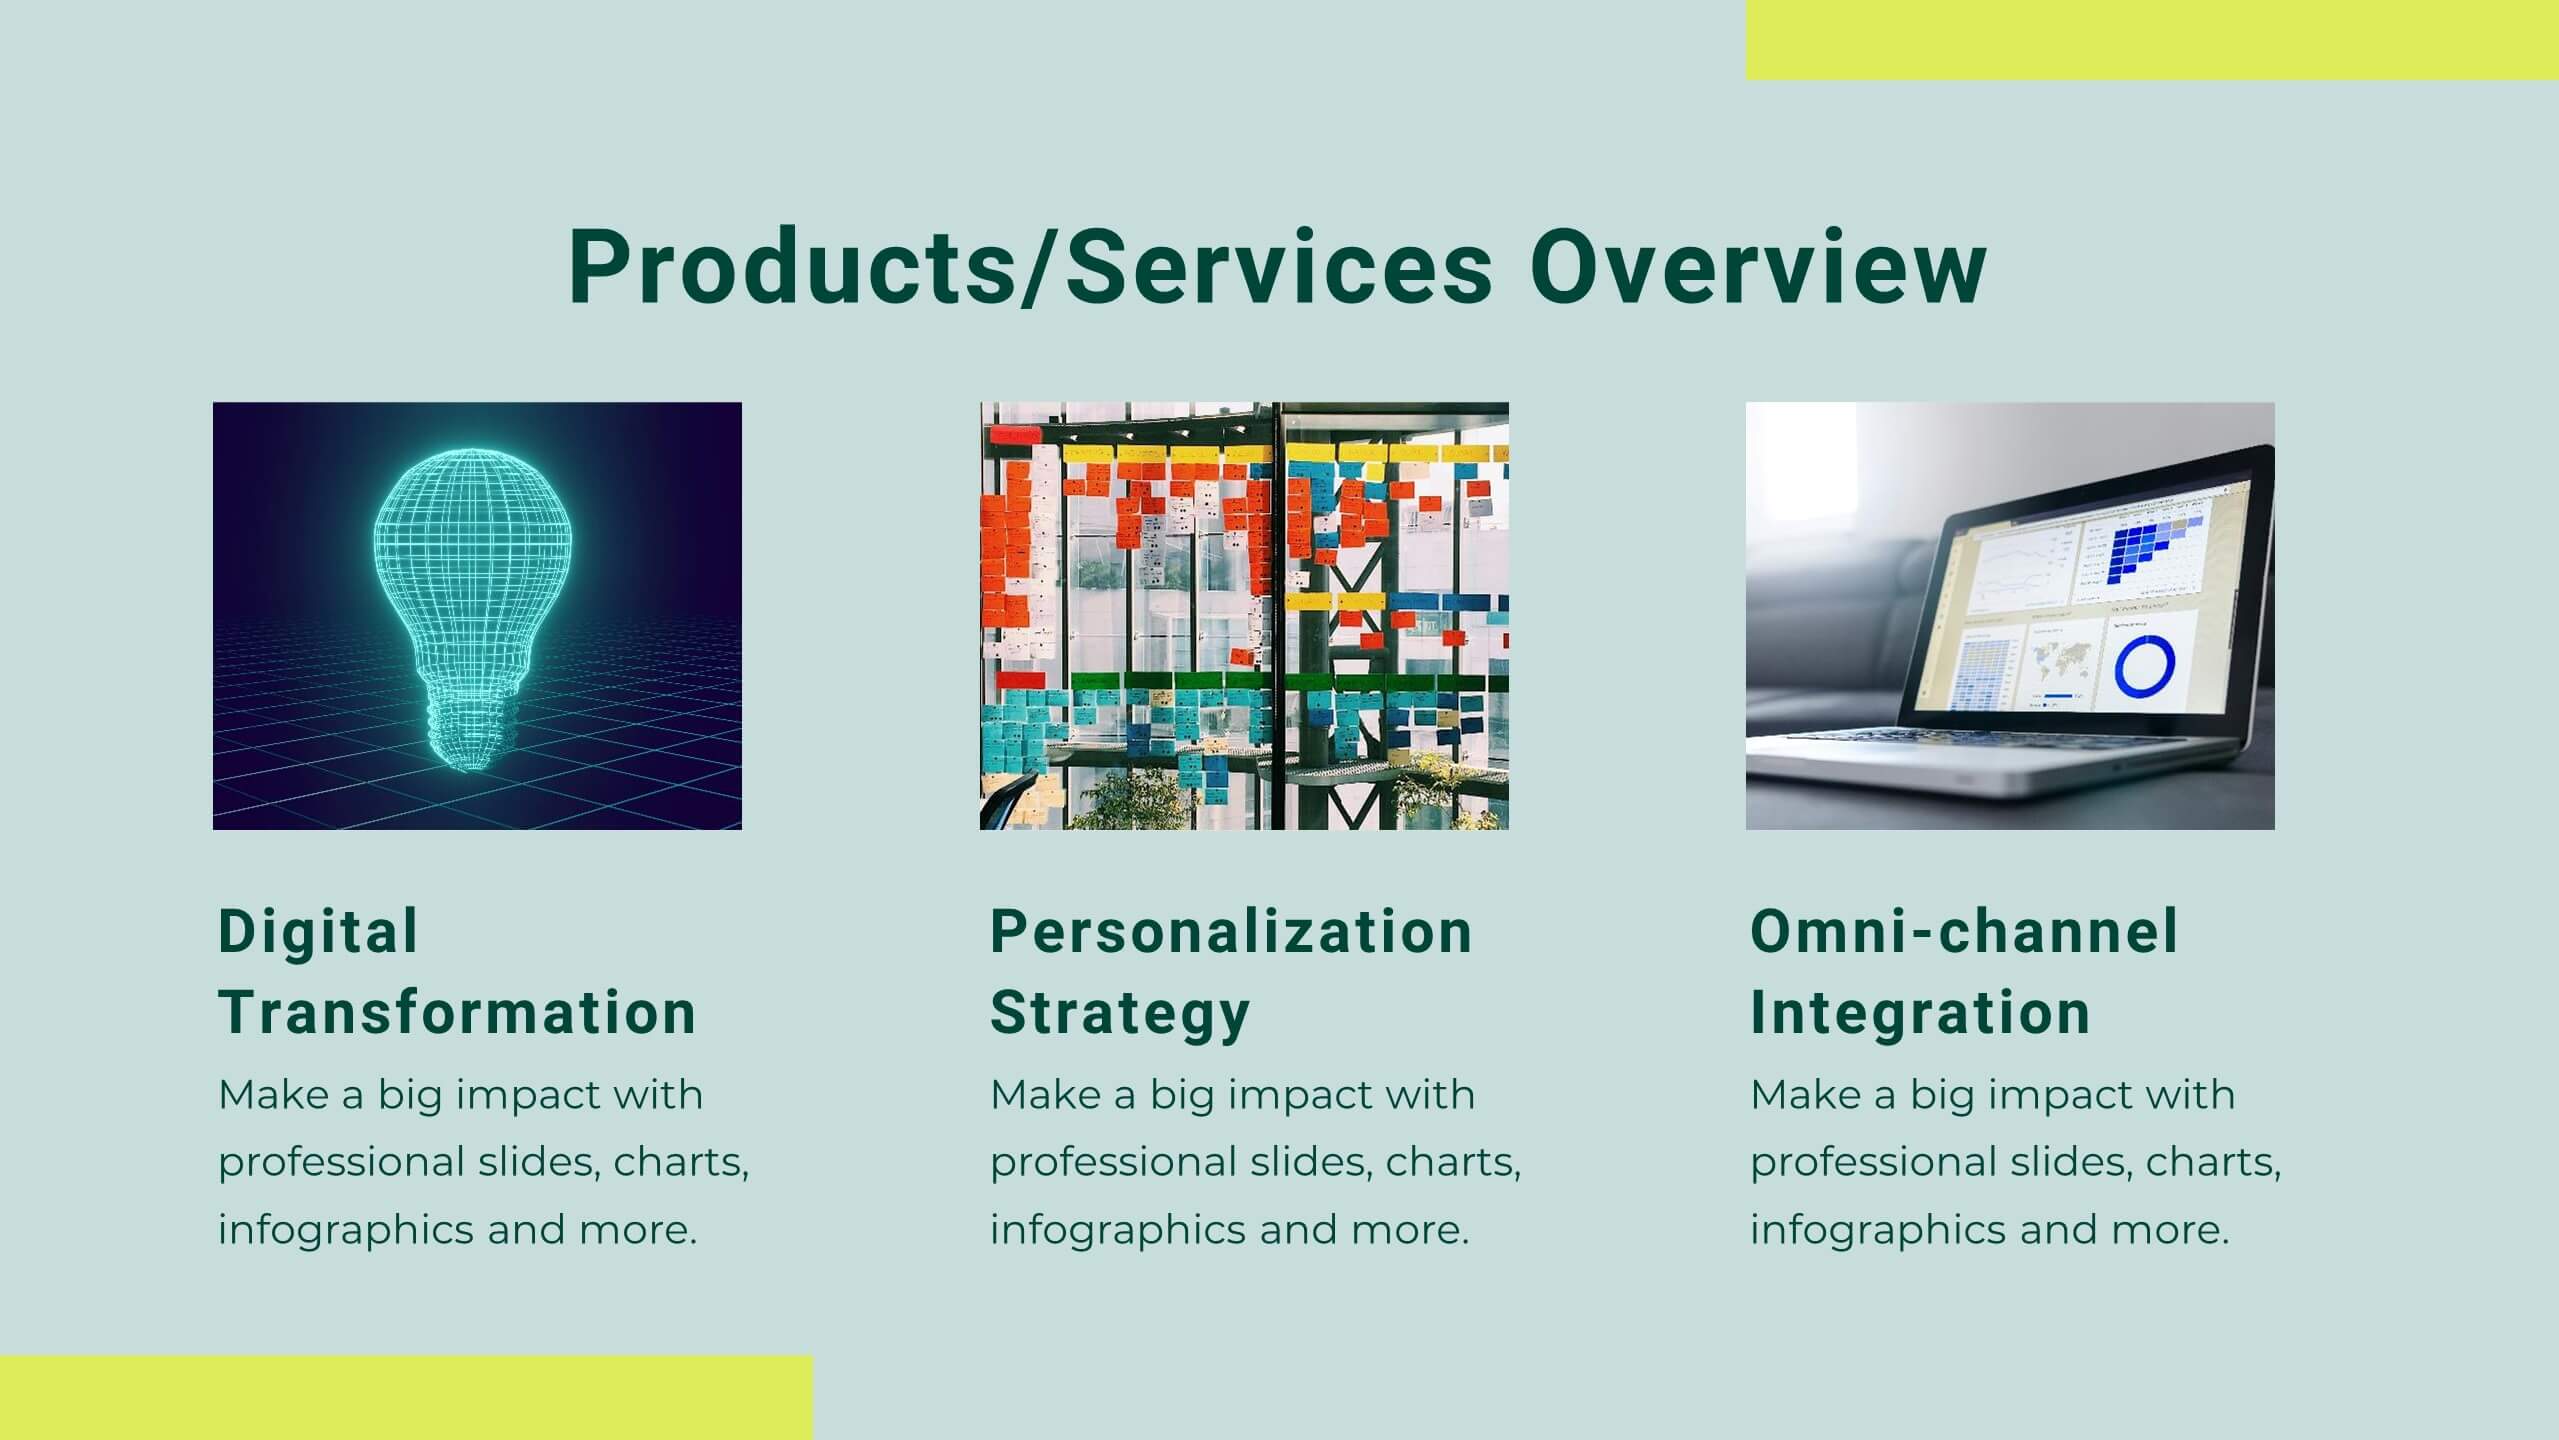
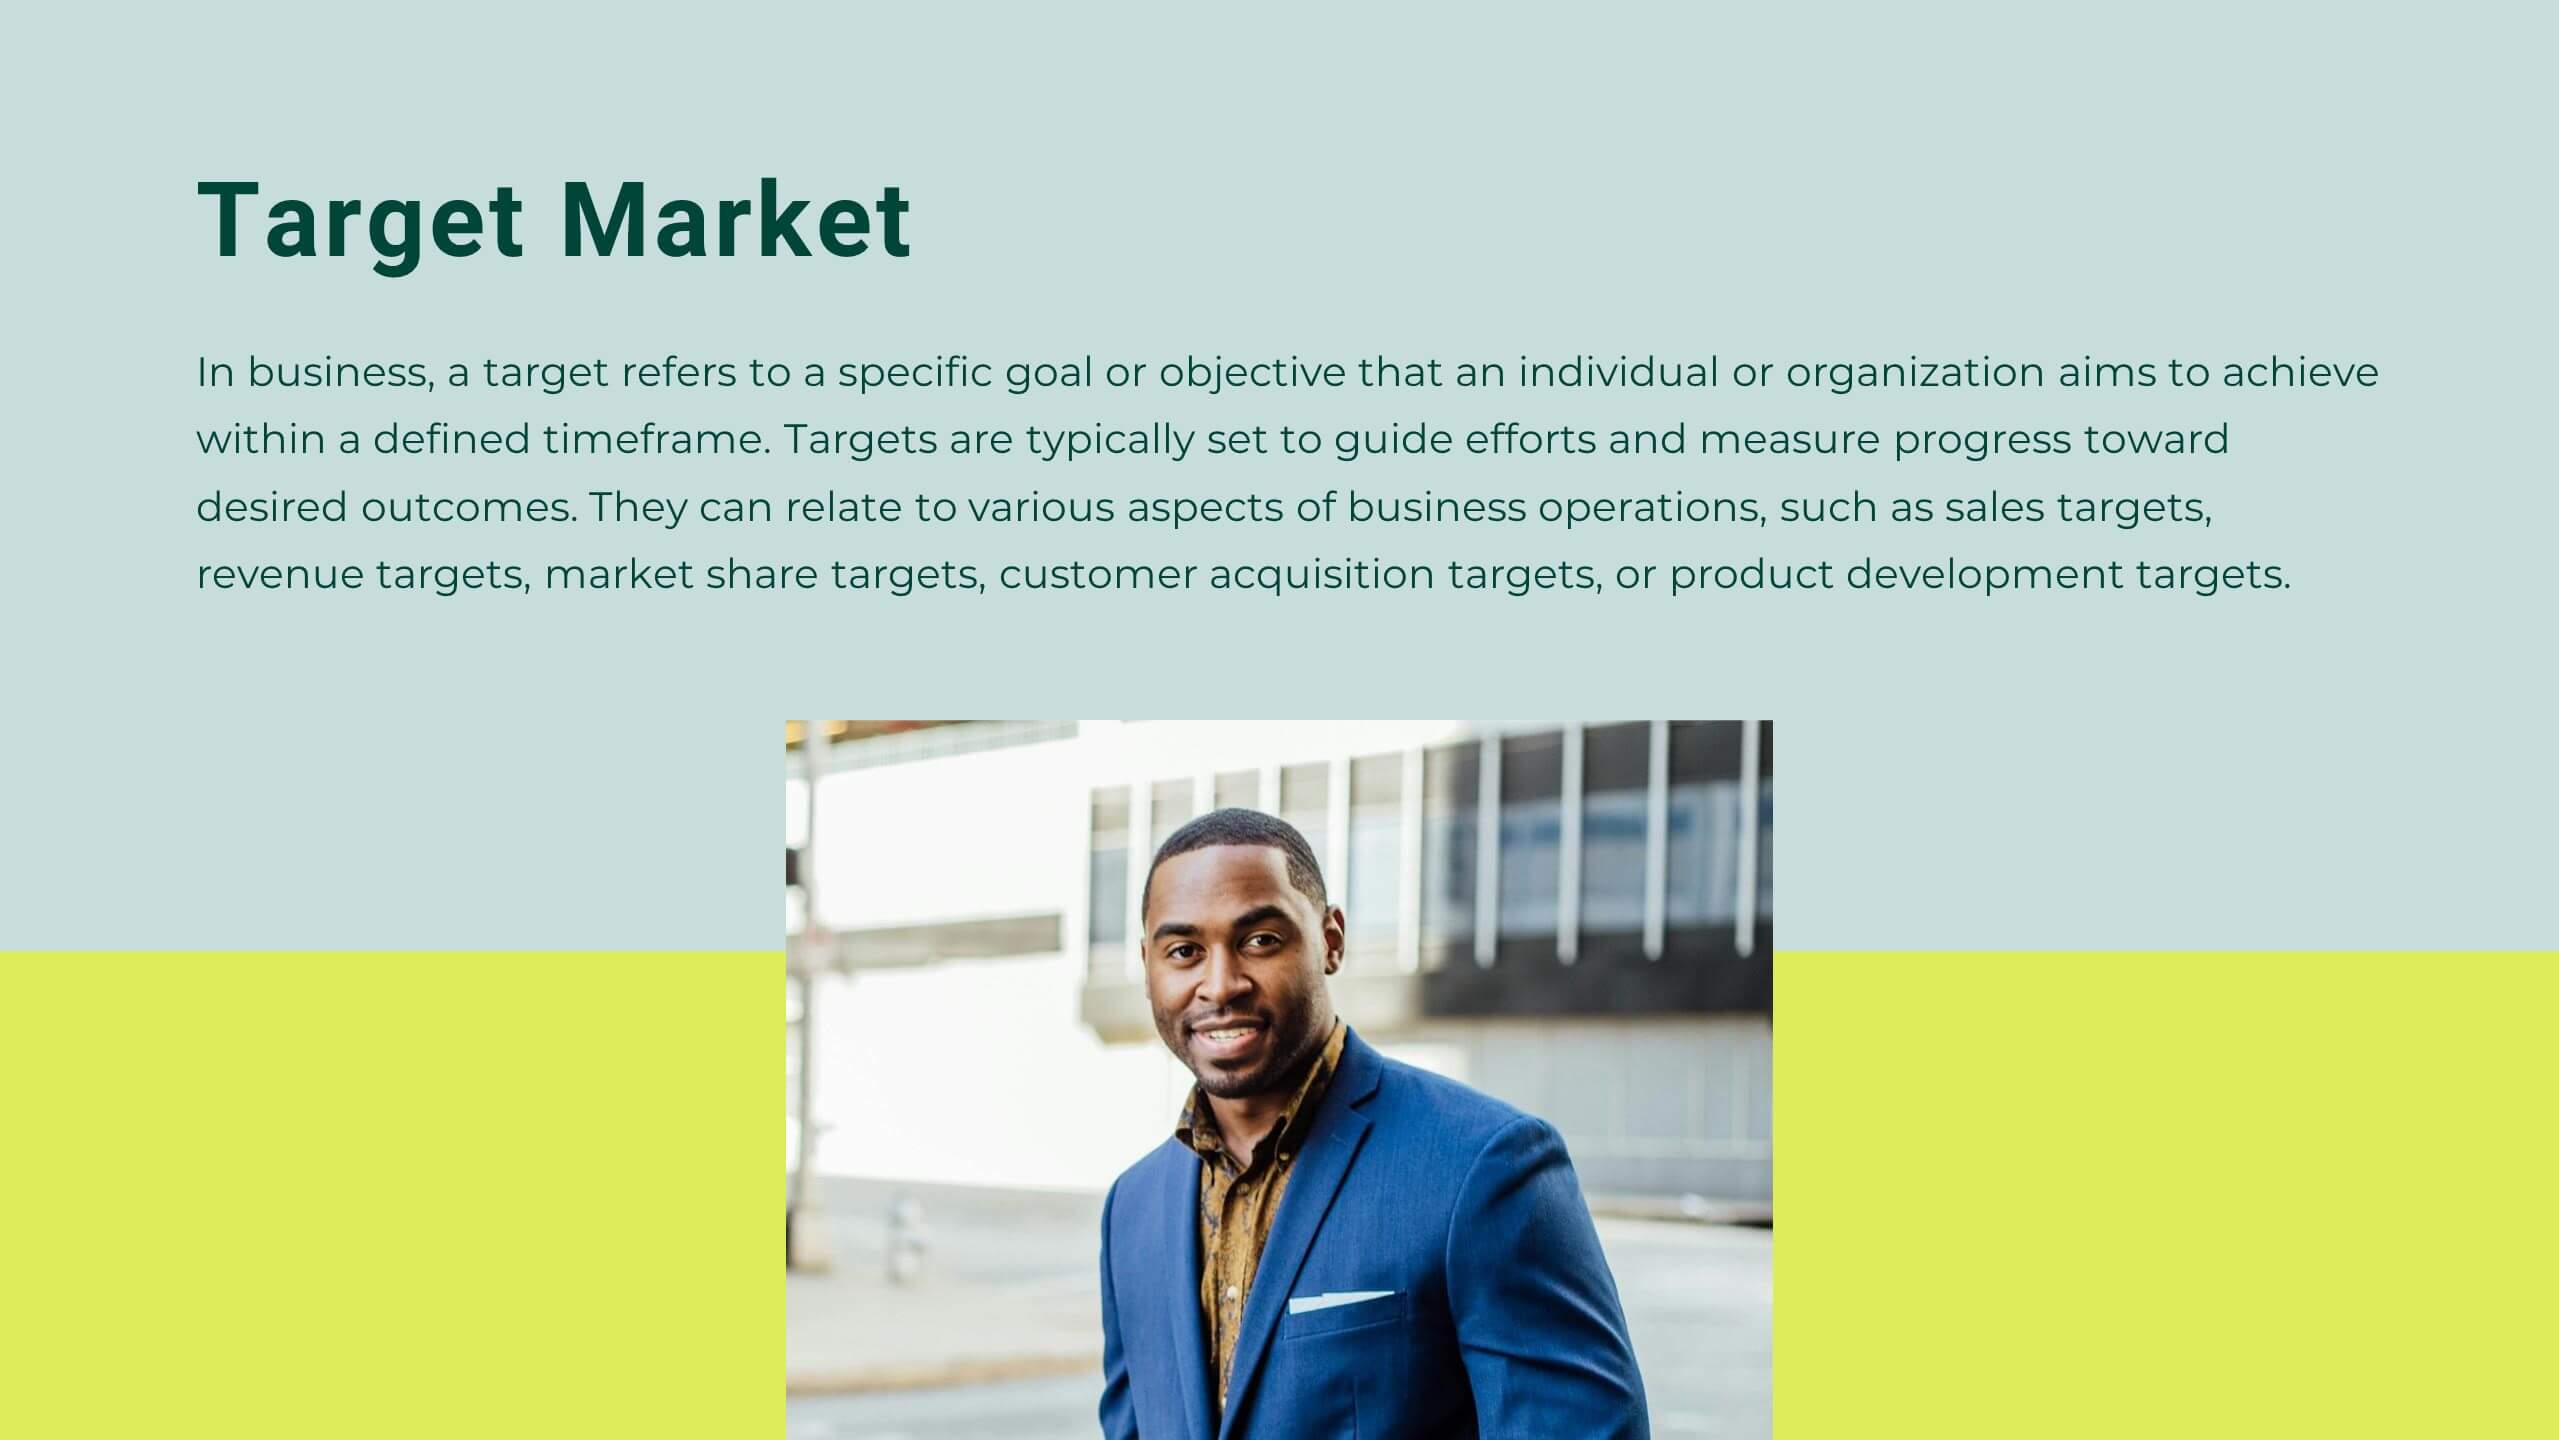
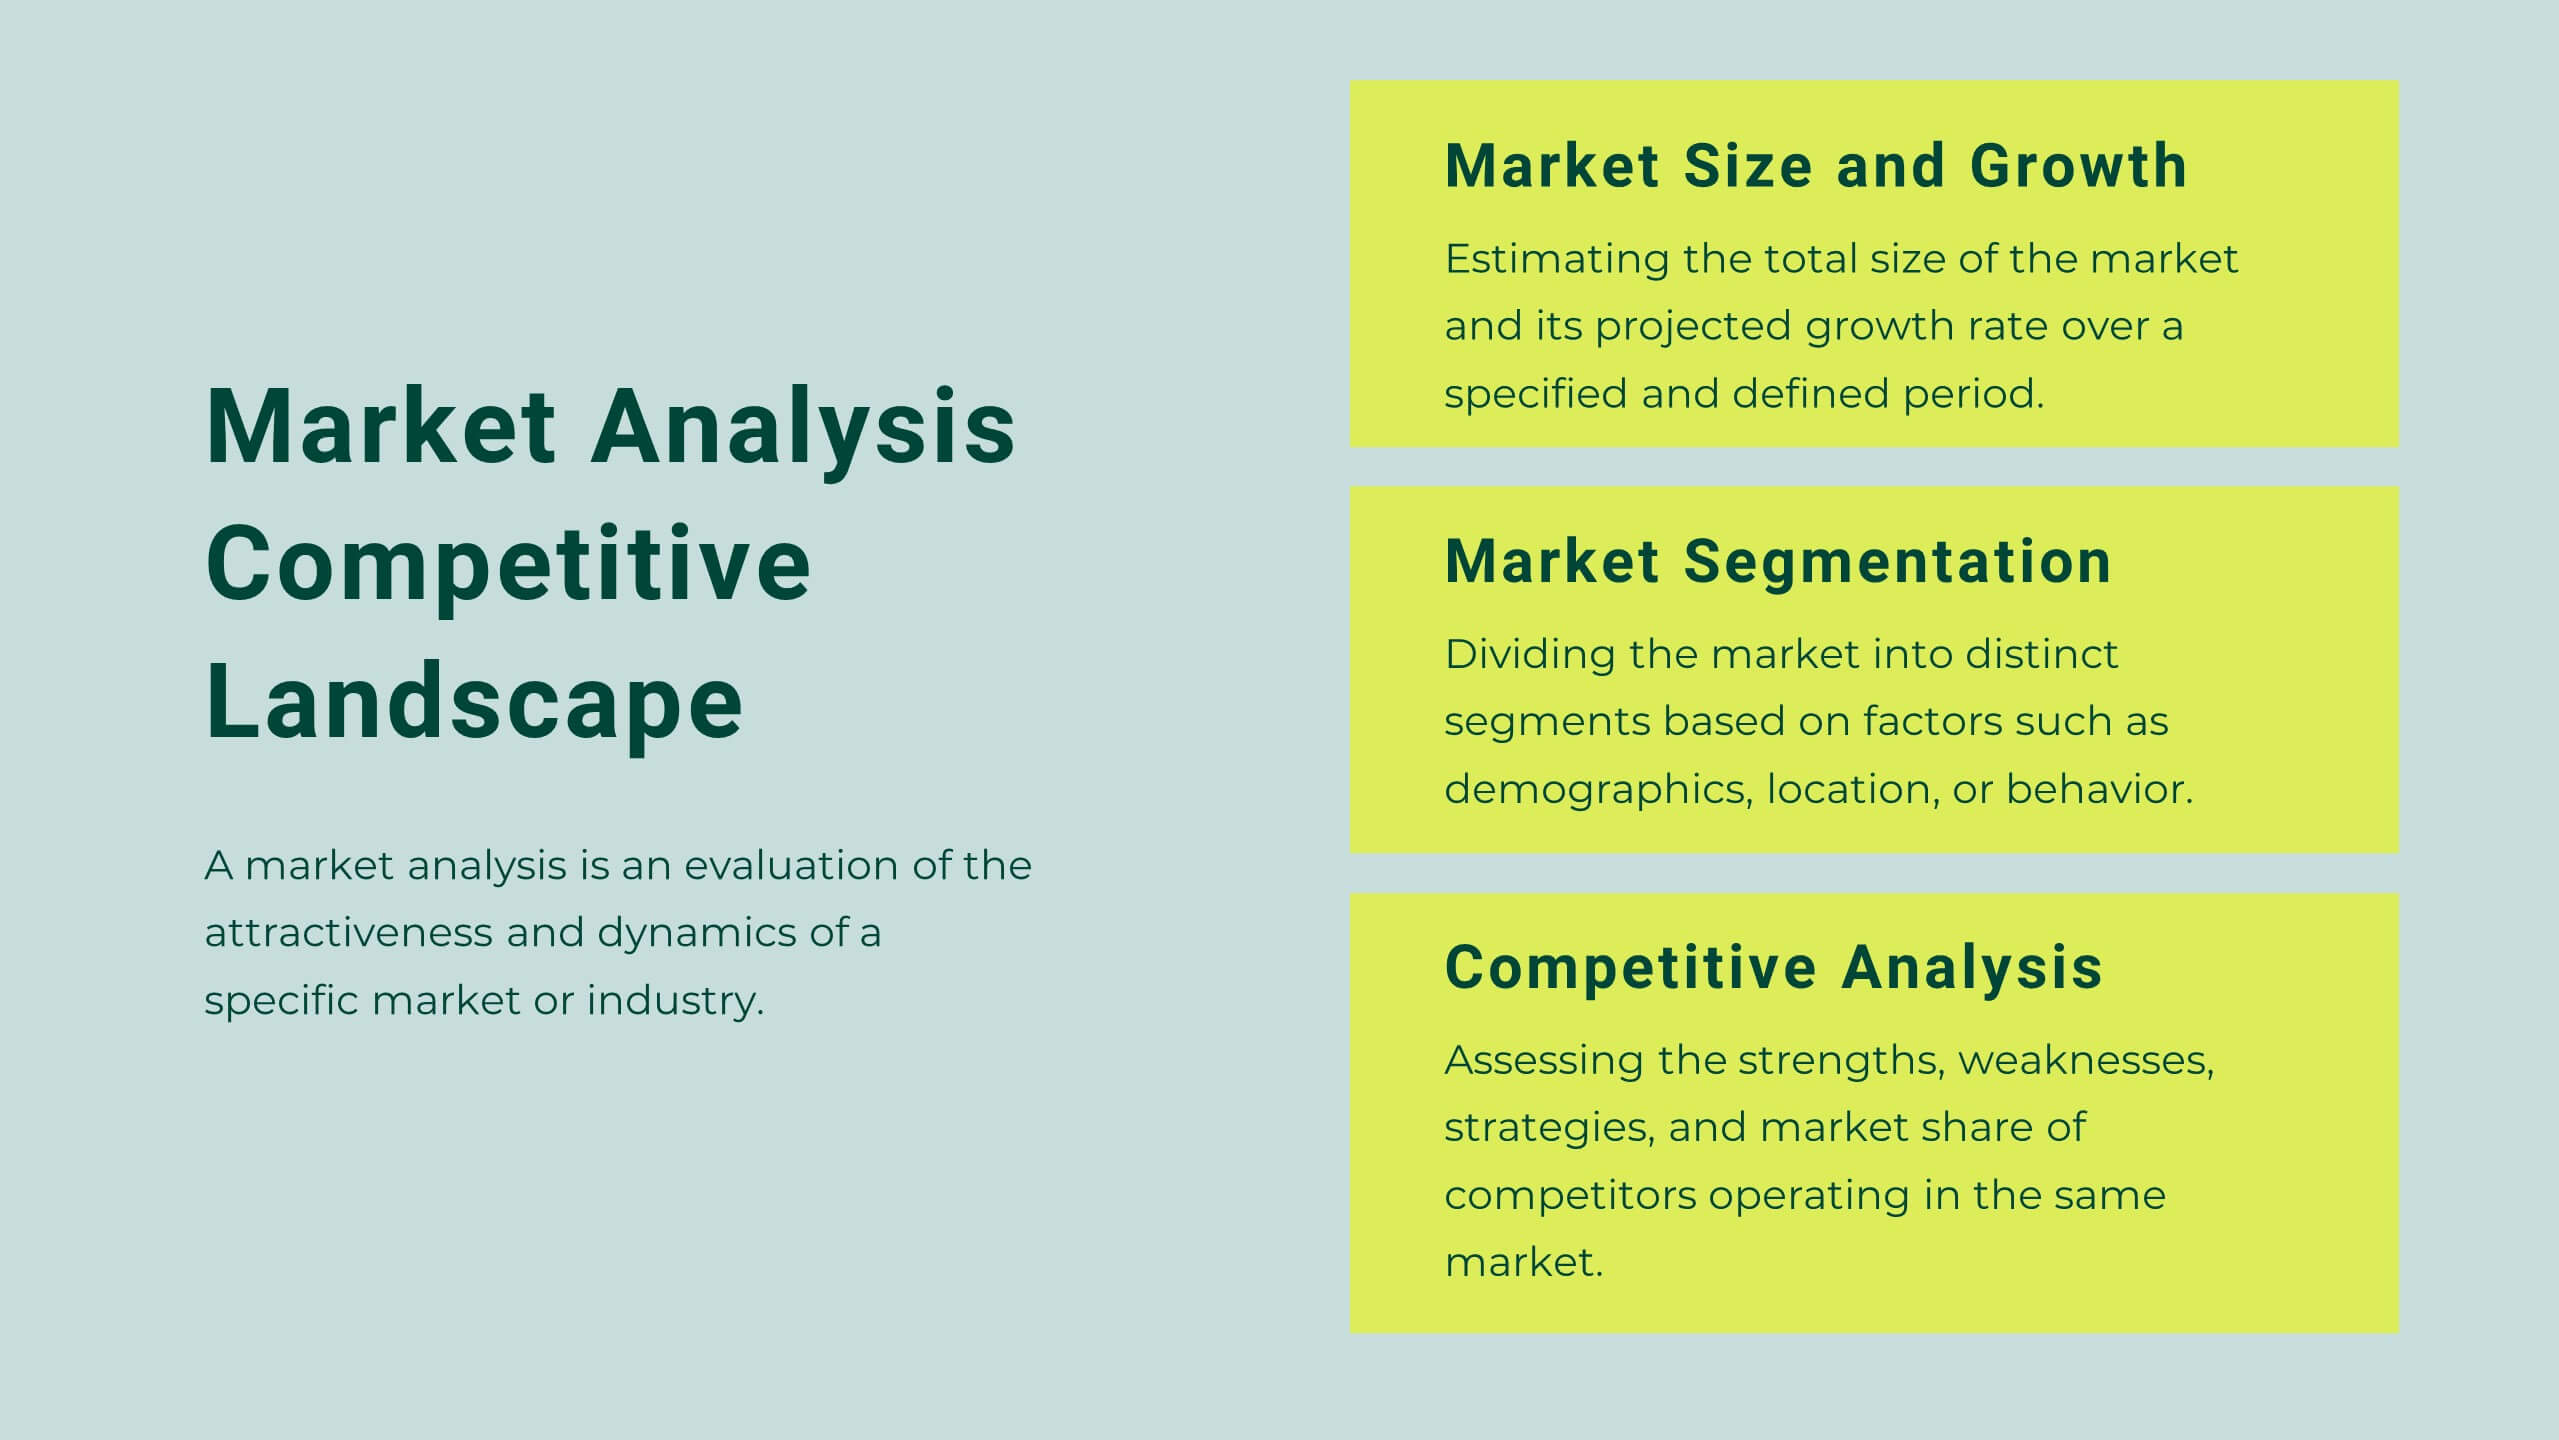
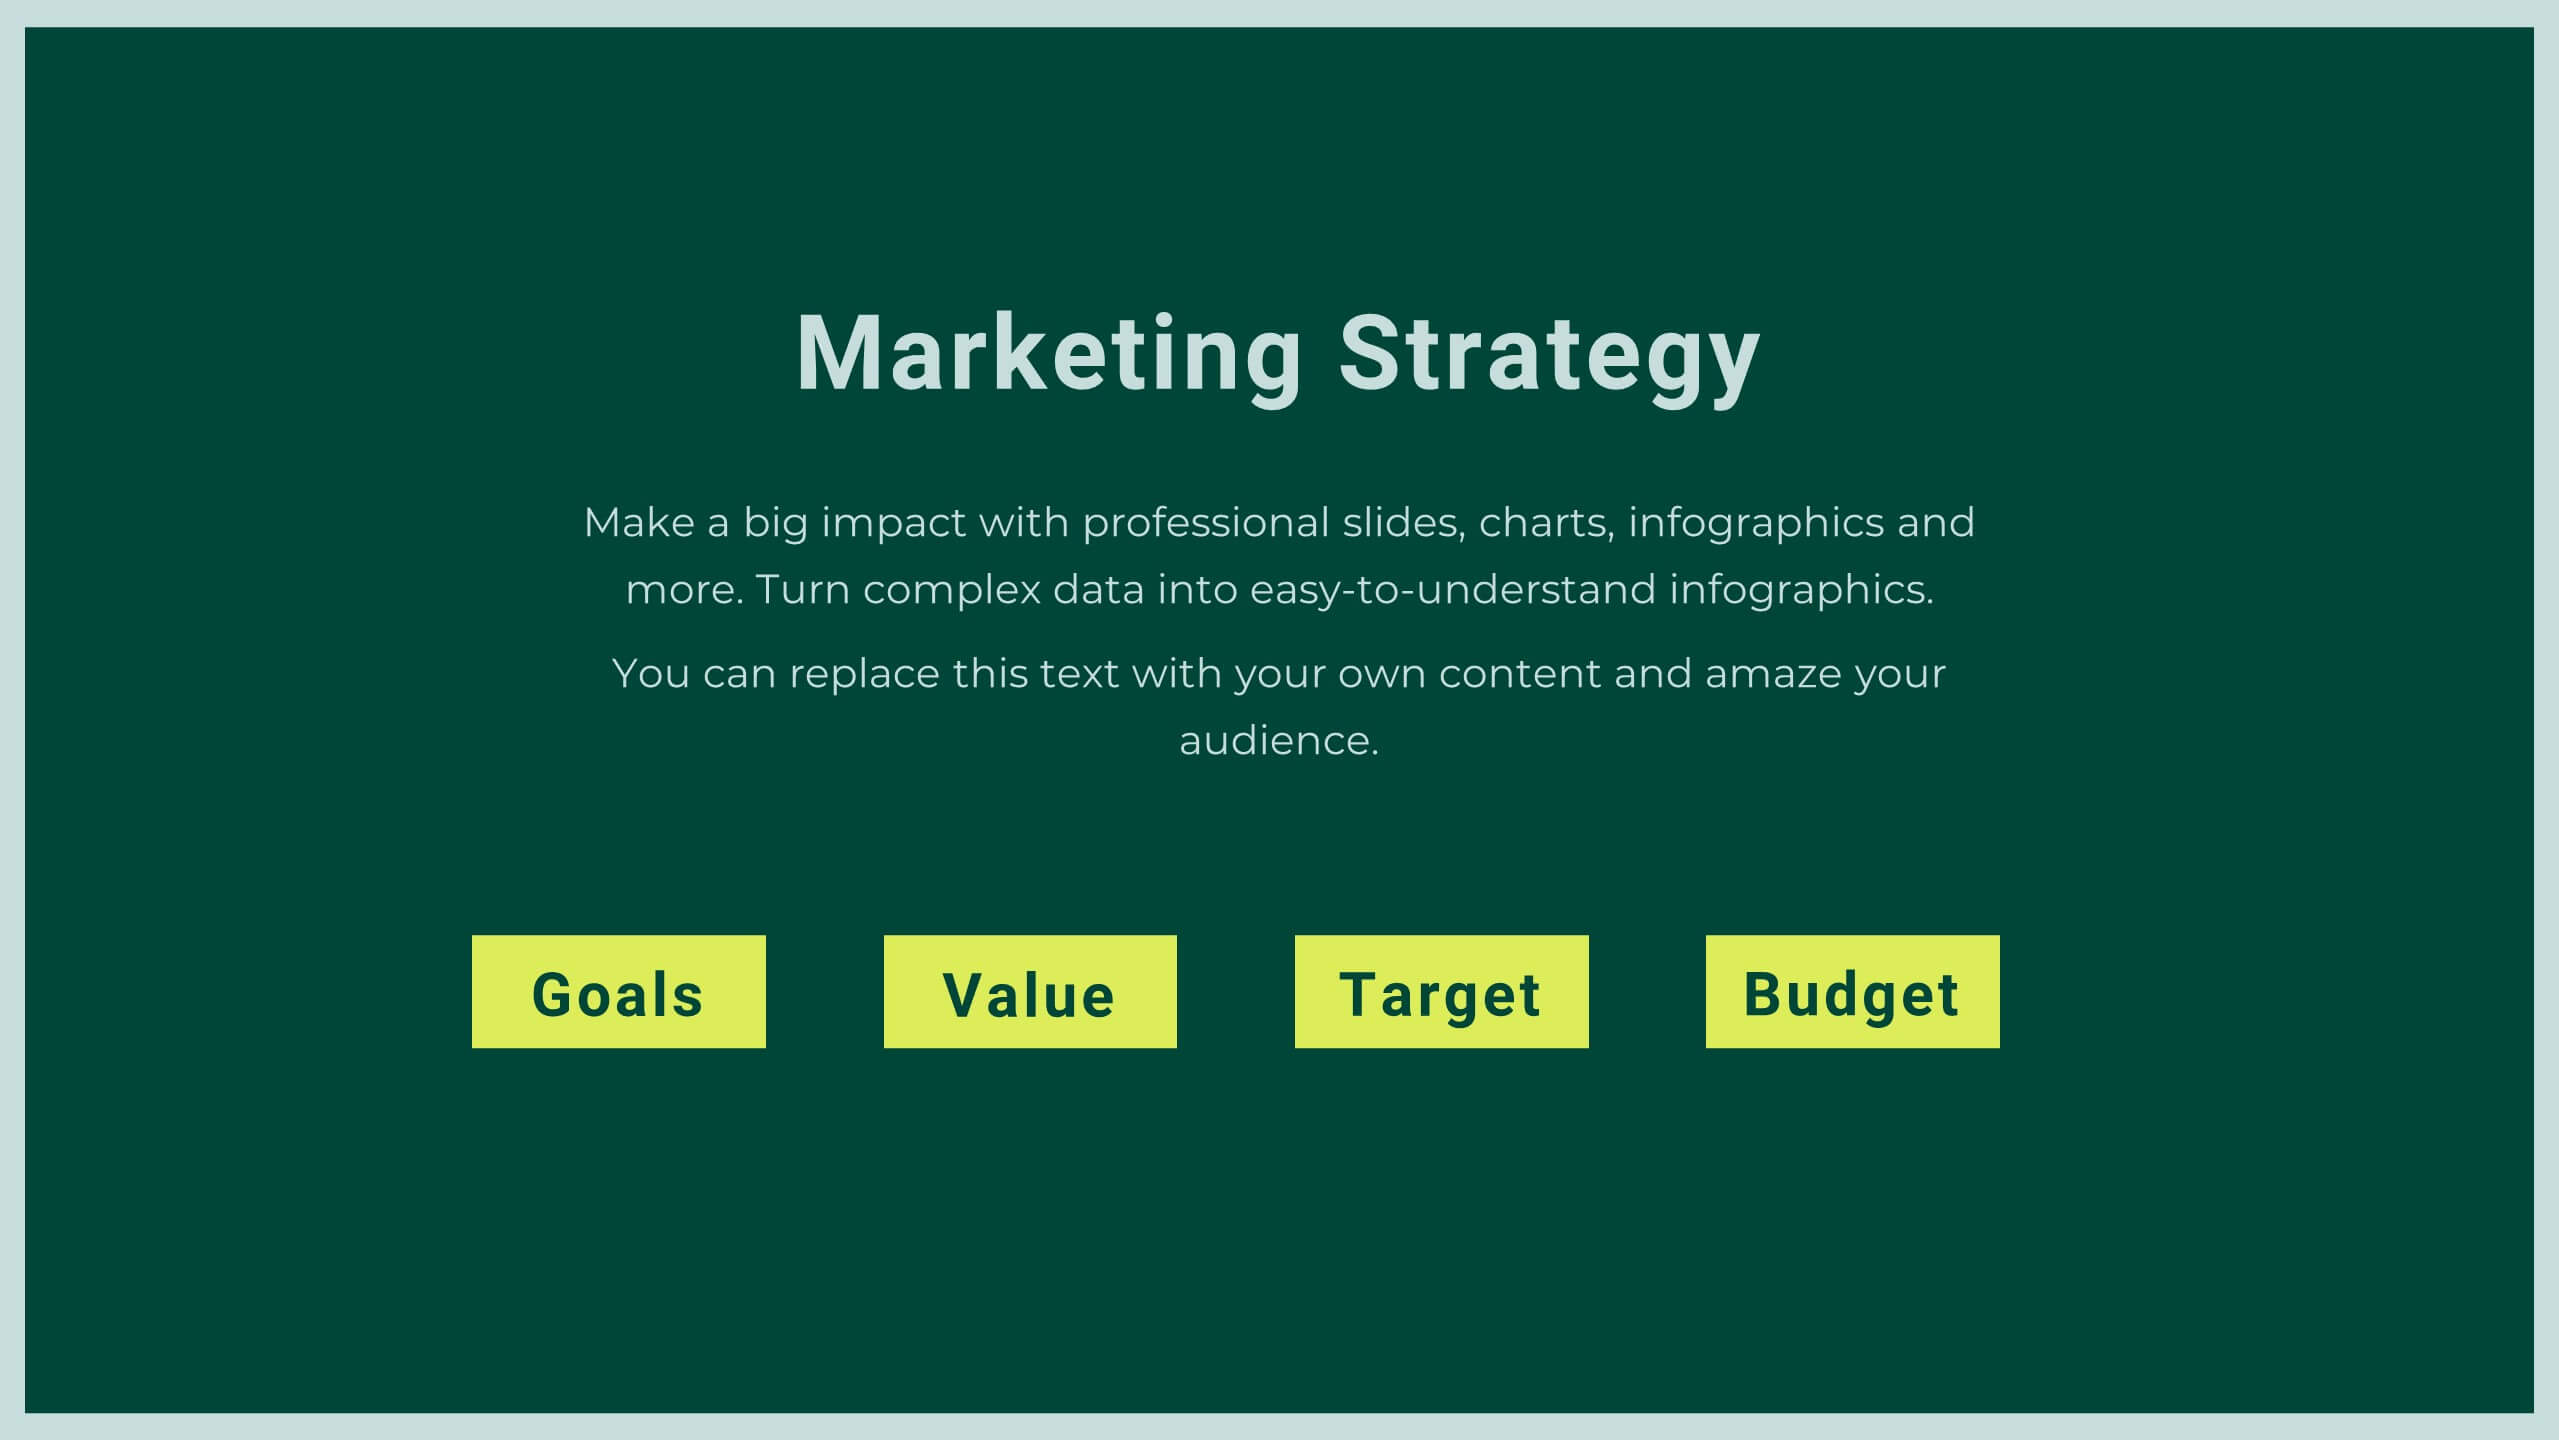
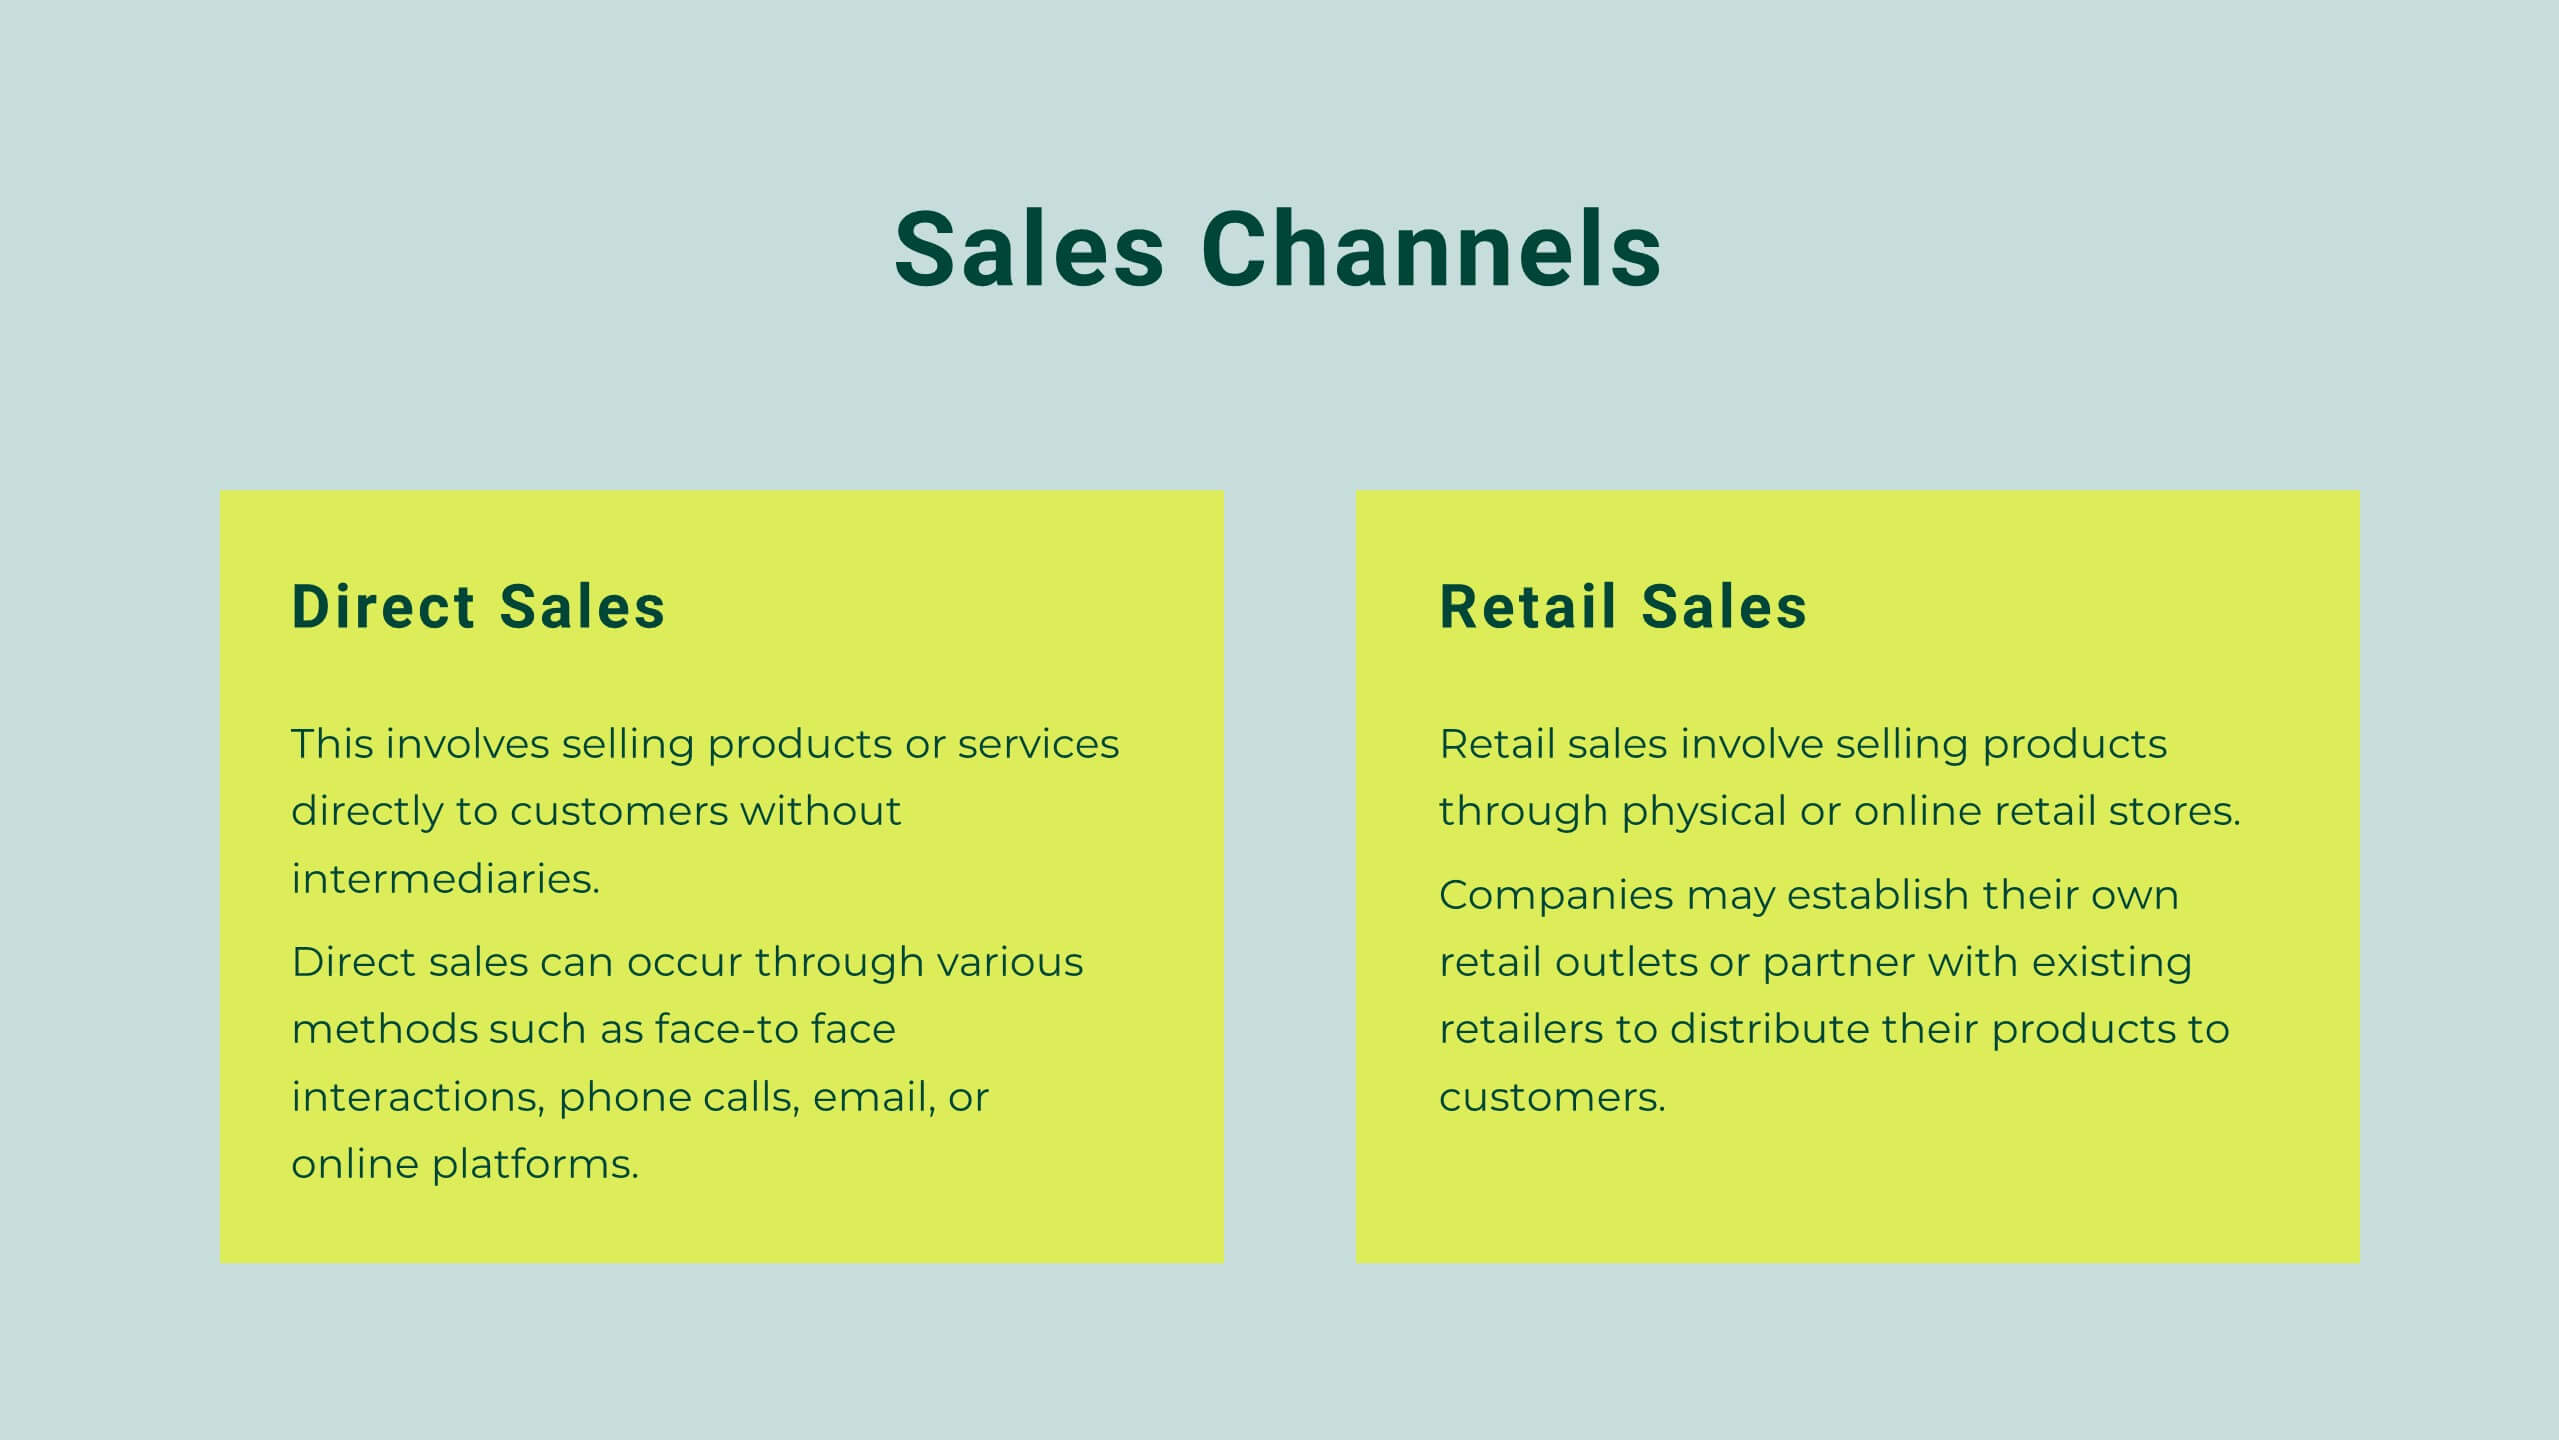
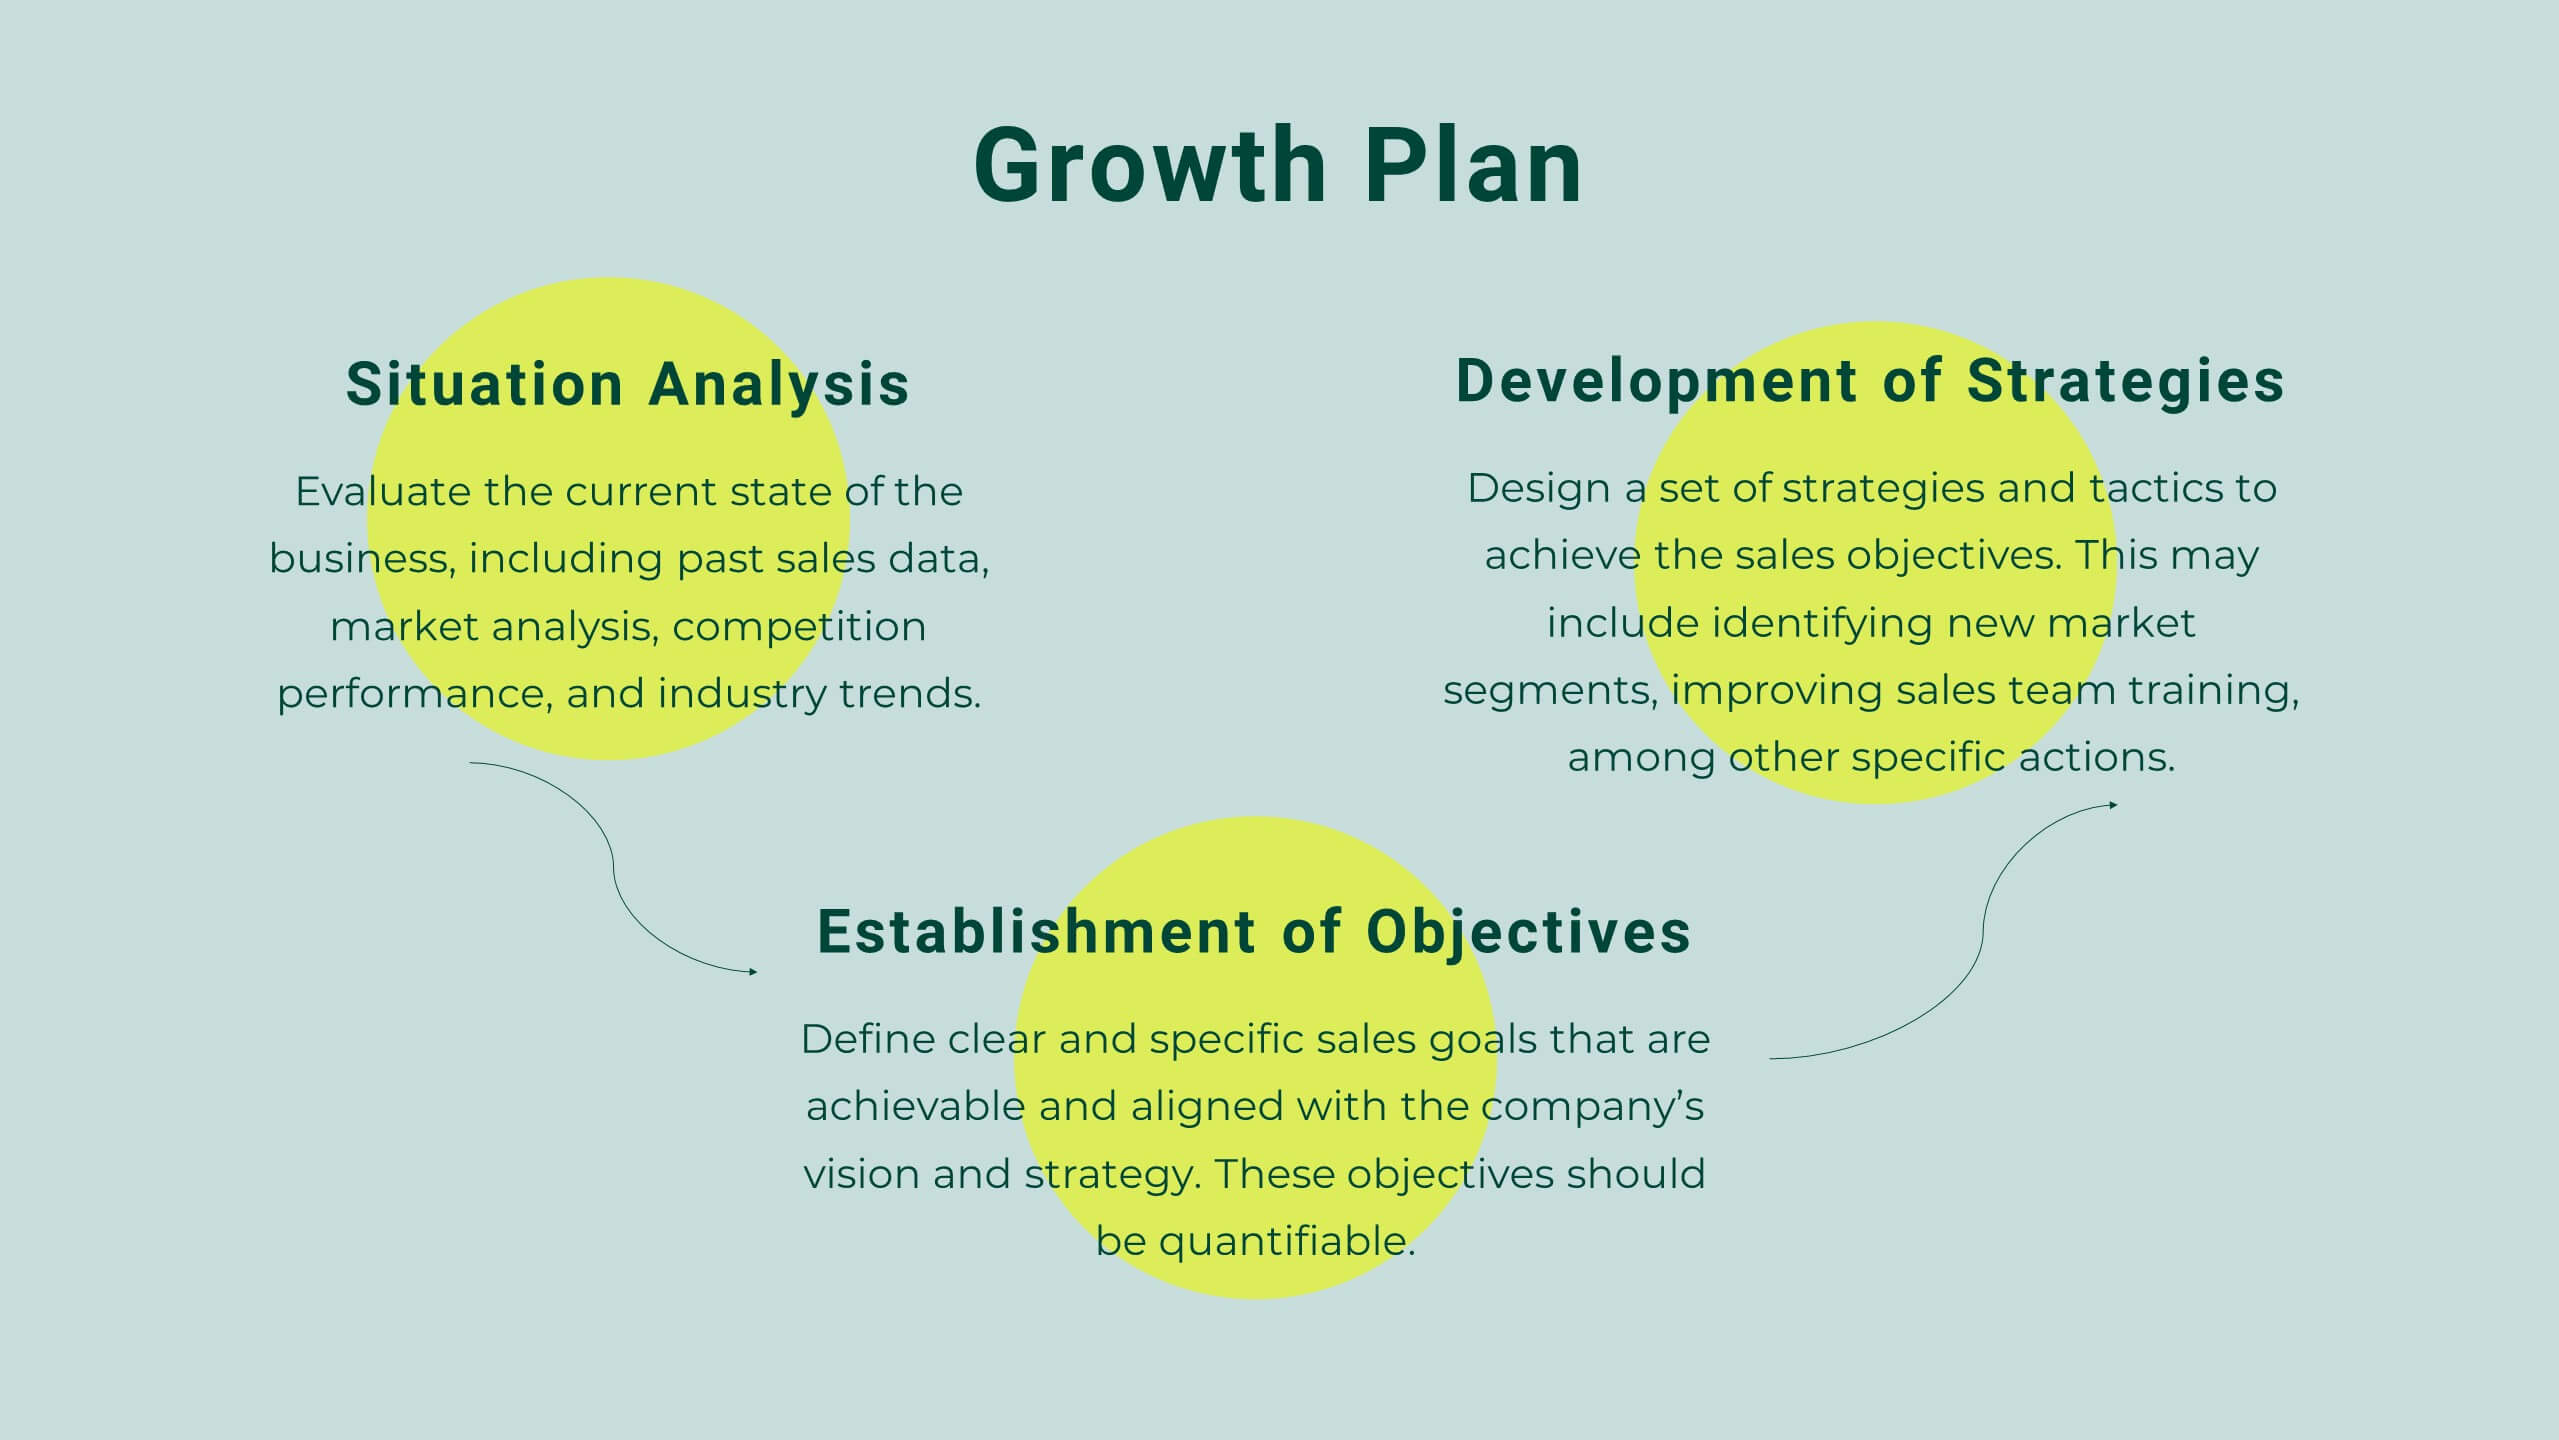
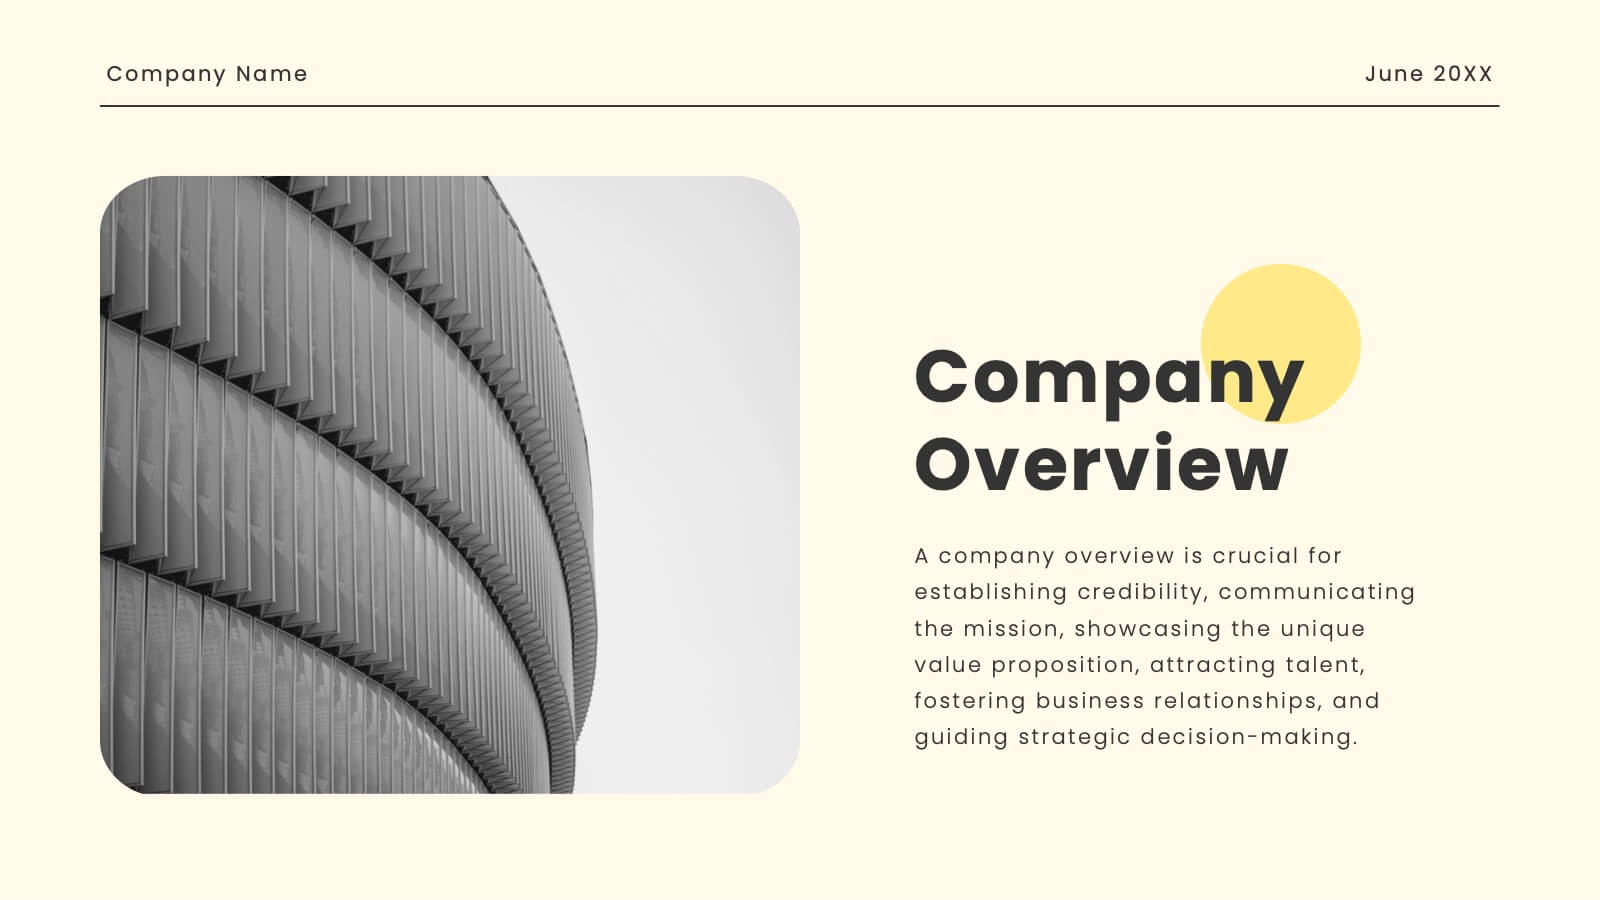
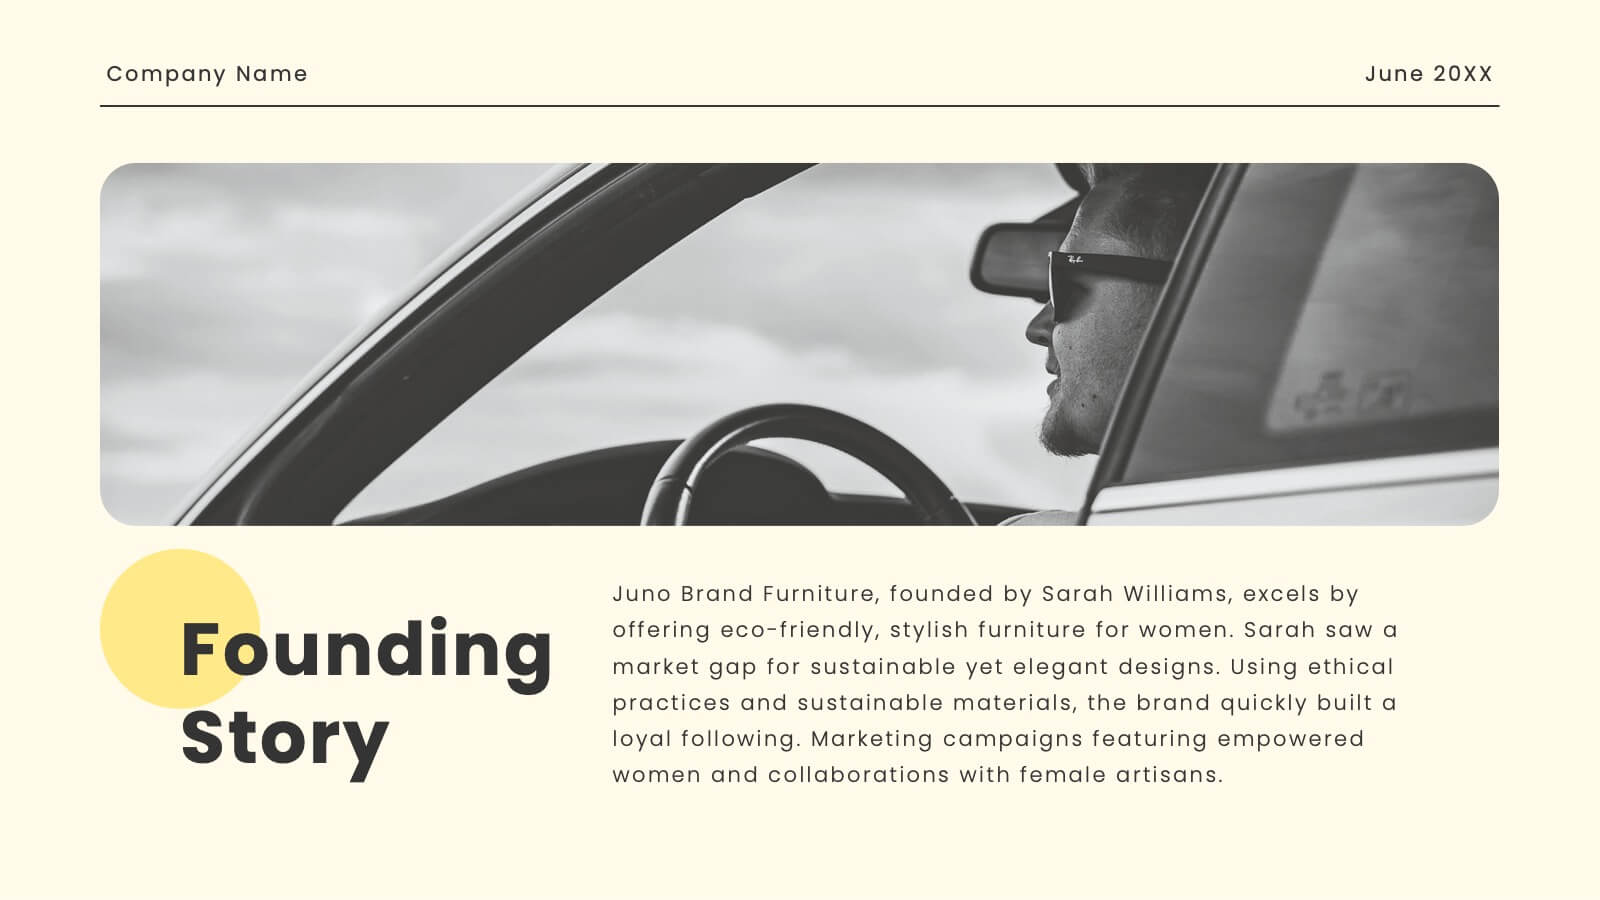
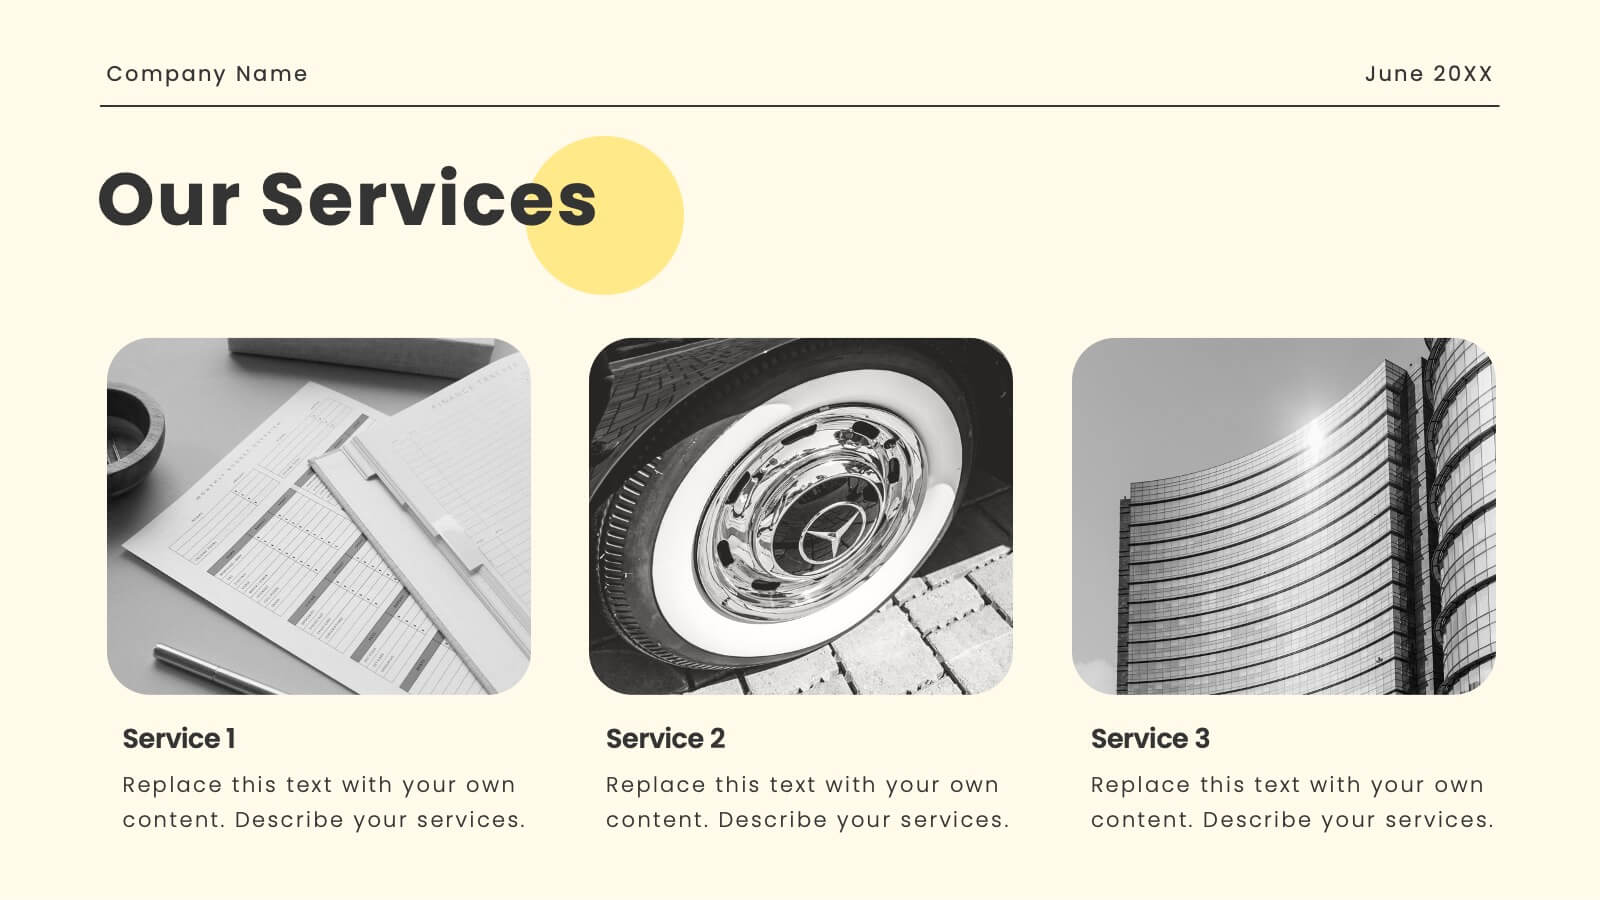
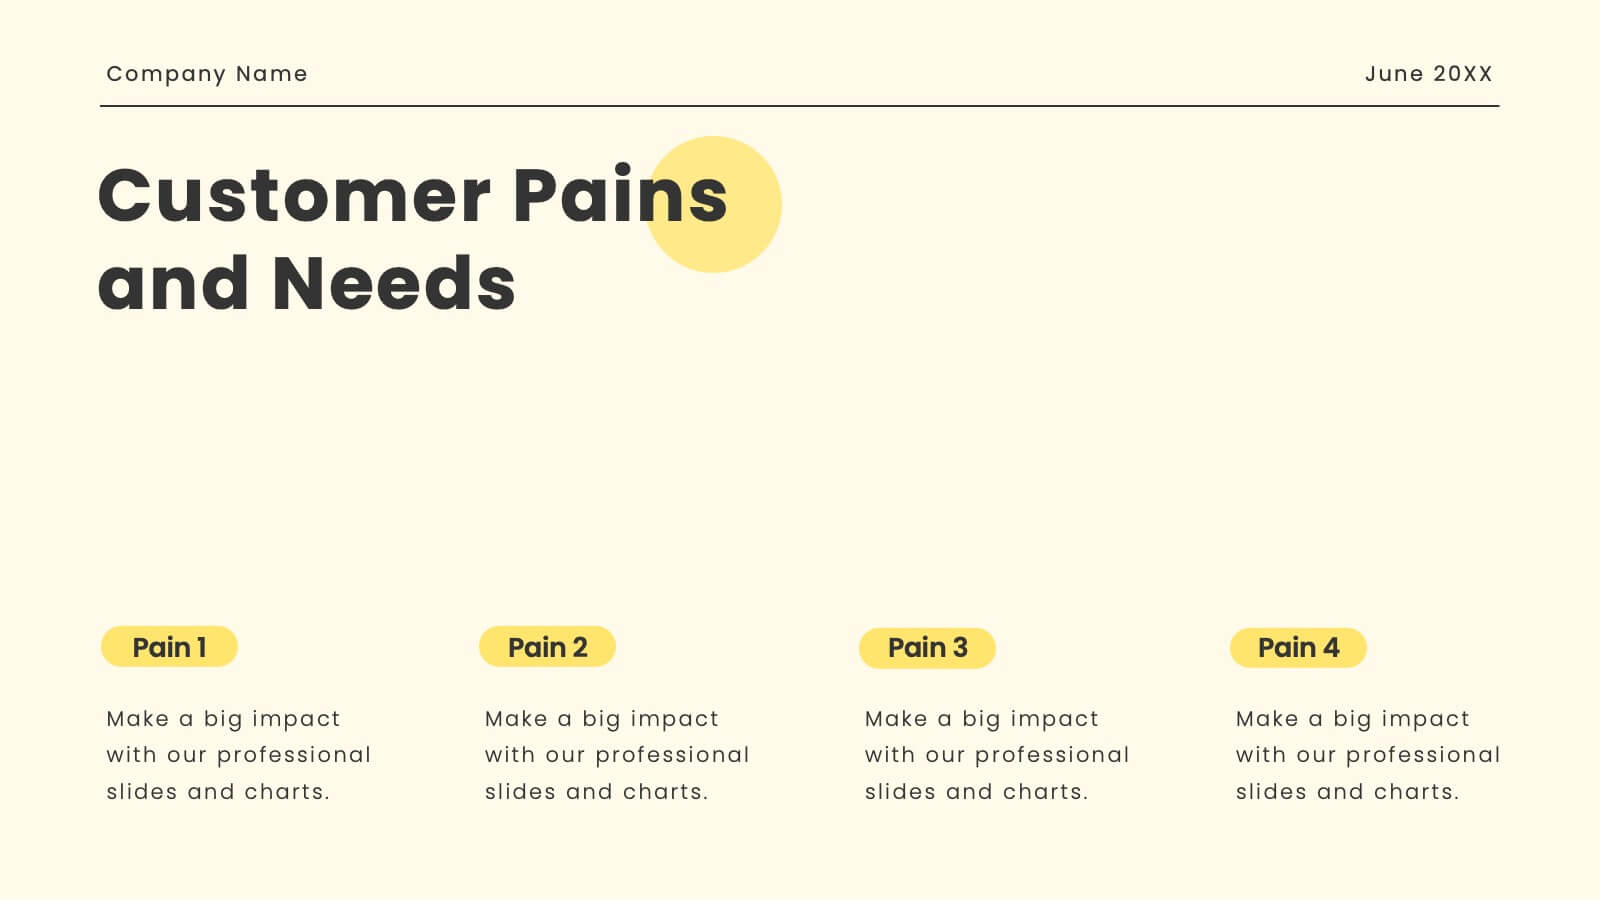
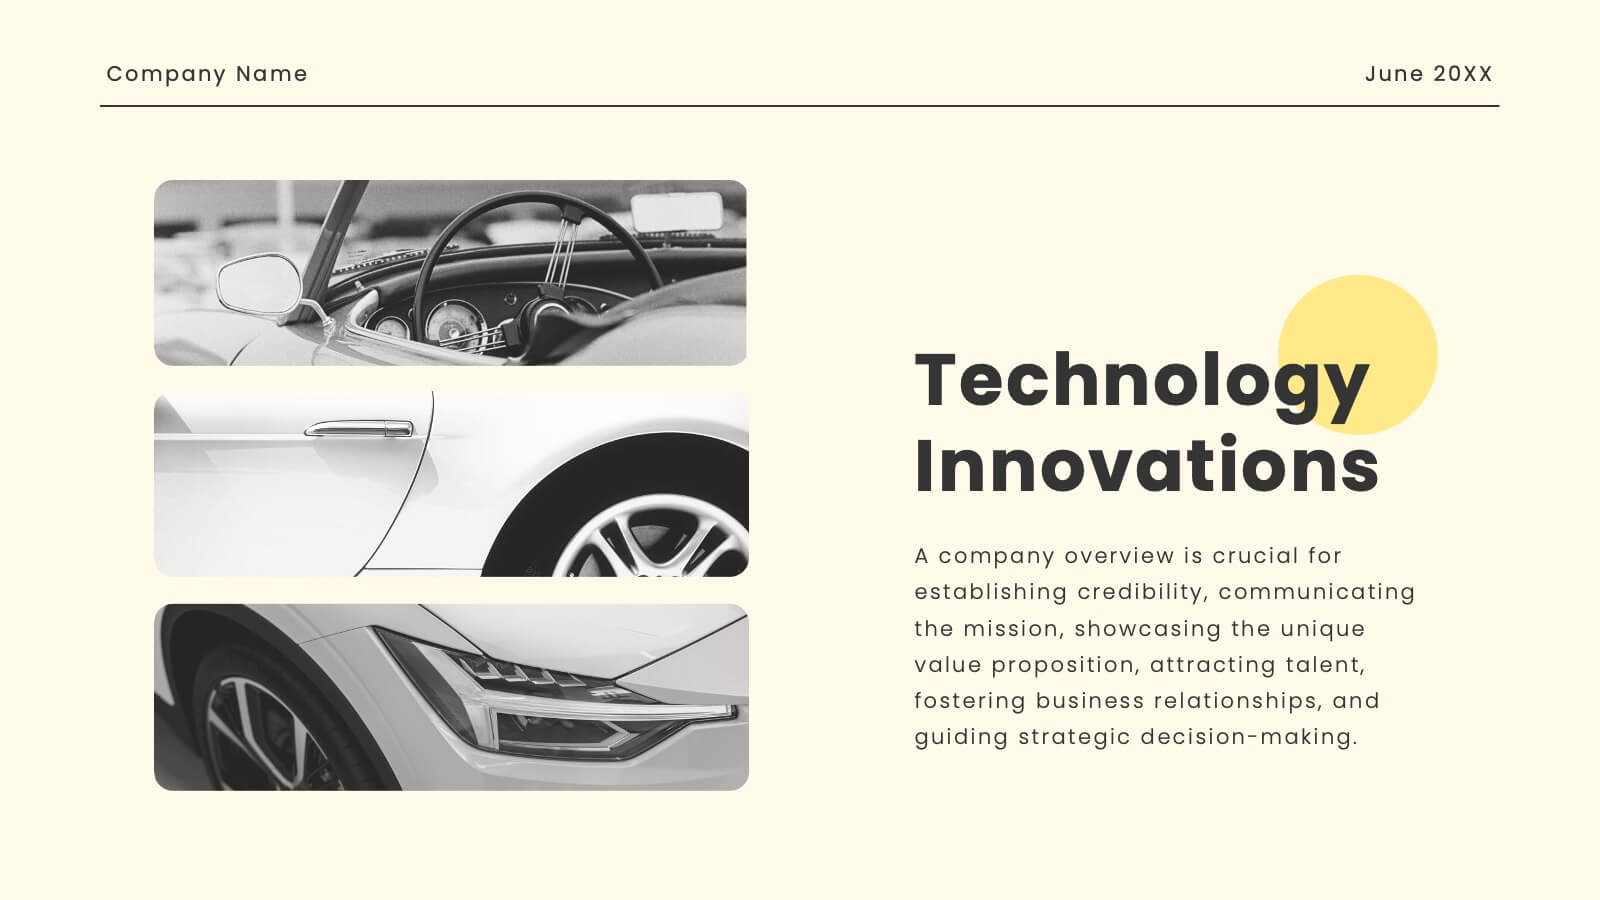
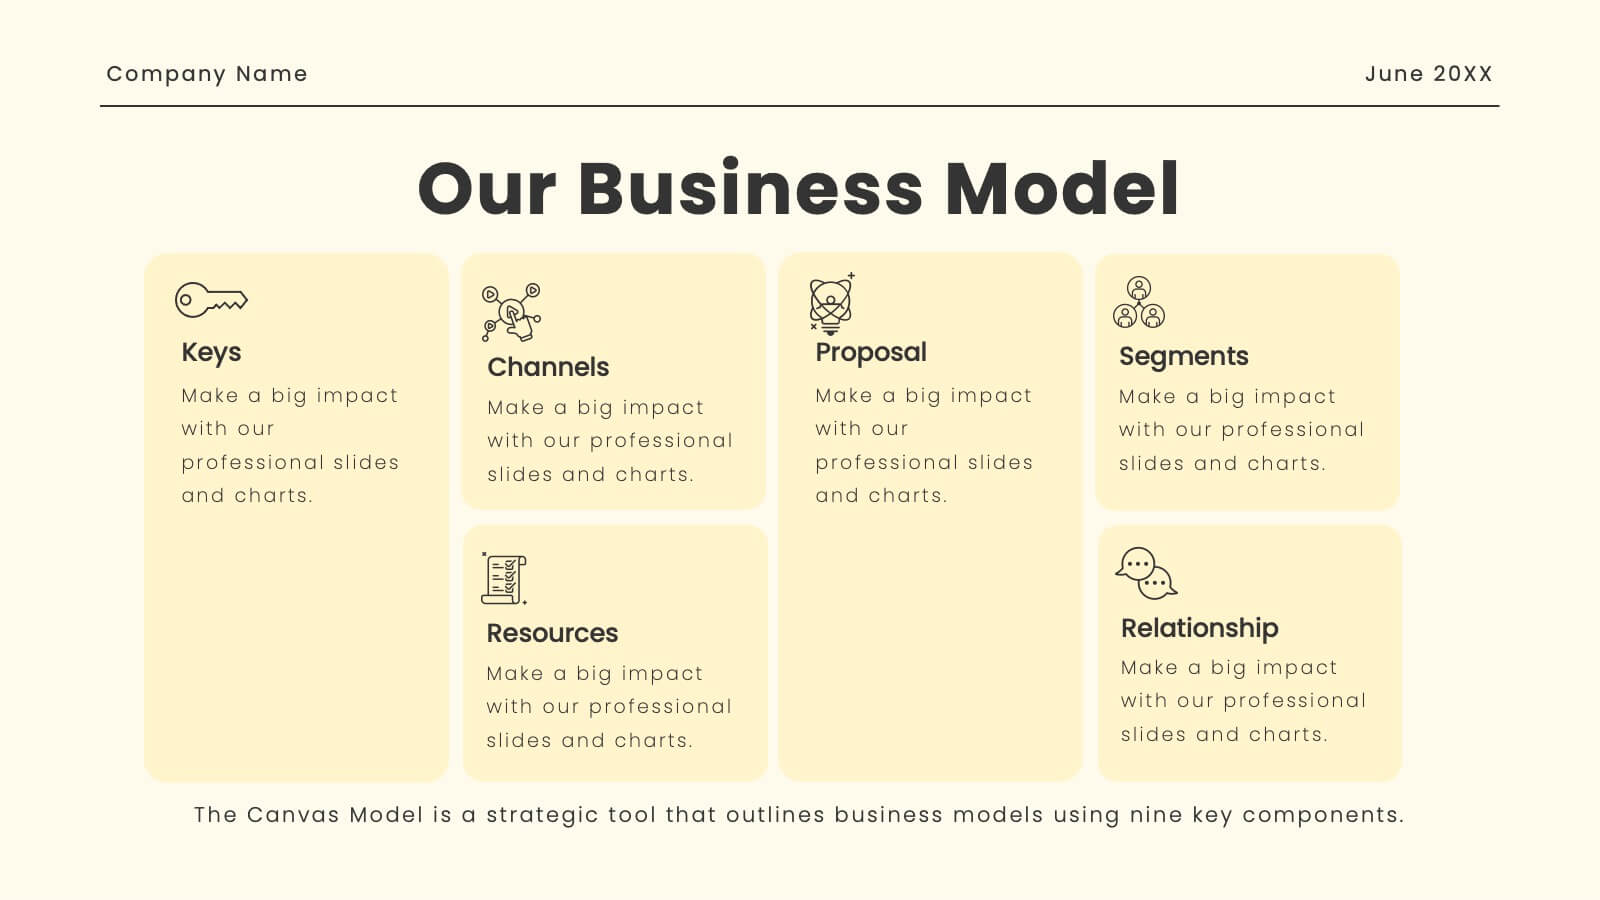
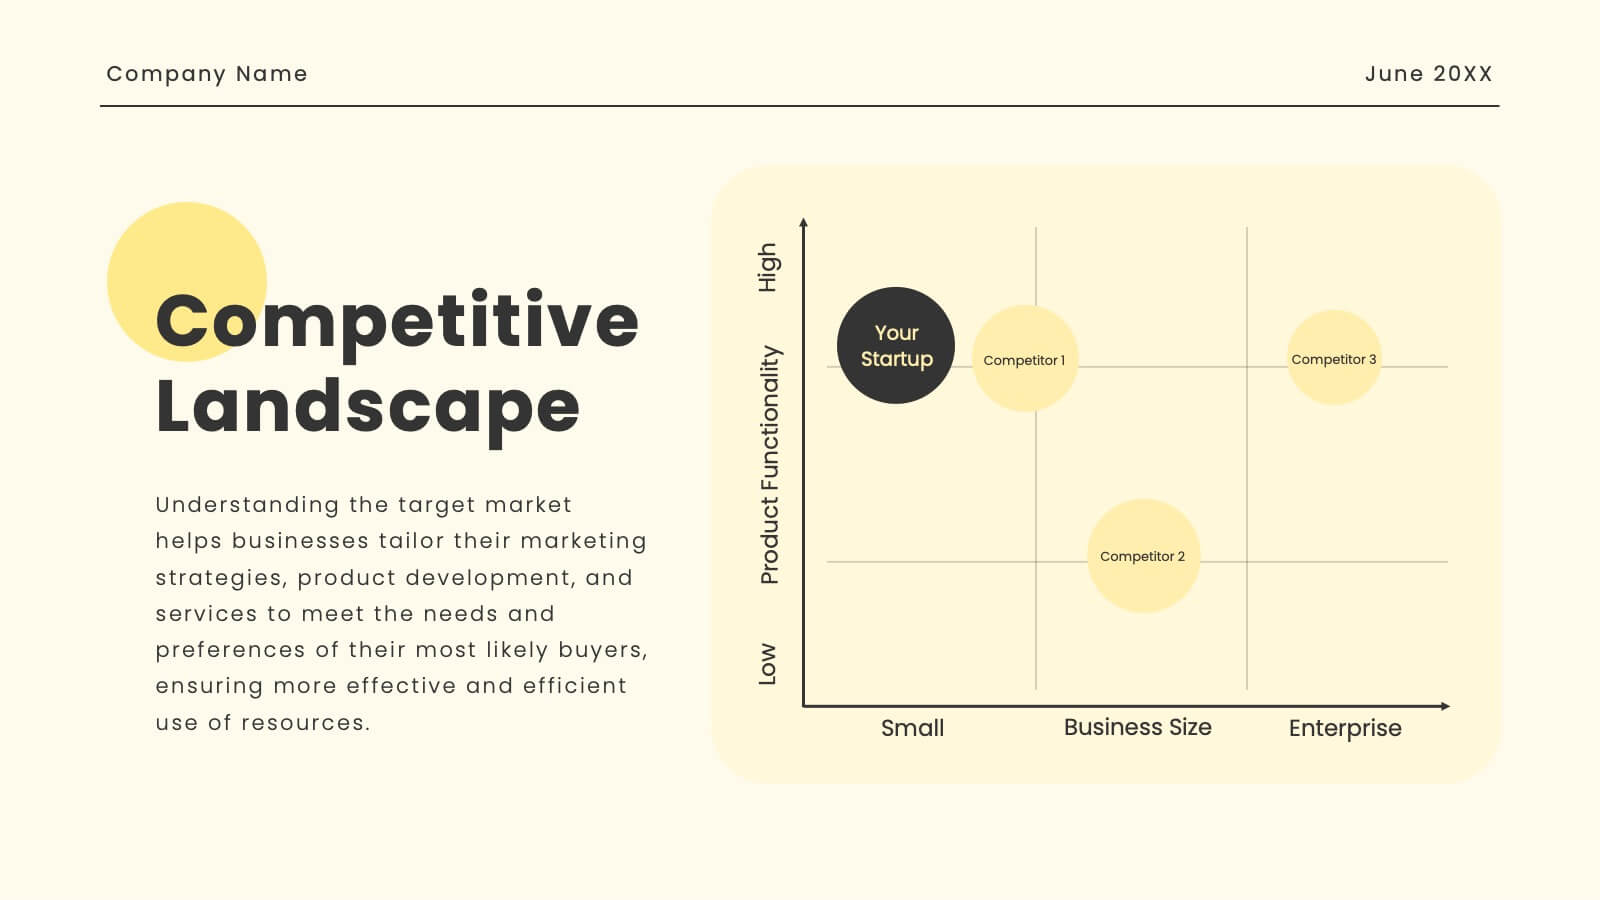
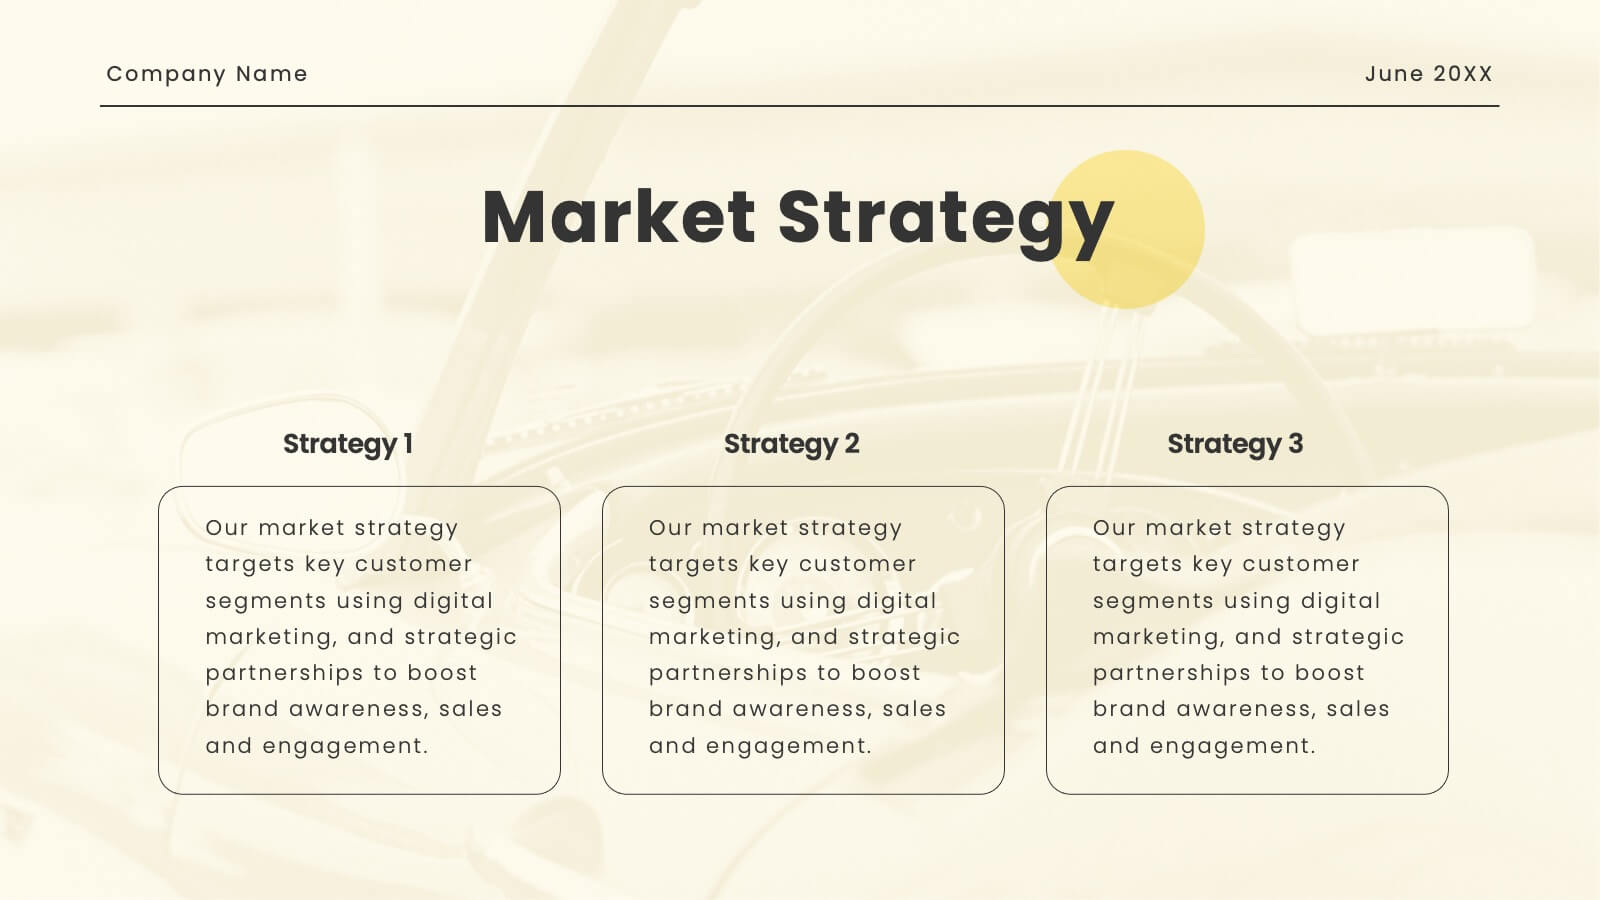
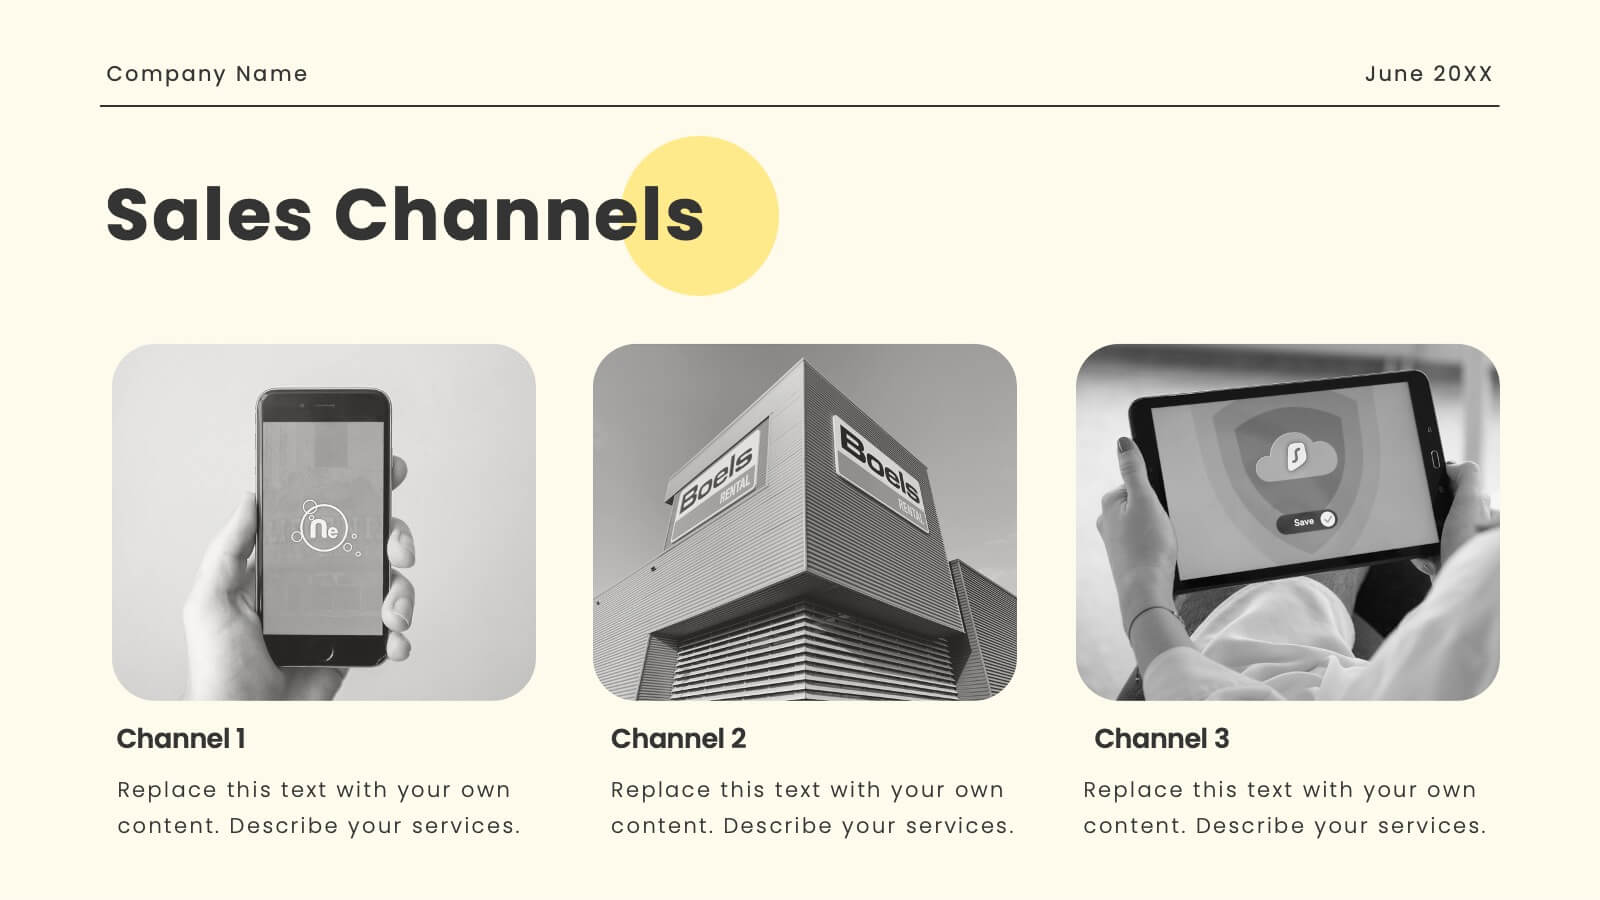
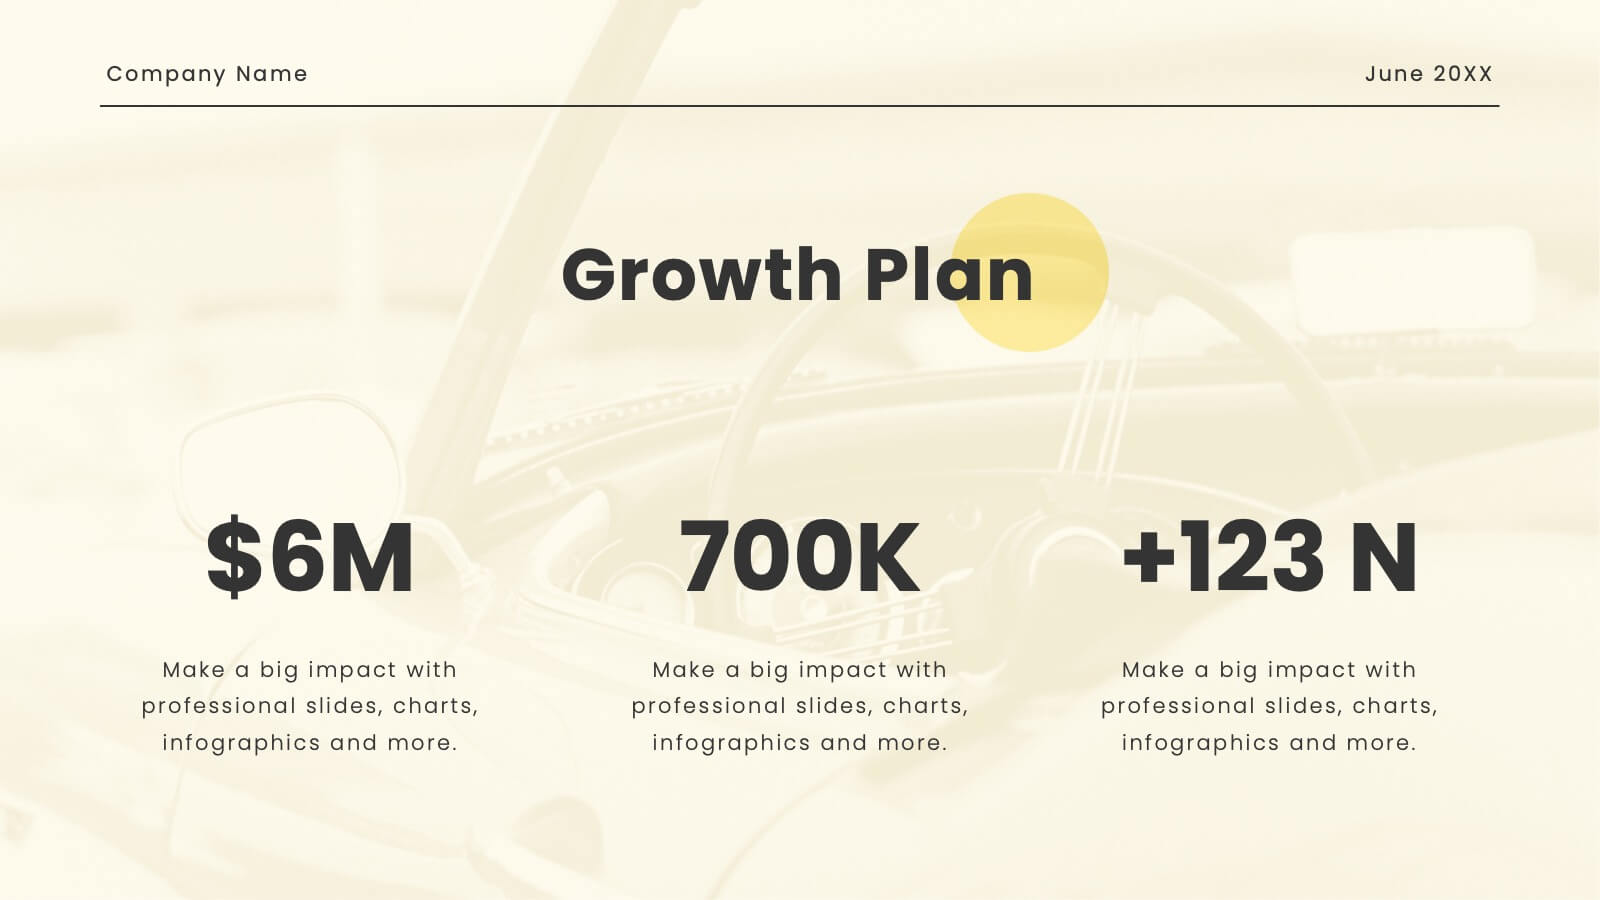
Oasis Startup Business Plan Presentation
Present your corporate business plan with confidence! This template includes sections for company overview, mission, vision, services, target market, and more. Showcase your market strategy, sales channels, growth plan, and financial overview. Perfect for conveying a professional and comprehensive business plan. Compatible with PowerPoint, Keynote, and Google Slides. Impress your audience today!


6 diapositivas
Sustainability Assets Management Infographic
Sustainability management refers to the strategic planning, implementation, and monitoring of practices that promote environmental, social, and economic sustainability within organizations. This infographic template visually presents key elements and strategies for managing sustainability assets within an organization. Visualize the process of identifying sustainability assets within an organization. This template will allow you to explain how each sustainability asset contributes to the organization's overall value proposition. Incorporate icons or graphics that align with the organization's mission and goals.


6 diapositivas
Value Delivery Framework Presentation
Turn your strategy into action with a clear, layered design that highlights how value flows through every stage of your process. Perfect for explaining organizational efficiency, performance models, or delivery systems. Fully editable and compatible with PowerPoint, Keynote, and Google Slides for easy, professional customization.


5 diapositivas
New Hire Employee Onboarding Flow Presentation
Make a lasting first impression with a clear, engaging flow that guides new hires through every step of their onboarding journey. Perfect for HR teams and managers, this presentation simplifies complex processes with visual structure and clarity. Fully compatible with PowerPoint, Keynote, and Google Slides for easy customization and use.


6 diapositivas
Business Network Diagram Presentation
Bring your digital ecosystem to life with this modern presentation design. Ideal for showcasing system connections, IT workflows, or organizational networks, it helps visualize how key components interact seamlessly. Clean, structured, and fully customizable—compatible with PowerPoint, Keynote, and Google Slides for a professional and cohesive presentation every time.


7 diapositivas
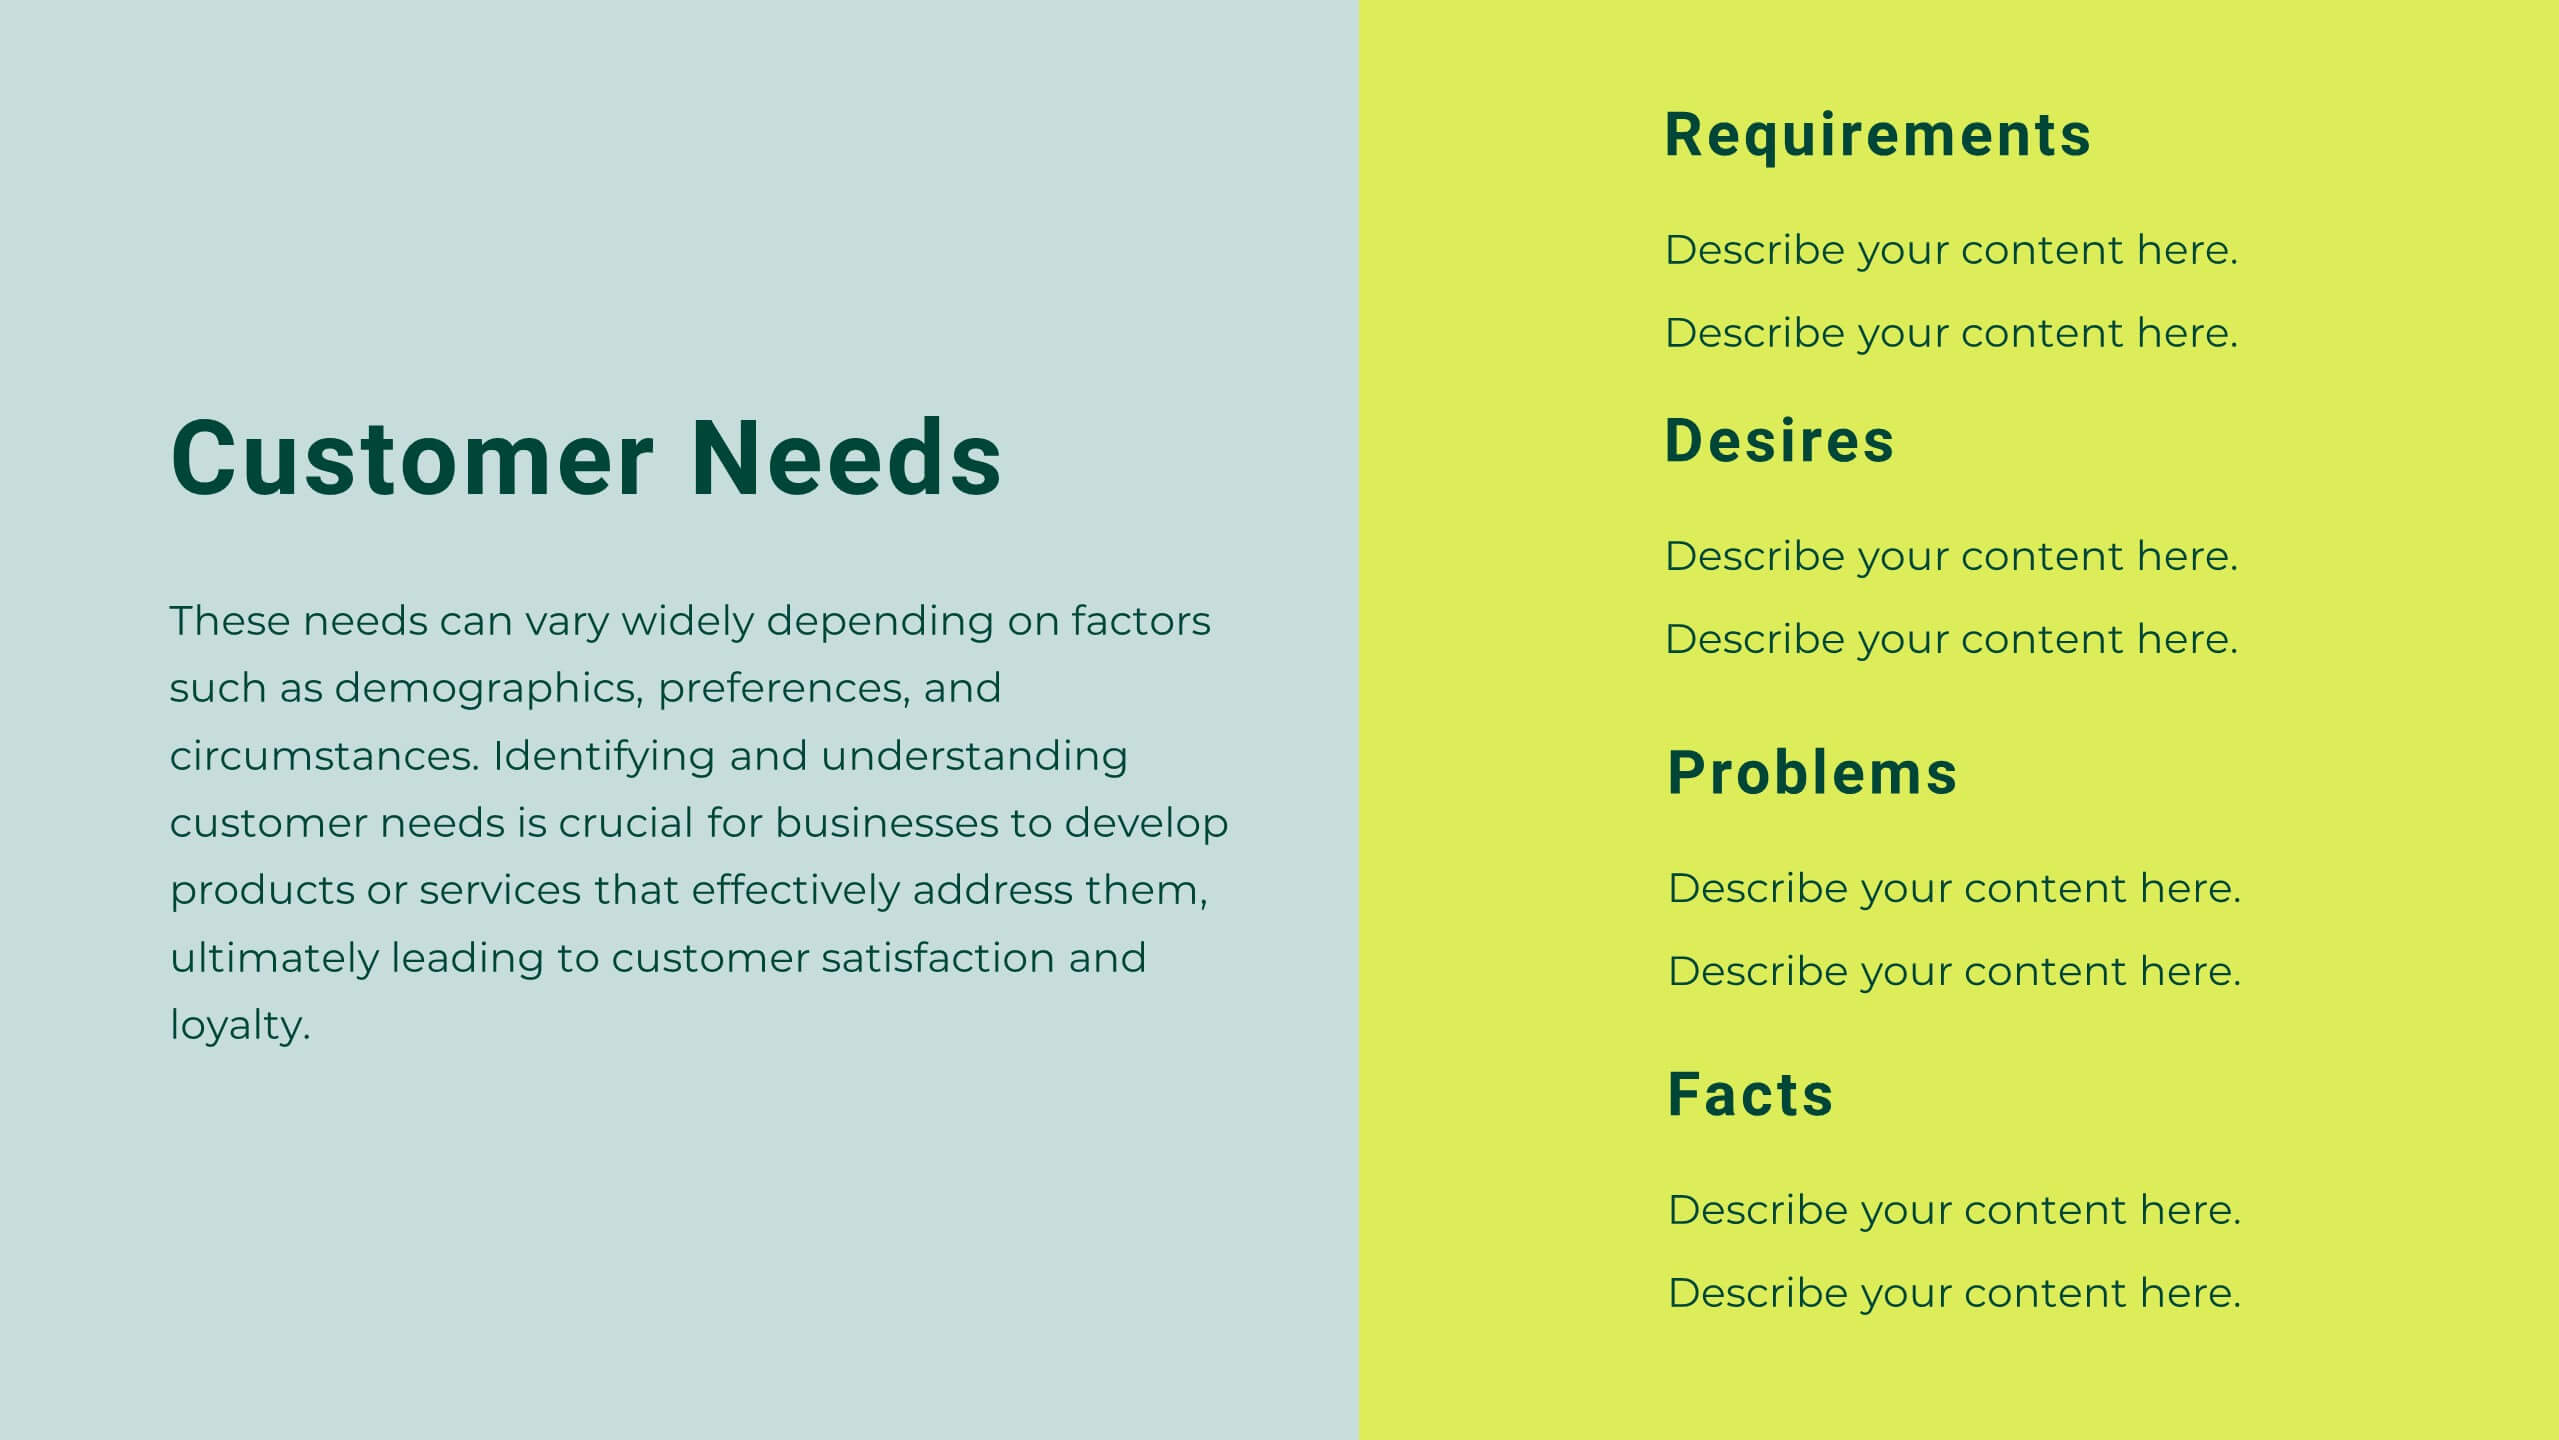
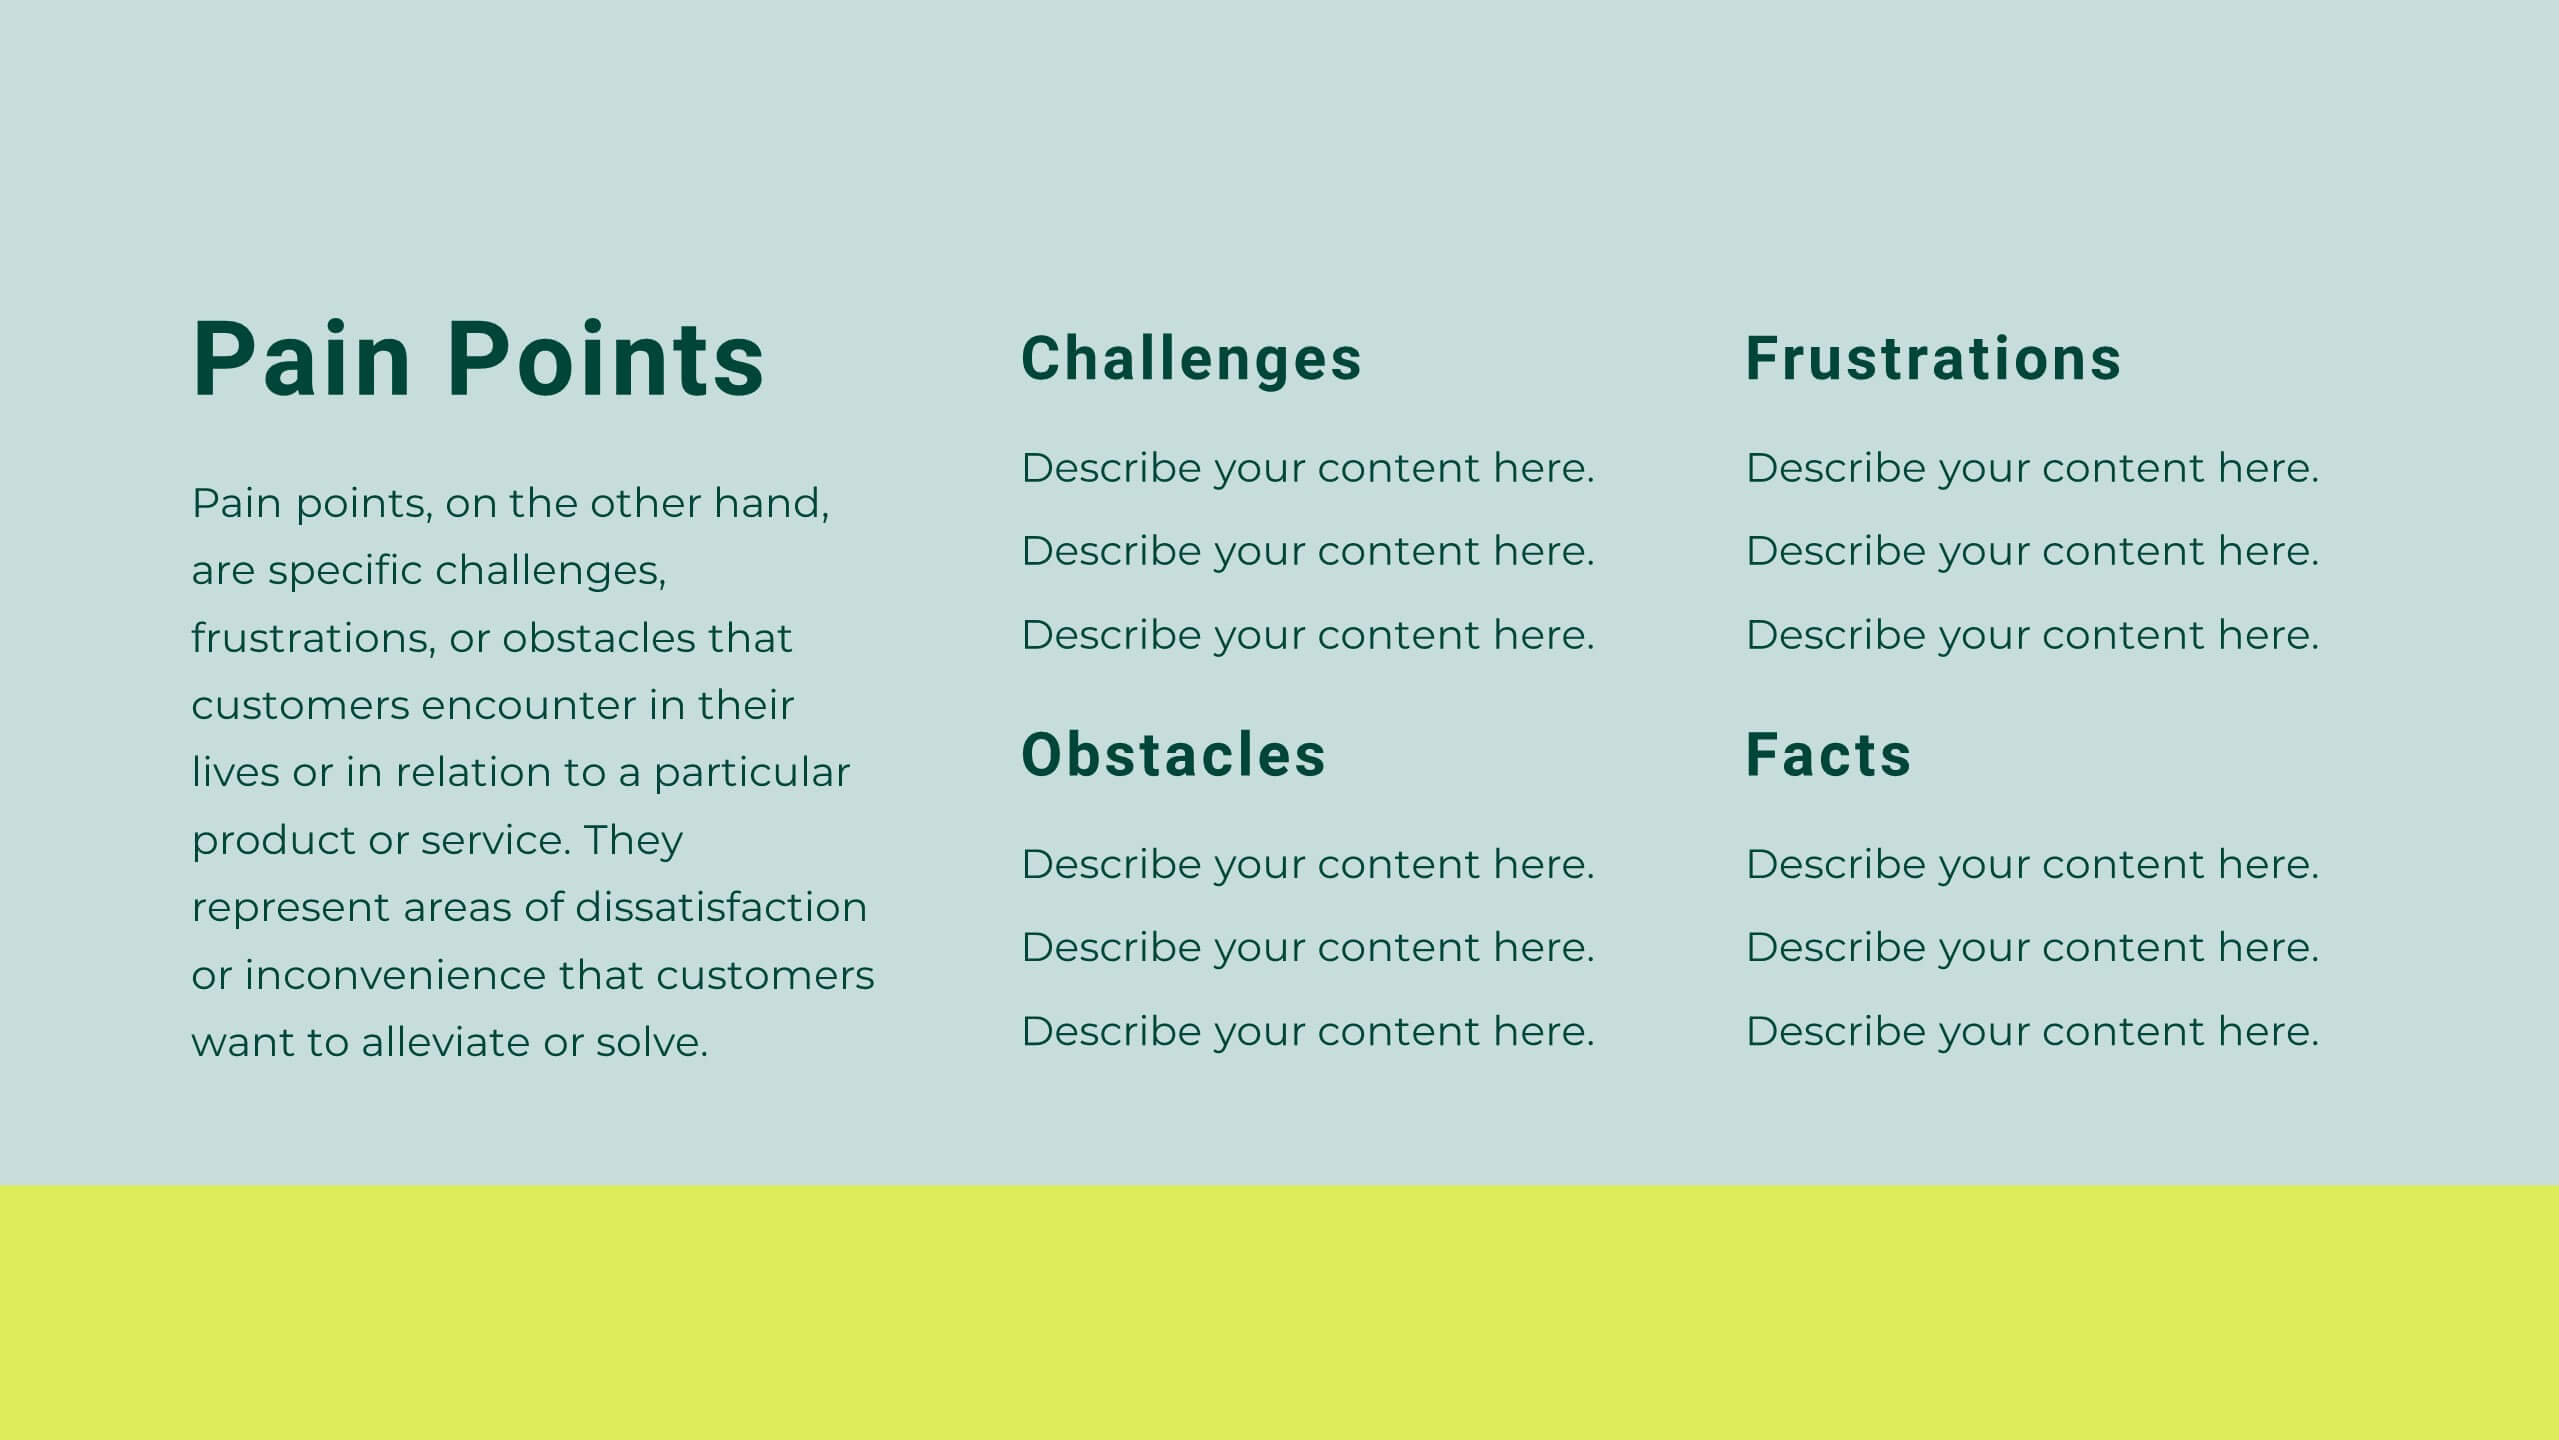
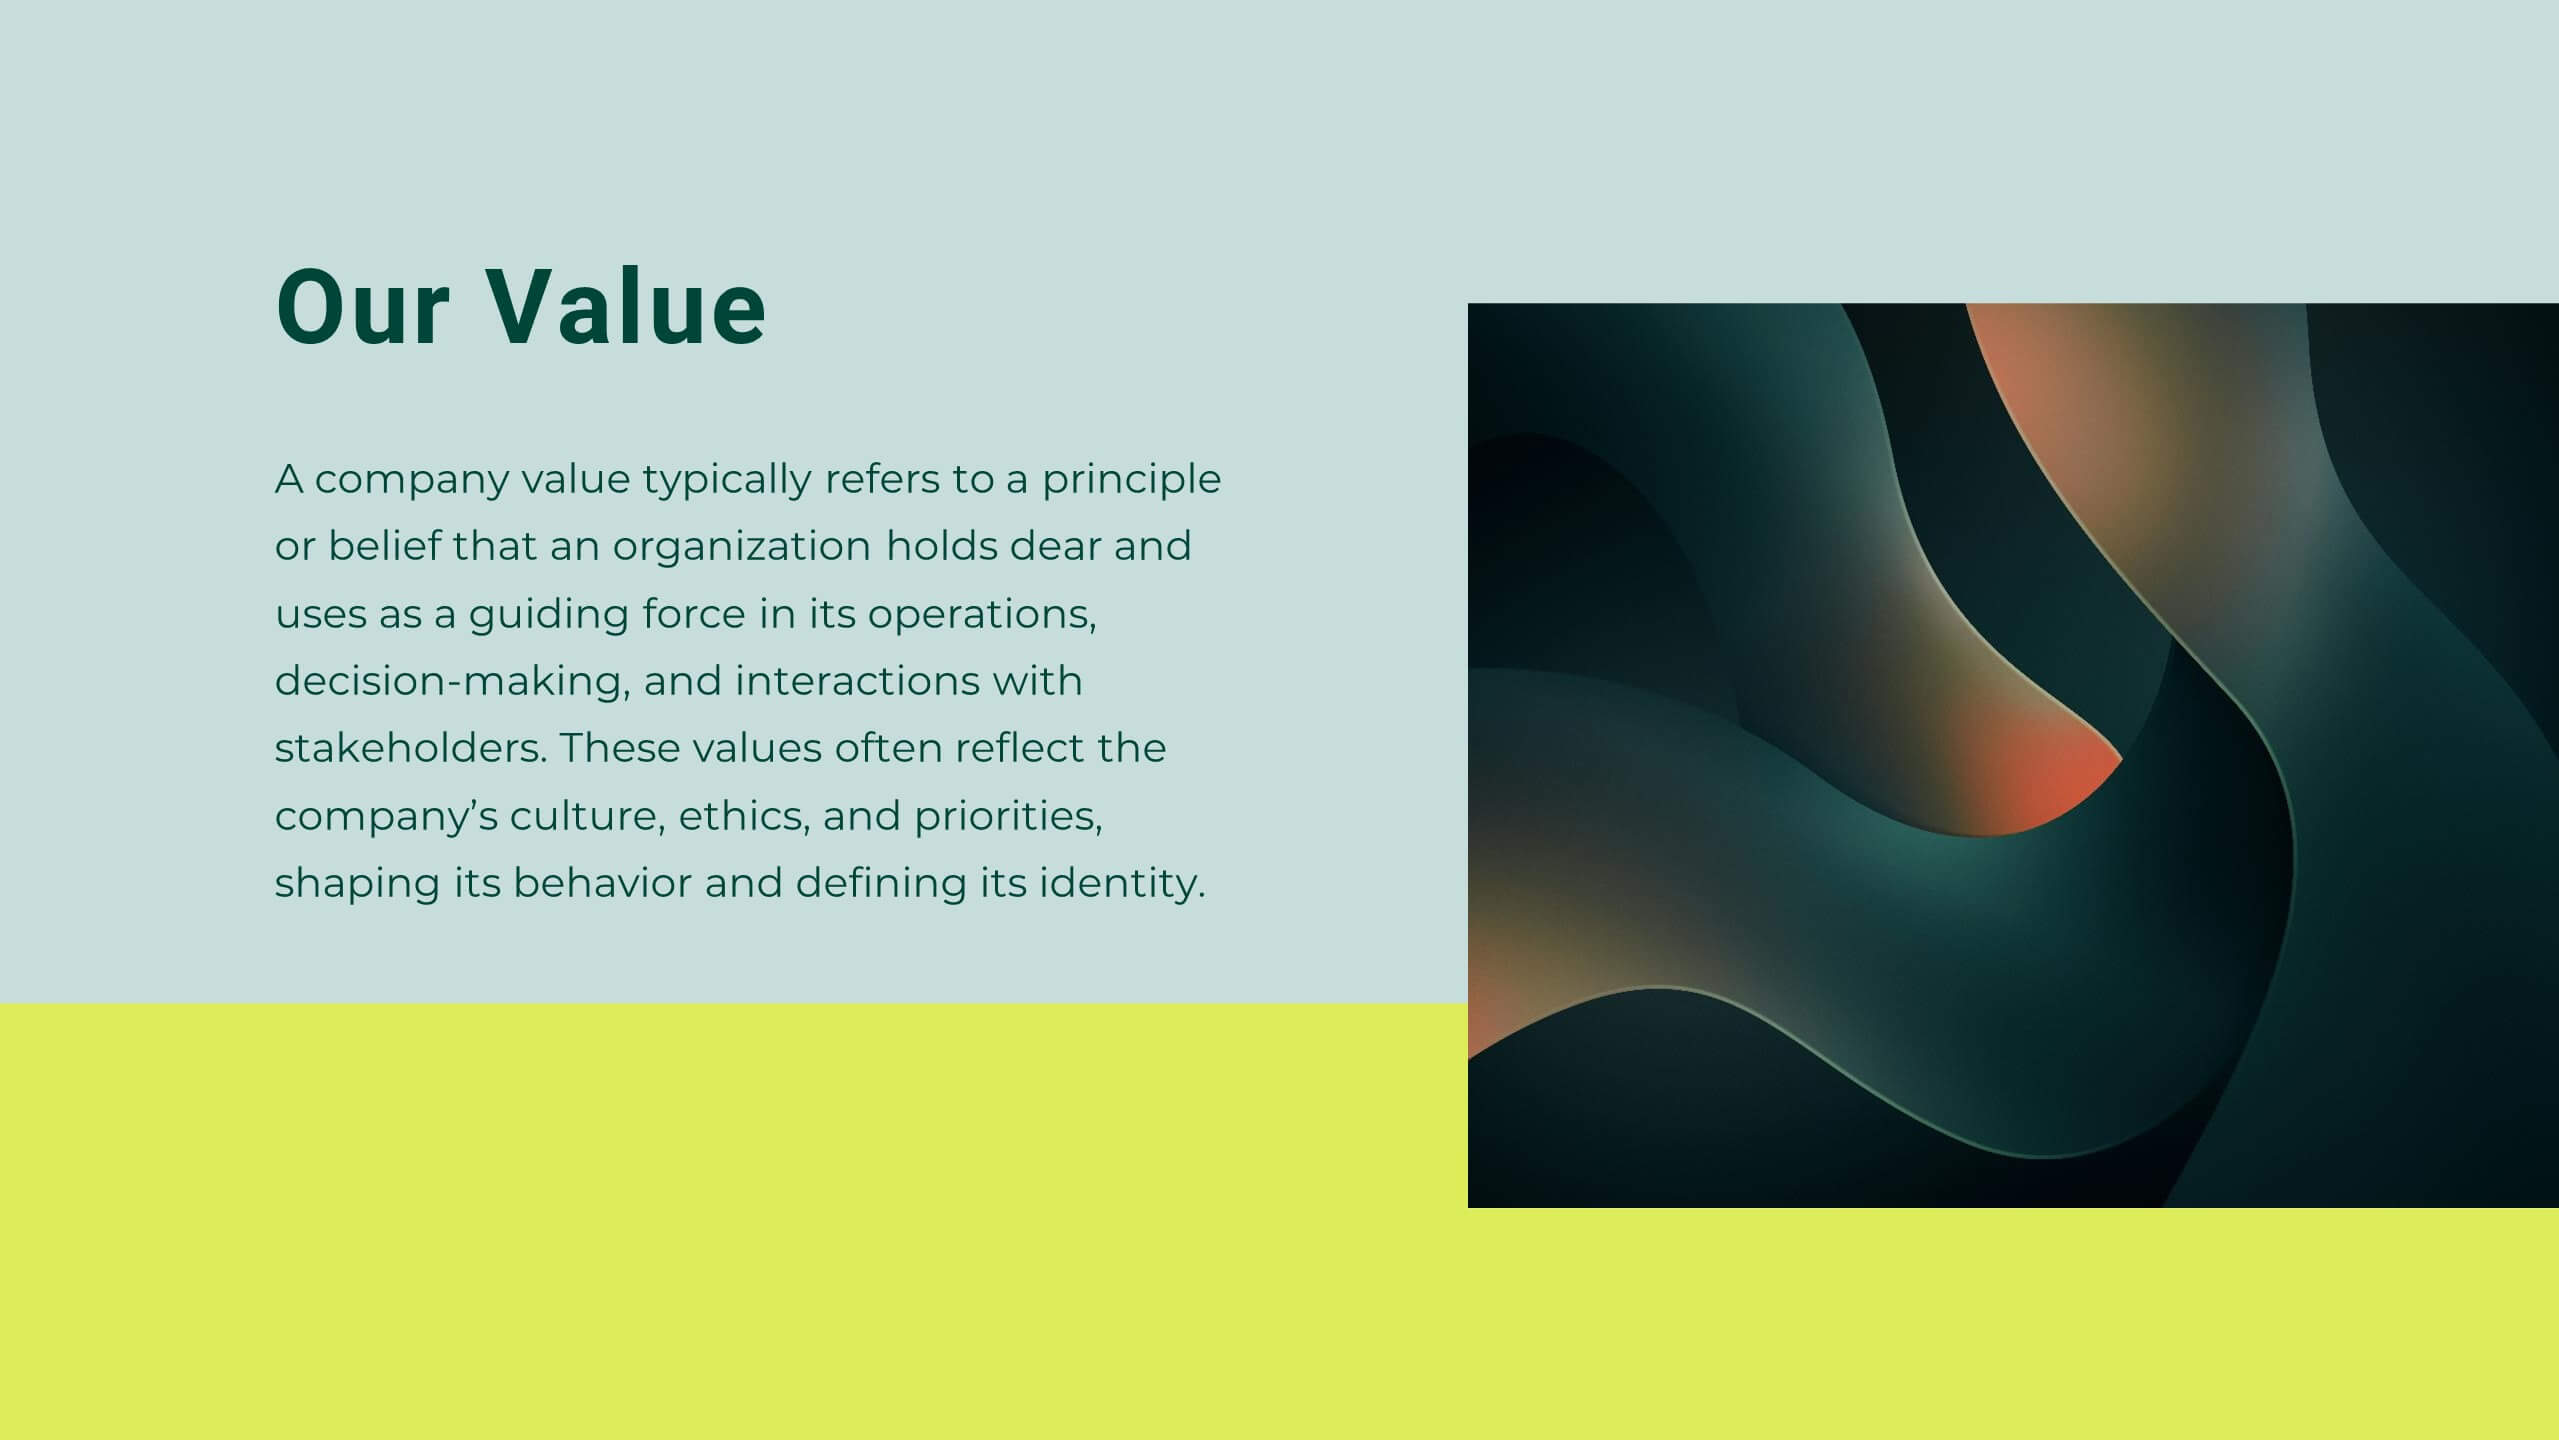
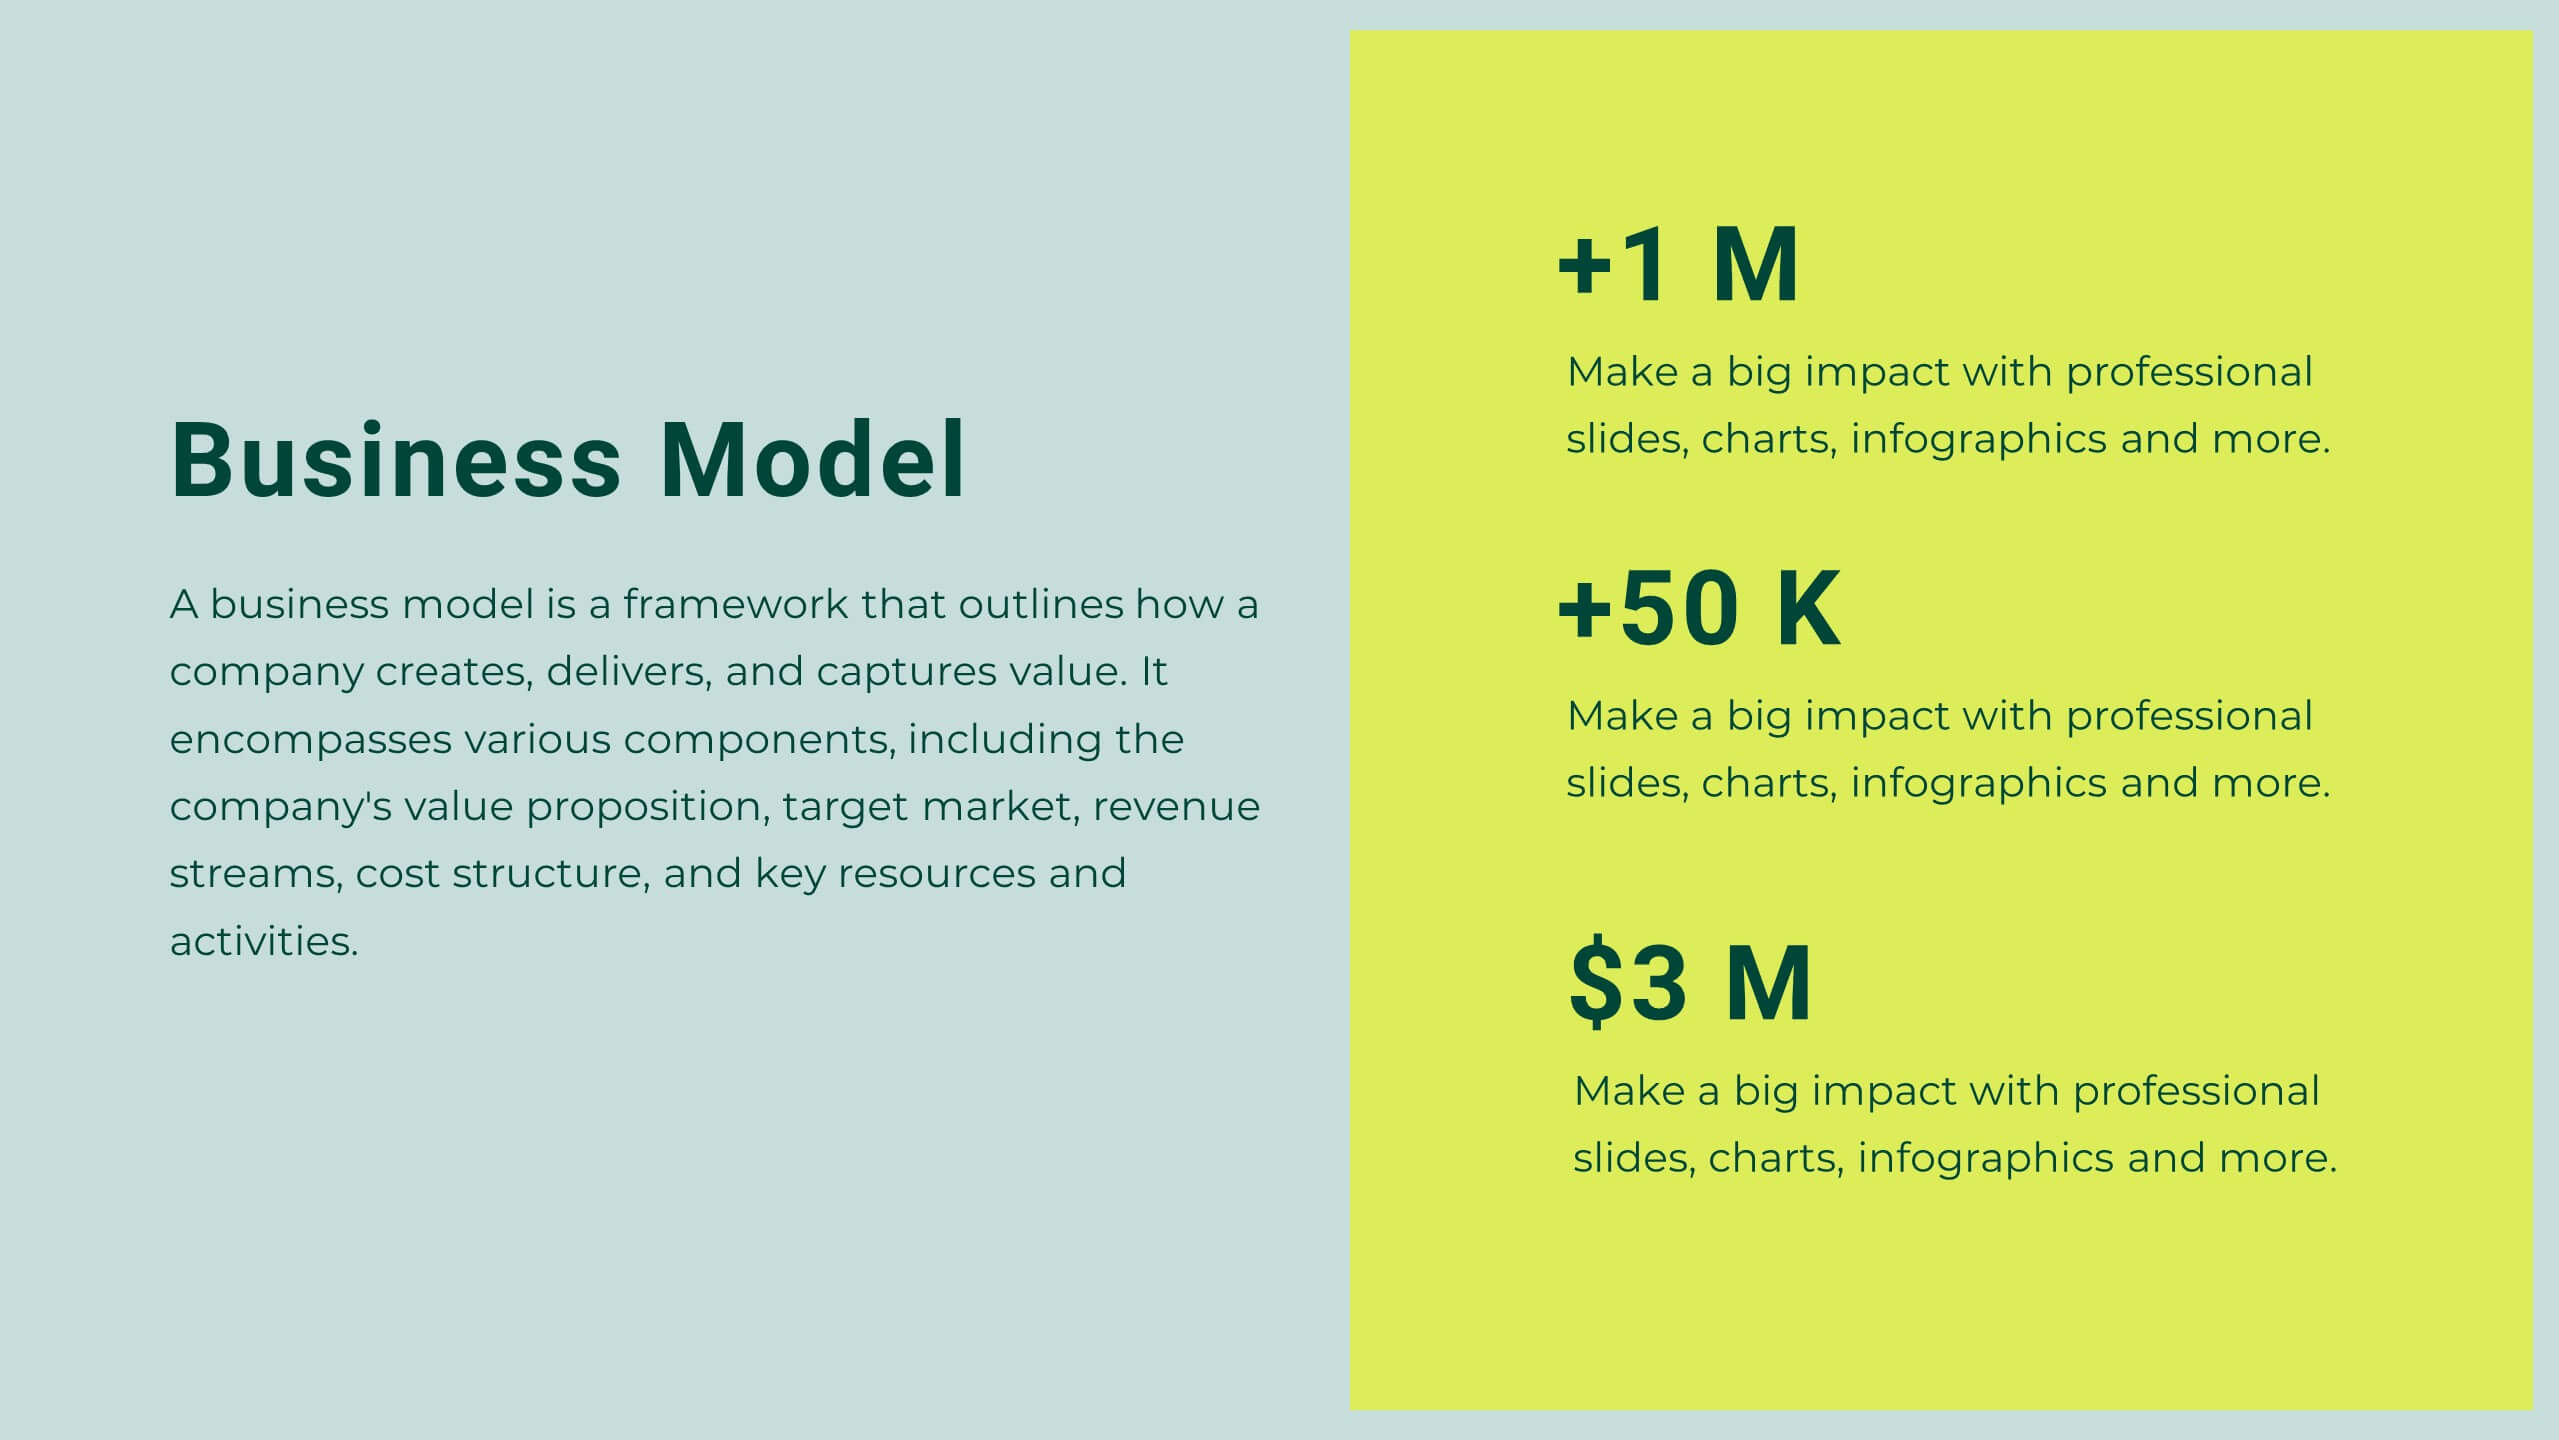
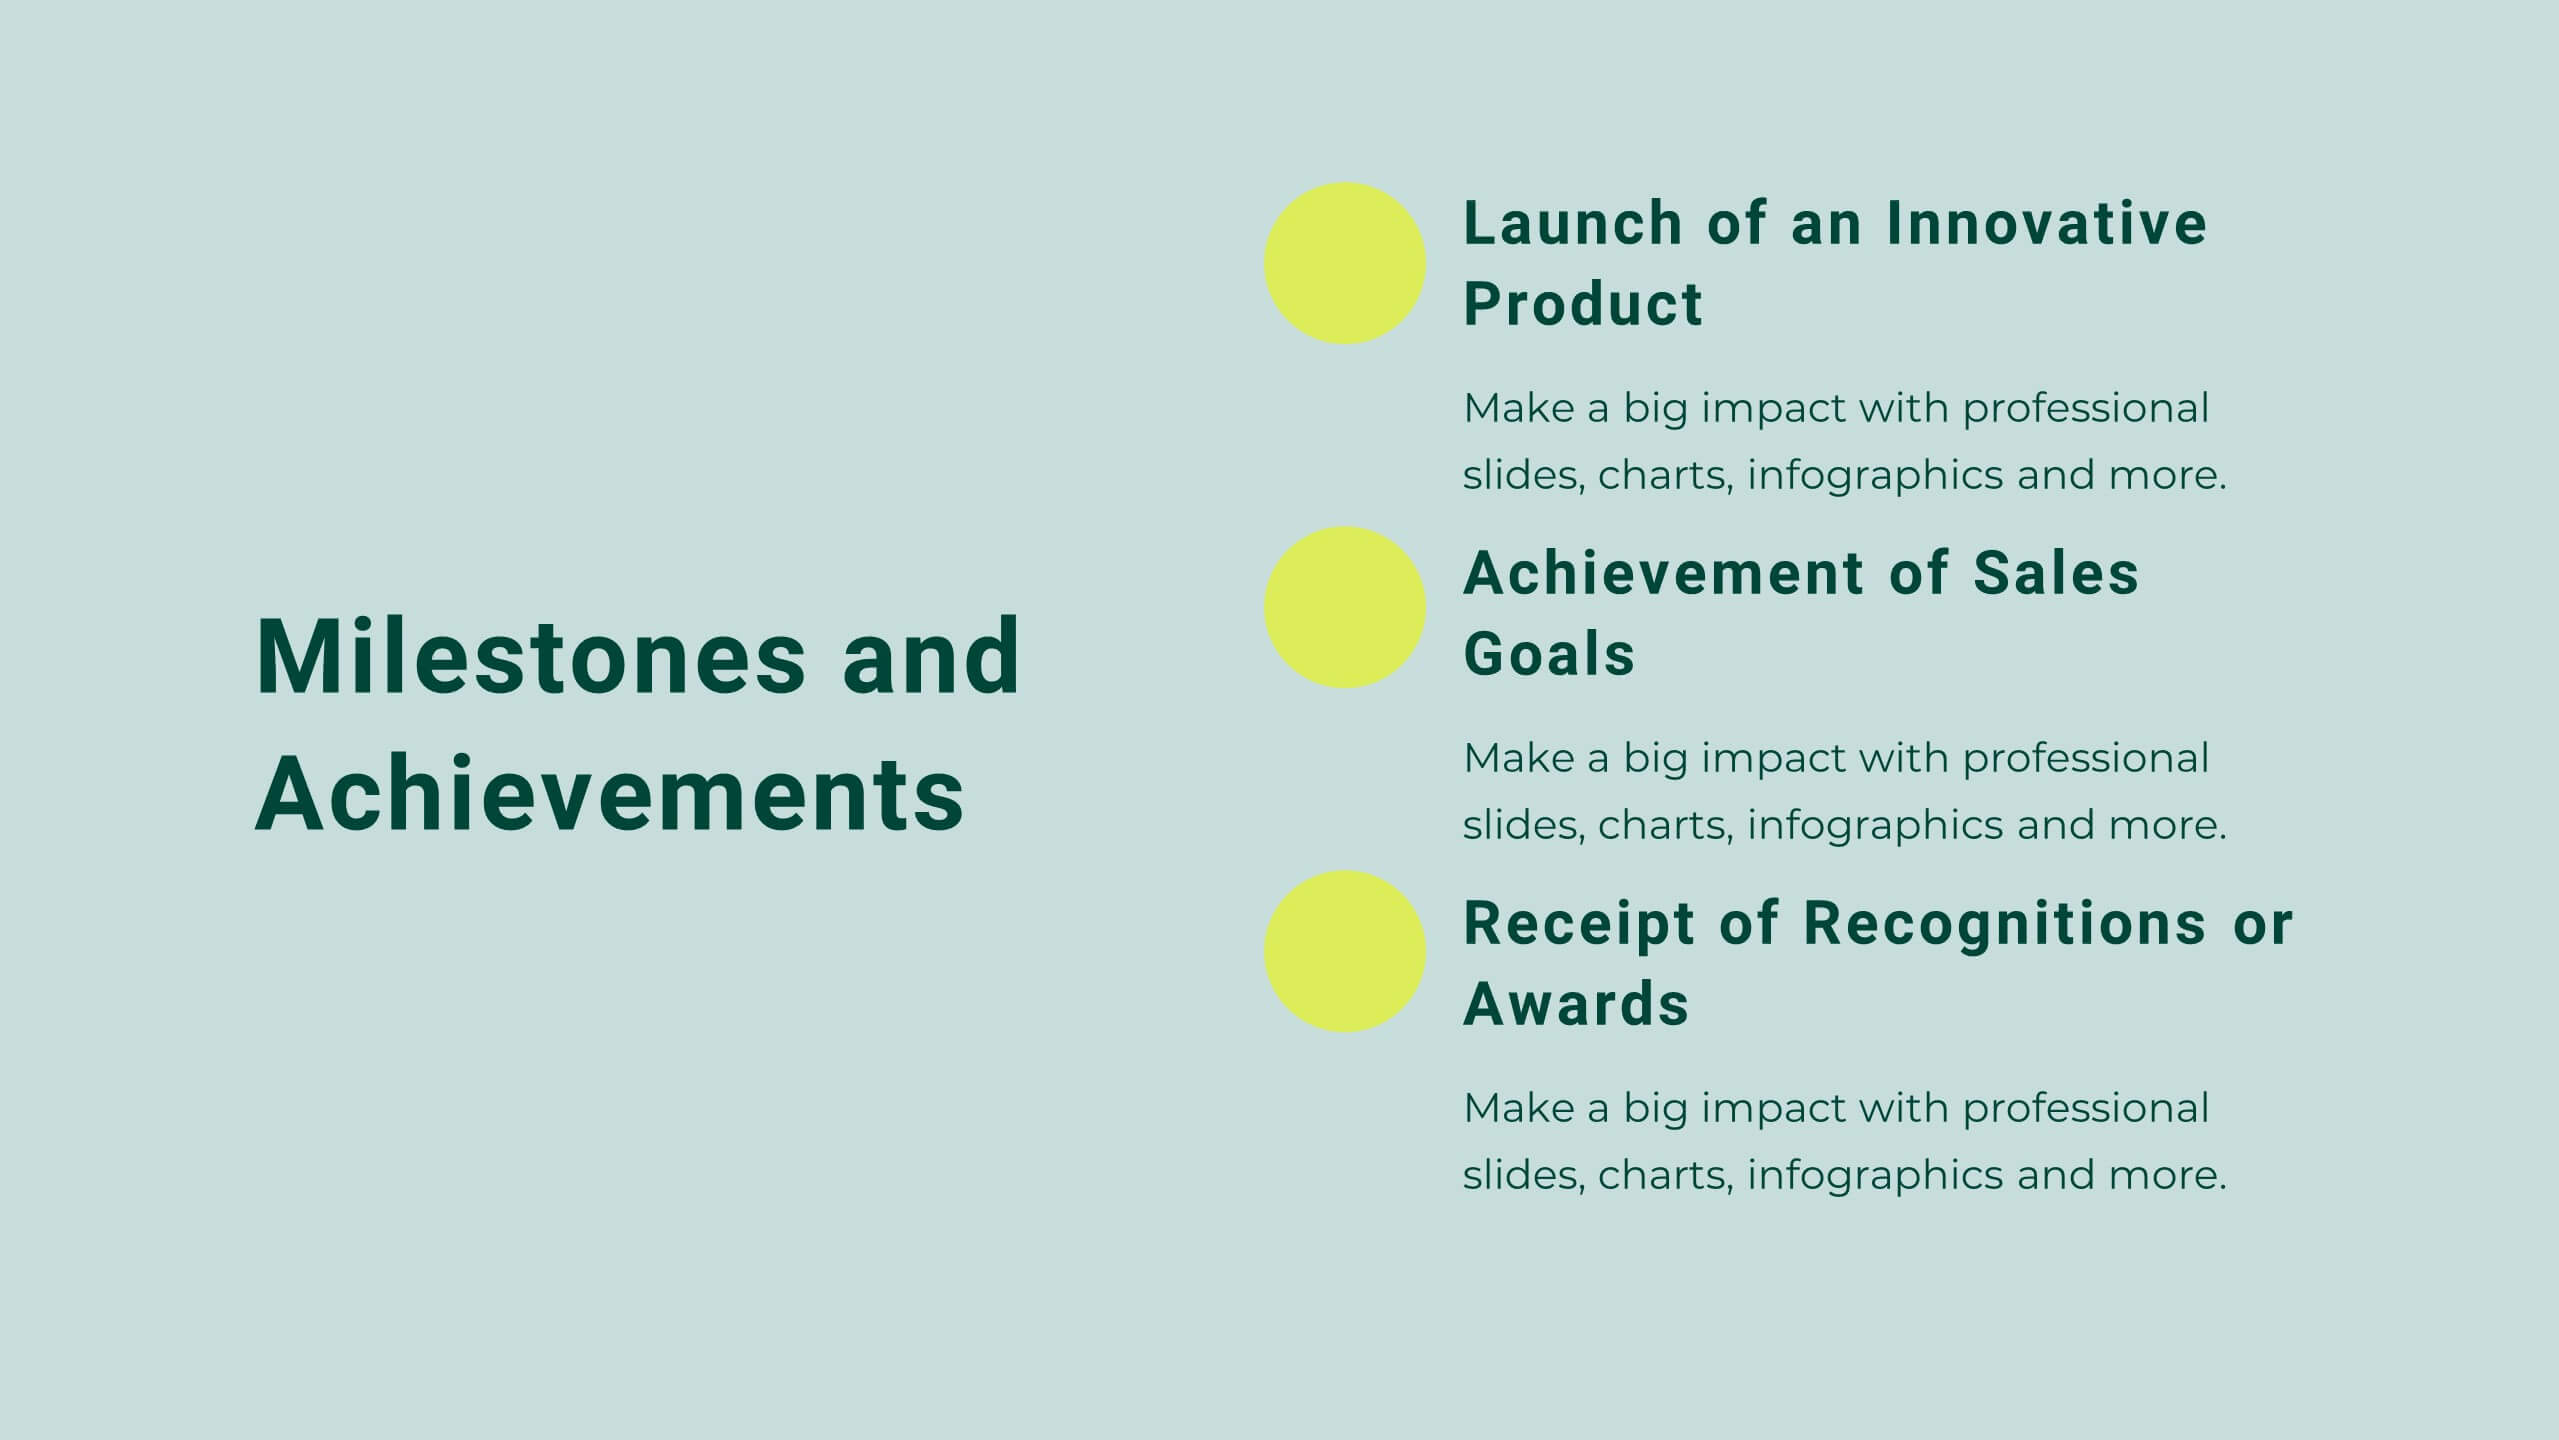
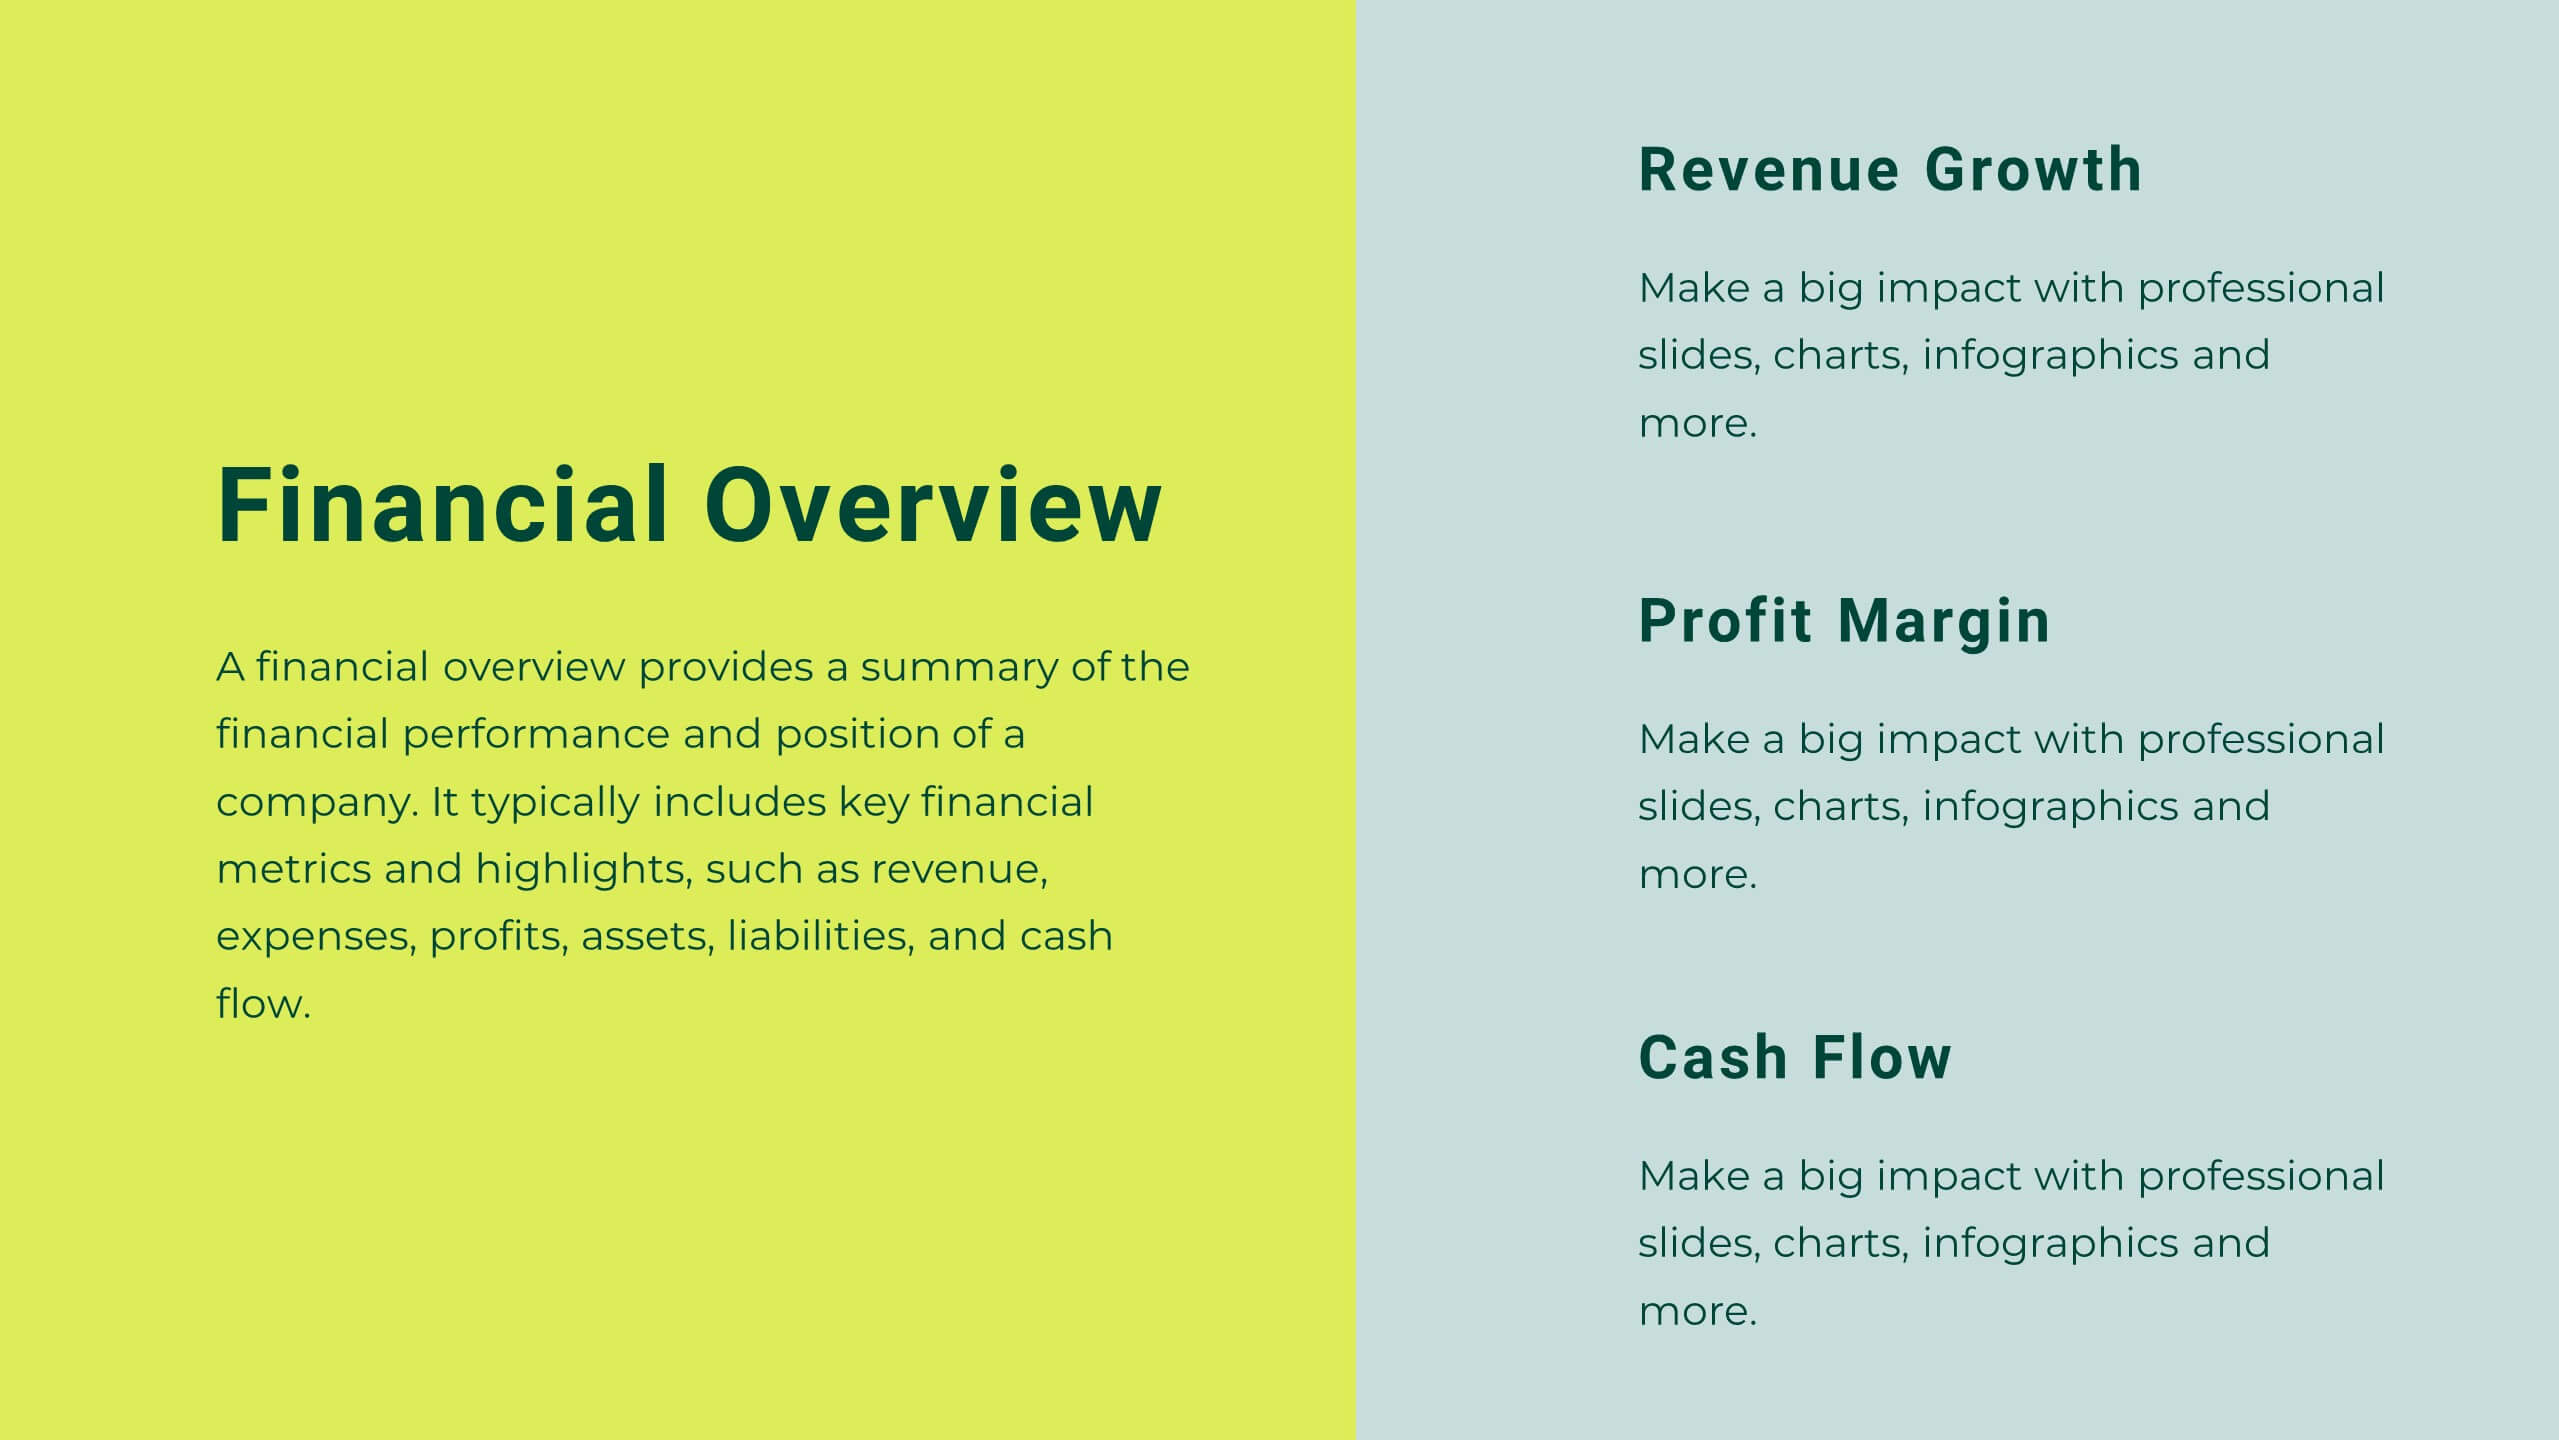
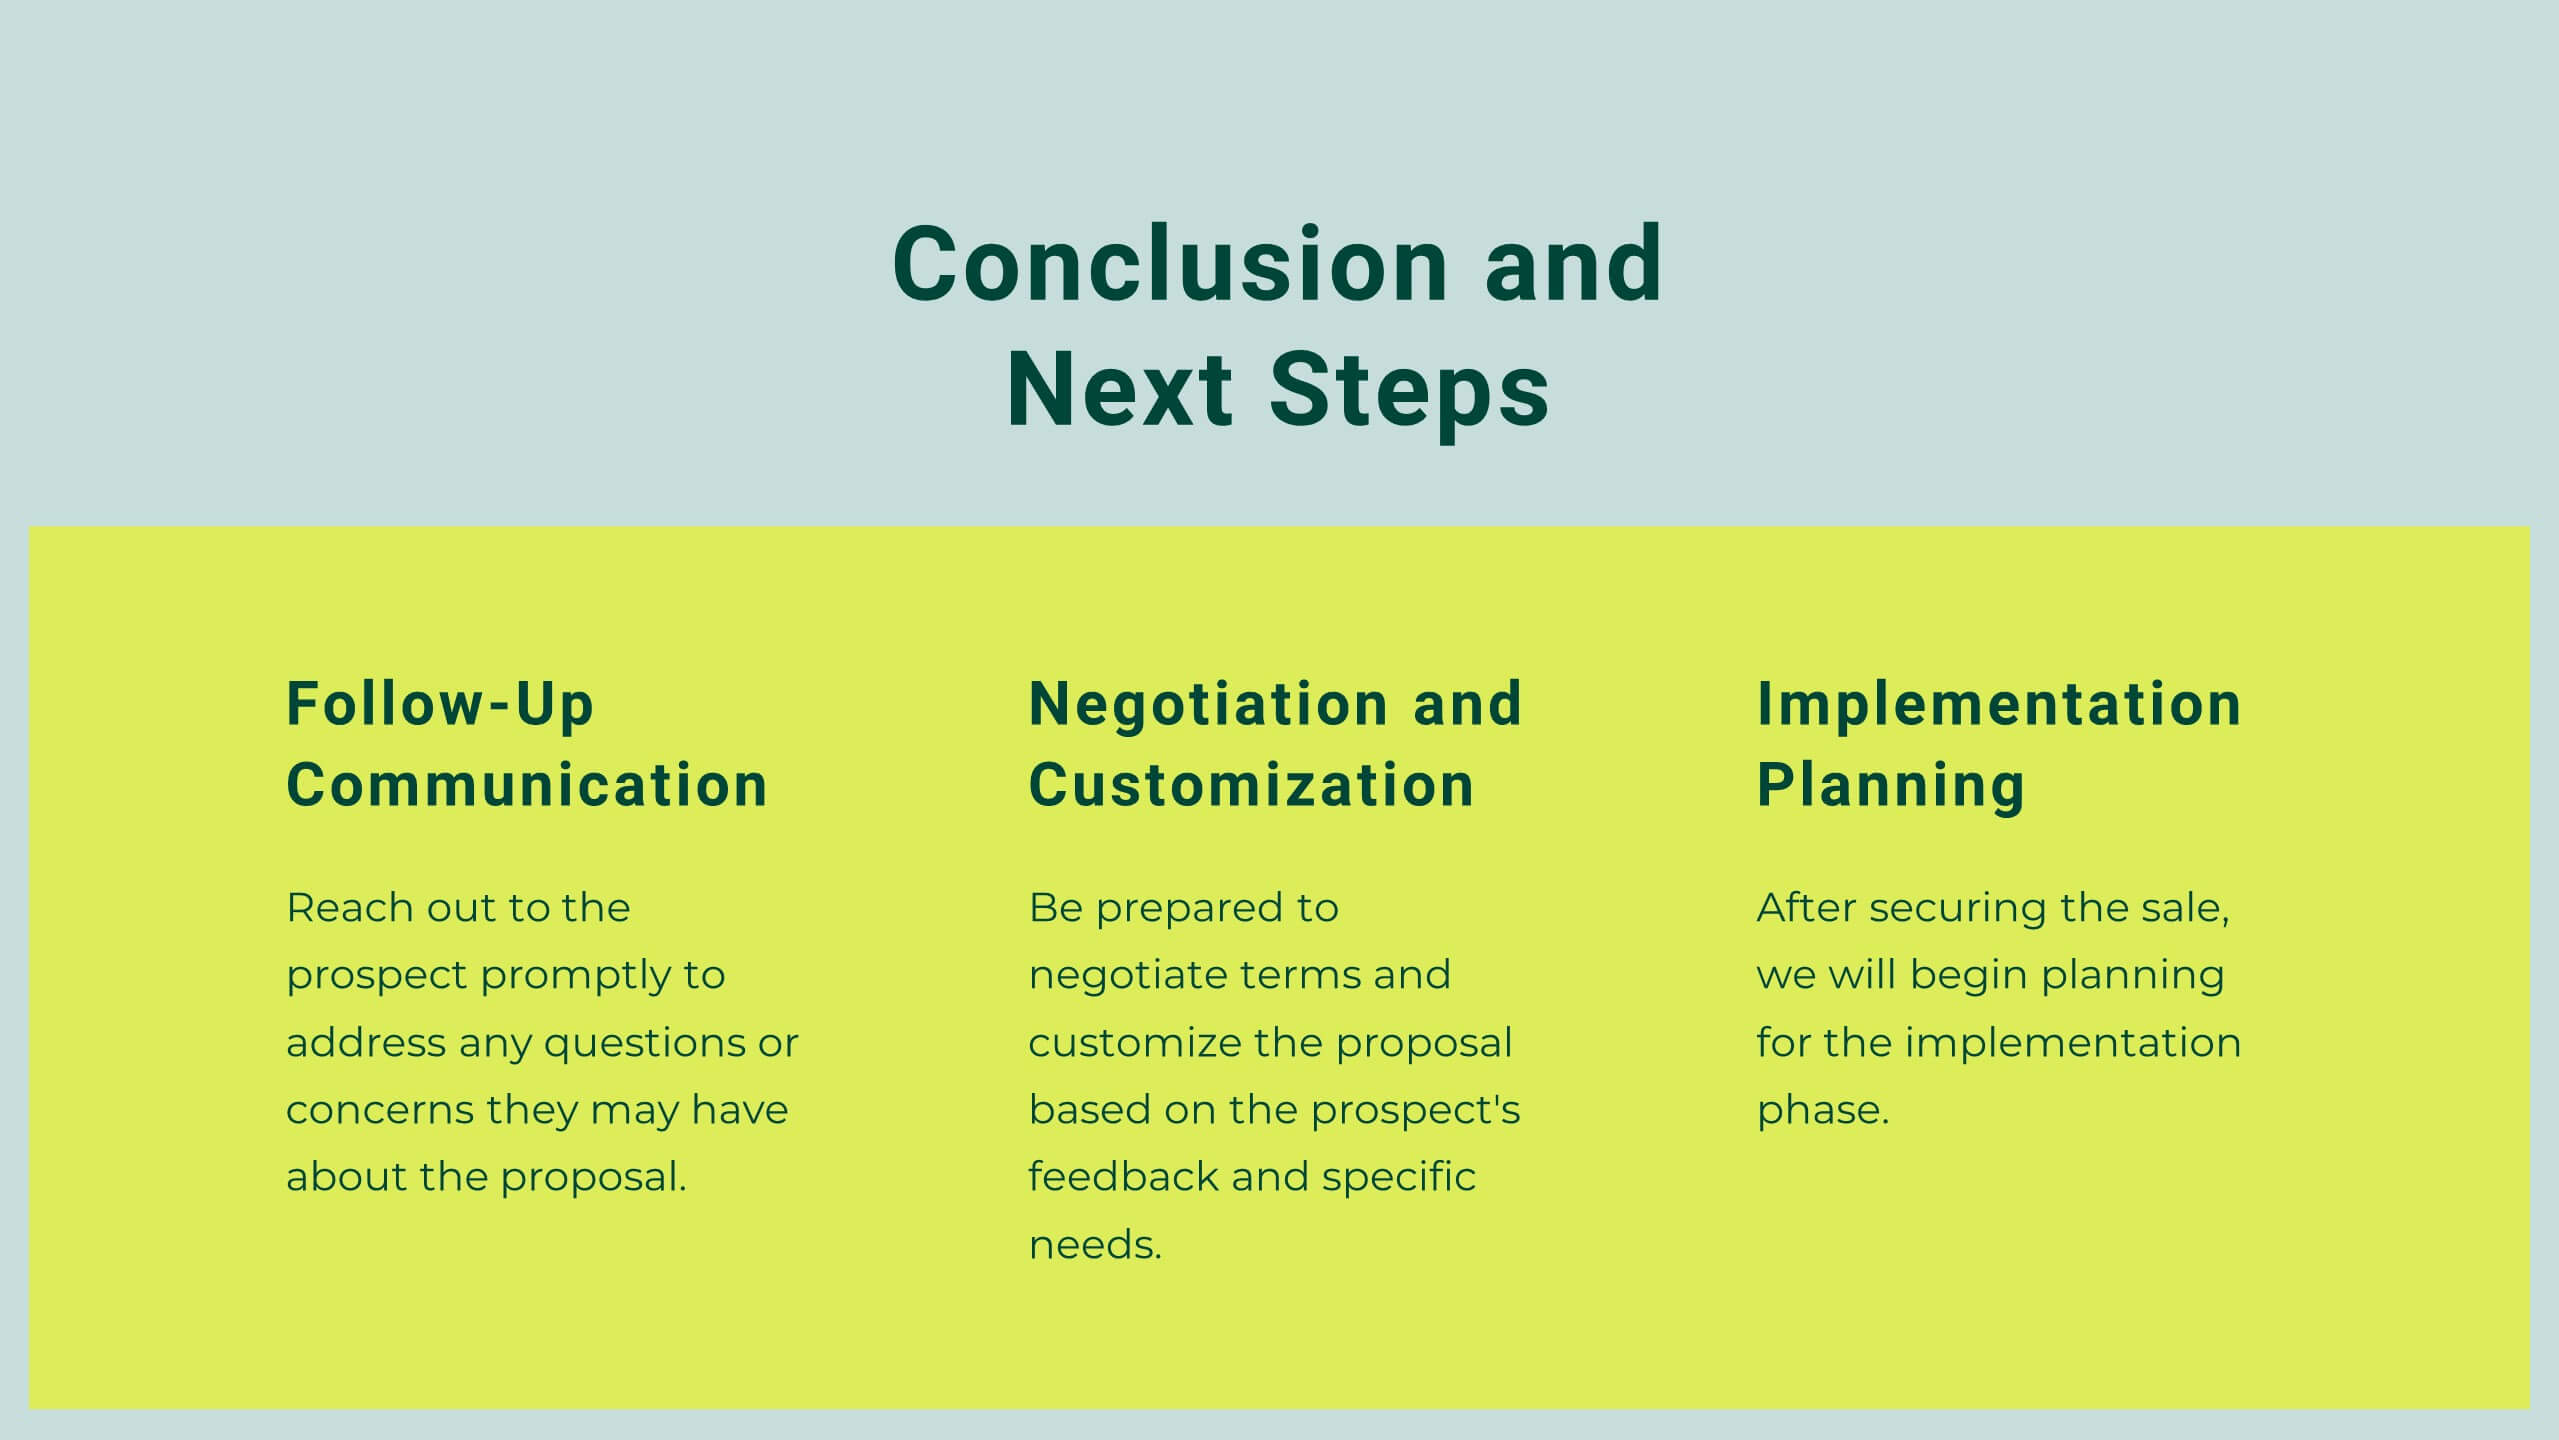
Summary Infographic
This collection of summary slides is expertly crafted to provide concise and clear overviews of complex information, making it ideal for concluding presentations, meetings, or reports. Each slide features a distinctive design with a strong focus on structure and readability, employing a balanced use of space and typography to highlight key points effectively. The slides utilize varied layouts, including bullet points, diagrams, and flowcharts, allowing for the presentation of summary data in a visually appealing and easily digestible format. These elements are crucial for summarizing the results of discussions, outlining project statuses, or presenting conclusions and next steps in a professional setting. Color coding and iconography are strategically used to categorize information and emphasize important metrics or conclusions, aiding in quick comprehension. This set is invaluable for professionals looking to present executive summaries, project outcomes, or strategic recommendations clearly and effectively, ensuring audiences grasp the essential takeaways without getting lost in details.


4 diapositivas
Funding and Investment Project Proposal Presentation
Unlock the potential of your next big venture with this vibrant and organized infographic presentation template! Perfect for outlining key stages from research to returns, this template makes complex investment strategies accessible and engaging. Tailor each segment to fit your project's unique needs. Compatible with PowerPoint, Keynote, and Google Slides, it's ideal for professionals looking to impress stakeholders and secure funding.


7 diapositivas
Adventure Challenge Infographic
The Adventure Challenge is a concept or product designed to encourage individuals or groups to step out of their comfort zones and embrace new, exciting experiences. This infographic template is designed to spark your inner explorer and conquer new horizons. This infographic is your compass to discover, challenge, and triumph in the realm of adventure. Compatible with Powerpoint, Keynote, and Google Slides. Illustrate the metaphorical mountains you'll climb during your adventure journey. This infographic will showcase various checkpoints of your adventure, guiding you as you chart your course and achieve milestones.


5 diapositivas
Team Role Distribution Matrix Presentation
Clarify responsibilities and improve collaboration with the Team Role Distribution Matrix Presentation. This RACI-style slide helps visualize team accountability across multiple tasks, making it ideal for project management, cross-functional teams, or workflow planning. Each layout option includes clearly labeled roles and color-coded responsibilities: Responsible, Accountable, Consulted, and Informed. Fully editable in Canva, PowerPoint, Keynote, and Google Slides.