


Características


¿Tienes alguna pregunta?
Recomendar


6 diapositivas
Personal Goals Infographics
The "Personal Goals" infographic template is a highly motivational and visually engaging resource, crafted specifically for PowerPoint, Keynote, and Google Slides. This template is perfect for life coaches, educators, and individuals looking to visually articulate their personal objectives and action plans. This template adeptly encapsulates key facets of personal goal setting, including short-term and long-term objectives, milestones, and strategies for achievement. The design promotes a clear depiction of each goal, along with the steps and timelines necessary for success. This makes it an invaluable tool for personal development workshops, coaching sessions, or even individual self-reflection and planning. The aesthetic of the template is uplifting and focused, with a color scheme that inspires positivity and determination. This not only makes the presentation visually appealing but also resonates with the theme of personal growth and ambition. Whether used for motivational seminars, educational purposes, or personal planning, this template ensures that the journey towards personal goals is laid out in a visually stimulating, organized, and inspiring manner.


7 diapositivas
Schedule Infographics Presentation Template
Featuring our Schedule Infographic template, this is a great tool for business owners, students and others who need to create an impactful presentation. Using this template will ensure that your main point is emphasized and can be easily understood by all of your viewers. This template includes different colors and fonts that can be easily edited and changed. This will help you visualize your existing data and create a presentation that includes all of your points. Use this template to make a professional and smart looking schedule, and present your plan to others in an easy to understand way.


26 diapositivas
Maev Presentation Template
Maev is a perfect modern template with a clean and professional feel. Maev was designed by professionals to help businesses connect with their audience. This template has a modern, chic aesthetic and very detailed look which is extremely appealing. The colors are fresh which help keep the look clean and easy to read. The theme comes packed with features to target your audience and help you get your message across. Charts, timelines and easy to edit text, this template is perfect for businesses seeking to make an impression on their audience. by demonstrating they are transparent and reliable.


5 diapositivas
Product Marketing Slide Presentation
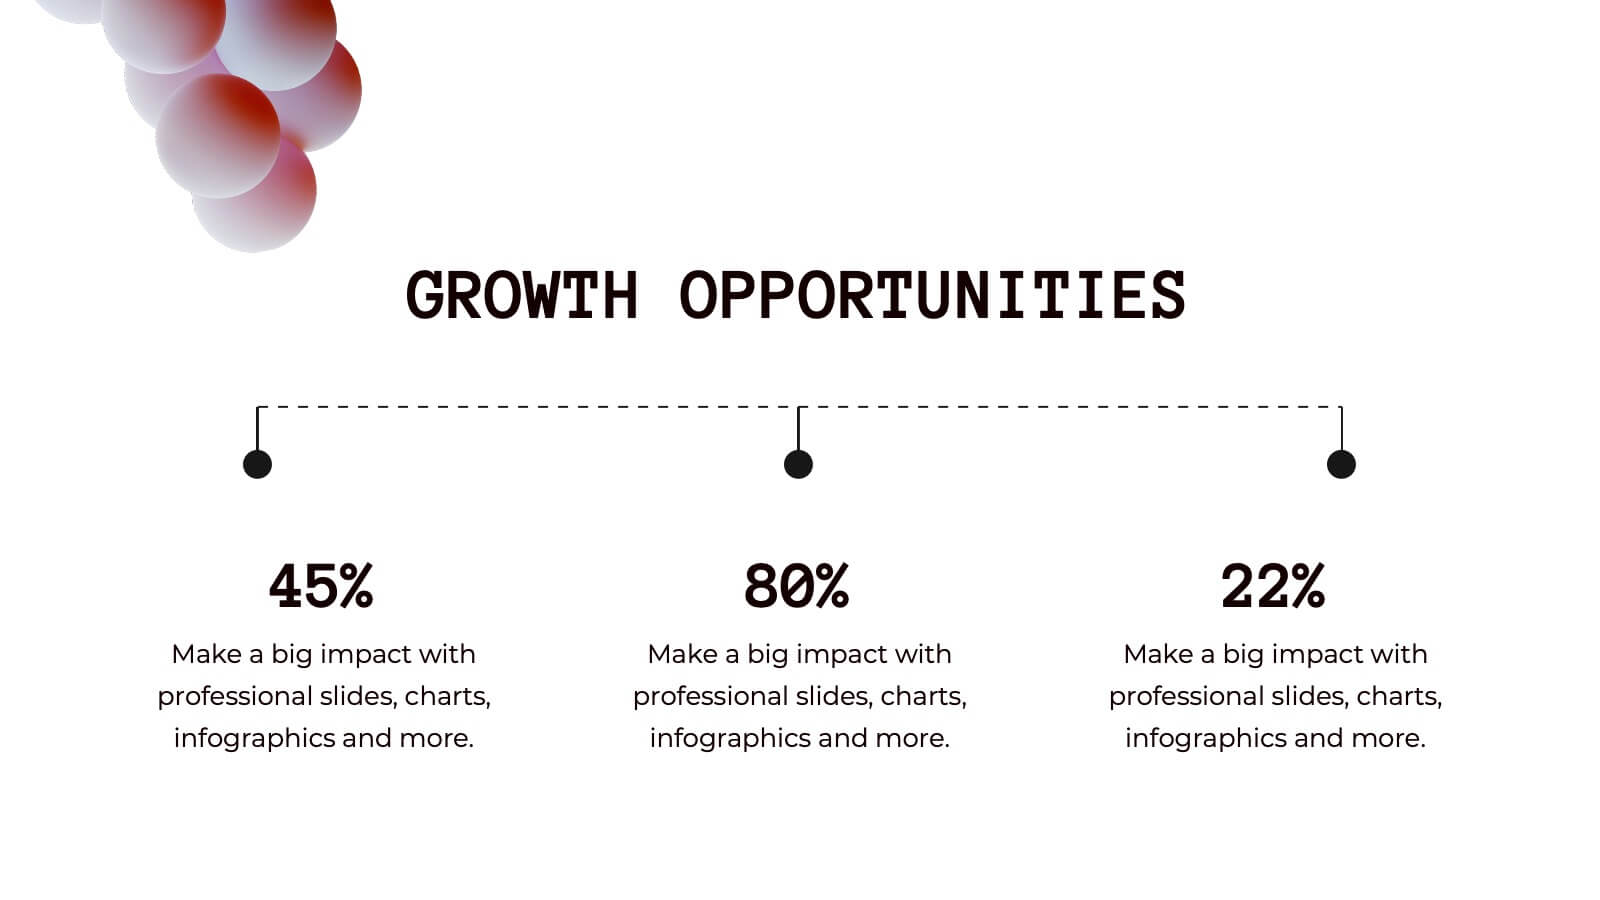
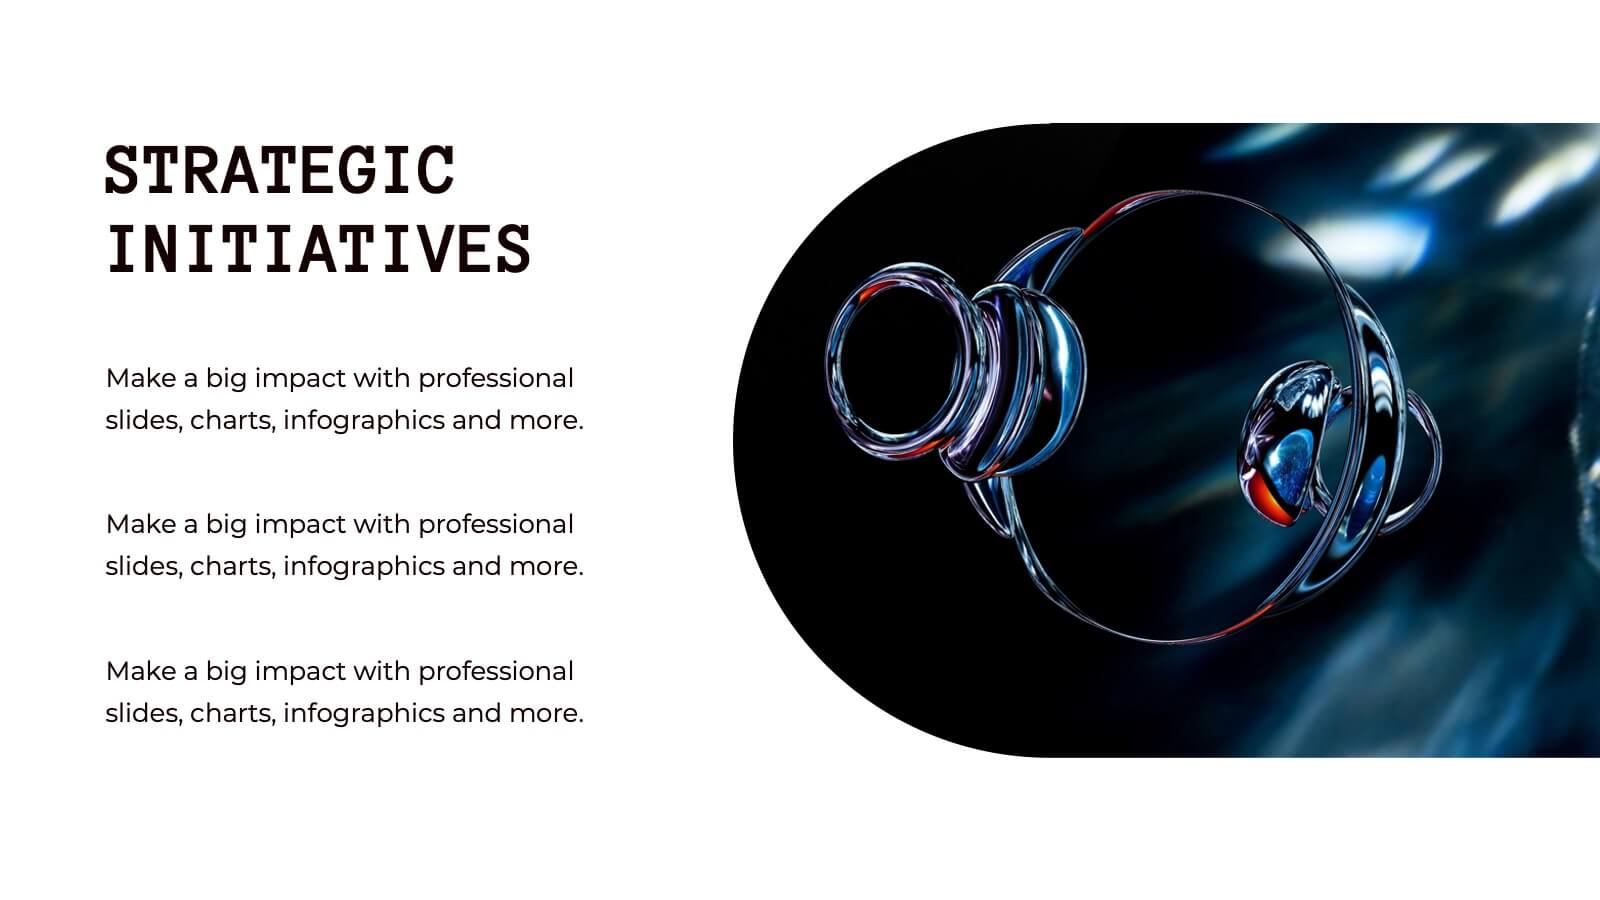
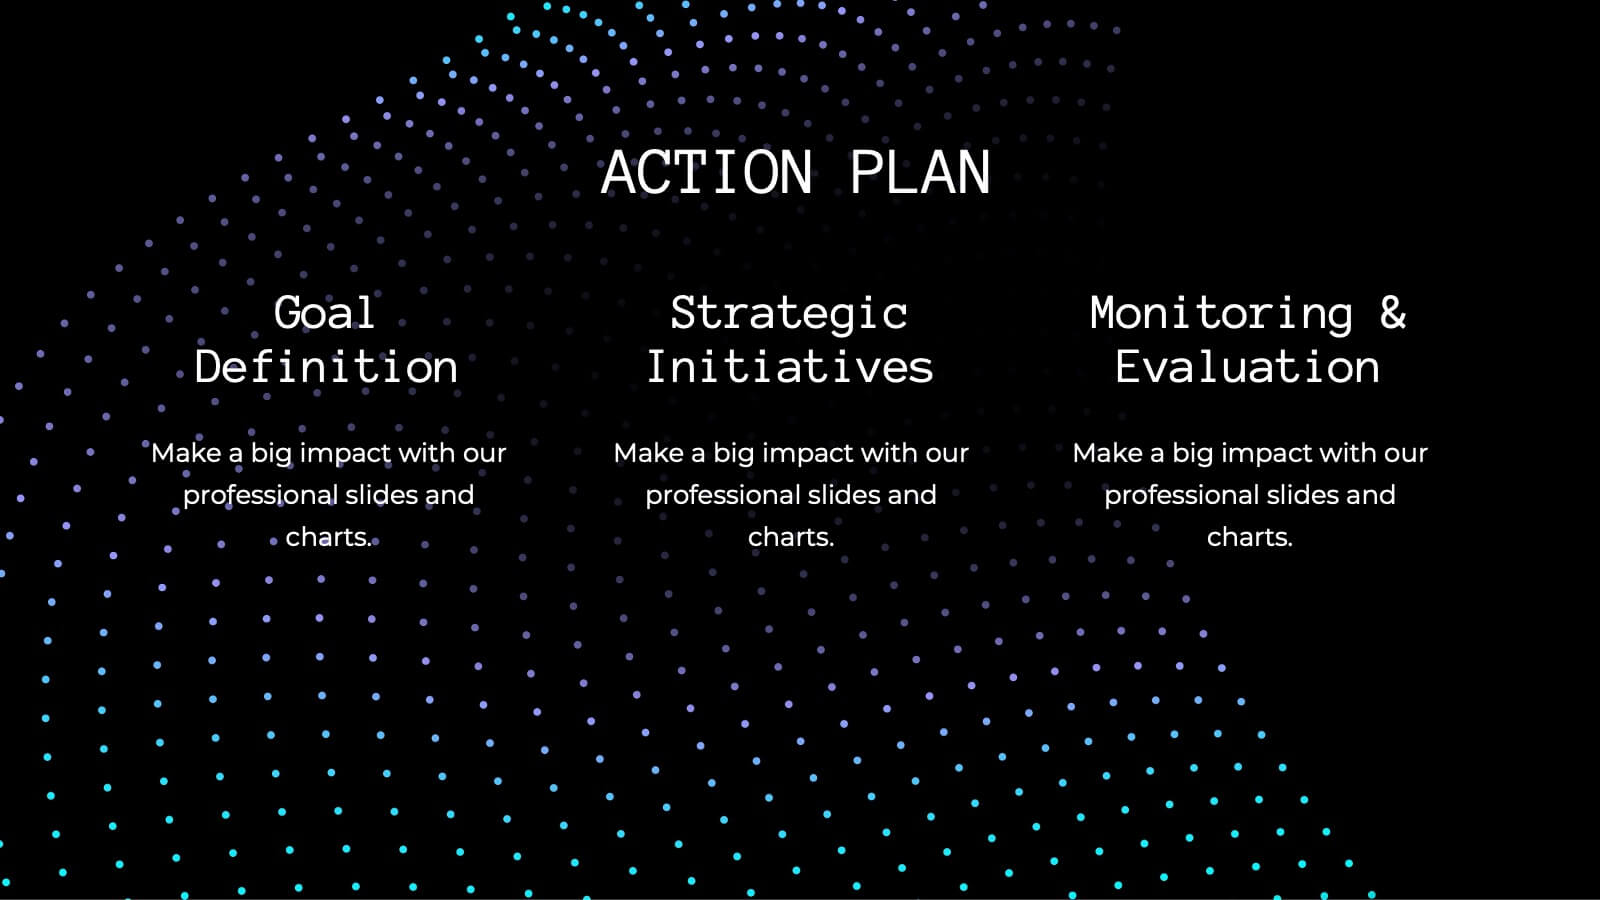
Spark interest instantly with a bold, circular layout that transforms product insights into a clean, memorable story. This presentation helps you explain features, audience needs, and value propositions in an organized, visual flow that keeps attention on what matters most. Fully customizable for PowerPoint, Keynote, and Google Slides.


5 diapositivas
History of Photography Infographics
The History of Photography traces back to the early 19th century when the concept of capturing and preserving images through a camera was first realized. These infographic templates provide a visually stunning format to showcase the key milestones, influential photographers, and technological advancements that shaped the history of photography. The template consists of vertical infographics, making it easy to present information in a visually appealing and organized manner. It is compatible with Powerpoint, Keynote, and Google Slides, ensuring seamless customization and adaptability to your specific needs.


10 diapositivas
Modern Healthcare Technology Trends Presentation
Highlight innovations in healthcare with the Modern Healthcare Technology Trends Presentation. This slide features a central device graphic connected to four key icons, perfect for showcasing digital tools, emerging trends, or medical tech strategies. Fully customizable in Canva, PowerPoint, Keynote, and Google Slides—ideal for medical tech briefings and strategic presentations.


7 diapositivas
Environmental Infographic Presentation Template
An Environmental infographic is a great tool for educating your audience about the state of the environment. This template includes a large format and bold colors that create an impactful visual appeal. The design provides space for facts, stats, and descriptions of the project in question. Use this template to show how much the world has changed and what measures are being taken to mitigate effects on the environment. This infographic has a green hue and illustrations that allow you to add information on the world's natural resources. This is a unique and fun way to display your information.


5 diapositivas
Target Audience Analysis Slide Presentation
Discover who your audience truly is with this clear and visually balanced layout designed to simplify audience insights. Perfect for marketing plans, presentations, and strategy reports, it helps you visualize key demographics and behaviors effortlessly. Fully customizable and compatible with PowerPoint, Keynote, and Google Slides for easy editing.


7 diapositivas
AIDA Selling Model Infographic
The AIDA model is a widely used marketing and advertising framework that outlines the stages a consumer typically goes through when engaging with a product or service. This infographic template is a dynamic and compelling tool designed to conquer the attention and minds of your audience. AIDA, the cornerstone of marketing, stands for Attention, Interest, Desire, and Action—an unyielding formula for successful engagement. Fully customizable and compatible with Powerpoint, Keynote, and Google Slides. Prepare to take your marketing strategies to exhilarating heights with this infographic.


4 diapositivas
Fixed and Variable Cost Balance Presentation
Visualize cost distribution using a balanced scale metaphor. This presentation helps compare fixed and variable costs with editable sections for data input. Ideal for financial planning, budgeting, or cost control analysis. Fully customizable in PowerPoint, Keynote, and Google Slides to match any brand or business presentation style.


5 diapositivas
Concept Overlap with Venn Diagram Presentation
Visually map overlapping concepts and relationships with this four-circle Venn diagram slide. Perfect for presenting interdependencies, cross-functional insights, or product comparisons. Each section includes editable labels and icons to personalize your content. Compatible with PowerPoint, Keynote, and Google Slides—ideal for business strategies, brainstorming sessions, and collaborative team presentations.


7 diapositivas
SCRUM Roles Infographic
Dive into the agile world with our SCRUM roles infographic. This template is designed to depict the various roles within the SCRUM framework, offering clarity and insight into the collaborative heart of agile methodologies. With a clean white canvas set against hues of blue, it provides a modern yet comprehensive overview of the roles. Ideal for agile coaches, trainers, and organizations transitioning to agile methodologies, this infographic is tailored to showcase the importance of each role. With its compatibility, spanning PowerPoint, Keynote, and Google Slides, presentations are bound to be a breeze, regardless of the platform you favor.


5 diapositivas
Hierarchical Pyramid Chart Presentation
Bring structure to your ideas with a clean, layered visual that makes complexity feel easy to navigate. This presentation helps you explain levels, priorities, and organizational breakdowns with clarity and flow. Ideal for planning, strategy, and reporting. Fully compatible with PowerPoint, Keynote, and Google Slides.

21 diapositivas
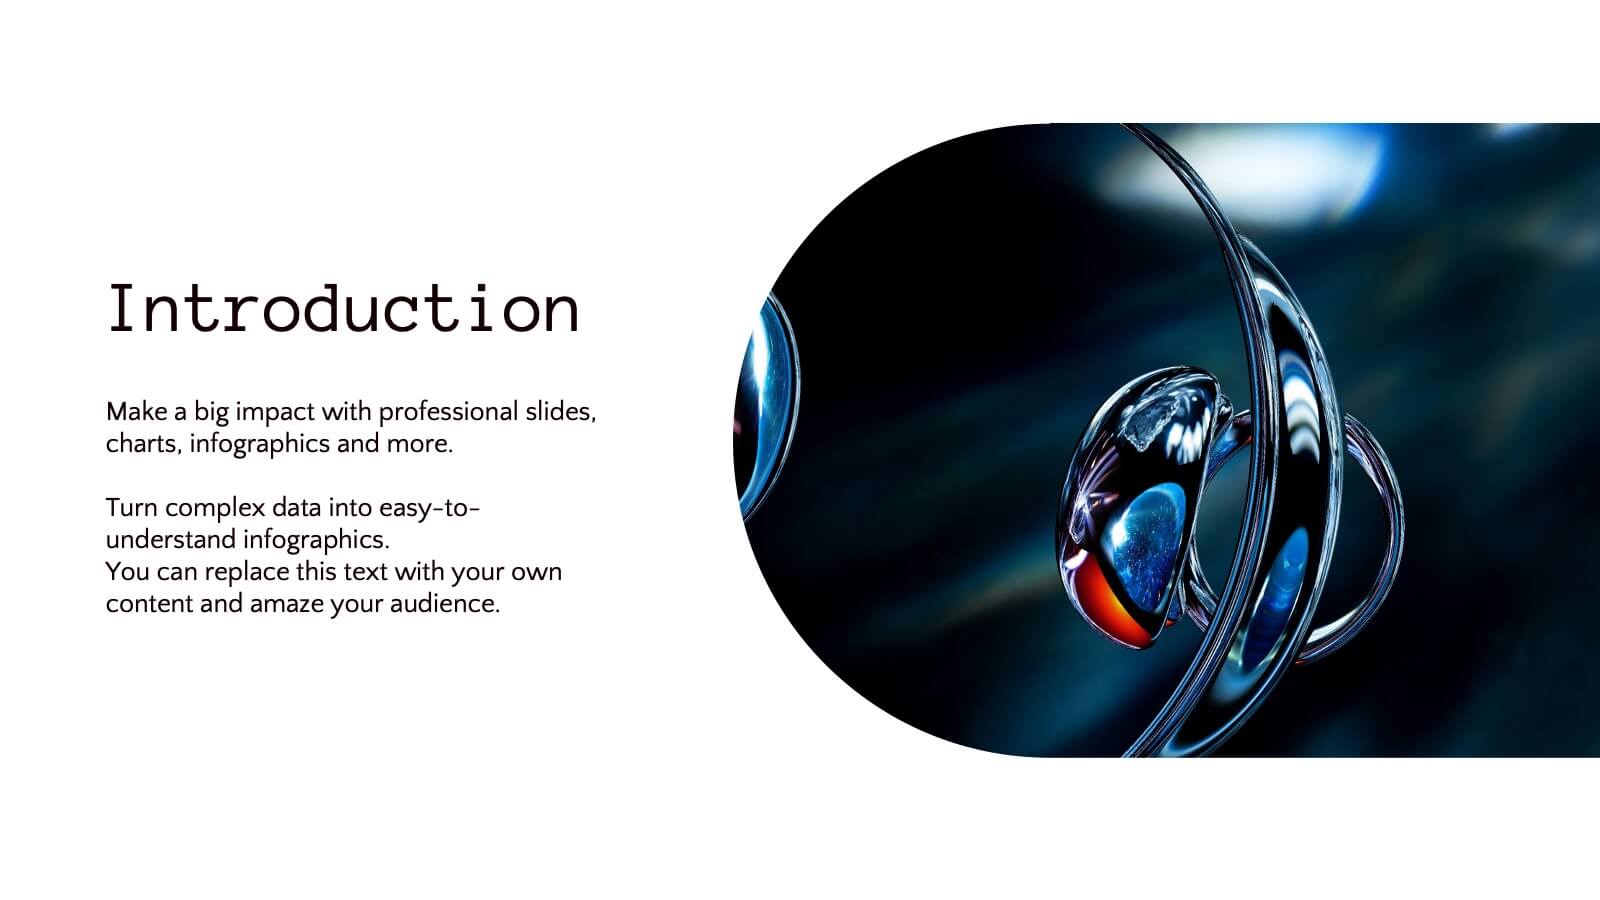
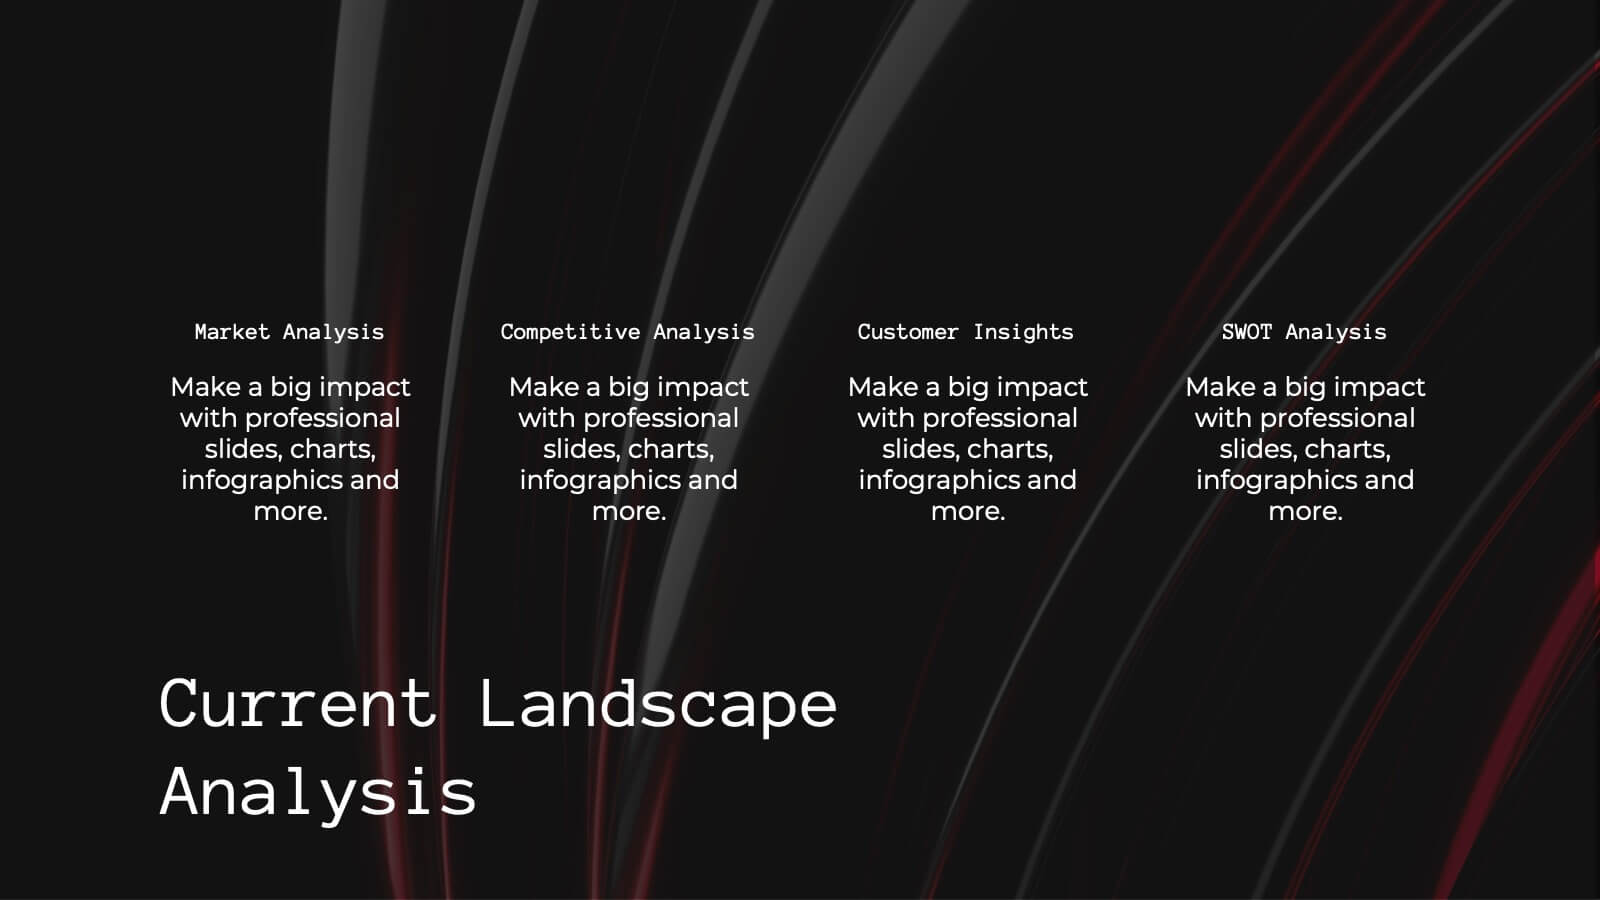
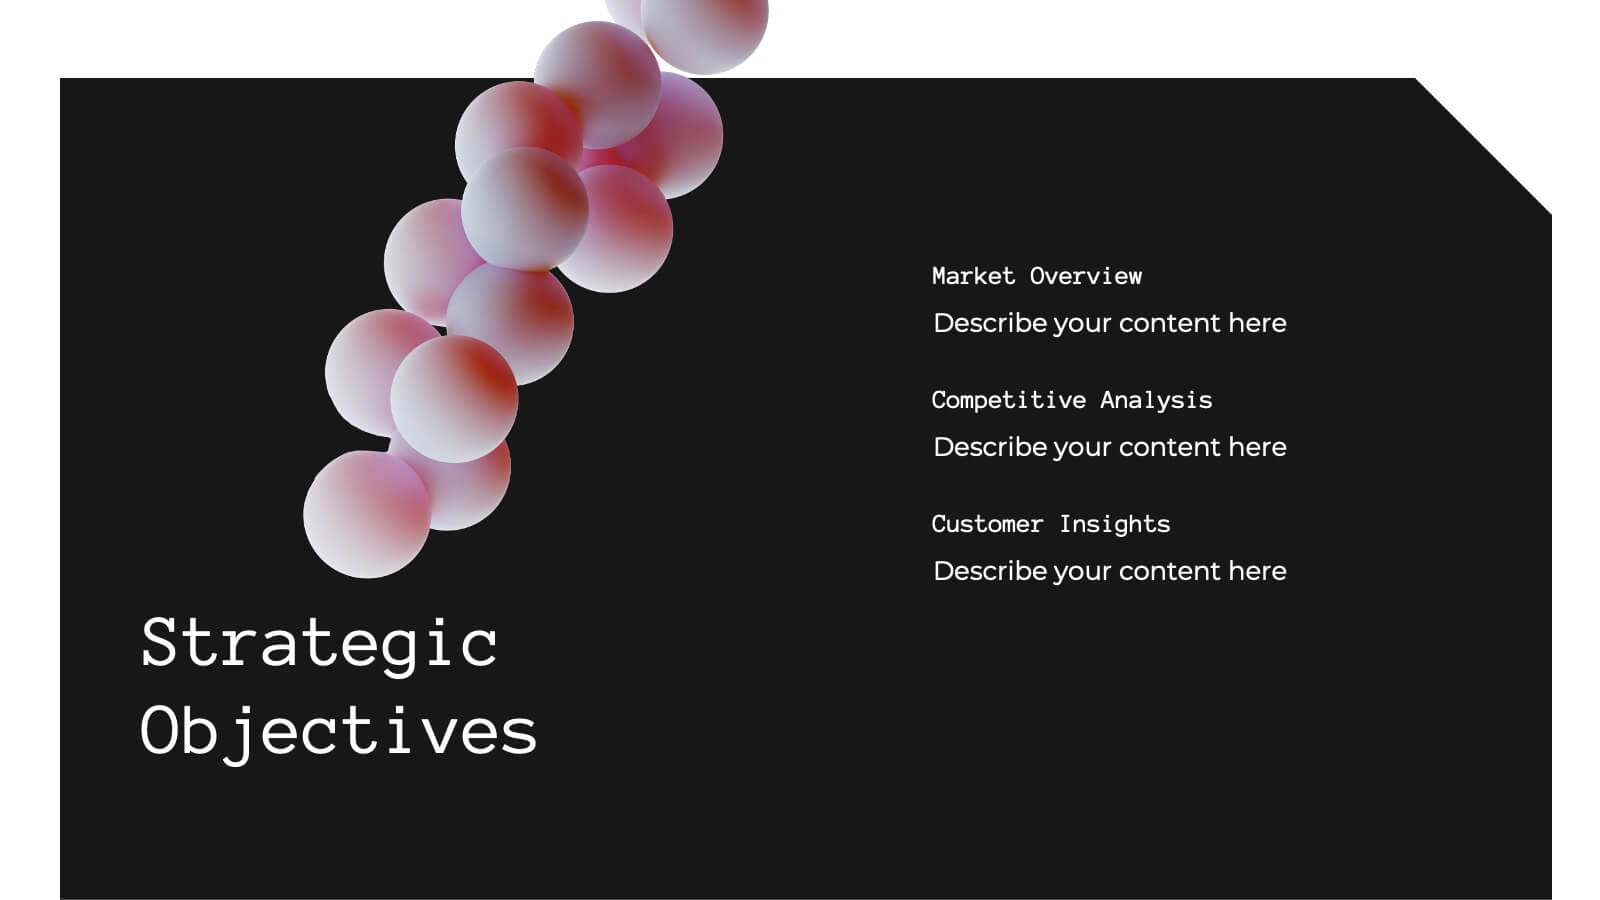
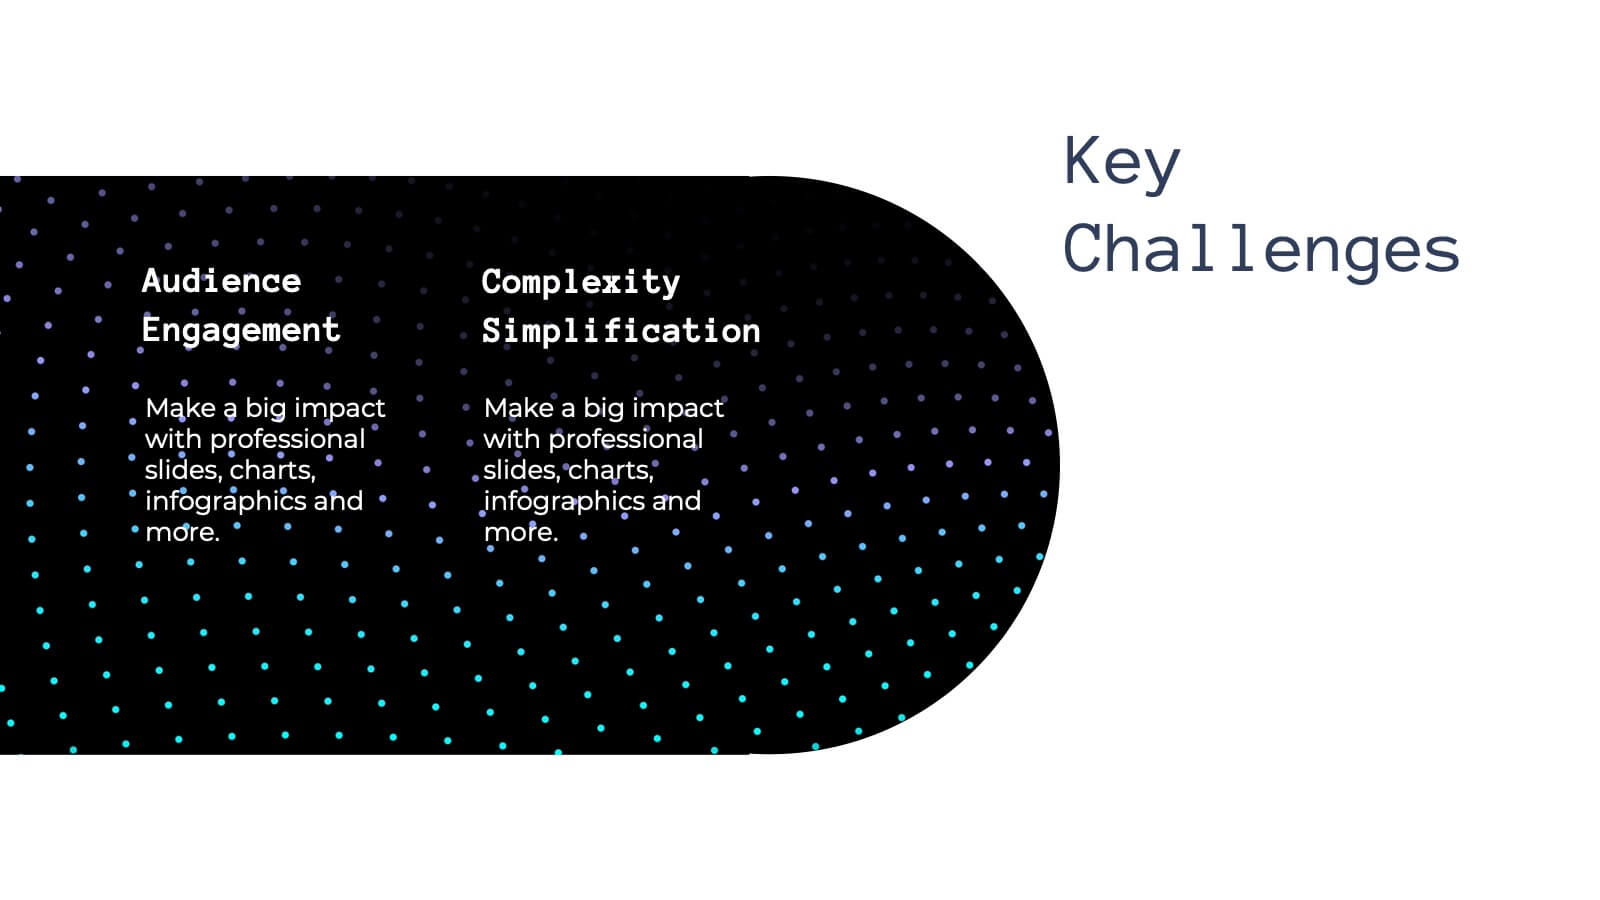
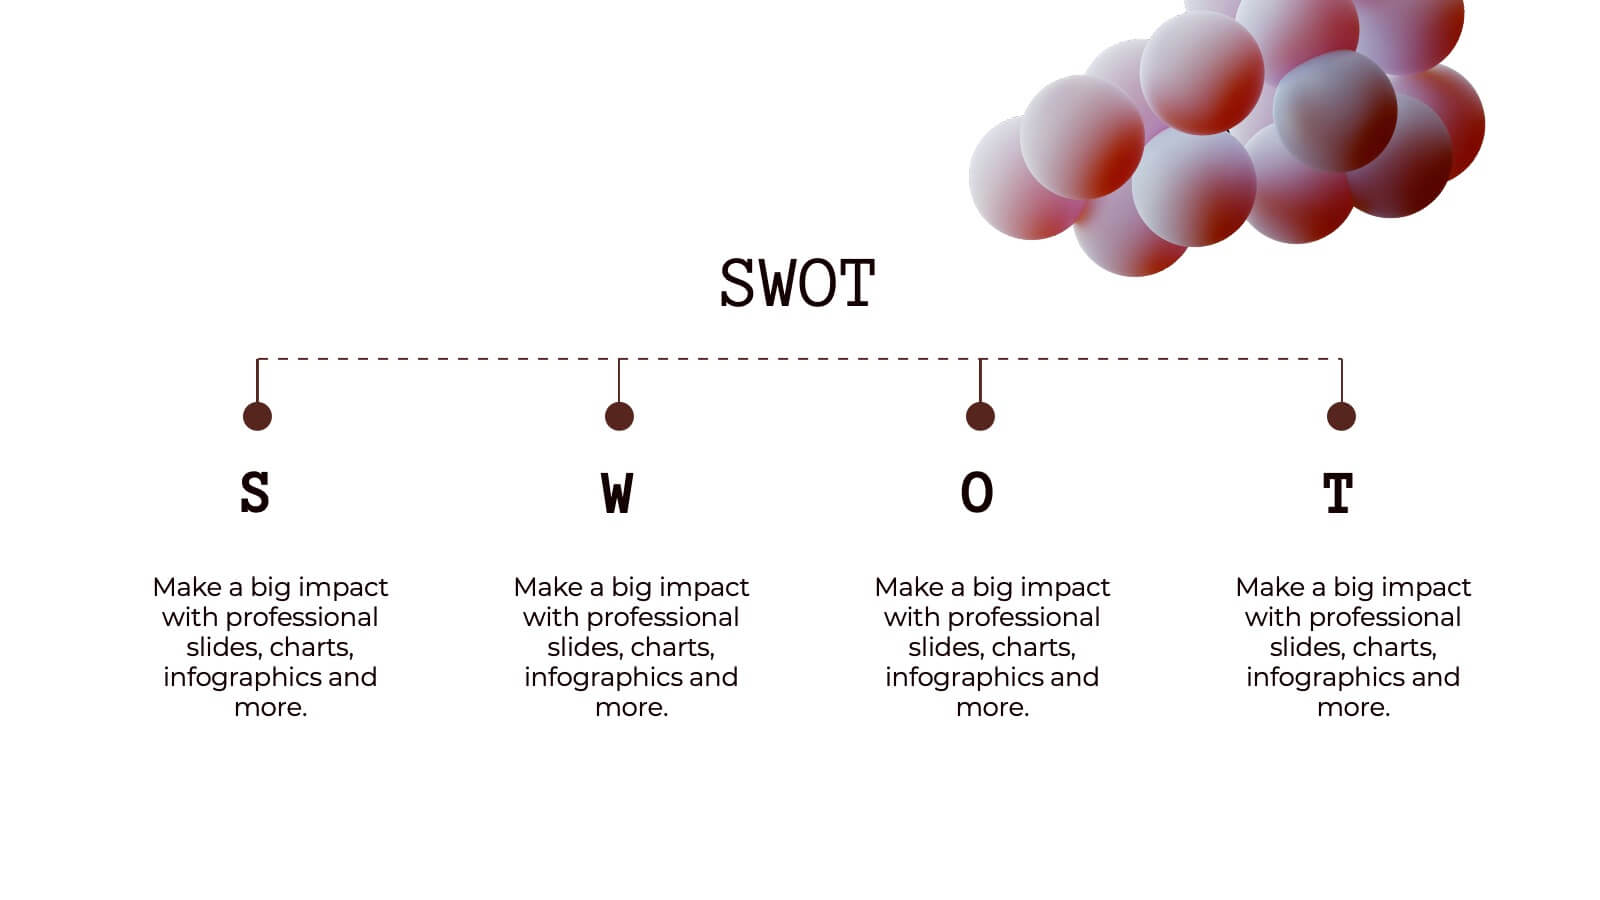
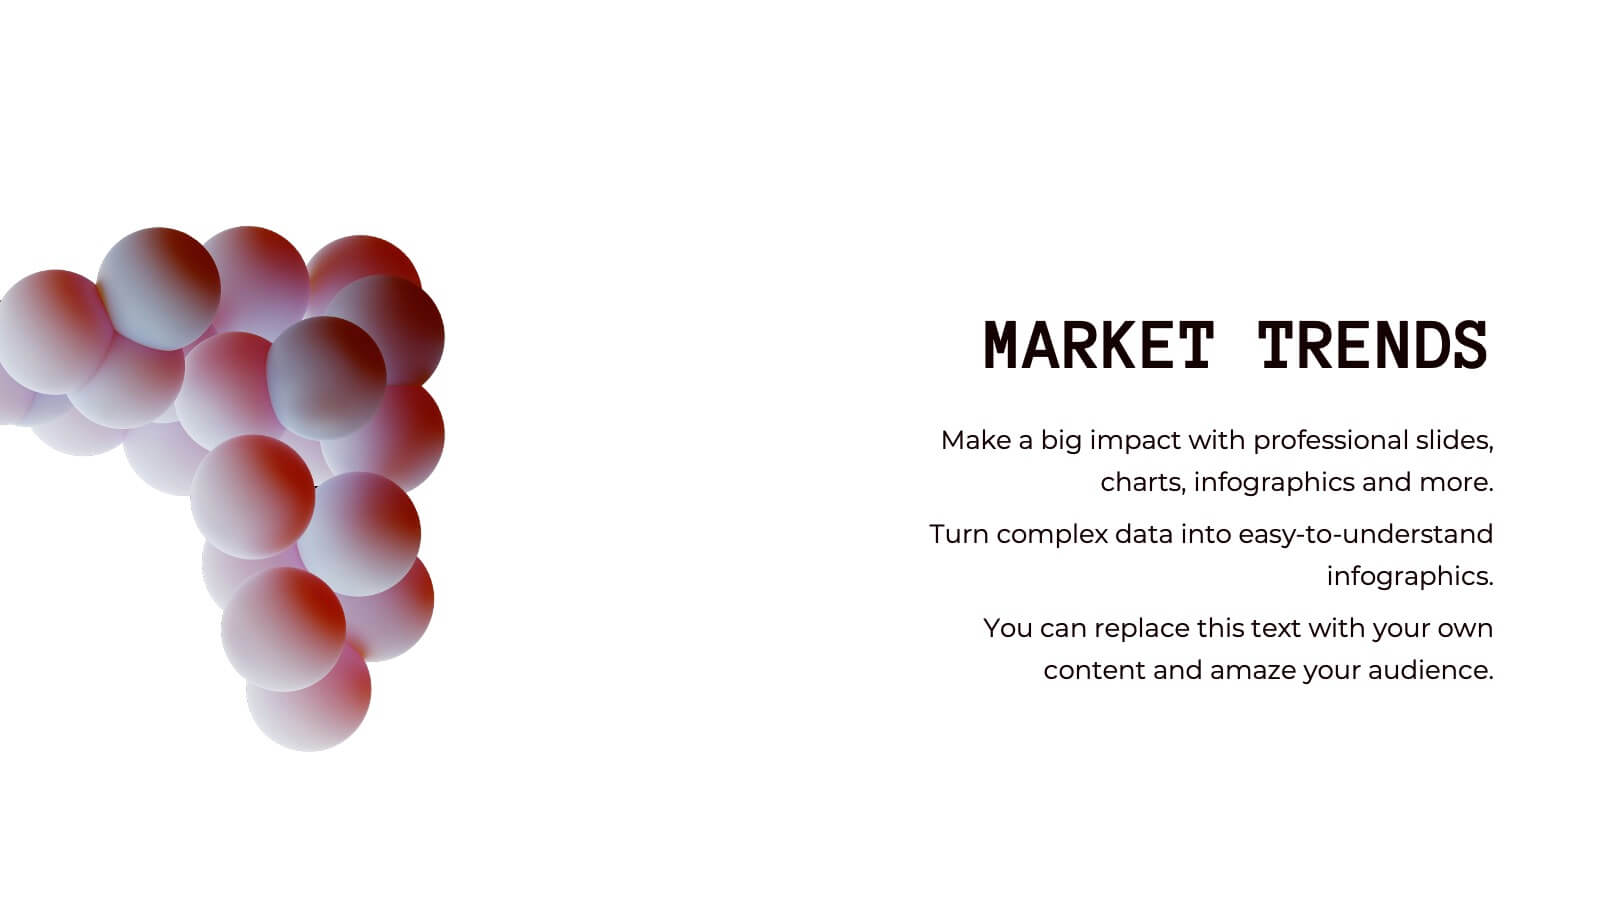
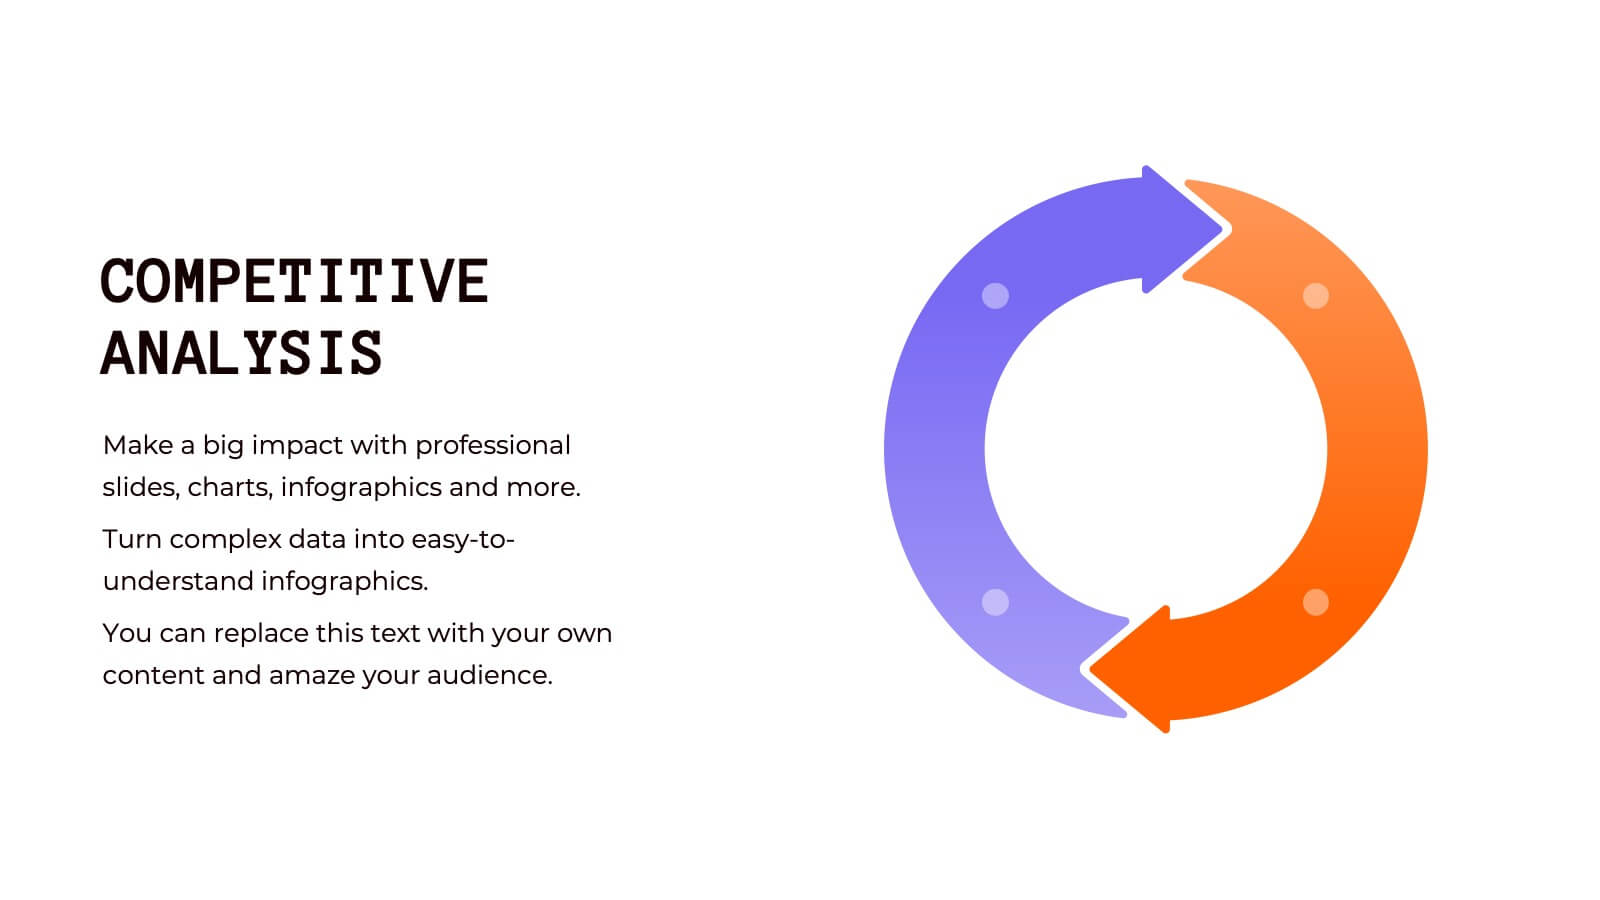
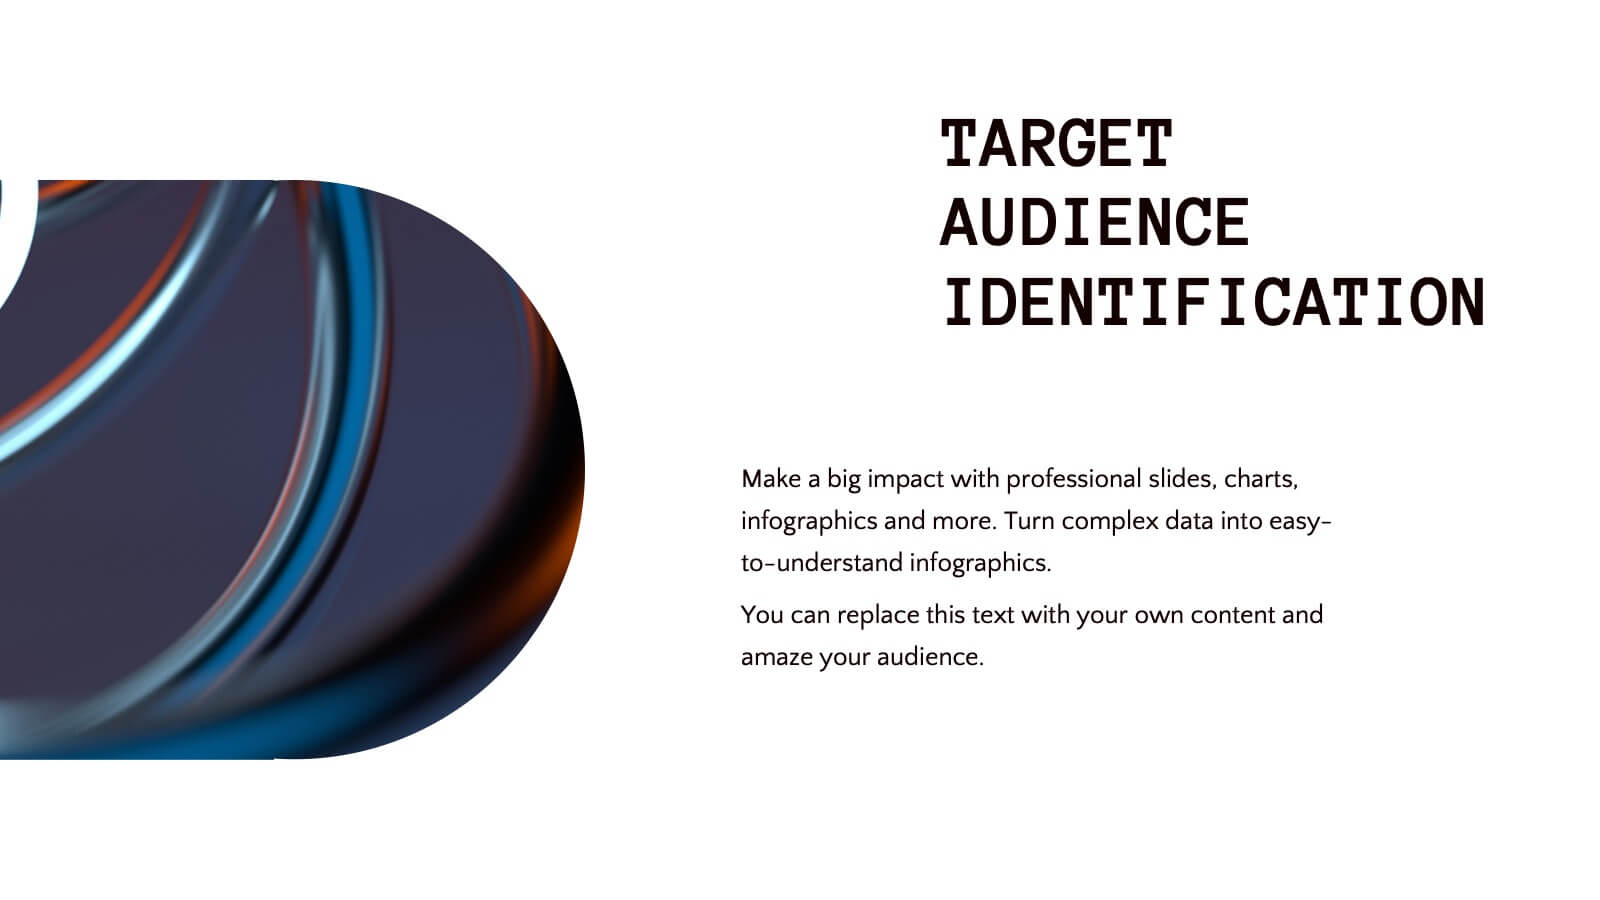
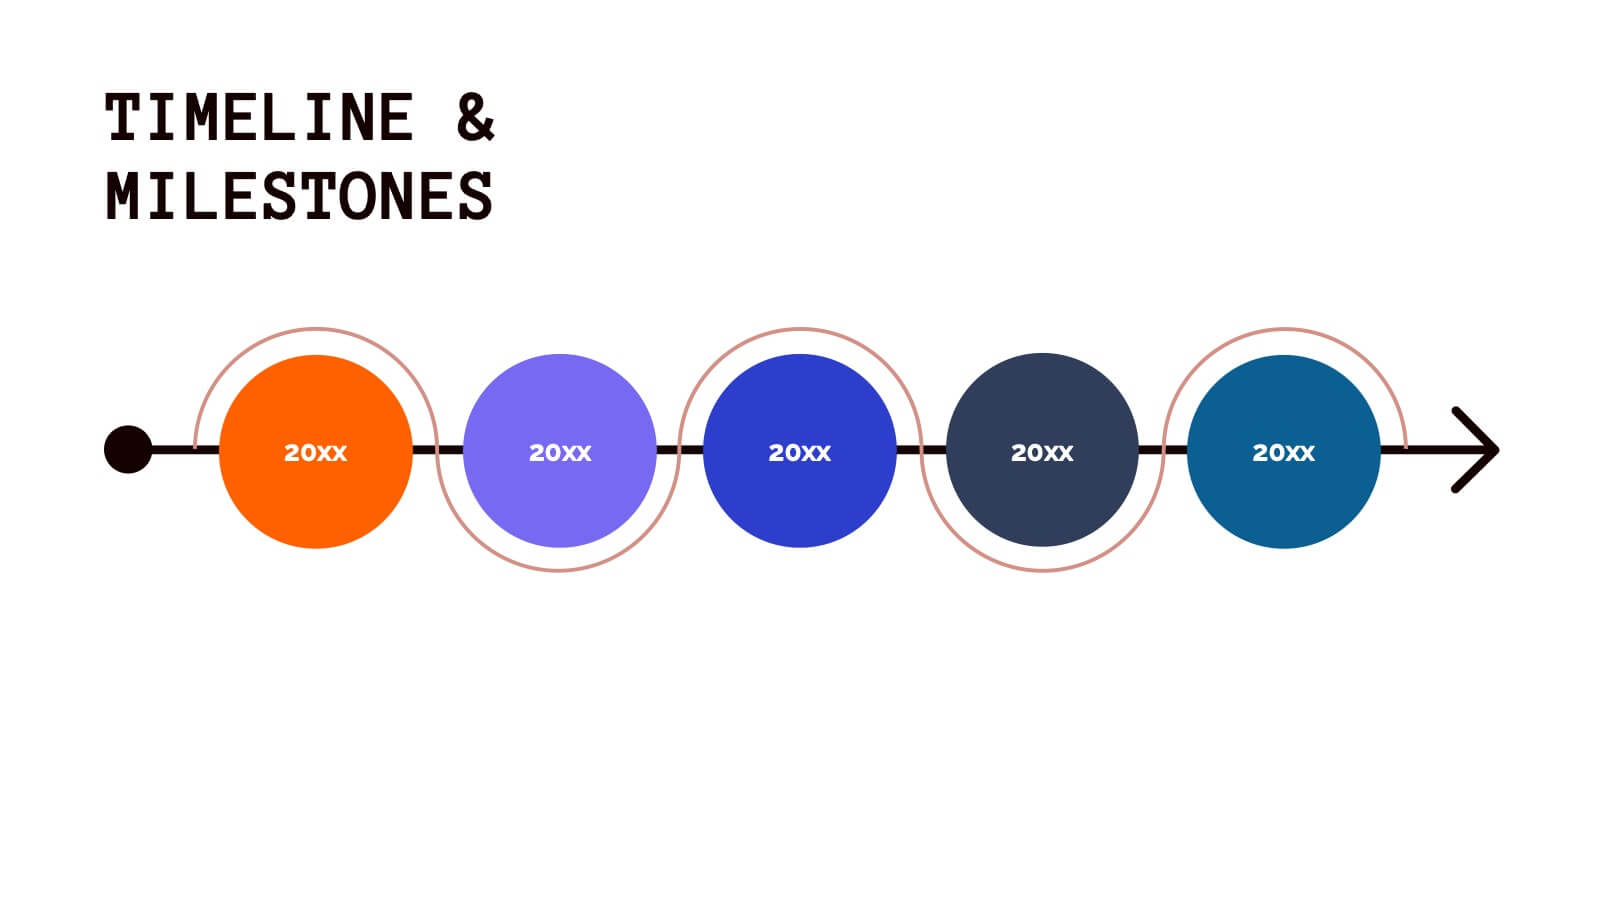
Mermaid Corporate Strategy Proposal Presentation
Present your corporate strategy with confidence using this sleek, modern proposal template! It covers strategic objectives, market trends, SWOT analysis, and resource allocation, ensuring a comprehensive overview of your plan. Fully customizable and compatible with PowerPoint, Keynote, and Google Slides, this template is ideal for launching new initiatives and achieving business goals.


7 diapositivas
Stakeholder Analysis Infographics Presentation Template
A stakeholder analysis is a process used to identify stakeholders and analyze the needs of each stakeholder. The purpose of a stakeholder analysis is identifying the people who are involved, or interested in your project and determining how best to involve and communicate with each of them throughout. This template is the perfect tool to help you embrace, or get started on, your stakeholder analysis. With this template, you are taken through each step of a stakeholder analysis in a strategic and easy-to-follow manner. This template makes it easy to communicate your plan and influence change.


4 diapositivas
Human Resources KPI Dashboard Presentation
Bring your metrics to life with this clean and modern dashboard designed to highlight essential HR performance insights. It helps you present key indicators clearly, making data easy to compare and understand at a glance. Perfect for HR reviews or internal updates, and fully compatible with PowerPoint, Keynote, and Google Slides.


6 diapositivas
Project Scope and Expansion Scale Presentation
Display growth areas and operational coverage with this segmented radial chart. Ideal for showcasing project reach, departmental impact, or phase distributions, each section includes editable icons and labels. Perfect for strategy updates, expansion pitches, or status reporting. Fully customizable in PowerPoint, Keynote, and Google Slides for professional presentations.