


Características


¿Tienes alguna pregunta?
Recomendar


10 diapositivas
Social Media Marketing Growth Presentation
Boost your social media strategy with this dynamic infographic template! Perfect for illustrating marketing growth, engagement tactics, and content performance, it features an intuitive flow that simplifies complex data. Ideal for presentations to teams and clients, it’s fully customizable and works seamlessly with PowerPoint, Keynote, and Google Slides.


5 diapositivas
IT Support and Systems Presentation
Streamline your tech communication with a clean, structured layout that highlights your IT services, support processes, and system workflows. Perfect for teams presenting solutions, infrastructure overviews, or technical strategies, this presentation brings clarity to complex topics. Fully compatible with PowerPoint, Keynote, and Google Slides for effortless editing and delivery.


5 diapositivas
Technology Comparison Infographics
When comparing technologies, it's important to consider various factors that can impact their performance, usability, and suitability for specific purposes. These vertical infographics can be used in various contexts, including product evaluations, technology assessments, investment decisions, and educational presentations. It helps simplify complex information and facilitates the understanding of technology options, enabling individuals and organizations to make well-informed choices that align with their goals and requirements. Compatible with Powerpoint, Keynote, and Google Slides.


4 diapositivas
Business SWOT Evaluation Presentation
Break down business strategies with this visually structured SWOT analysis layout. Present strengths, weaknesses, opportunities, and threats in a clean, quadrant-style format. Ideal for reports, pitches, or internal reviews. Fully editable in PowerPoint, Keynote, and Google Slides for clear, impactful analysis that drives smarter decision-making and strategic alignment.


5 diapositivas
Infographic Business Charts Presentation
Bring your data to life with a bold, visual storytelling layout designed to make insights instantly clear and impossible to ignore. This presentation highlights key metrics using clean, modern business charts that simplify comparisons and trends for any audience. Fully compatible with PowerPoint, Keynote, and Google Slides.


28 diapositivas
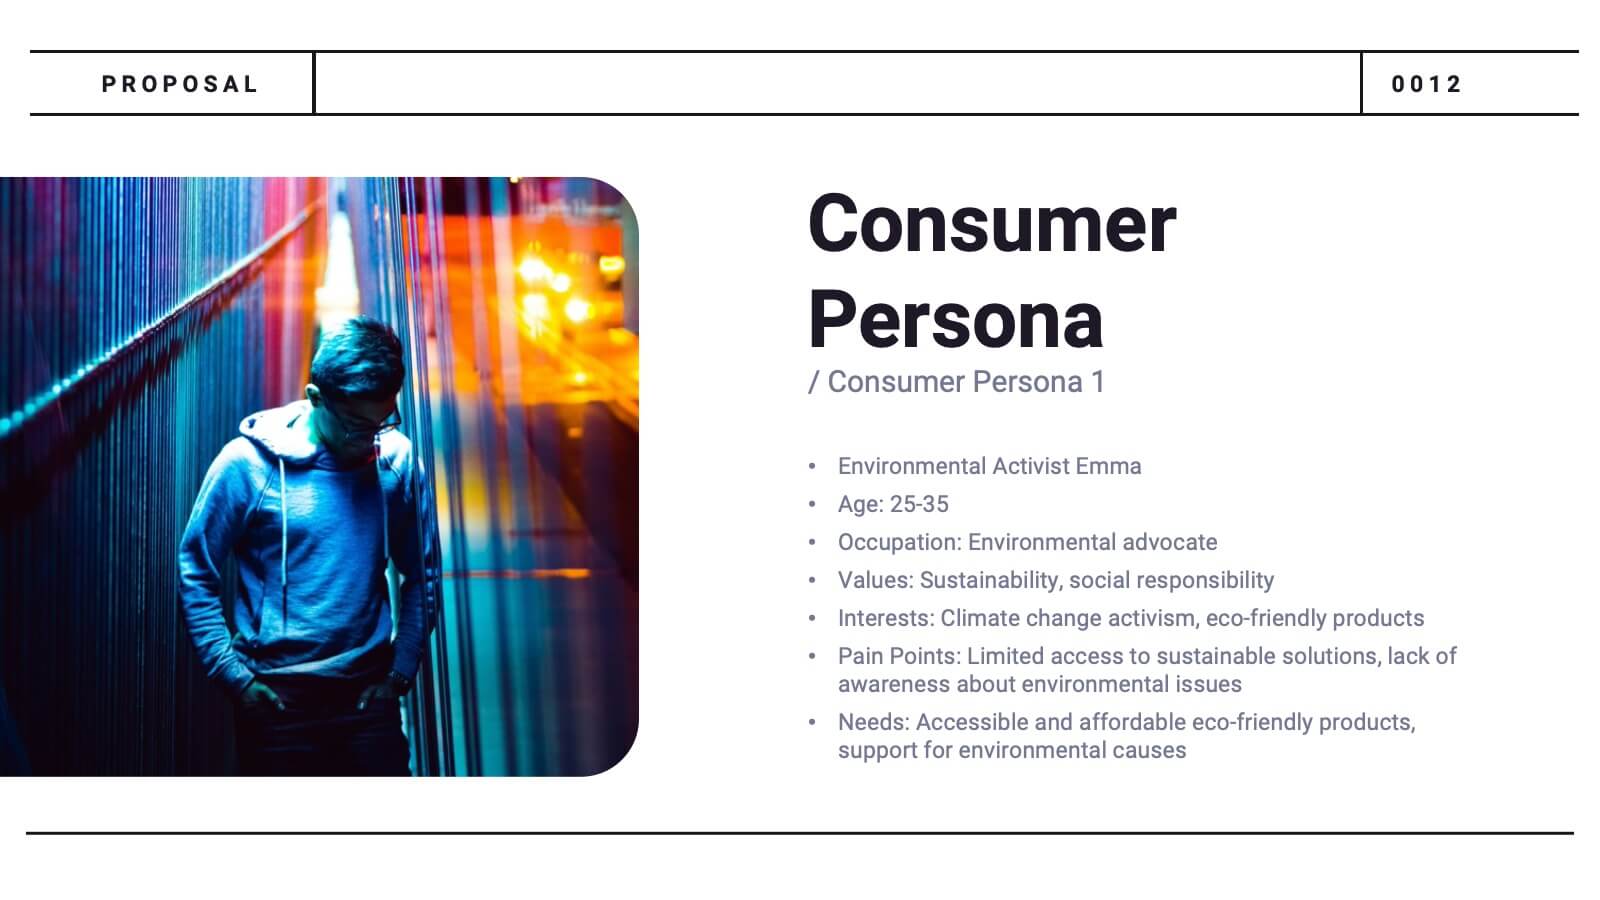
Glowspire Brand Guidelines Proposal Presentation
This brand identity template covers essential components: logo, imagery, color, typography, and voice & tone. It includes slides for consumer persona, market analysis, USP, brand positioning, and strategy. Ideal for establishing a cohesive brand, it highlights brand touchpoints across digital, print, packaging, and advertising mediums. Customizable for various platforms.


7 diapositivas
Simple Table of Content Slide Presentation
A clean, structured layout makes it easy to guide your audience through key sections with clarity and flow. This simple table of content slide helps you introduce topics, outline ideas, and set expectations in a polished, professional way. Fully compatible with PowerPoint, Keynote, and Google Slides.


7 diapositivas
Statistics Infographics Presentation Template
A statistical infographic is a visualization of your data that helps people understand and analyze it. They can be used to tell stories, support arguments and make a persuasive case. Statistical infographics are a quick and easy way to convey complex data in an informative and visually engaging way. Use this template to create a statistical infographic that is accurate and easy to read. This template includes pie charts, bar graphs, and other visual representations you can use to present your data. Statistics are very useful and important in every field, from business to education.


5 diapositivas
Regional Sales Heatmap Presentation
Showcase performance by region with this Regional Sales Heatmap Presentation. This template highlights U.S. state-by-state sales data using gradient color coding and a clear legend system. Easily customizable for quarterly reports, territory analysis, or sales strategy reviews. Compatible with PowerPoint, Keynote, and Google Slides.


5 diapositivas
Budget Planning Finance Presentation
Visualize your financial strategy with this Budget Planning Finance Presentation. Featuring four plant pot icons representing different funding stages, this design helps highlight growth potential and budget allocation. Ideal for financial planning, investment proposals, and expense reports. Customize the text, colors, and icons easily in PowerPoint, Keynote, or Google Slides. Perfect for finance teams, consultants, and business managers.


8 diapositivas
Customer Market Segmentation Analysis
Visualize your audience insights with precision using the Customer Market Segmentation Analysis Presentation. This slide features a sleek, layered funnel design with percentage bars and arrow pointers—ideal for illustrating demographic splits, buyer behavior, or psychographic segments. With space for four data-driven categories and custom labels, this template is perfect for marketers, analysts, and product teams looking to present actionable customer data. Fully editable in PowerPoint, Keynote, and Google Slides, and easy to adapt to any color scheme or branding.


13 diapositivas
Simple Sales Proposal Presentation
This proposal template provides a streamlined approach for presenting sales strategies and solutions. Starting with a visually striking cover slide, it sets the scene for an engaging pitch. The template meticulously organizes content from the initial problem identification to the presentation of real numbers that underscore the proposal's validity. Each section, from the elucidation of the problem to the detailed solutions and real-world case studies, is laid out for maximum impact and understanding. Personable touches are incorporated through the 'Meet Our Team' segment, bolstering the proposal with credibility. The template culminates with a strong call to action, urging the audience to seize the collaborative opportunity, and is rounded off with a polite 'Thank You' to leave a lasting impression. This template is a boon for sales professionals seeking to communicate their value proposition with clarity and persuasiveness.


7 diapositivas
Meeting Infographic Presentation Template
Meetings are an important part of workplace culture. They help people build relationships, share ideas and make decisions. This template is a great way to show the importance of meetings to your managers and employees. This presentation can be used in a workplace to show how meetings help team members share knowledge and work. By providing an open dialogue, they can also be a useful tool for making employees feel valued and heard. Using the fun customizable illustrations provided in the template, keep your team members engaged on meetings and boost the entire team’s work ethic.


6 diapositivas
Effective Leadership Decision-Making Presentation
Enhance decision-making clarity with this Effective Leadership Decision-Making template. Designed for managers, executives, and strategists, this slide visually represents decision paths, prioritization, and leadership impact. Featuring color-coded options and engaging graphics, it helps illustrate the influence of choices on business outcomes. Fully compatible with PowerPoint, Keynote, and Google Slides, making it a seamless addition to your presentations.


26 diapositivas
Water Pollution in the Pacific Presentation
Water Pollution in the Pacific refers to the contamination of water bodies in the Pacific Ocean, which can have severe consequences for marine life, ecosystems, and human health. This template is designed to raise awareness about the critical issue of water pollution in the Pacific Ocean. This template can effectively convey the urgency and significance of addressing water pollution in the Pacific Ocean. This serves as a powerful tool to educate and inspire individuals, organizations, and policymakers to take action and work towards sustainable solutions for the preservation of our precious marine ecosystems.


2 diapositivas
Creative Presentation Opening Title Slides
Step into a world of innovation with the "Creative Presentation" title slides, where vibrant geometric shapes meet clean, modern design. Perfect for showcasing your ideas and transforming them into impactful solutions, these slides set the stage for inspiration. Compatible with PowerPoint, Keynote, and Google Slides, they're ideal for anyone looking to make a memorable impression.


7 diapositivas
RACI Matrix Manufacturing Infographic
The RACI matrix, an essential tool for defining roles and responsibilities, finds vital applications in the realm of manufacturing. Our RACI matrix manufacturing infographic, bathed in shades of blue against a clean white canvas with tasteful black accents, simplifies the complex choreography of tasks, roles, and accountabilities in manufacturing processes. Designed particularly for manufacturing managers, team leaders, and project coordinators, this template vividly illustrates how tasks are assigned and to whom, ensuring clarity and streamlining operations. Ready-to-use, it integrates seamlessly with PowerPoint, Keynote, and Google Slides.