


Características


¿Tienes alguna pregunta?
Recomendar


4 diapositivas
Food Business Concept Pitch Presentation
Bring your culinary vision to life with the Food Business Concept Pitch Presentation. This unique avocado-shaped layout helps you outline up to four key ideas—from menu innovation to service strategy. Perfect for chefs, restaurateurs, or food startups. Fully editable in PowerPoint, Canva, and Google Slides for easy customization.


5 diapositivas
Operational Workflow Process Chart Presentation
Streamline your operations with the Operational Workflow Process Chart Presentation. This template provides a clear visual layout to map out step-by-step processes, helping teams align on roles, timelines, and dependencies. Perfect for training, reporting, or system audits—fully customizable in PowerPoint, Canva, and Google Slides.


2 diapositivas
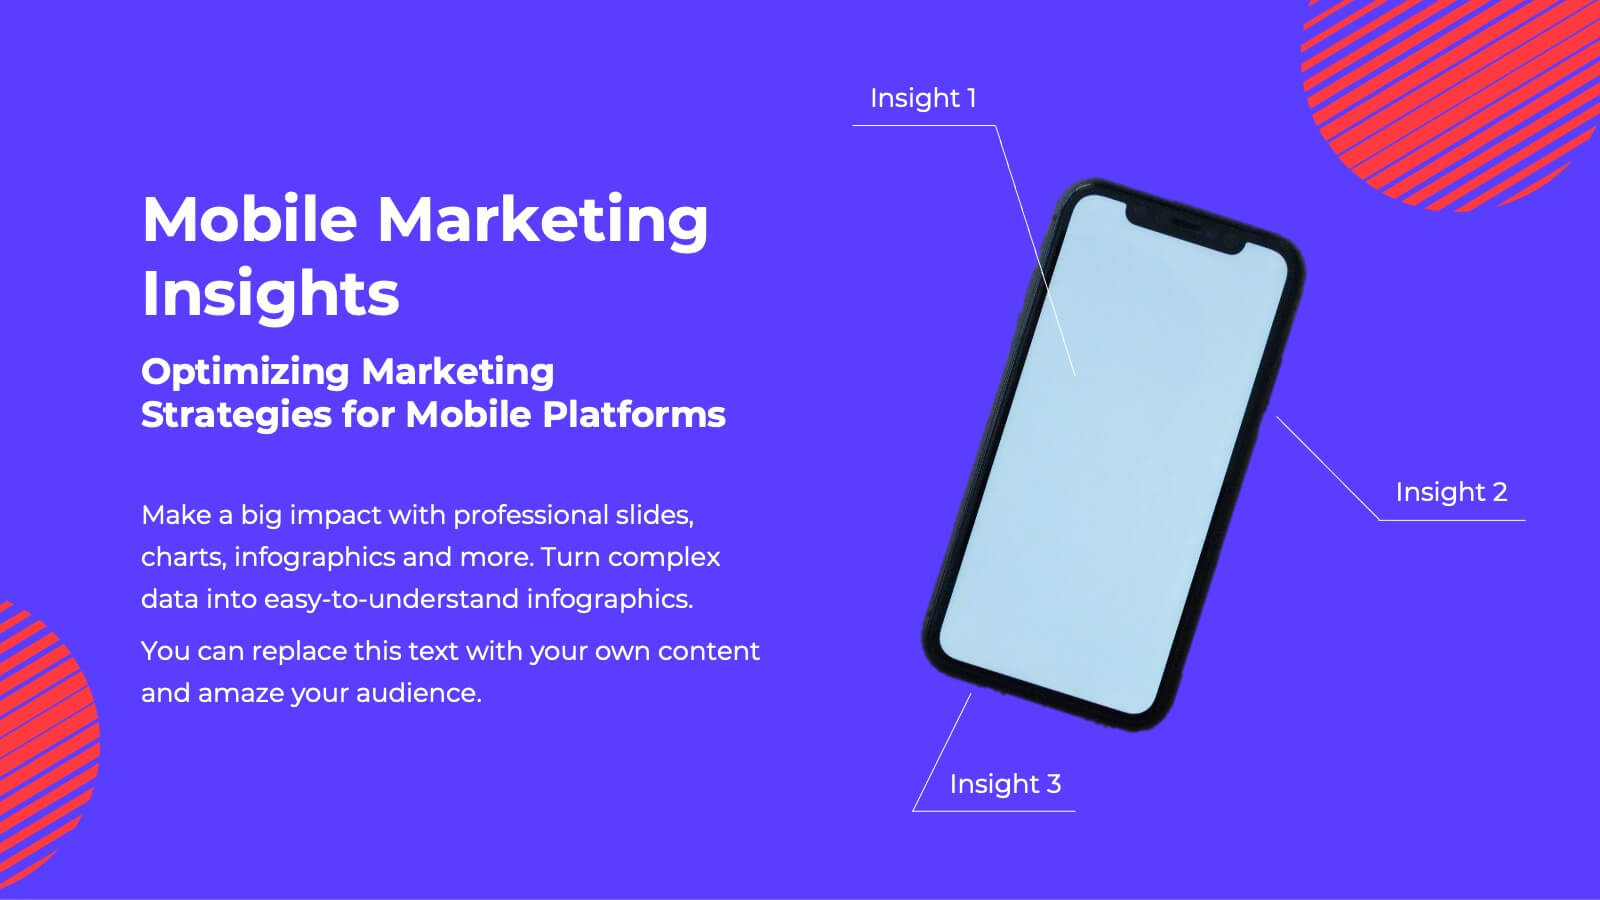
App Interface Device Preview Presentation
Display your mobile app design with this sleek interface preview layout. Centered around a realistic smartphone mockup, this template includes four surrounding sections for text or key features. Ideal for pitch decks or product demos, it's fully editable in PowerPoint, Keynote, or Google Slides to match your brand.


6 diapositivas
Strategic Solution Framework Presentation
Build your ideas step by step with this dynamic layout that turns strategies into a clear visual journey. Perfect for illustrating processes, growth plans, or solution pathways, it helps simplify complex frameworks into engaging visuals. Fully editable and compatible with PowerPoint, Keynote, and Google Slides for seamless customization.


21 diapositivas
Ceres Financial Report Presentation
This financial report template is designed to showcase performance metrics, sales analysis, project progress, and strategic insights with clarity and professionalism. Featuring slides for operational updates, competitor insights, and recommendations for improvement, it ensures a comprehensive financial overview. Compatible with PowerPoint, Keynote, and Google Slides for flexible presentations.


21 diapositivas
Goldenshadow Professional Portfolio Showcase Presentation
A refined portfolio presentation template crafted to highlight professional achievements and expertise. Showcase featured projects, collaborations, and client testimonials with a sleek, modern design. Includes sections for services offered, awards, pricing, and contact information. Fully customizable and compatible with PowerPoint, Keynote, and Google Slides for impactful portfolio presentations.


7 diapositivas
Property Market Forecast and Trends Presentation
Present your real estate insights clearly with this Property Market Forecast and Trends Presentation. Featuring a central isometric house graphic surrounded by six editable segments, this layout is perfect for highlighting key indicators like market trends, pricing shifts, and investment zones. Use the icons and color-coded areas to enhance clarity. Ideal for housing reports and investor decks. Fully compatible with PowerPoint, Canva, Keynote, and Google Slides.


5 diapositivas
Cross-Functional Team Collaboration Presentation
Visualize multi-department synergy with the Cross-Functional Team Collaboration Presentation. Ideal for mapping collaborative structures, workflows, or project roles across divisions. This layout emphasizes alignment and cooperation between teams. Easily customizable in PowerPoint, Keynote, and Google Slides—perfect for strategy sessions, management briefings, or team onboarding presentations.


6 diapositivas
Growth Through Lifelong Learning Presentation
Visualize personal or organizational development with this creative lifelong learning slide. Featuring a human head silhouette and puzzle piece graphics, it's perfect for illustrating stages of learning, training programs, or growth mindset principles. Fully editable in PowerPoint, Keynote, and Google Slides—ideal for educators, coaches, or corporate development professionals.


6 diapositivas
Competitive Research and Strategy Review Presentation
Present your market insights with clarity using the Competitive Research and Strategy Review Presentation. This puzzle-style layout is ideal for showing strategic steps or comparing research points in sequence. Fully editable in Canva, PowerPoint, Keynote, and Google Slides, it’s perfect for marketing teams, business analysts, and strategy consultants.


4 diapositivas
Conversion Funnel Stages Presentation
Bring clarity to every step of your customer journey with this clean, visually aligned funnel layout designed for quick understanding. This presentation breaks your process into clear stages, helping you explain performance, drop-offs, and opportunities with ease. Fully compatible with PowerPoint, Keynote, and Google Slides.

20 diapositivas
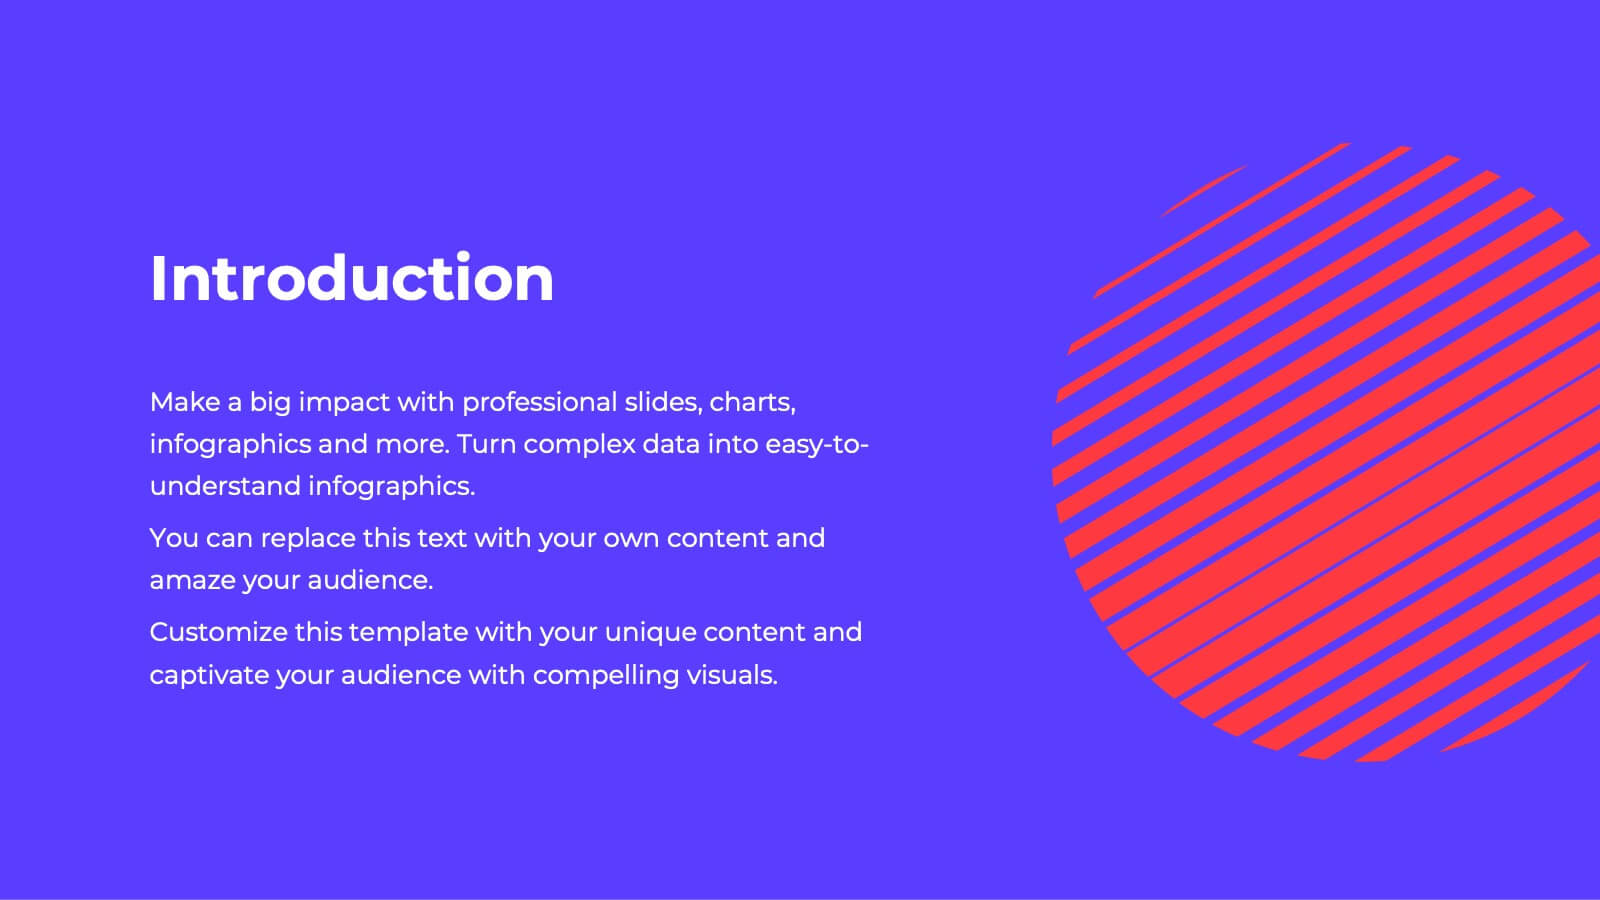
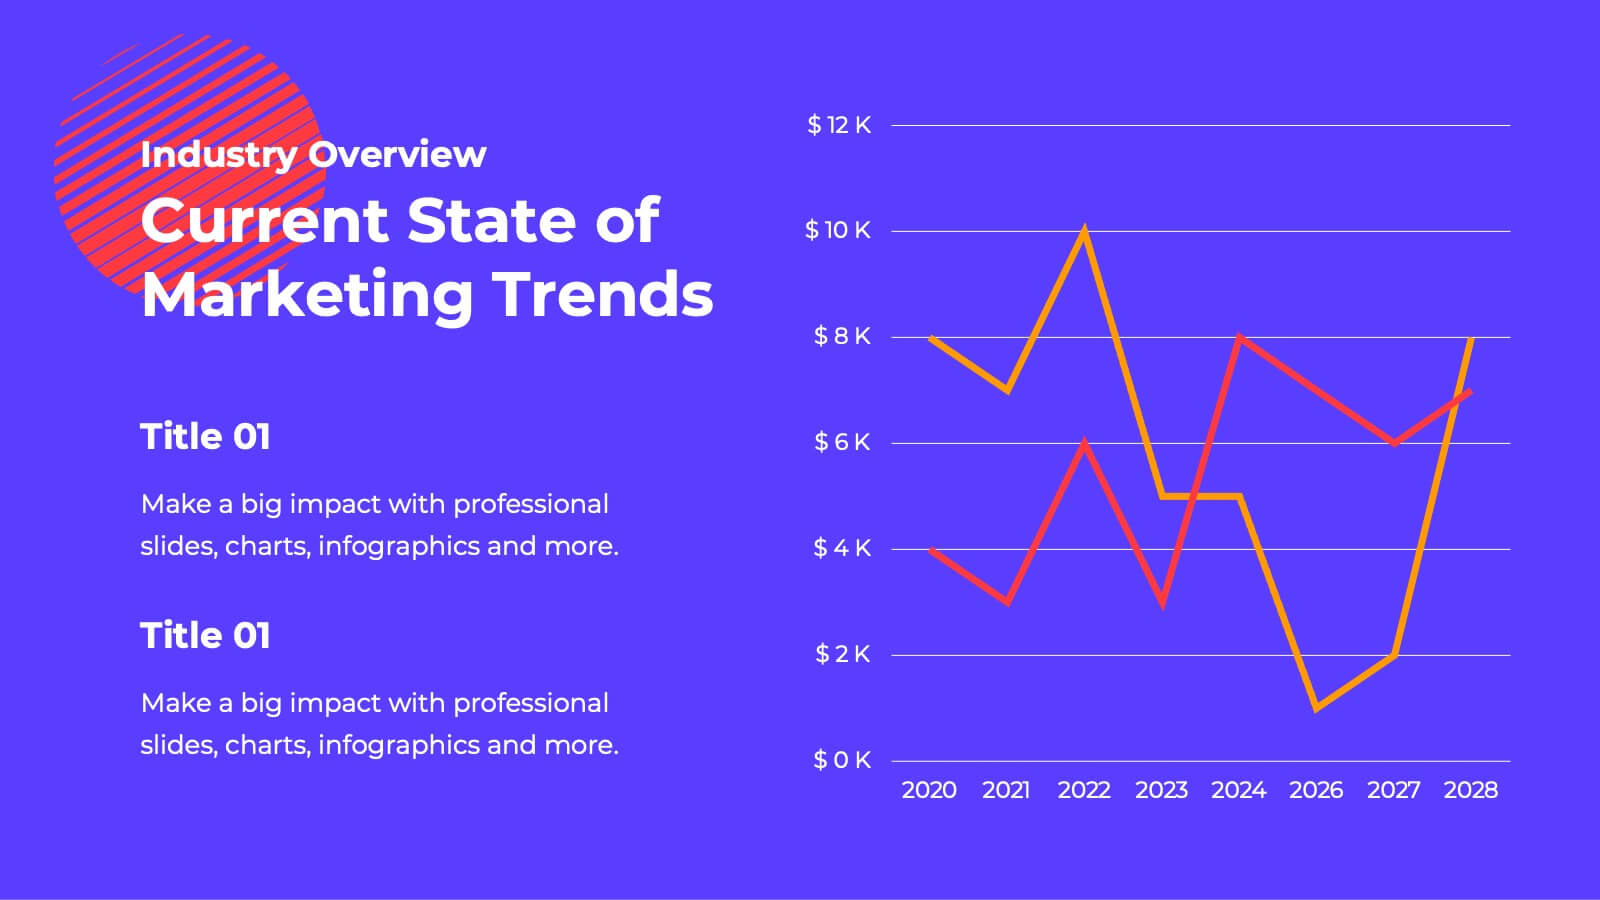
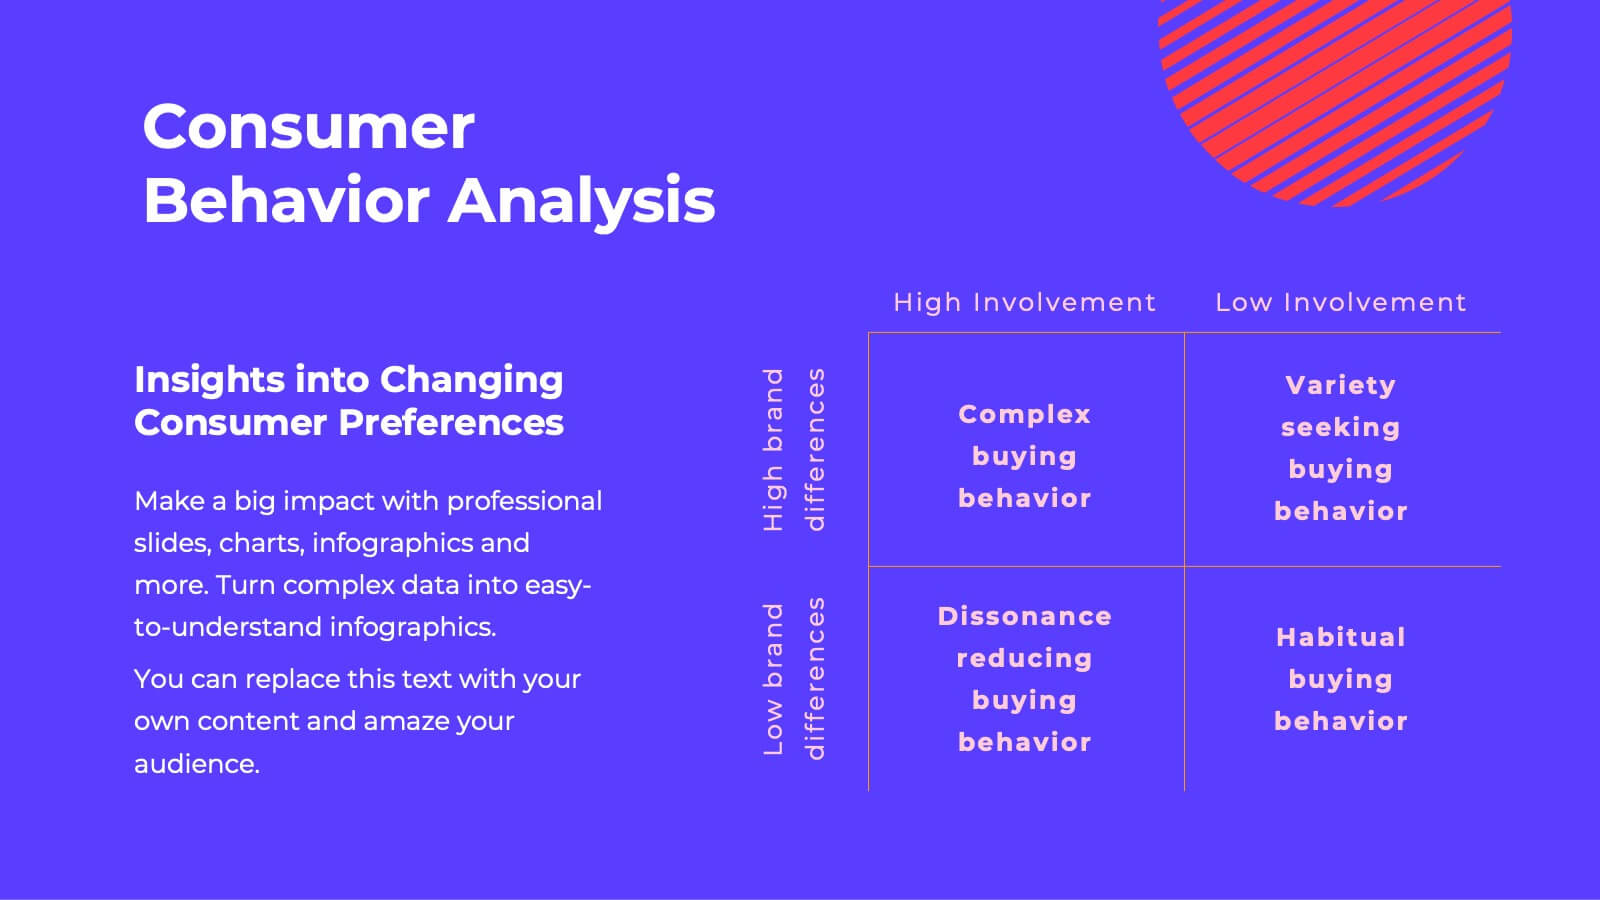
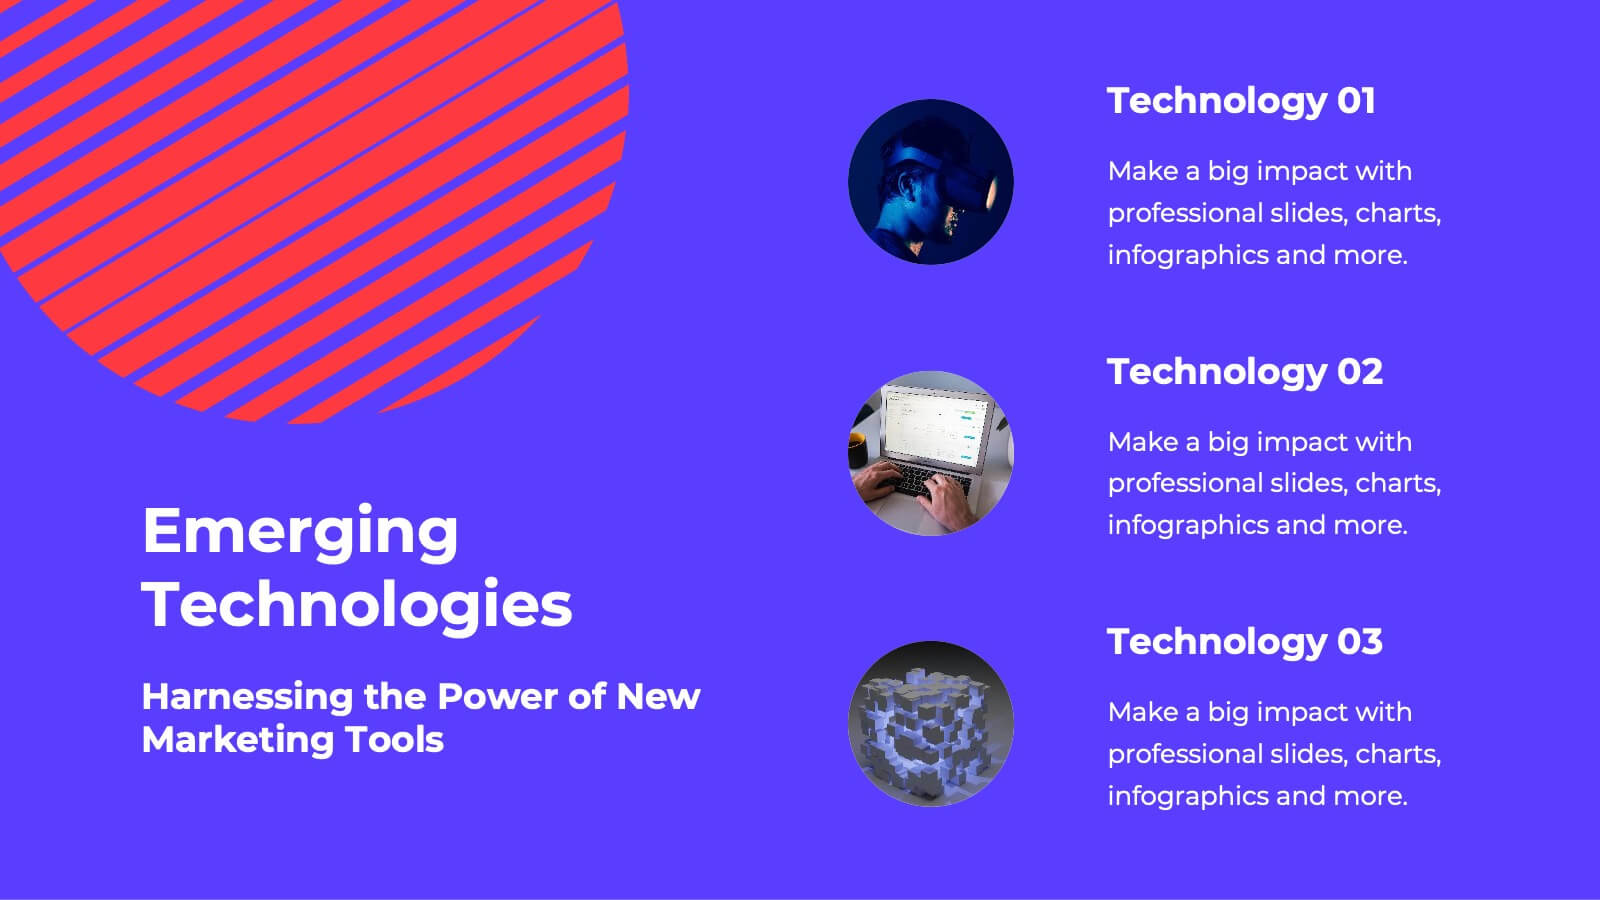
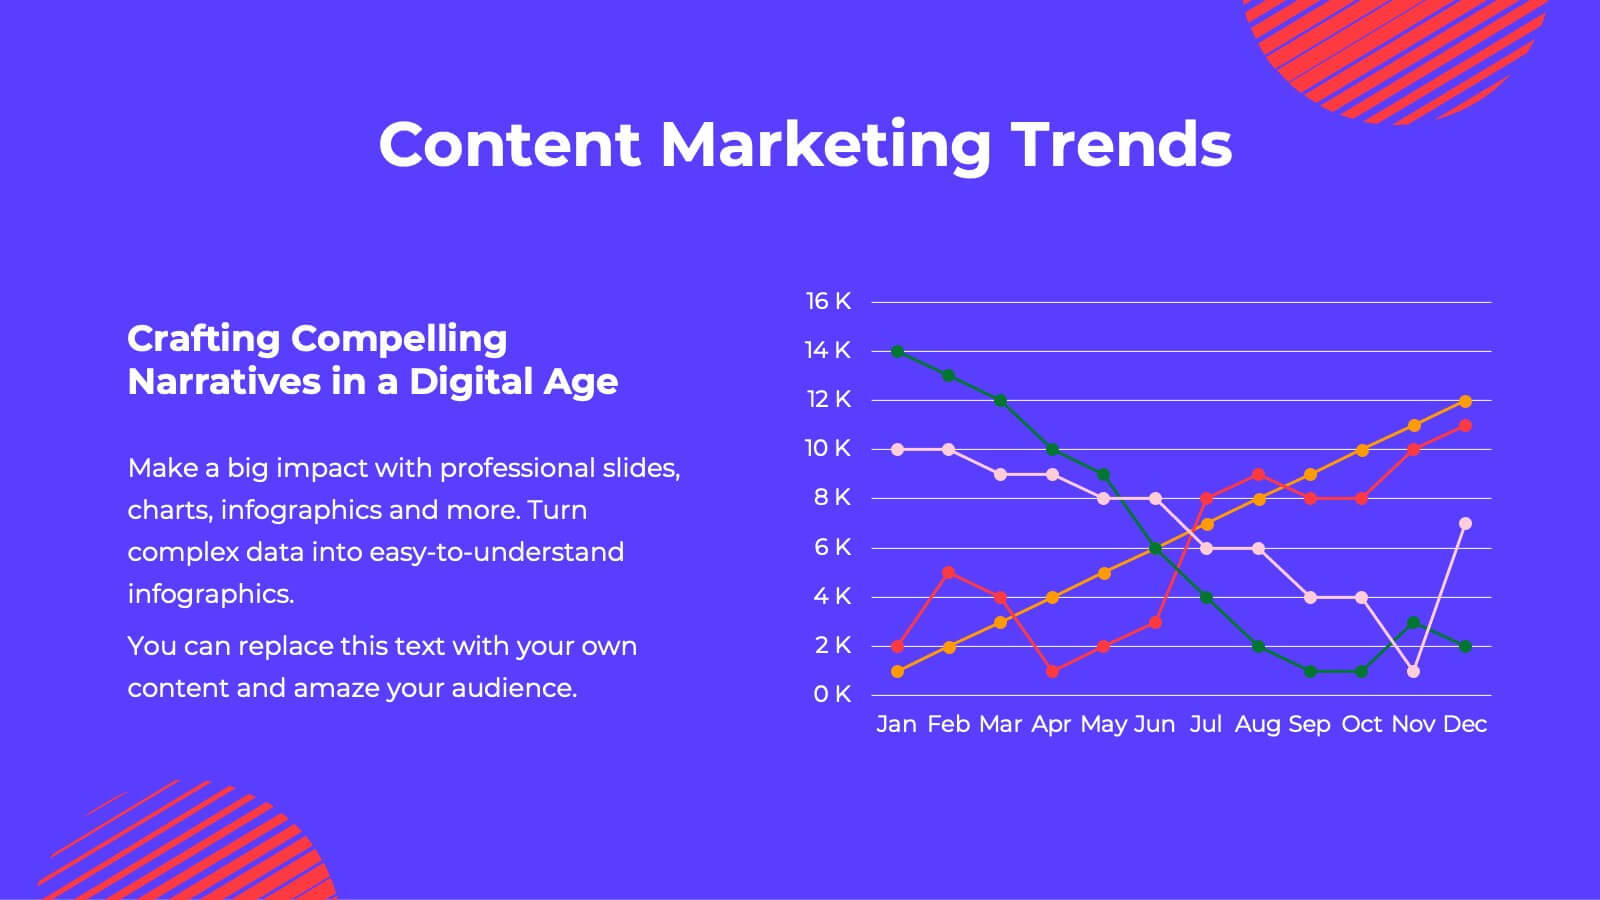
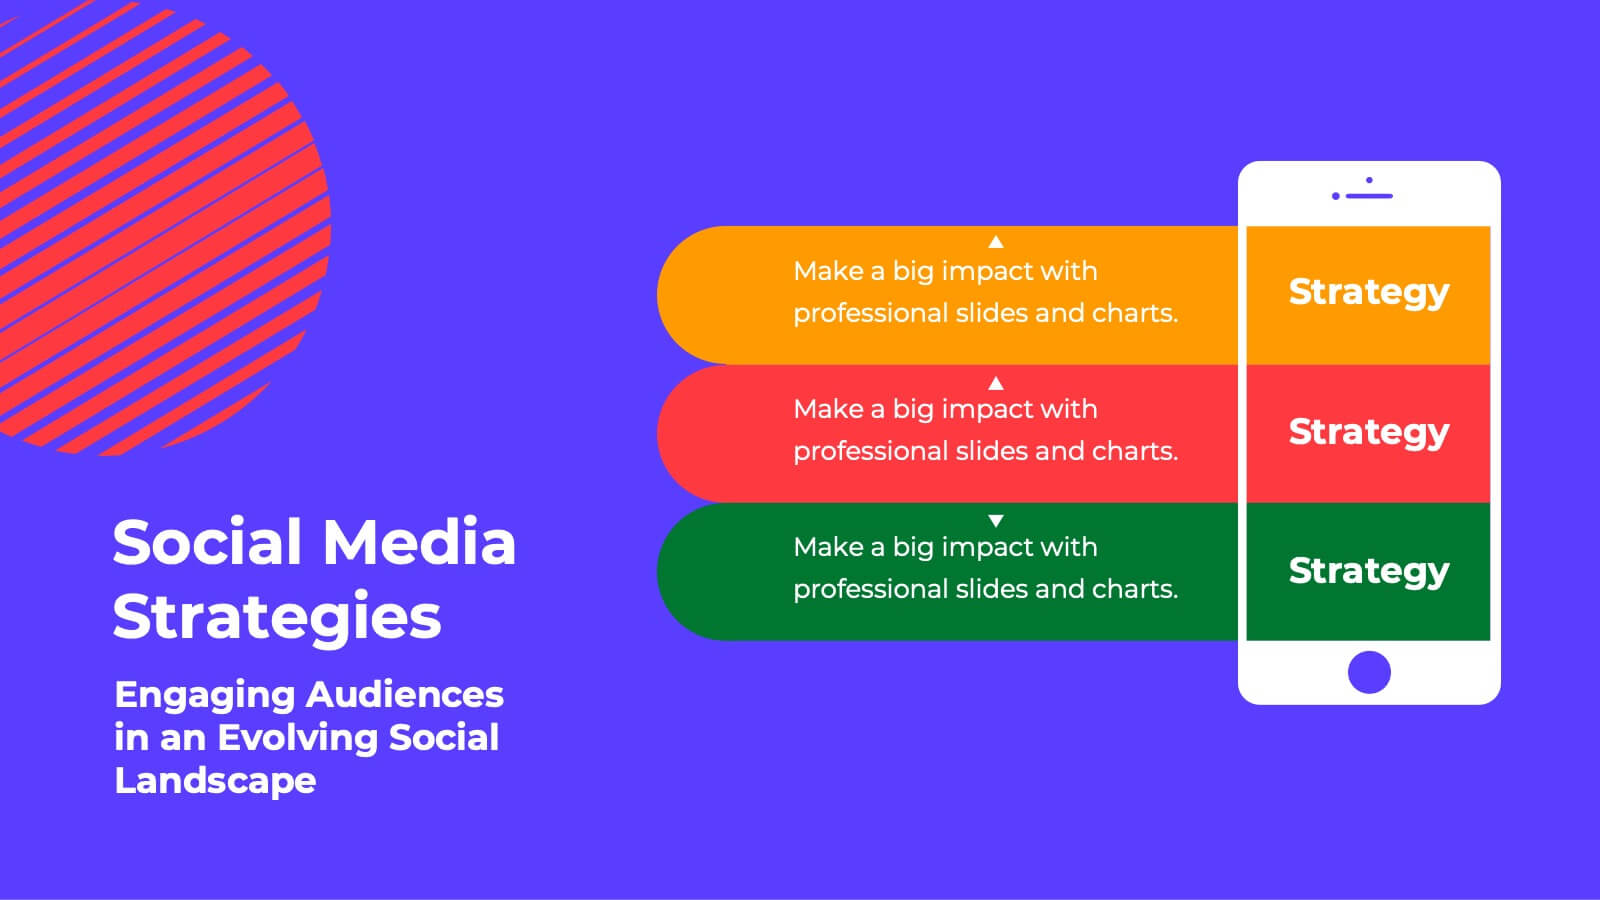
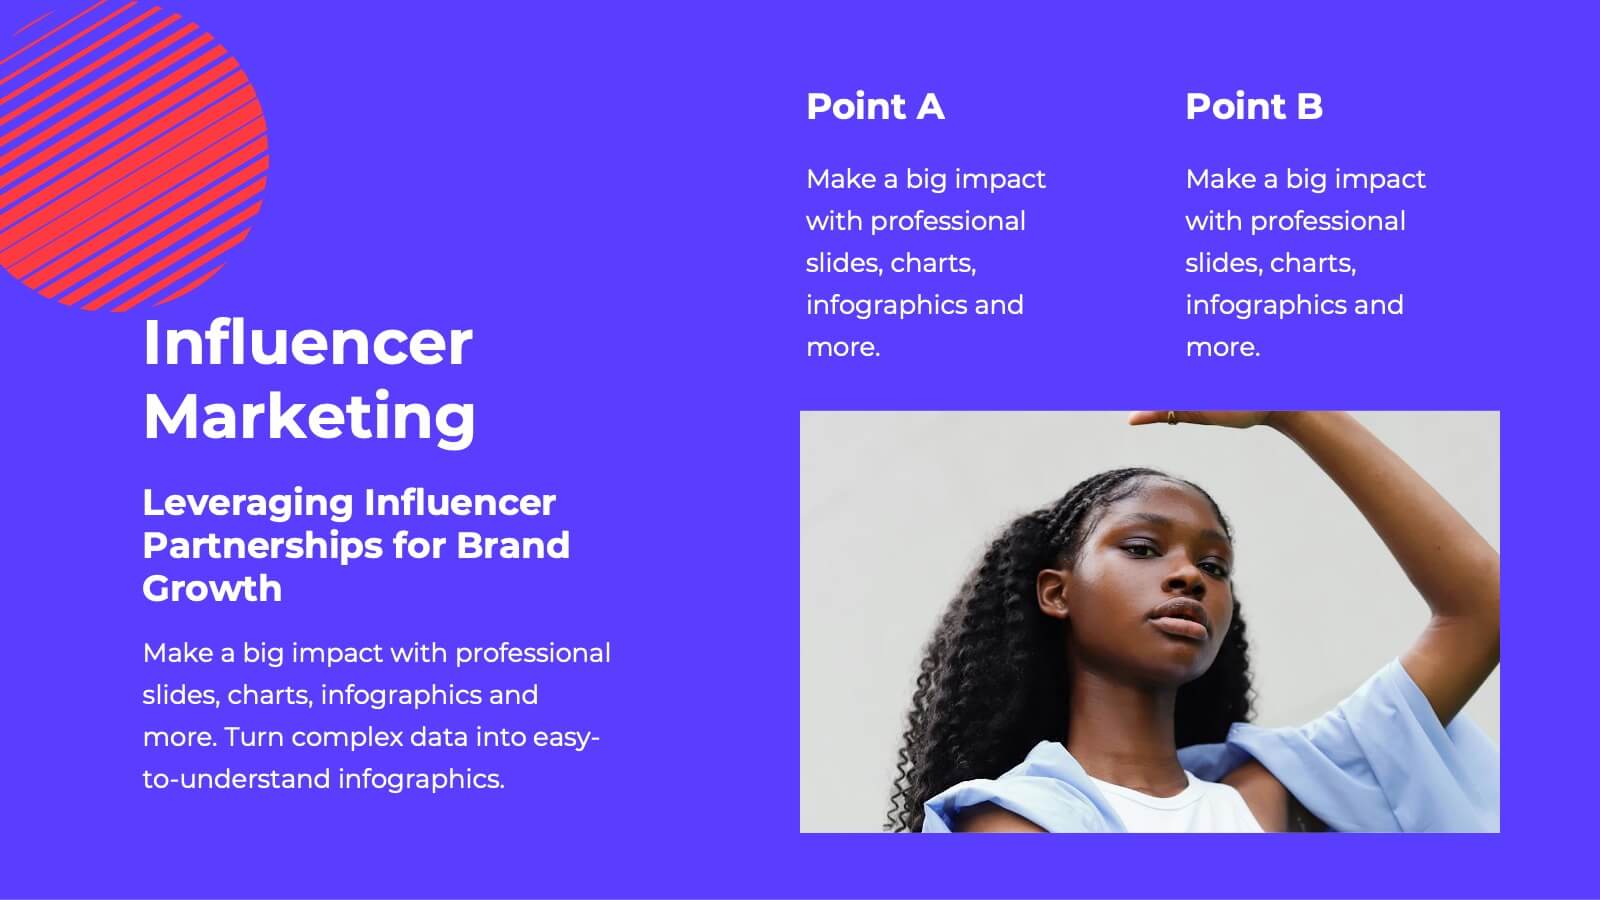
Fusion Marketing Campaign Presentation
Unleash the power of your marketing campaigns with this vibrant marketing campaign template! Dive into social media strategies, influencer marketing, data-driven insights, and more. Perfect for presenting to stakeholders and team members. Fully customizable and compatible with PowerPoint, Keynote, and Google Slides.


7 diapositivas
Human Resources Infographic Presentation Template
A human resources infographic is data related to the management of people in an organization. This template can be used to cover various HR-related topics, such as recruitment and selection, employee benefits, performance management, and career development. The purpose of our HR infographic is to communicate information in a clear and engaging way, making complex HR concepts and processes easier to understand. This well-designed infographic template can help you effectively communicate HR information, improve engagement and understanding, and support the overall success of your presentation.


4 diapositivas
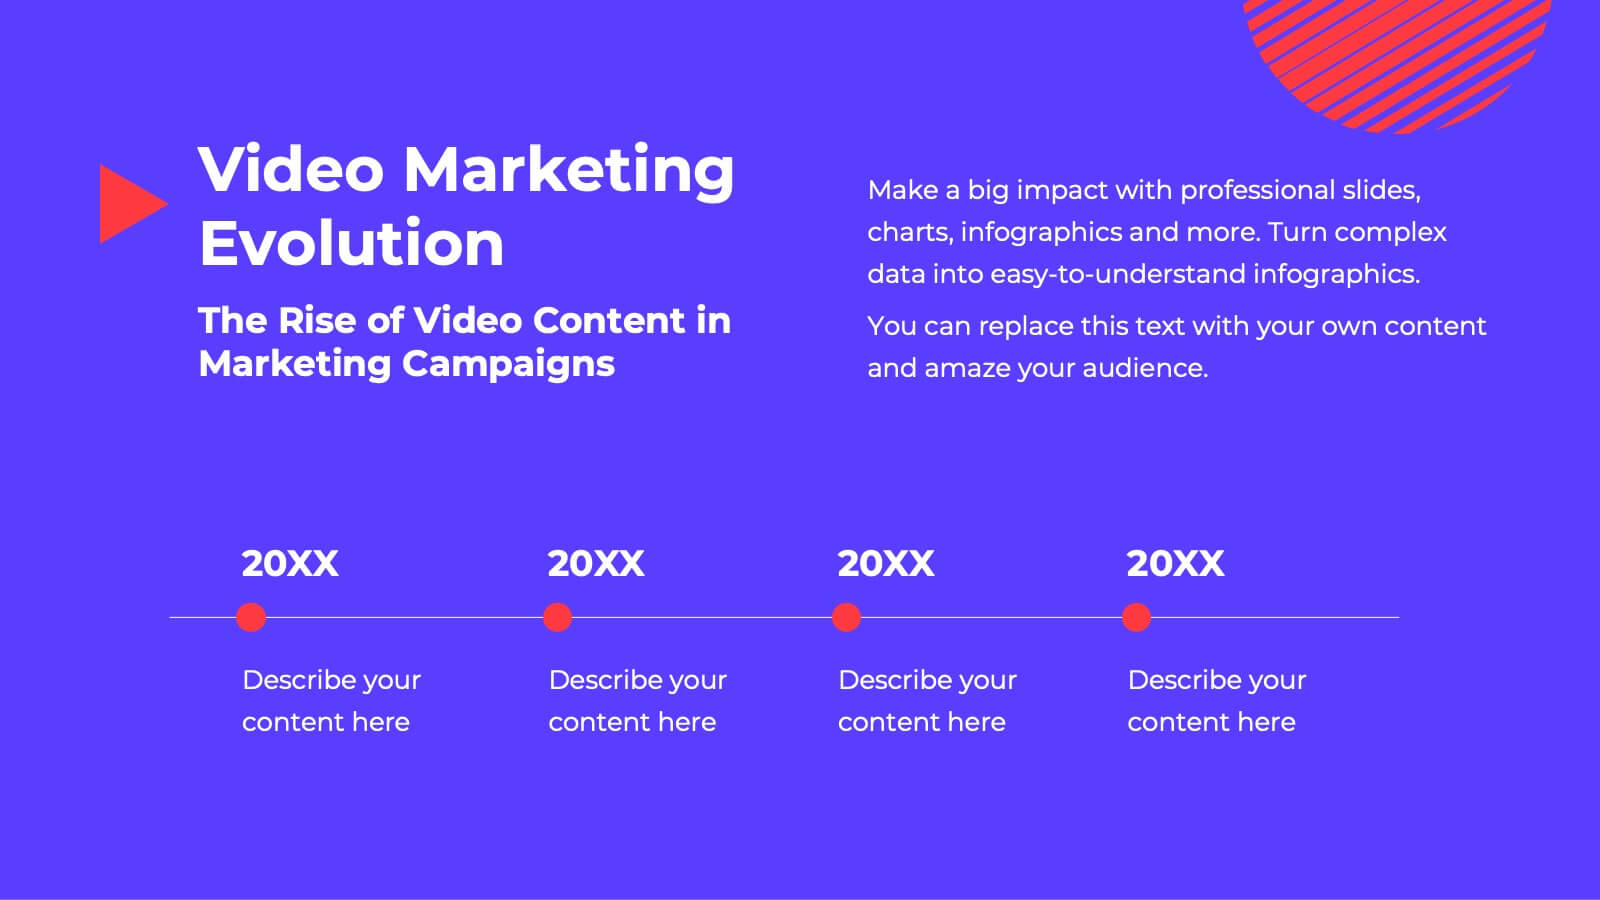
Timeline of Business Achievements Presentation
Visualize progress with clarity using the Timeline of Business Achievements Presentation. This sleek template features both horizontal and vertical timeline formats to showcase yearly milestones, step-by-step phases, and key tasks. Ideal for project reporting, strategy rollouts, and roadmap updates. Fully editable and compatible with PowerPoint, Keynote, and Google Slides.


6 diapositivas
Product and Service Options
Clearly compare your offerings with this side-by-side product vs. service infographic. Perfect for illustrating feature breakdowns, pros and cons, or key differentiators between two business models. With six customizable points and modern icons, this layout is ideal for sales decks, marketing pitches, or strategy presentations. Fully editable in PowerPoint, Keynote, and Google Slides.


6 diapositivas
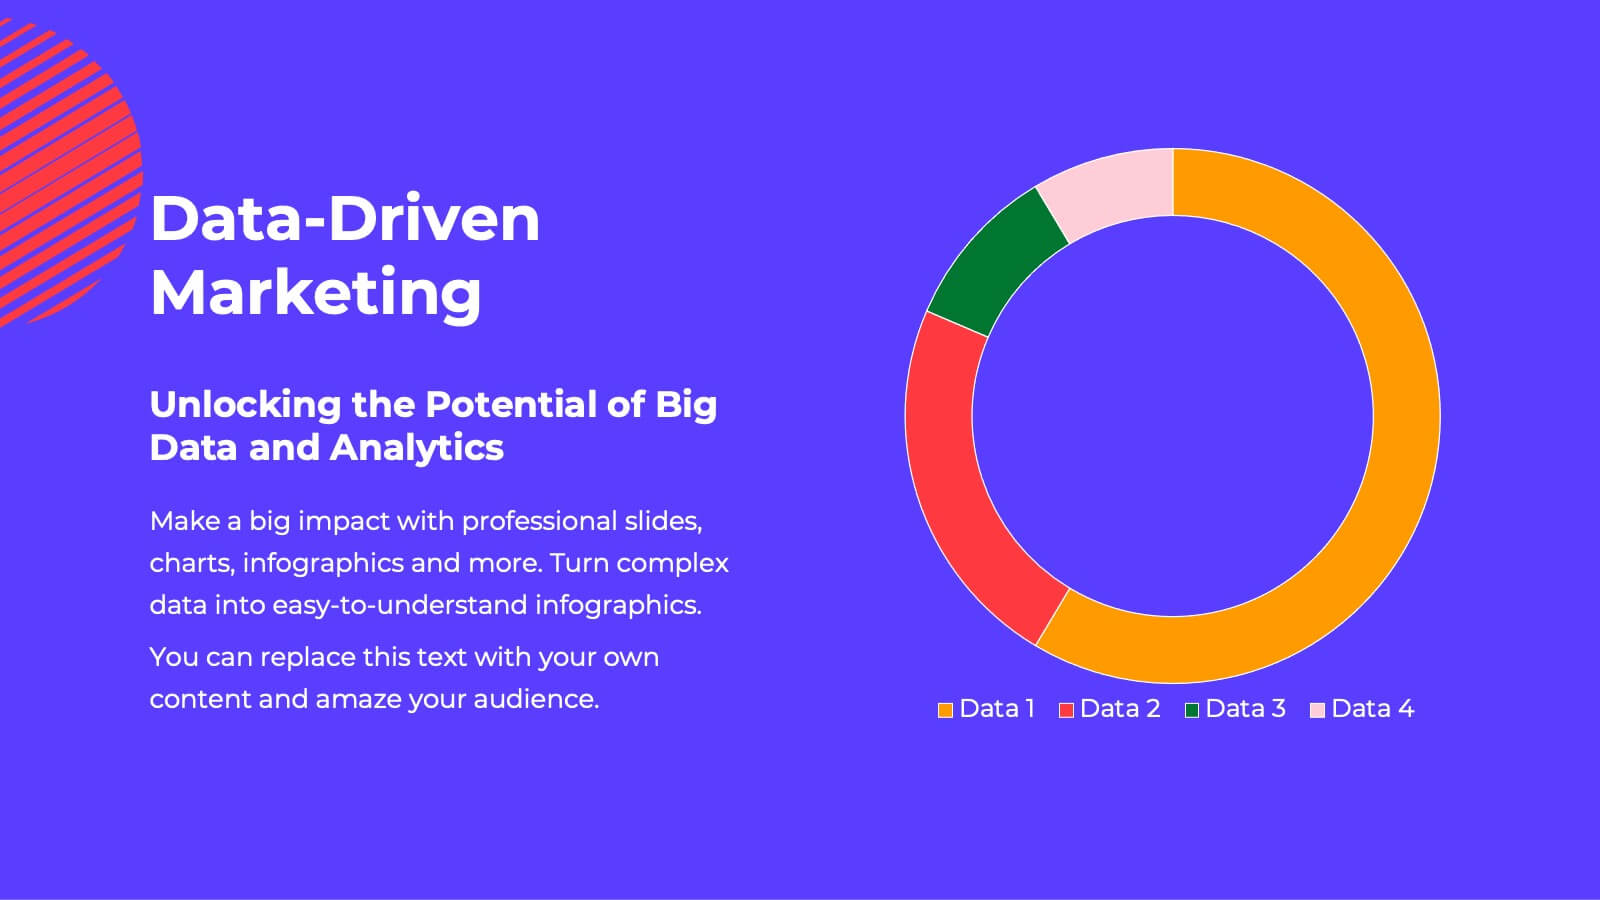
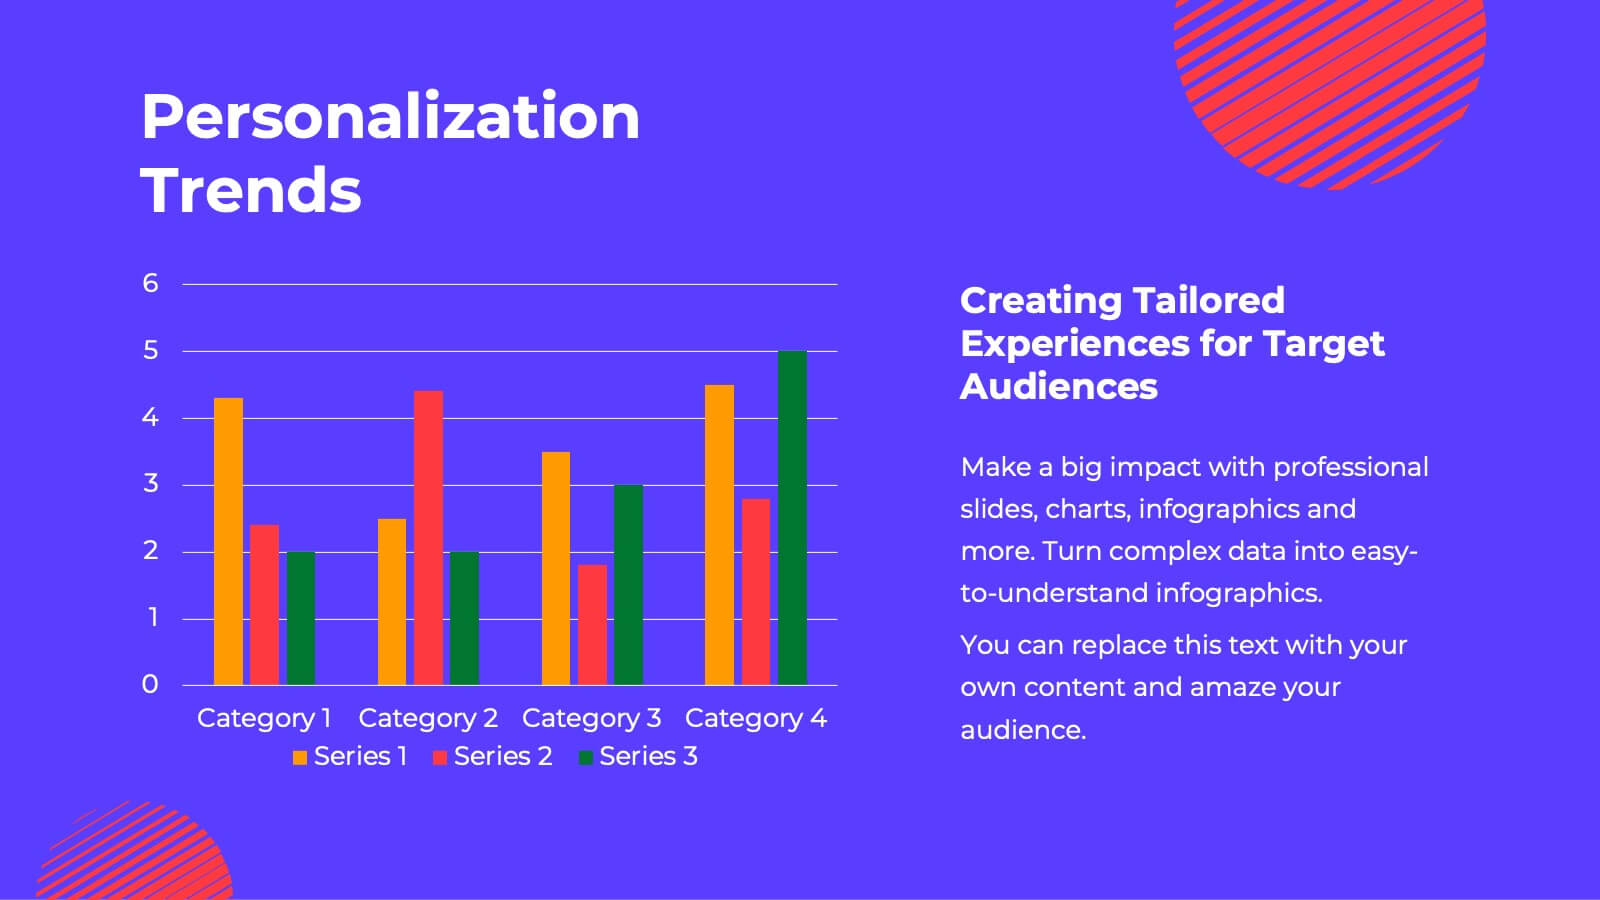
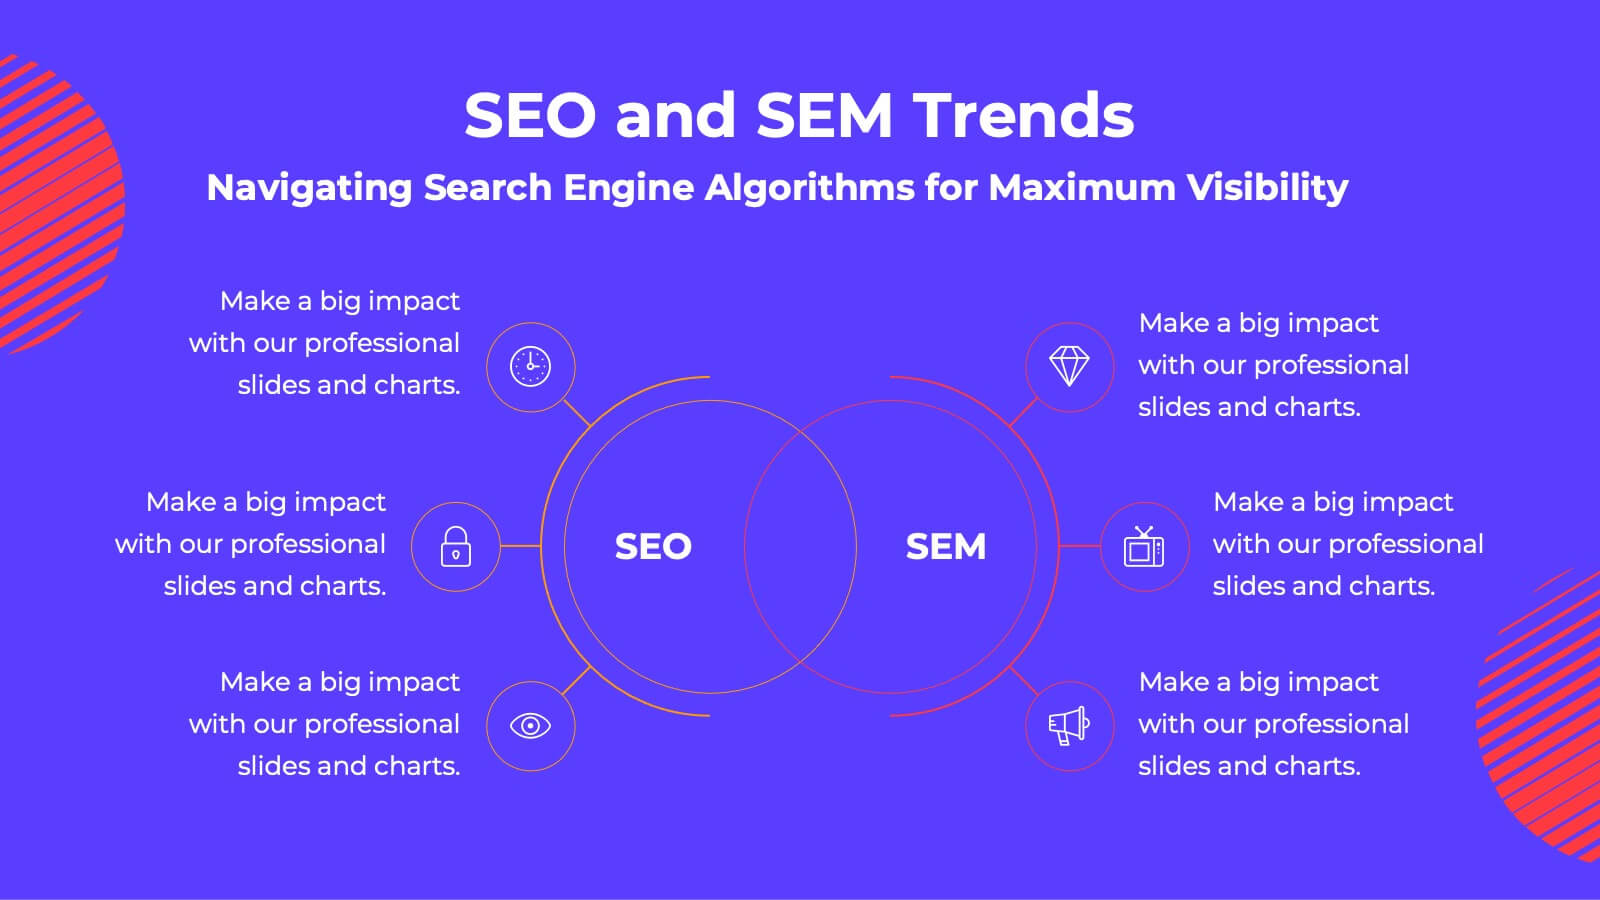
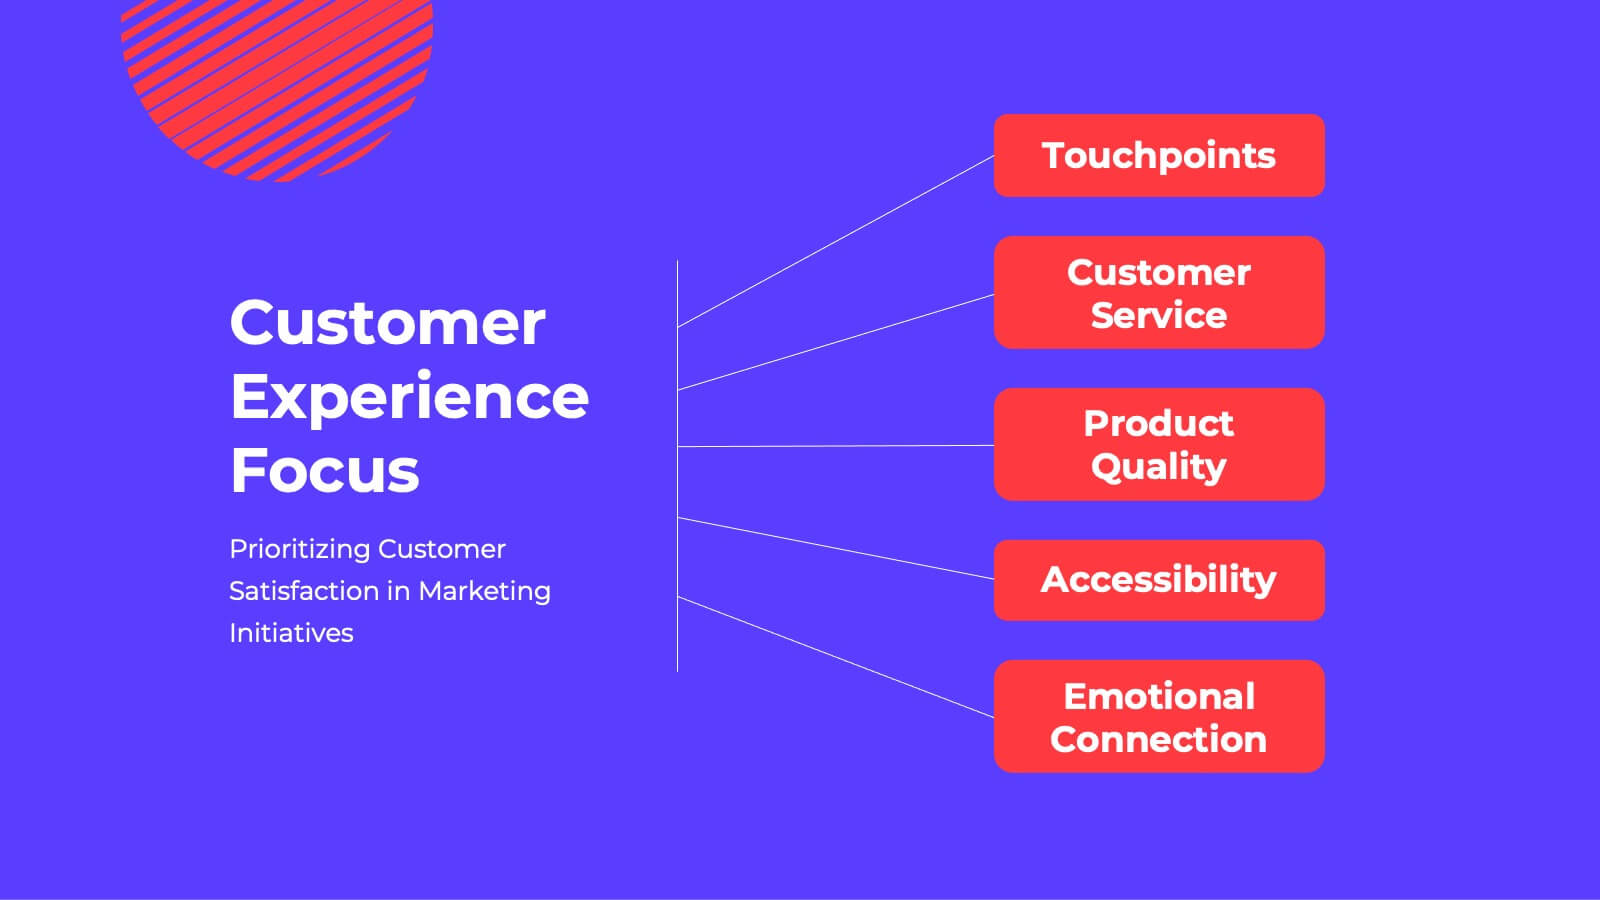
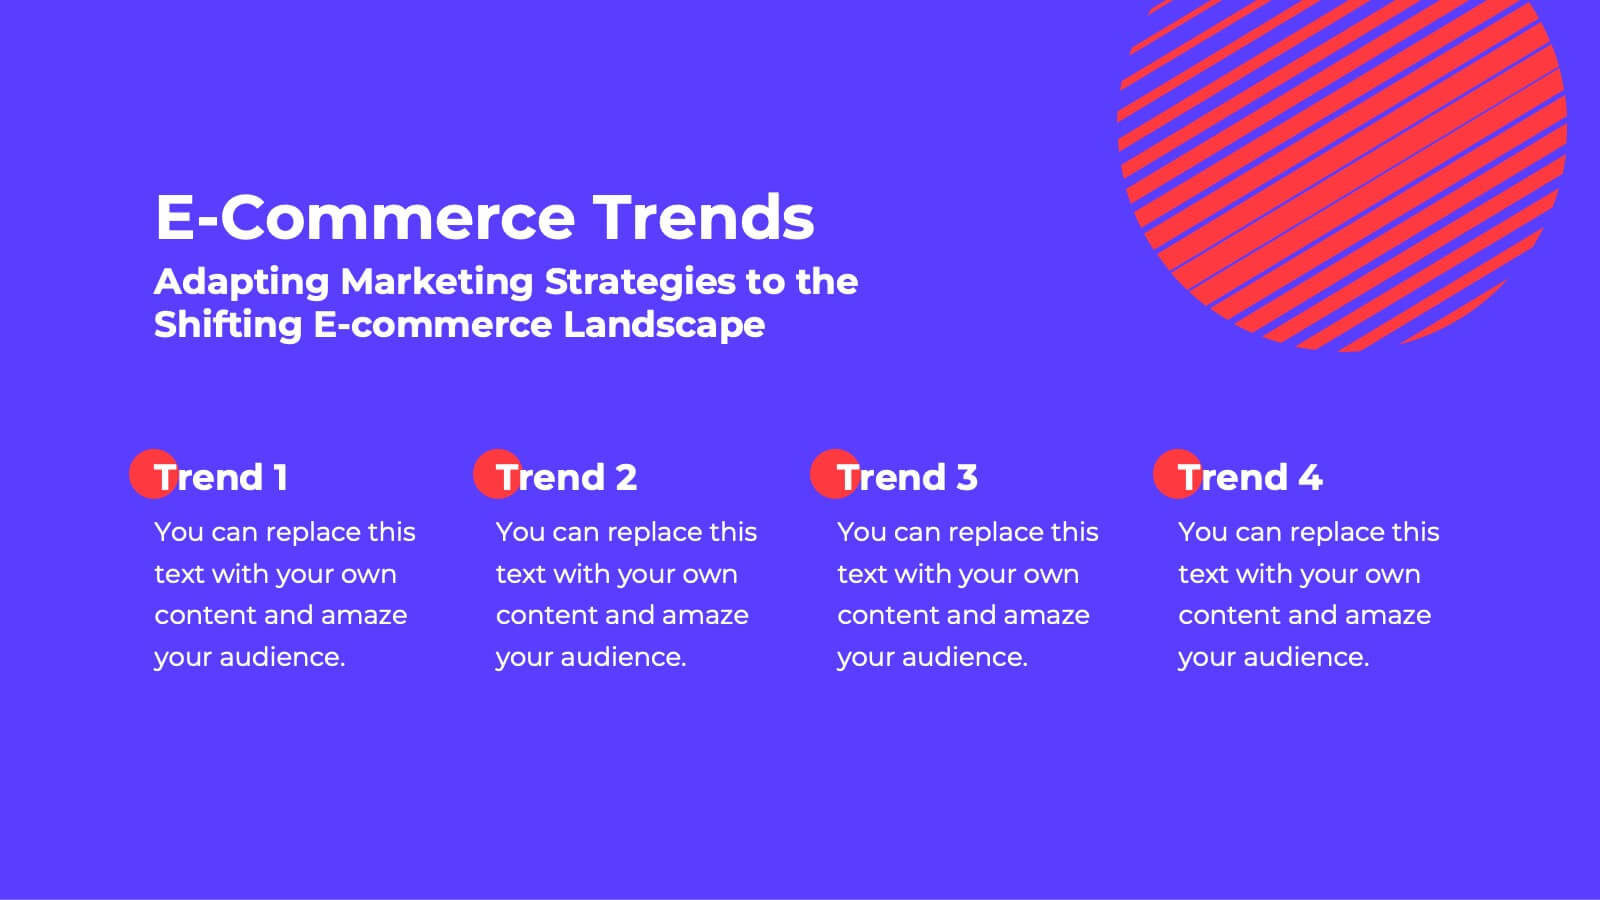
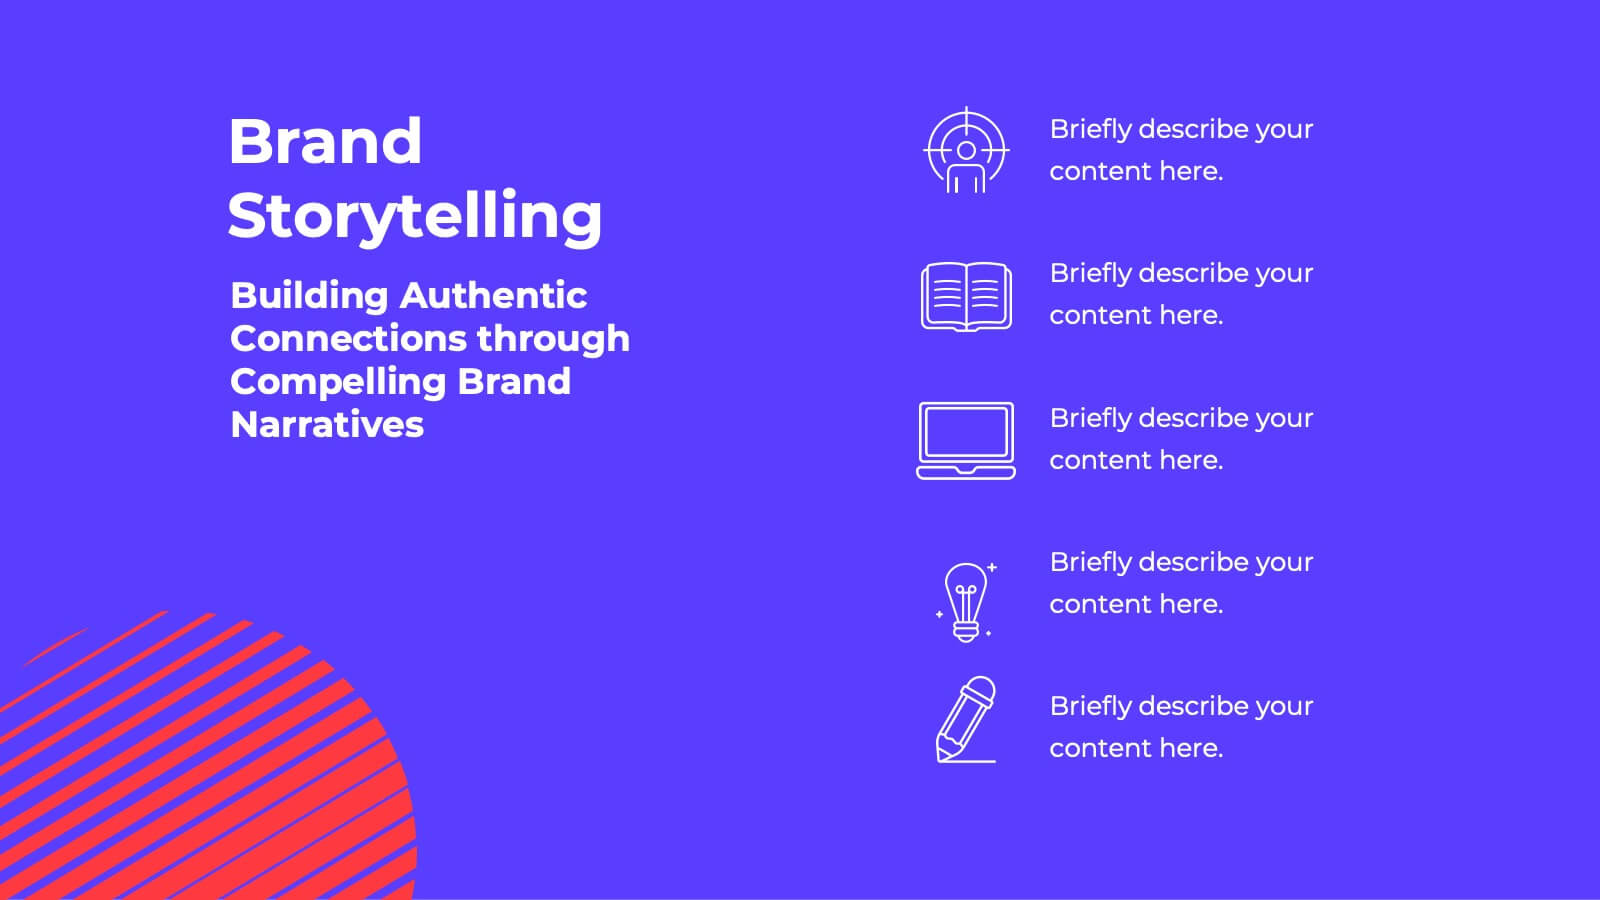
Title Hierarchy Infographic
The collection of slides is designed to efficiently convey key themes with a striking visual appeal, ensuring that crucial topics are presented with clarity and emphasis. Each slide utilizes bold typography and a unique color palette to draw attention and maintain viewer engagement. The designs incorporate dynamic shapes and minimalist layouts, enhancing the presentation's readability while emphasizing important content. This set is ideal for professionals aiming to present complex ideas in a clear and memorable way during meetings or in corporate documents. It supports various communicative goals, such as introducing concepts, outlining challenges, or promoting organizational initiatives, making it a versatile tool for enhancing message delivery in any professional setting.


2 diapositivas
Modern Title Slide for Presentation
Make a strong first impression with this Modern Title Slide design. Its bold typography, dual-tone layout, and customizable accent icons create a clean, contemporary aesthetic. Perfect for professional and creative presentations alike. Editable in PowerPoint, Keynote, and Google Slides.