


Características


¿Tienes alguna pregunta?
Recomendar


6 diapositivas
Demographic and Psychographic Segmentation Presentation
Bring your audience insights to life with a clear, data-driven design that highlights who your customers are and what drives their decisions. This presentation helps you analyze audiences by lifestyle, behavior, and demographics. Fully customizable and compatible with PowerPoint, Keynote, and Google Slides for effortless professional presentations.


6 diapositivas
Competitive Research and Strategy Review Presentation
Present your market insights with clarity using the Competitive Research and Strategy Review Presentation. This puzzle-style layout is ideal for showing strategic steps or comparing research points in sequence. Fully editable in Canva, PowerPoint, Keynote, and Google Slides, it’s perfect for marketing teams, business analysts, and strategy consultants.


6 diapositivas
Business Investment Market in Africa Map Presentation
Highlight key investment hotspots across Africa with this clean, location-based map template. Featuring labeled markers, progress bars, and editable data points, it’s ideal for showcasing project focus, regional funding, or development opportunities. Customize easily in PowerPoint, Keynote, or Google Slides to create compelling, data-driven business and finance presentations.


4 diapositivas
Scrum Team Retrospective Overview Deck Presentation
Reflect on past sprints with this structured Scrum Team Retrospective Deck. Featuring four quadrants for clear team feedback—what worked, what didn’t, ideas for improvement, and action items. Ideal for agile coaches and team leads. Fully editable in PowerPoint, Keynote, and Google Slides to match your team's review process.


22 diapositivas
Starlit Agency Portfolio Presentation
The Starlit Agency Portfolio template is a sophisticated way to highlight your agency's expertise, achievements, and creative vision! Perfect for presenting to potential clients or partners, this template starts with a polished introduction and an "About Us" section that clearly defines your agency's mission and vision. Showcase your team's skills and services in an organized manner, making it easy for clients to understand what you offer. With slides dedicated to client success stories, case studies, and market analysis, you can build trust by displaying your proven track record. Highlight industry trends and your agency's approach to creative processes to demonstrate your strategic thinking. The template also includes sections for strategy development, campaign execution, and measurement analytics, ensuring you cover all aspects of your services. Close with client testimonials, partnership opportunities, and a future outlook, leaving your audience impressed. This template is fully compatible with PowerPoint, Keynote, and Google Slides, making it versatile and easy to use for any presentation.


19 diapositivas
Sales Proposal Presentation
Secure your next big deal with our Sales Proposal presentation template, tailored to make your pitch unforgettable. It's a comprehensive toolkit for sales professionals designed to address every aspect of your offering. The slides smoothly guide your audience through your company overview, mission, product or service features, and the solutions you provide to the client's problems. They are meticulously structured to help you outline your value proposition, address customer pain points, and present a convincing case with customer testimonials. The design is not just visually appealing but also conducive to narrative flow, presenting cost and pricing details with clarity, and allowing room for engaging Q&A sessions. This template is ideal for sales pitches, adaptable across PowerPoint, Keynote, and Google Slides. It helps you build a persuasive argument for why your solution is the best fit for the client, providing a professional edge in a competitive marketplace.

20 diapositivas
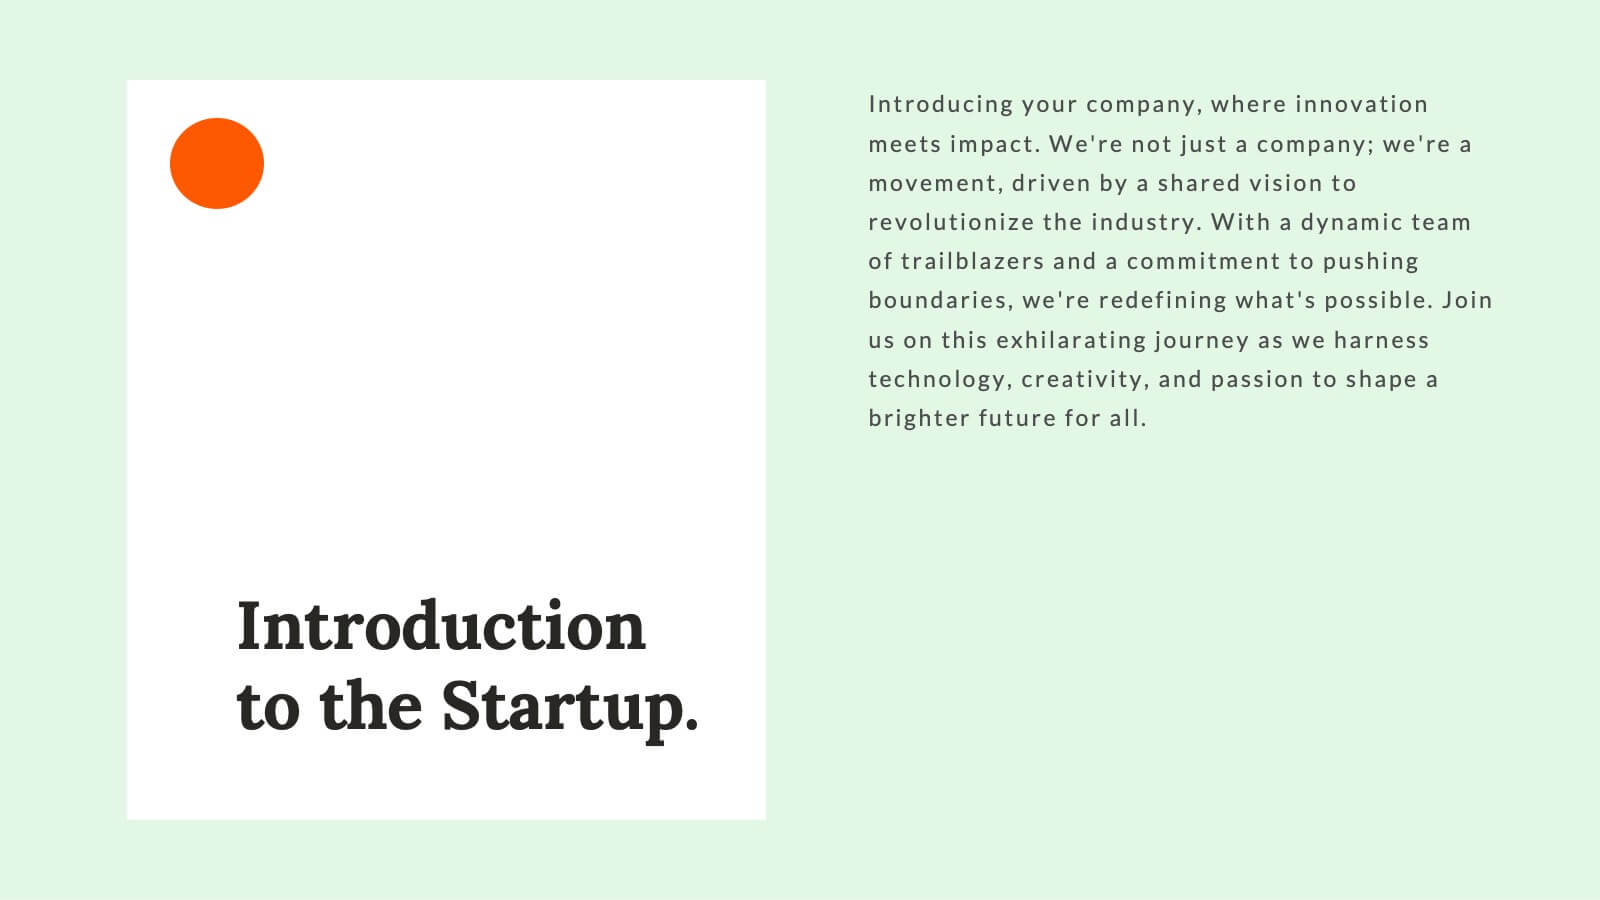
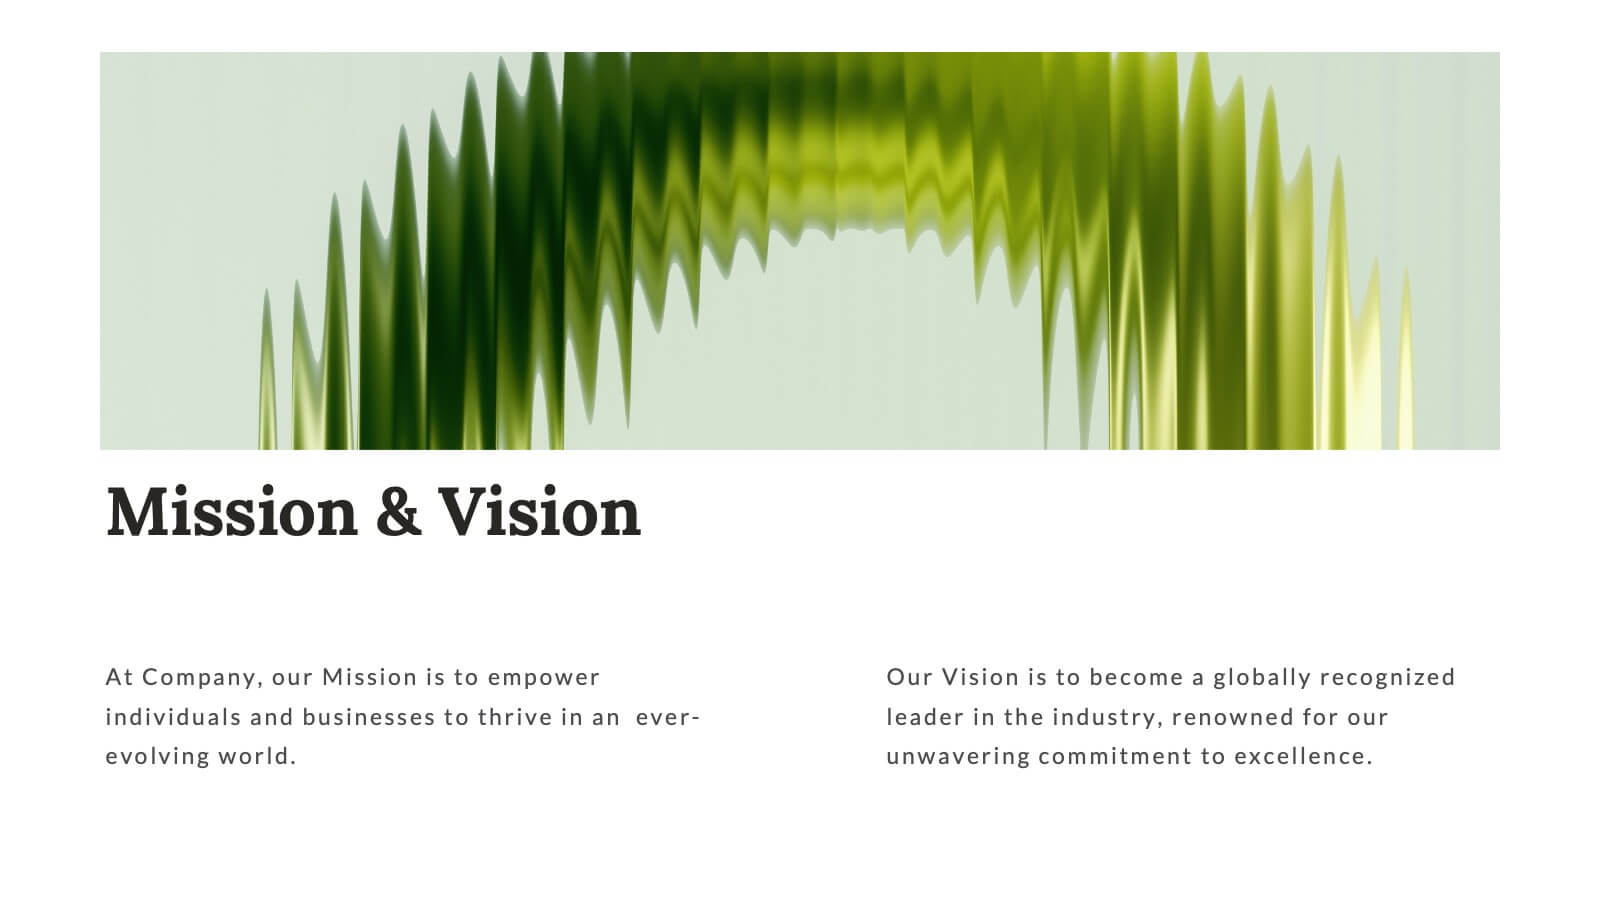
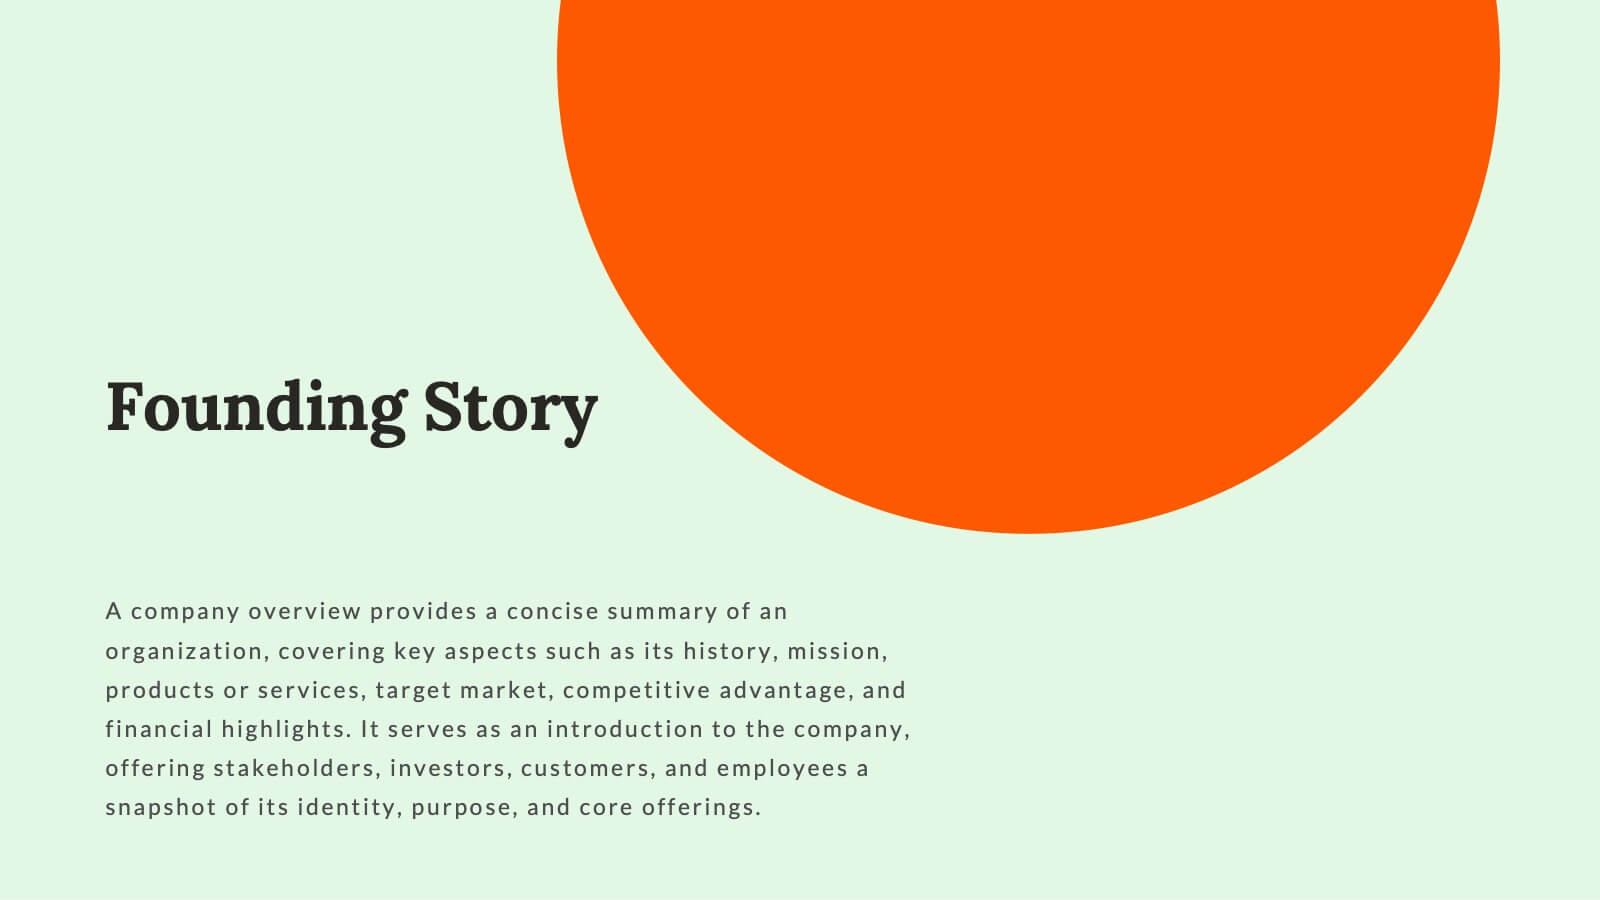
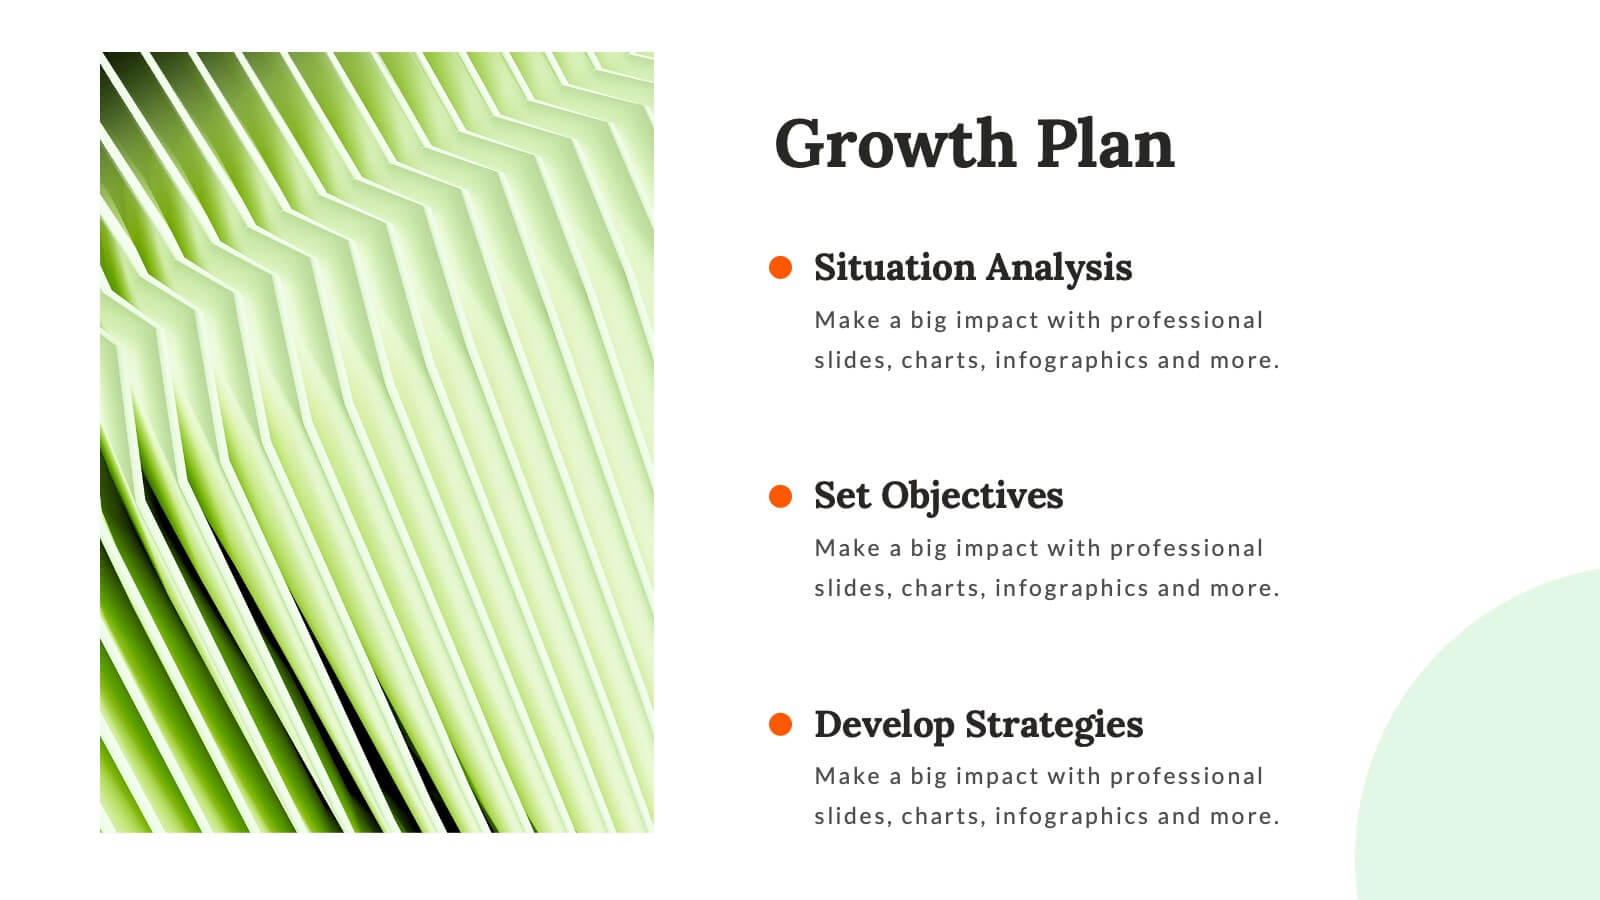
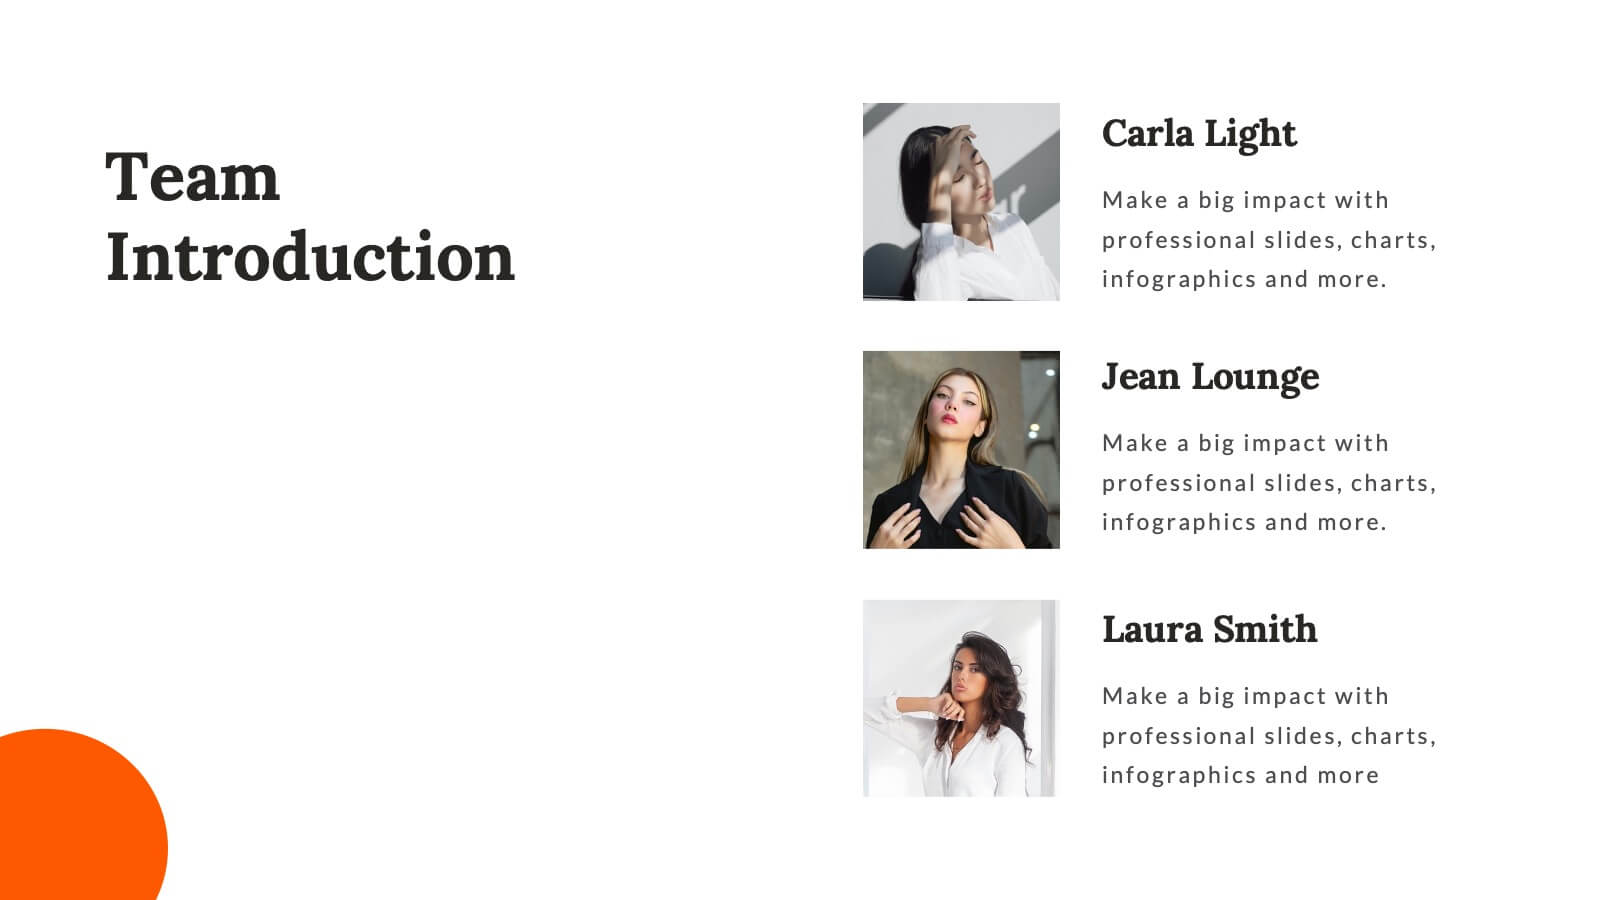
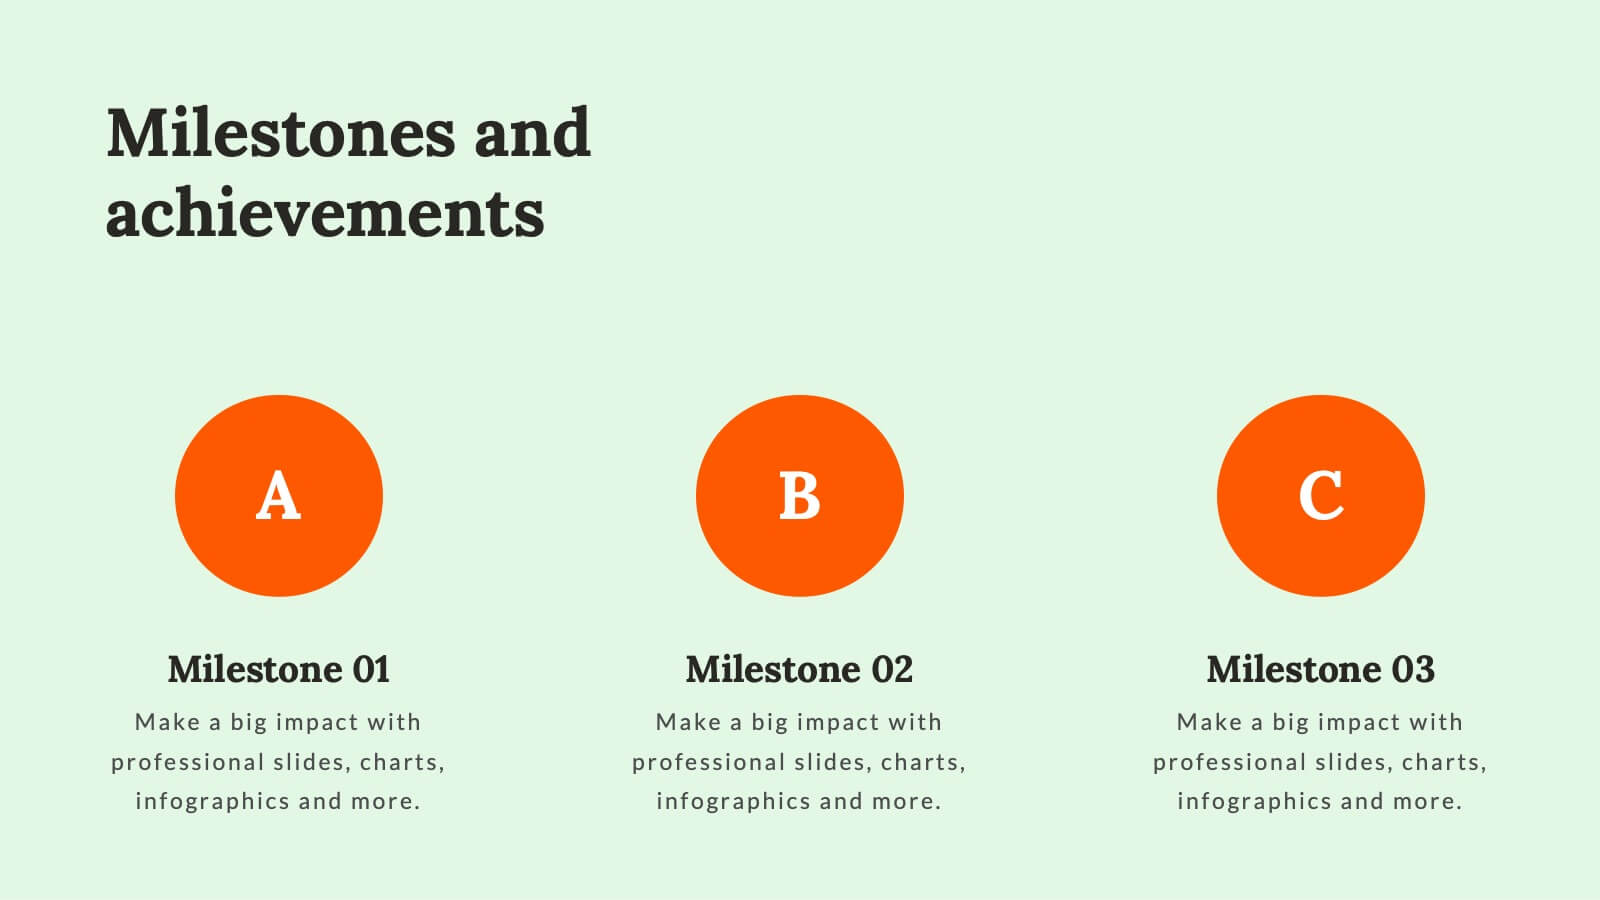
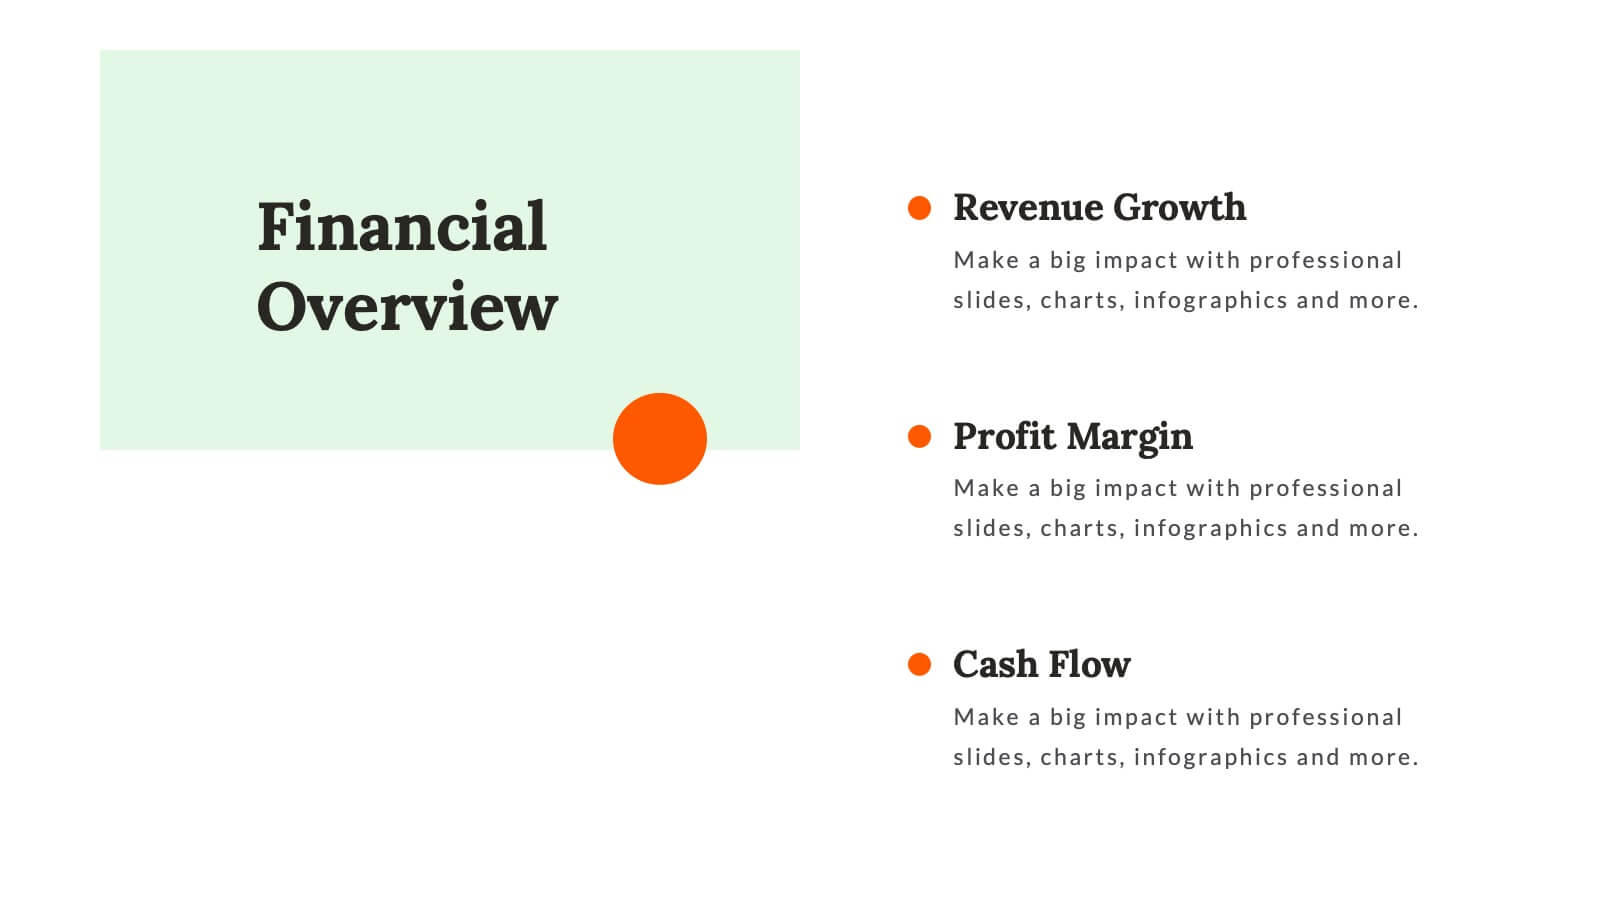
Whirlwind Startup Funding Proposal Presentation
Transform your startup funding proposals with this vibrant and professional template. Designed to impress potential investors, it features sections for mission & vision, founding story, market analysis, and financial overview. Highlight your unique value proposition and business model with clarity and style. This template is compatible with PowerPoint, Keynote, and Google Slides, ensuring seamless presentations on any platform. Perfect for conveying your innovative ideas and growth plans effectively.


21 diapositivas
Fahrenheit Scientific Research Presentation
Present your findings with clarity using this scientific research presentation template. Designed for researchers, it includes sections for objectives, methodology, data analysis, results, and recommendations. Perfect for academic and professional use, this template ensures a polished, organized presentation and is fully compatible with PowerPoint, Keynote, and Google Slides.


3 diapositivas
Customer Relationship Mapping Presentation
Visualize connections across your supply chain with the Customer Relationship Mapping Presentation. This slide helps illustrate how your group interacts with suppliers and customers, making it ideal for operational overviews, relationship management, or partner presentations. Fully editable in PowerPoint, Keynote, and Google Slides.


6 diapositivas
Funding and Return on Investment Overview Presentation
Showcase your funding strategy and ROI journey with this growth-themed infographic. The plant-inspired design visually represents financial progress across six stages, making it perfect for startups, business proposals, or investor updates. Fully editable in PowerPoint, Google Slides, and Keynote for seamless customization and a polished, professional presentation experience.


12 diapositivas
Cloud-Based Digital Transformation Presentation
Illustrate your path to digital evolution with this multi-cloud infographic layout. Perfect for visualizing service integrations, SaaS environments, or migration strategies, this slide highlights five key areas of transformation using cloud-shaped icons and a central connectivity hub. Fully customizable in PowerPoint, Keynote, and Google Slides.


8 diapositivas
Team OKRs Planning and Monitoring Presentation
Foster alignment across teams with the Team OKRs Planning and Monitoring Presentation. This creative hand-shaped visual helps illustrate collaboration between objectives, key results, and responsibilities. Ideal for performance check-ins, OKR workshops, and team planning meetings. Fully customizable in PowerPoint, Canva, Keynote, and Google Slides for seamless integration.


25 diapositivas
The Future of Retail Presentation Template
Step into the next generation of commerce with this sleek and modern presentation template exploring the future of retail! Designed to showcase trends, innovations, and strategies shaping the retail landscape, this template offers a perfect balance of visual appeal and clarity. With customizable charts, data-driven infographics, and professional layouts, it’s ideal for presenting market insights, technology integration, and consumer behavior shifts. Bold colors and contemporary design elements create a dynamic flow, keeping your audience engaged while emphasizing key points. Perfect for entrepreneurs, analysts, or educators, this template adapts to a variety of topics with ease. Fully compatible with PowerPoint, Keynote, and Google Slides, it ensures your presentation is as forward-thinking as the ideas you share


2 diapositivas
End Slide with Contact and Gratitude Message Presentation
Say goodbye with impact and leave a lasting impression! This clean, modern slide is perfect for ending presentations with a clear contact section and a heartfelt thank-you message. Ideal for client decks, proposals, or reports. Fully compatible with PowerPoint, Keynote, and Google Slides for easy editing and customization.


21 diapositivas
Luminor Project Timeline Presentation
Stay on track and achieve your goals with this dynamic project timeline presentation template. It provides a clear structure to outline key milestones, objectives, budget breakdown, risk management, and resource allocation, ensuring seamless project execution. The modern and professional design enhances communication with stakeholders and team members alike. Fully customizable and compatible with PowerPoint, Keynote, and Google Slides.


4 diapositivas
Creative Thinking and Brain Functions Presentation
Illuminate cognitive processes with the Creative Thinking and Brain Functions Presentation. Featuring a clean mind map-style layout with illustrated heads and title blocks, this slide is ideal for showcasing mental models, decision paths, or concept relationships. Fully editable in PowerPoint, Canva, and Google Slides for effortless customization.


14 diapositivas
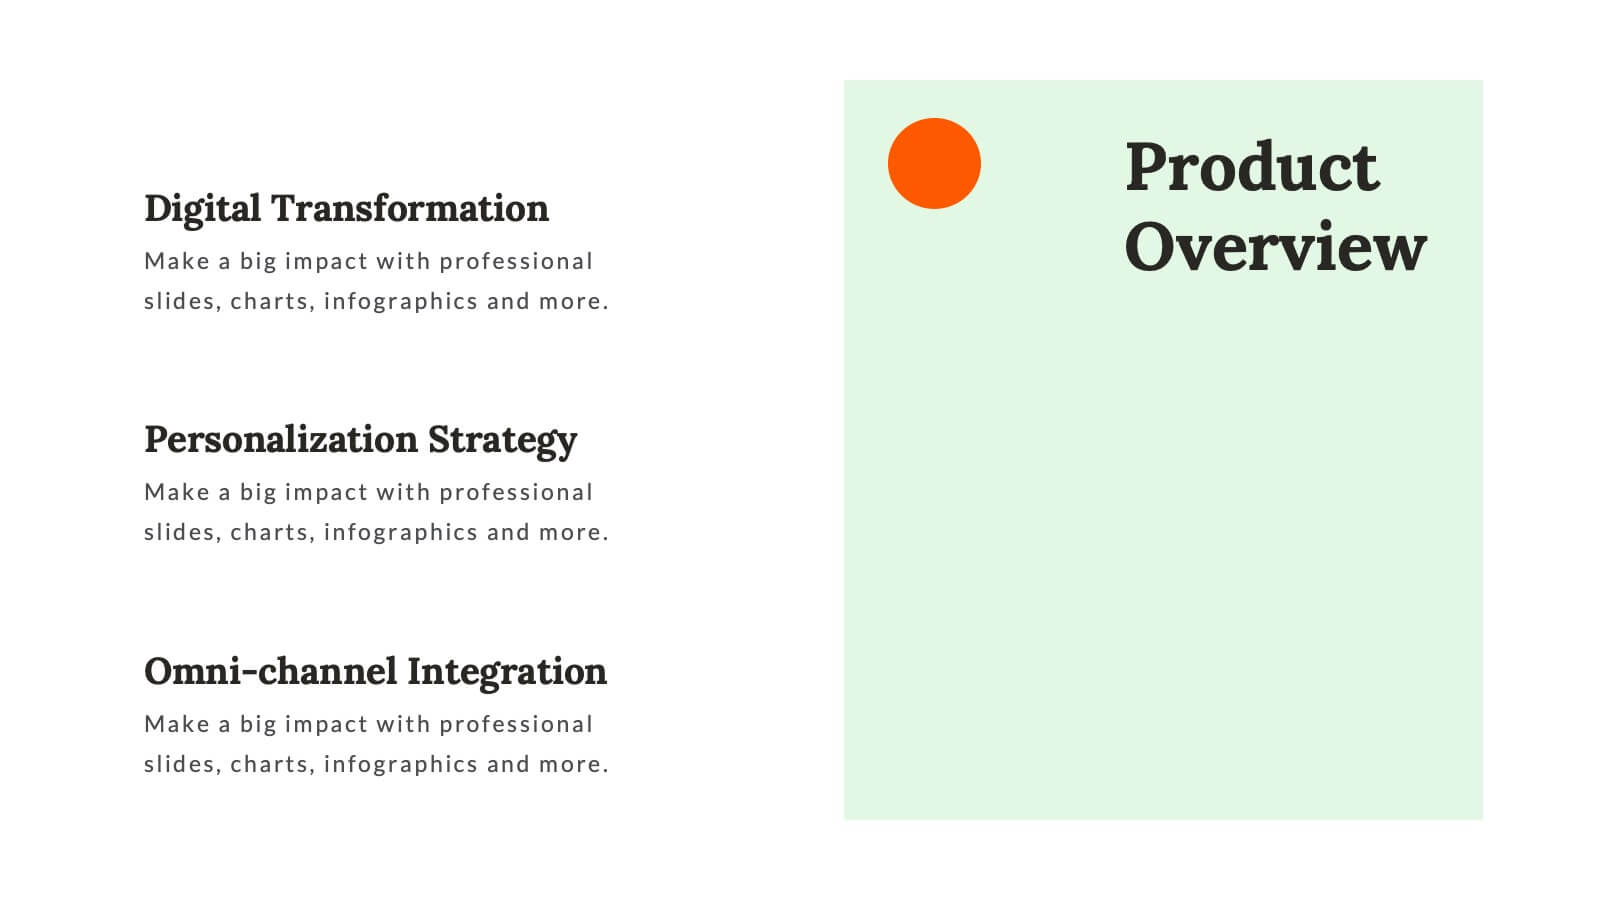
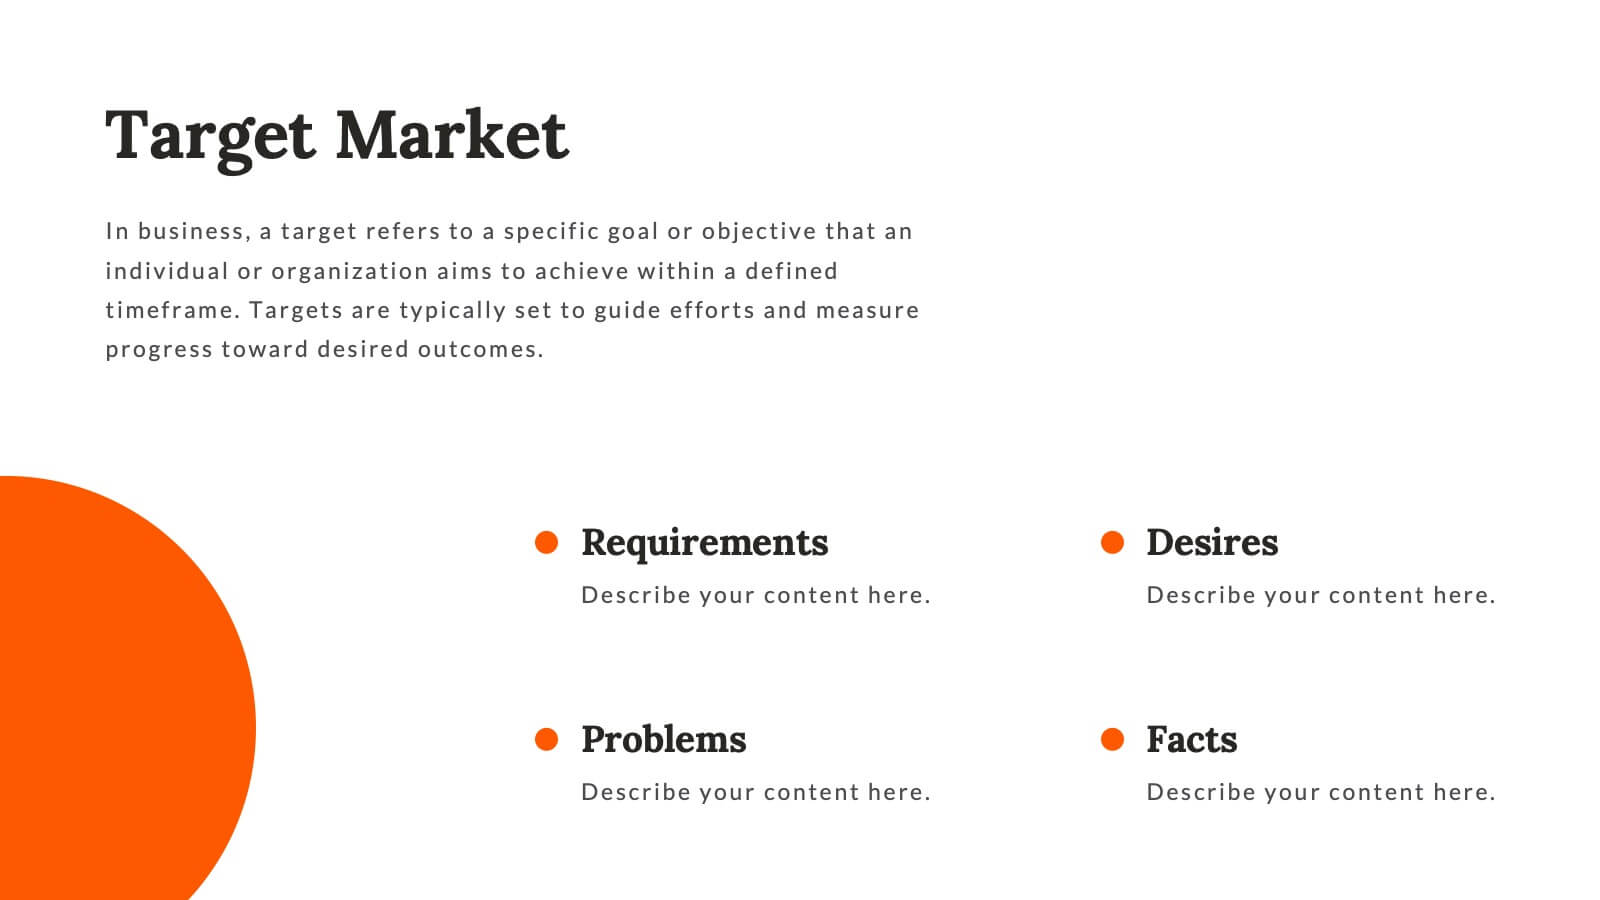
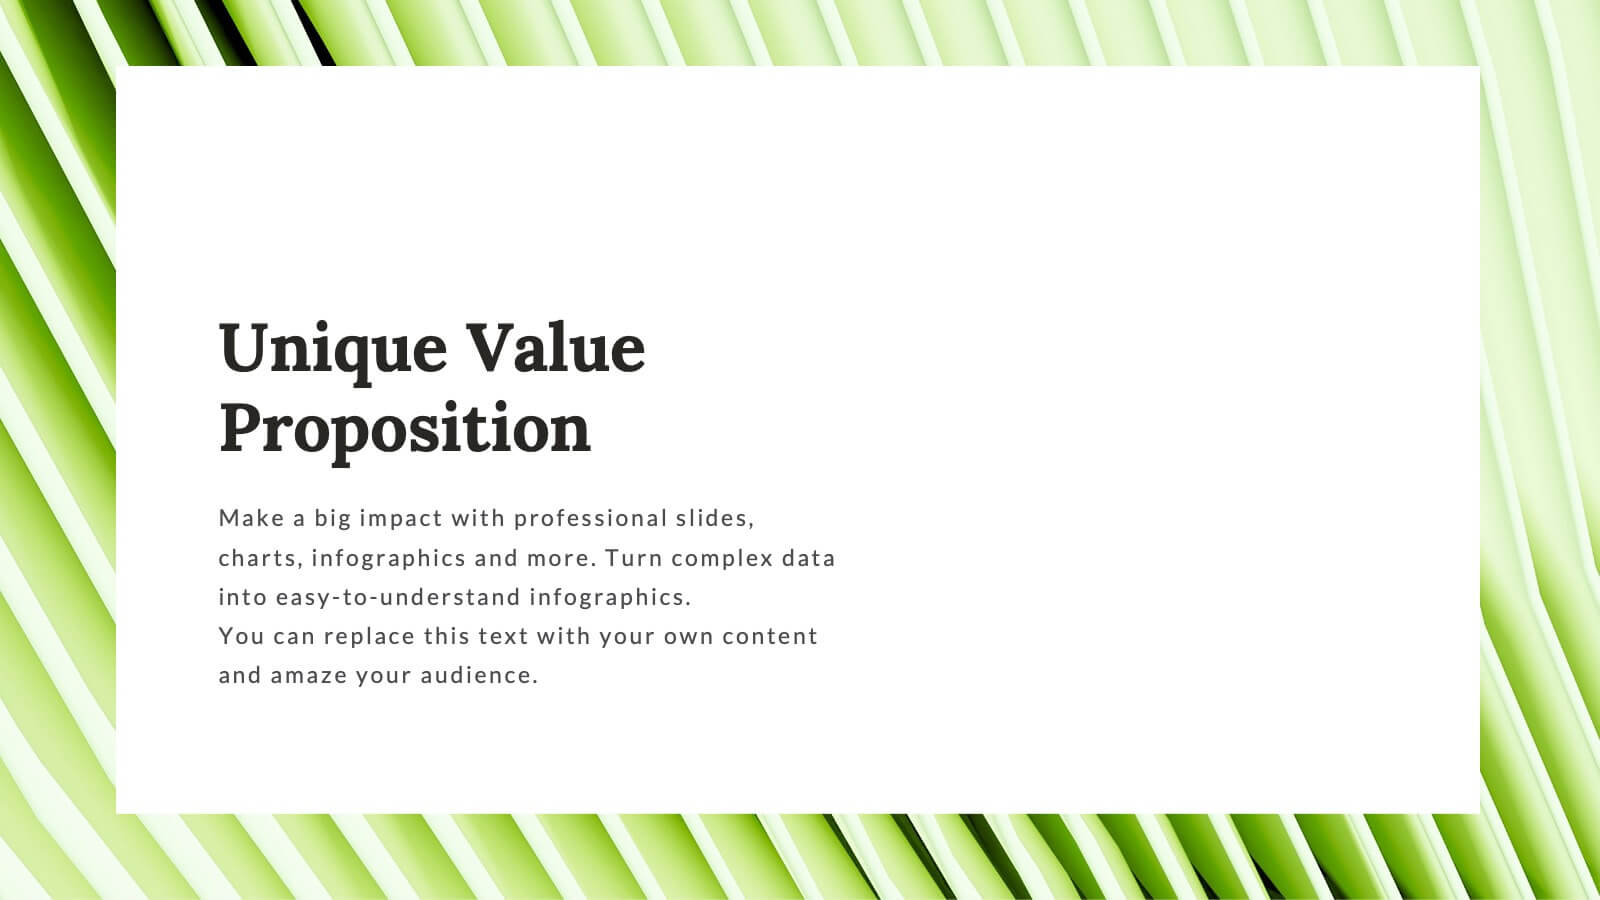
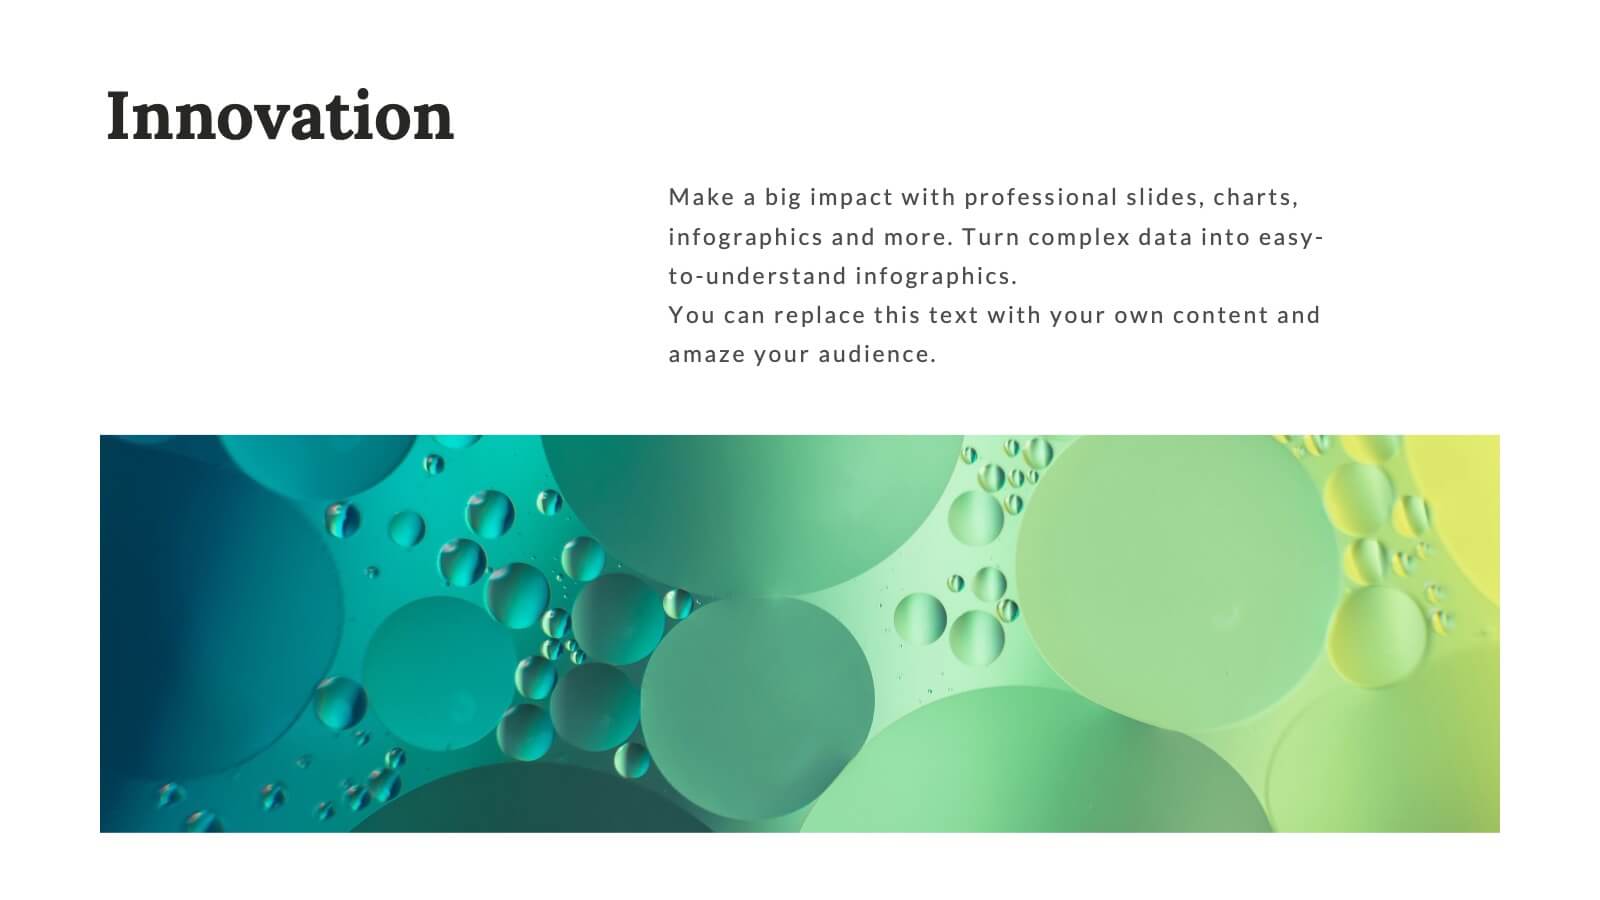
Pitch Deck Presentation
Craft a compelling narrative for your startup or business proposal with our professionally designed Pitch Deck presentation template. Perfect for entrepreneurs and innovators, this template simplifies conveying your vision to investors and stakeholders. The sleek slides cover all critical aspects of a pitch: from the problem statement, solution, market opportunity, to the business model, and financial projections. Each slide is crafted to facilitate clear and persuasive communication of your ideas. The intuitive layout ensures that your market strategies, competitive analysis, and go-to-market plans are presented with clarity and impact. The templates are seamlessly compatible with PowerPoint, Keynote, and Google Slides, providing flexibility and ease of use across platforms. With our Pitch Deck template, you’re equipped to make a lasting impression that could propel your business to success. Make your data-driven points with confidence, backed by our engaging design that's primed for your next big pitch.