


Características


¿Tienes alguna pregunta?
Recomendar


7 diapositivas
Solutions to Problems Infographic
These slides are designed to outline and explore solutions to identified problems in a clear and effective manner. Each slide uses a clean layout with a consistent color theme that enhances readability and focus. They effectively combine text and graphical elements to showcase problem-solving strategies, making the slides ideal for business presentations or strategic meetings. The inclusion of icons and diagrams aids in visualizing the problem-solving process, and the structured design ensures that the information is presented in a logical sequence. This approach not only aids in communicating the solutions effectively but also engages the audience by making complex information easier to understand. These templates can be adapted for various industries and scenarios, where clear communication of problem-solving steps is crucial. They are especially useful for team discussions, stakeholder presentations, and strategic planning sessions.


5 diapositivas
Music Eras Infographics
Music history is often divided into distinct eras or periods based on the characteristics and predominant styles of music during specific time periods. These infographic templates are designed to present a chronological overview of significant musical periods, highlighting their characteristics, key composers, notable genres, and major developments. These templates serves as a comprehensive visual guide to help audiences understand the evolution of music throughout history. This template provides a captivating overview of the major music eras, allowing viewers to appreciate the distinct characteristics and contributions of each period.


6 diapositivas
North America Weather Map Infographics
Explore our customizable North America Weather Map infographic template, a valuable tool for understanding regional weather patterns. Compatible with PowerPoint, Keynote, and Google Slides, this template simplifies complex data into user-friendly visuals, allowing you to tailor it to your specific requirements. This infographic template offers a foundation for displaying current and historical weather data, temperature trends, precipitation patterns, and more. Whether you're a meteorologist, educator, or just curious, this template provides a versatile platform to create weather-related presentations that suit your unique needs. Impress your audience with this SEO-optimized North America Weather Map infographic template, designed for clarity and ease of use. Customize it to stay informed, plan outdoor activities, and effectively communicate weather information. Get started with your customized infographic today!


6 diapositivas
Patient Care & Treatment Presentation
Highlight the pillars of patient care with this modern, block-style layout. Each icon-embedded cube represents a different treatment or healthcare process, perfect for outlining procedures, services, or stages of medical support. Fully editable in PowerPoint, Keynote, and Google Slides—customize colors, icons, and labels with ease to suit your medical presentation needs.


4 diapositivas
Personalized Learning Experience Presentation
Present tailored learning paths with this vibrant personalized education slide. Designed with sticky-note and pin graphics, it's ideal for breaking down individual goals, curriculum customization, or adaptive learning models. Fully editable in PowerPoint, Keynote, and Google Slides—perfect for educators, trainers, and instructional designers seeking clarity and engagement in learning presentations.


4 diapositivas
5G Technology and Network Rollout Presentation
Level up your tech story with a clear, engaging visual that shows the evolution of mobile networks in a simple, forward-moving flow. This presentation helps you explain upgrades, timelines, and deployment plans with clarity and confidence. Fully compatible with PowerPoint, Keynote, and Google Slides.


7 diapositivas
RACI Matrix Infographic Presentation Template
A RACI Matrix Infographic is a visual representation of the RACI model, which is used to clarify roles and responsibilities in an organization. The RACI model stands for Responsible, Accountable, Consulted, and Informed, and is a framework for defining the relationships between individuals and tasks in a project. This infographic displays a visual representation of the RACI matrix, showing the roles and responsibilities of each topic in a clear and organized manner. This Infographic can serve as a useful tool for managers and teams, as it can help to ensure clear communication and organization.


7 diapositivas
7 Elements of McKinsey Framework Presentation
Turn complex organizational elements into a simple, story-driven visual with a clean layout that highlights how each component connects back to core values. This presentation helps you explain relationships, improve alignment, and support strategic decision-making with clarity and ease. Fully editable and compatible with PowerPoint, Keynote, and Google Slides.


5 diapositivas
Online Video Games Infographics
Dive into the digital realm with our online video games infographics template, tailored in striking shades of purple, blue, pink, and black that echo the electric ambiance of the gaming world. This dynamic ensemble, perfect for game developers, and gaming communities, brings to life the universe of online gaming. Compatible with Powerpoint, Keynote, and Google Slides. It features creative graphics and gaming icons, capturing everything from player statistics to game mechanics. Whether you're spotlighting trends or unveiling a revolutionary game, this template levels up your presentation, engaging your audience right from the start screen.


5 diapositivas
Effective Decision-Making with RAPID
Streamline training and clarify roles with this directional RAPID decision-making template. Designed around the Recommend, Agree, Perform, Input, and Decide framework, this visual uses signpost-style arrows to guide teams through each responsibility in a clear, intuitive layout. Ideal for workshops, onboarding, or leadership development sessions. Fully editable in PowerPoint, Keynote, and Google Slides.


2 diapositivas
App Interface Device Preview Presentation
Display your mobile app design with this sleek interface preview layout. Centered around a realistic smartphone mockup, this template includes four surrounding sections for text or key features. Ideal for pitch decks or product demos, it's fully editable in PowerPoint, Keynote, or Google Slides to match your brand.


4 diapositivas
Multi-Stage Process Hexagon Infographic Presentation
Showcase your workflows clearly with the Multi-Stage Process Hexagon Infographic Presentation. This template features a sleek chain of hexagons, ideal for visualizing linear steps, sequential planning, or project phases. Each stage is editable, color-coded, and easy to customize in PowerPoint, Keynote, or Google Slides—perfect for teams, educators, or project managers.


8 diapositivas
Success Strategy Triangle Presentation
Craft a winning strategy with the Success Strategy Triangle template. This structured design helps visualize key business components in a step-by-step format, making it ideal for growth planning, decision-making, and performance analysis. Fully customizable and easy to use, it’s compatible with PowerPoint, Keynote, and Google Slides for seamless integration.


7 diapositivas
Progress Infographic Presentation Template
Our Progress template is designed with a simple layout for presenting your infographic with flow charts and progress bars. This layout is made to be used as a presentation layer so that you can easily change text and images from one slide to the next. It comes with useful icons and illustrations to help you create a more informative presentation. This is a well-organized template for PowerPoint presentations. It allows you to present important information with clear and concise structure. With its useful design and features, you can create an engaging presentation in just minutes.

22 diapositivas
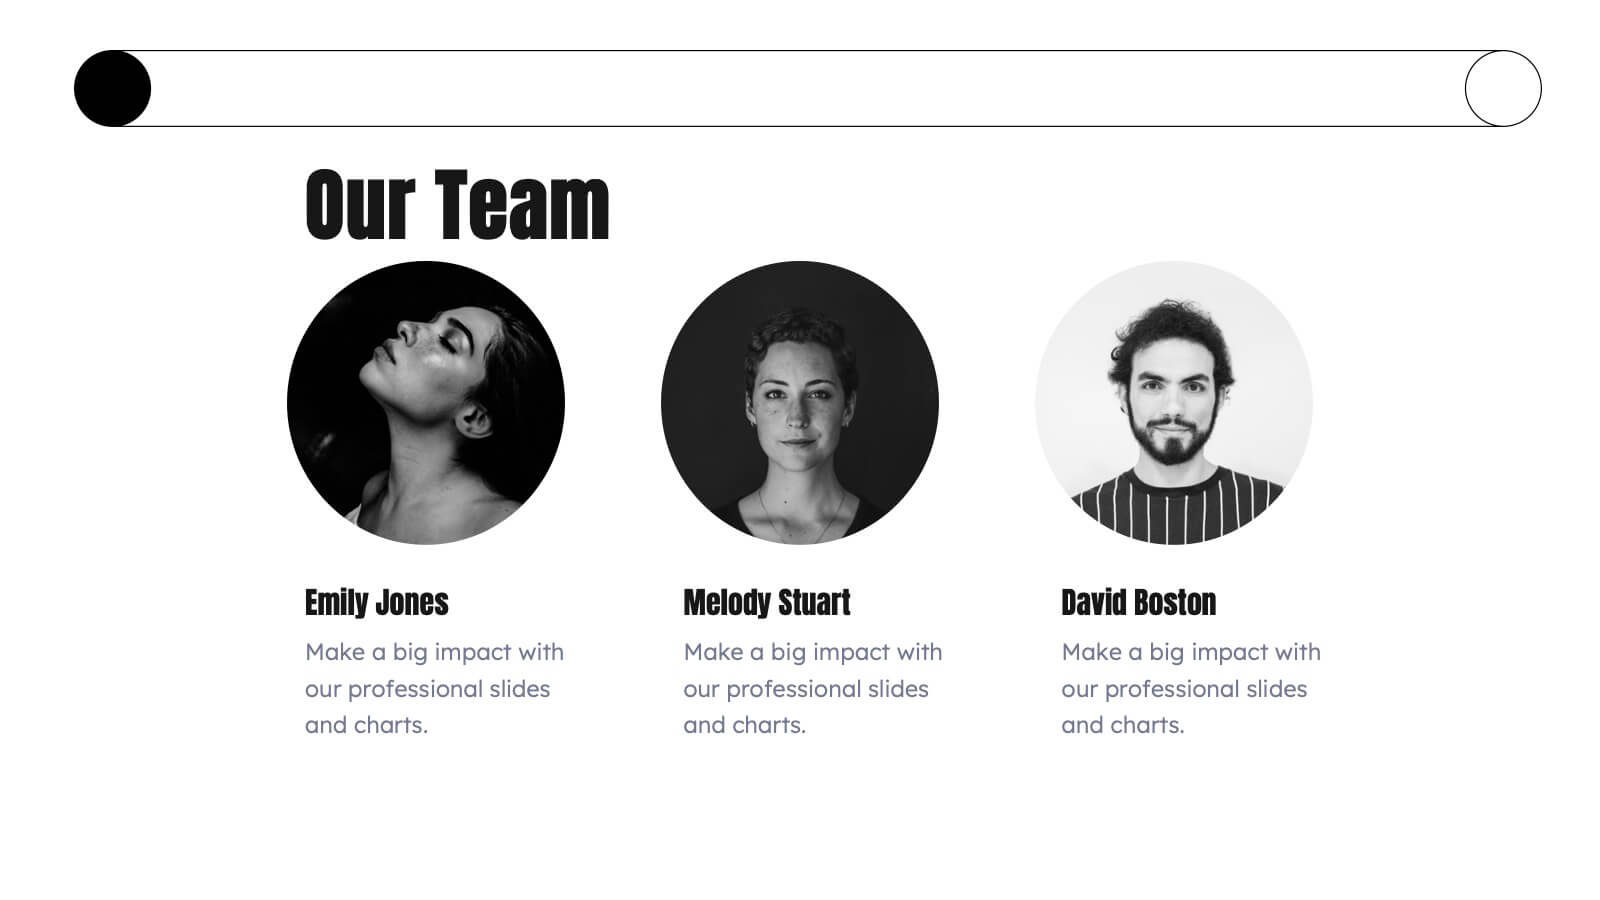
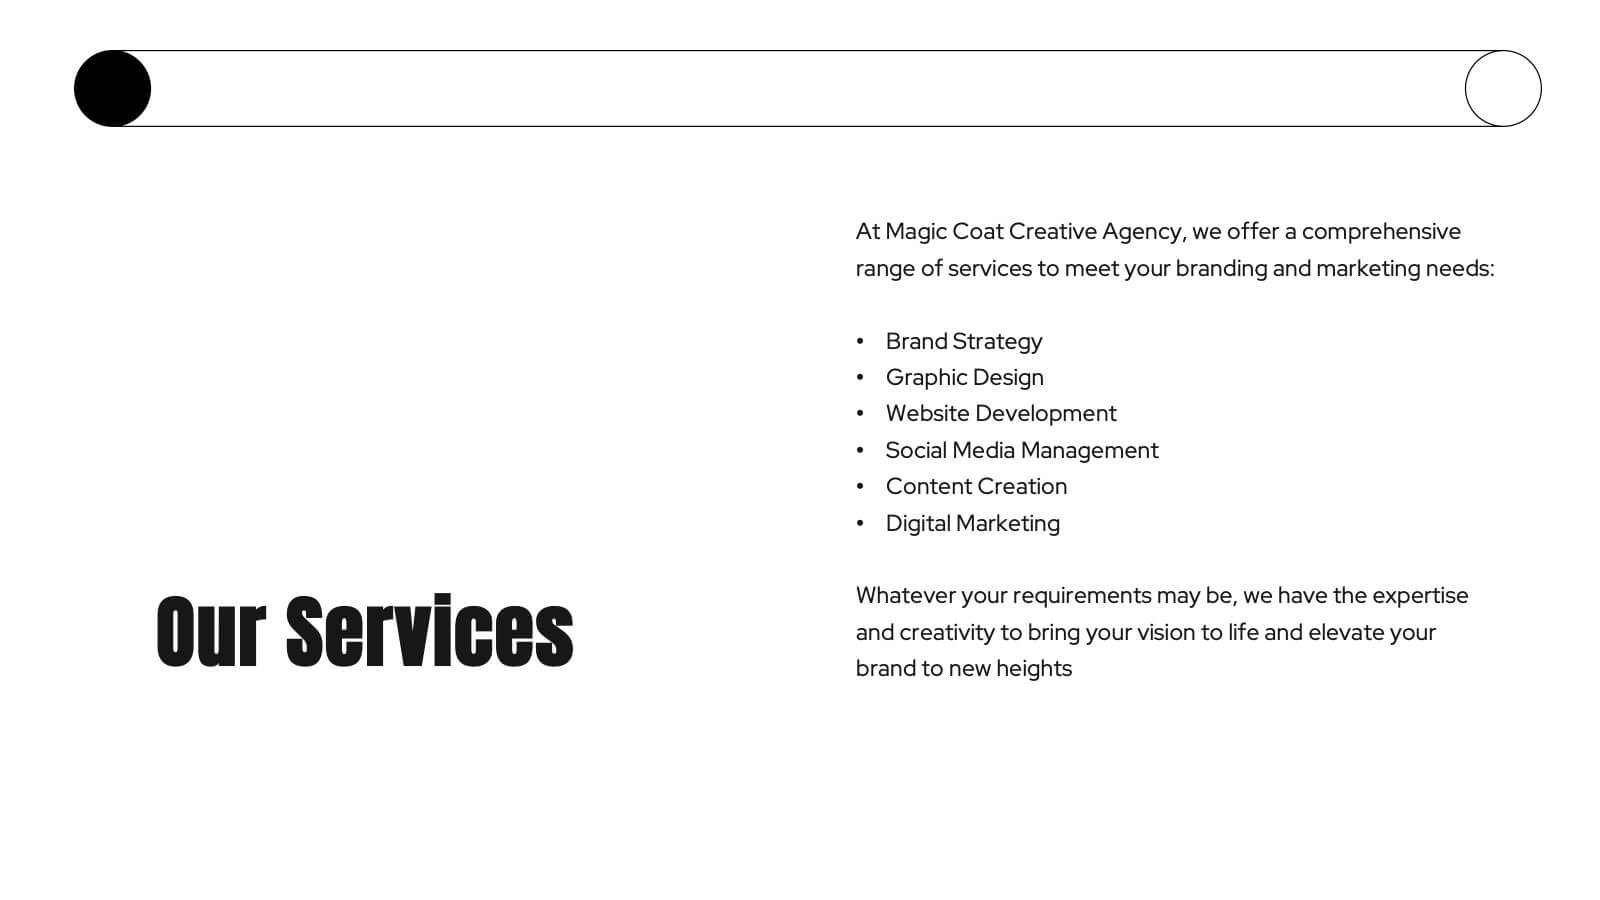
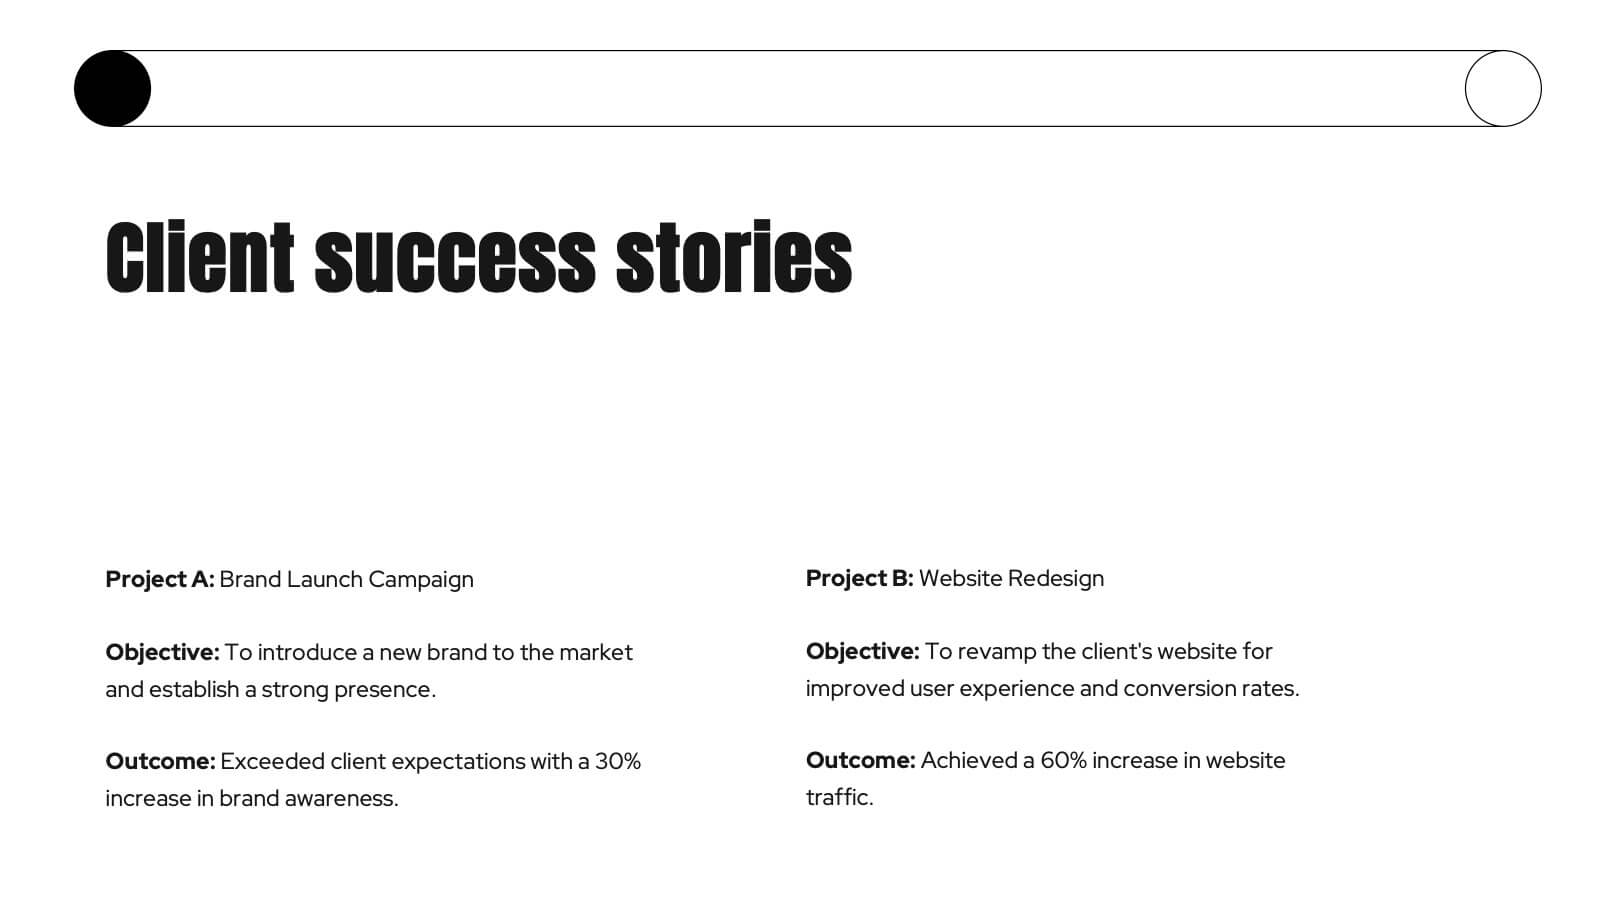
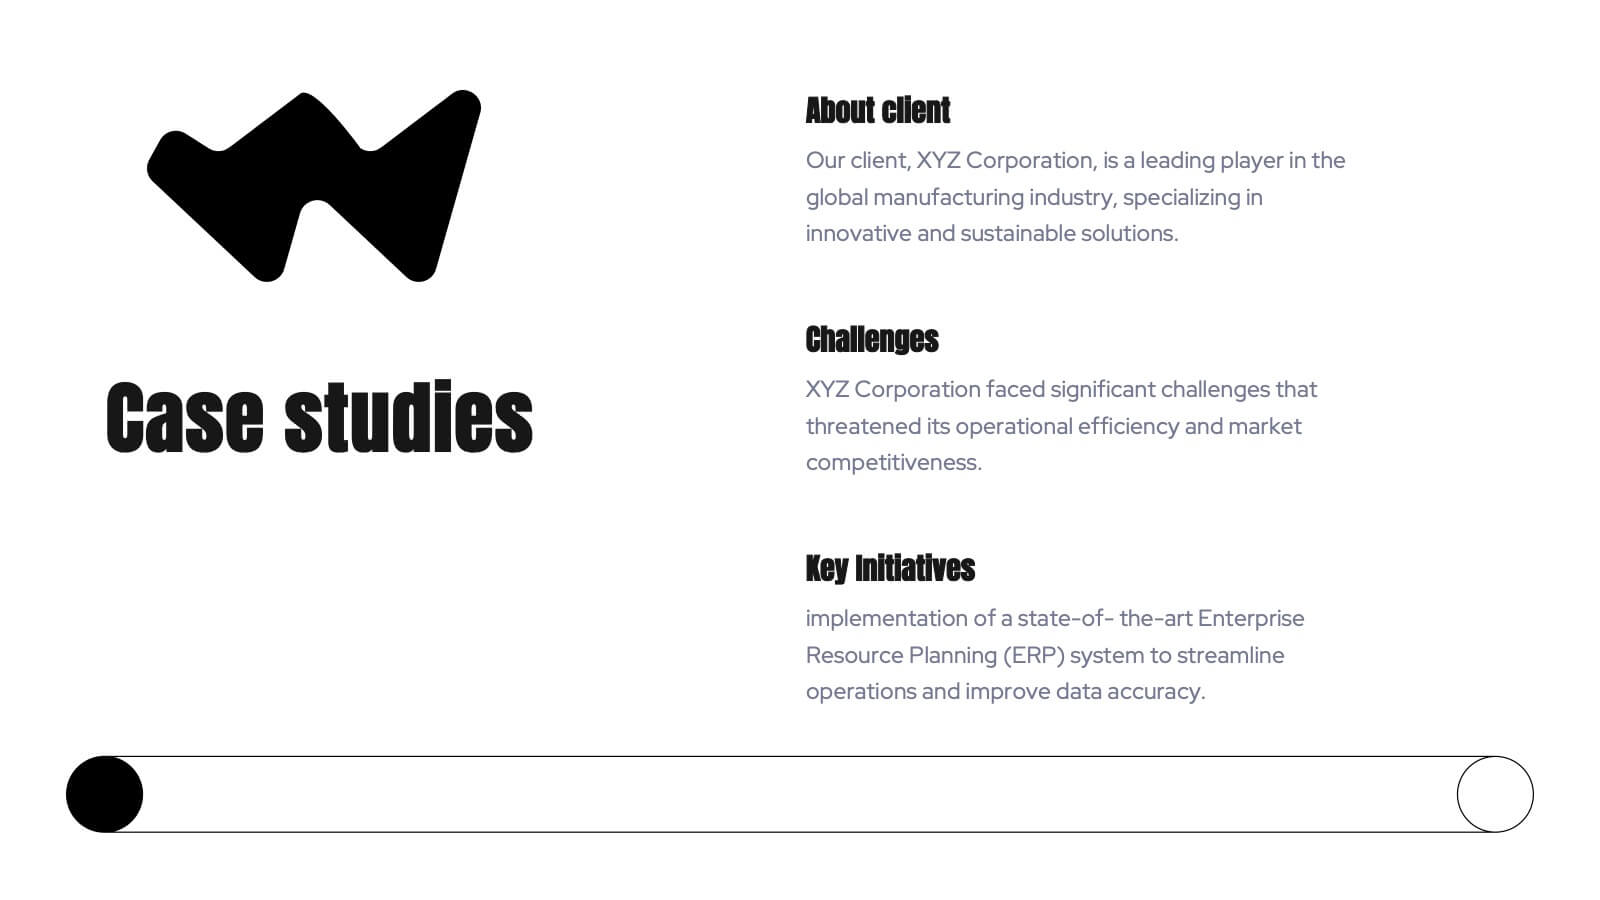
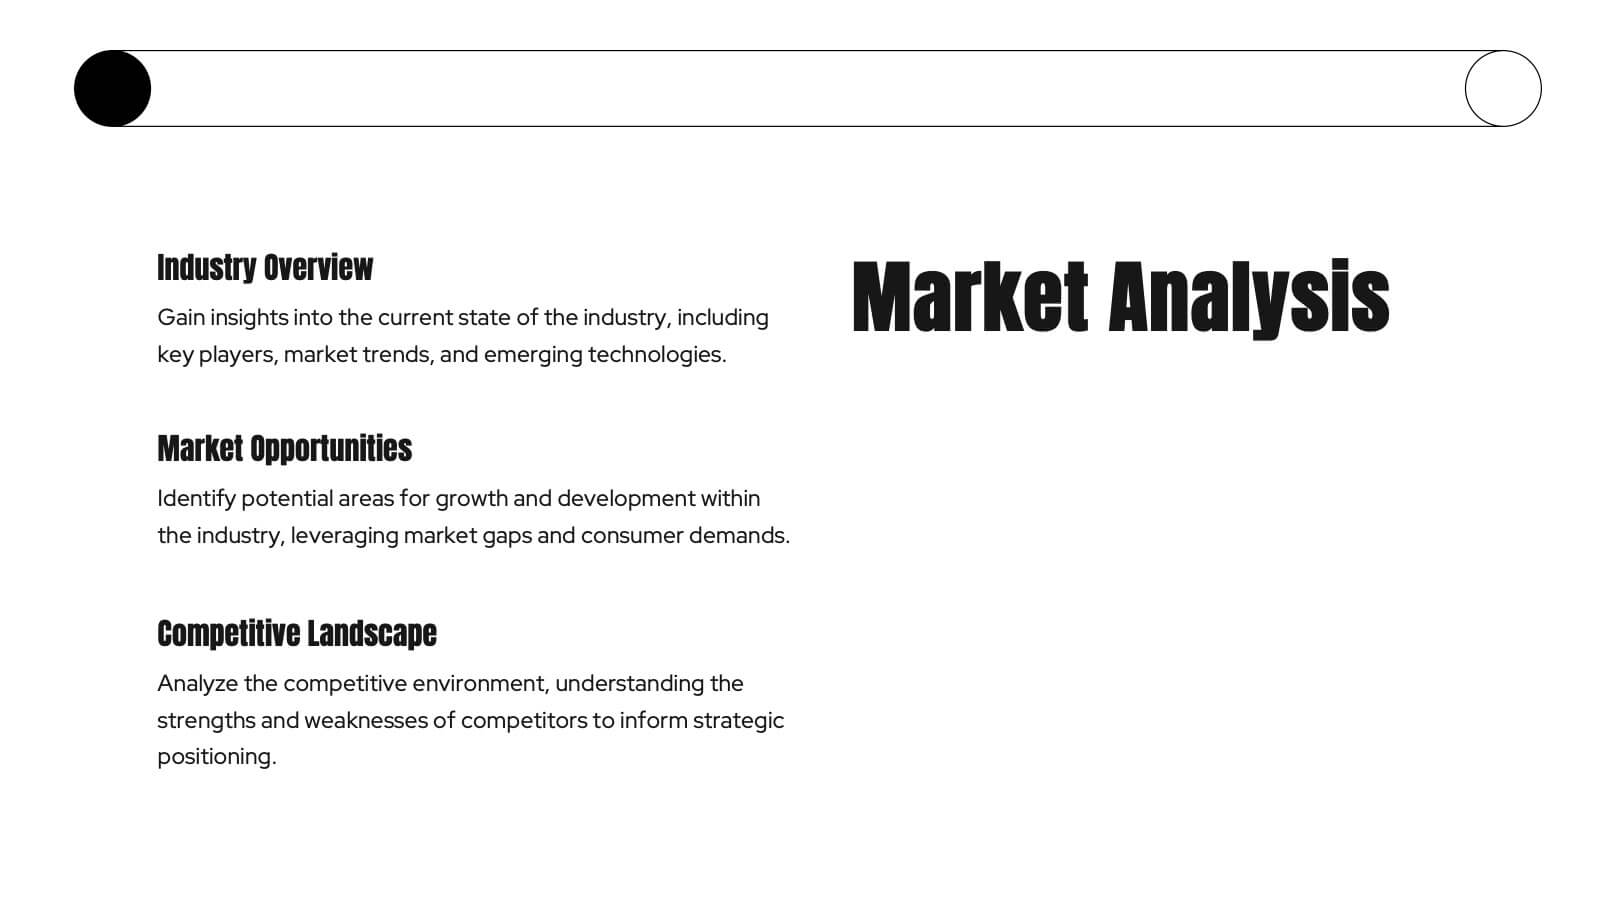
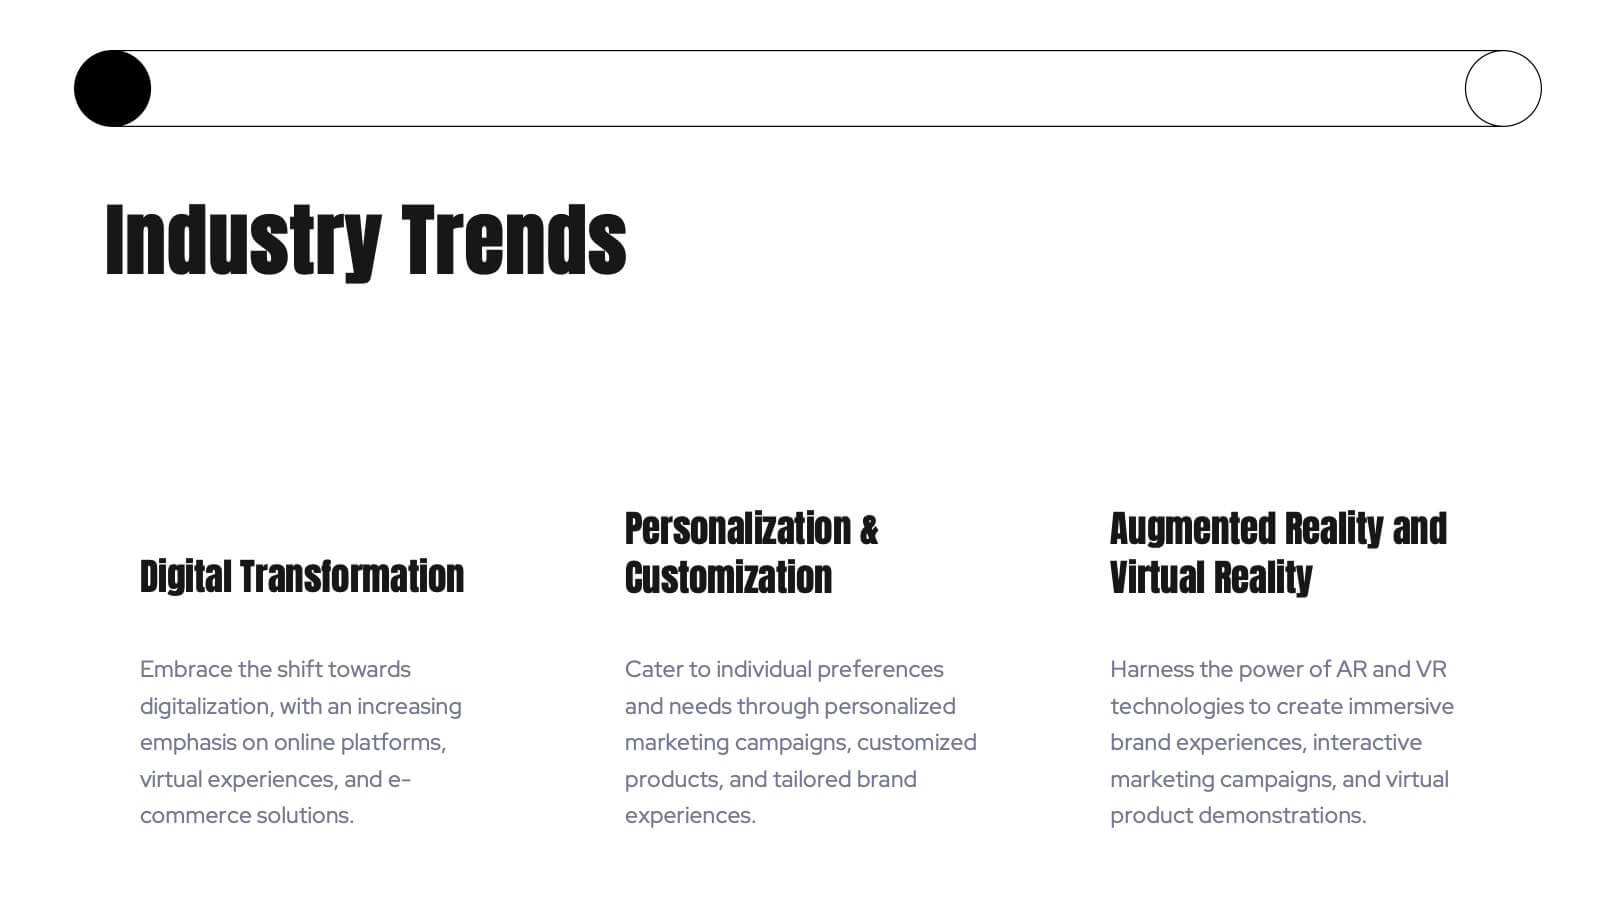
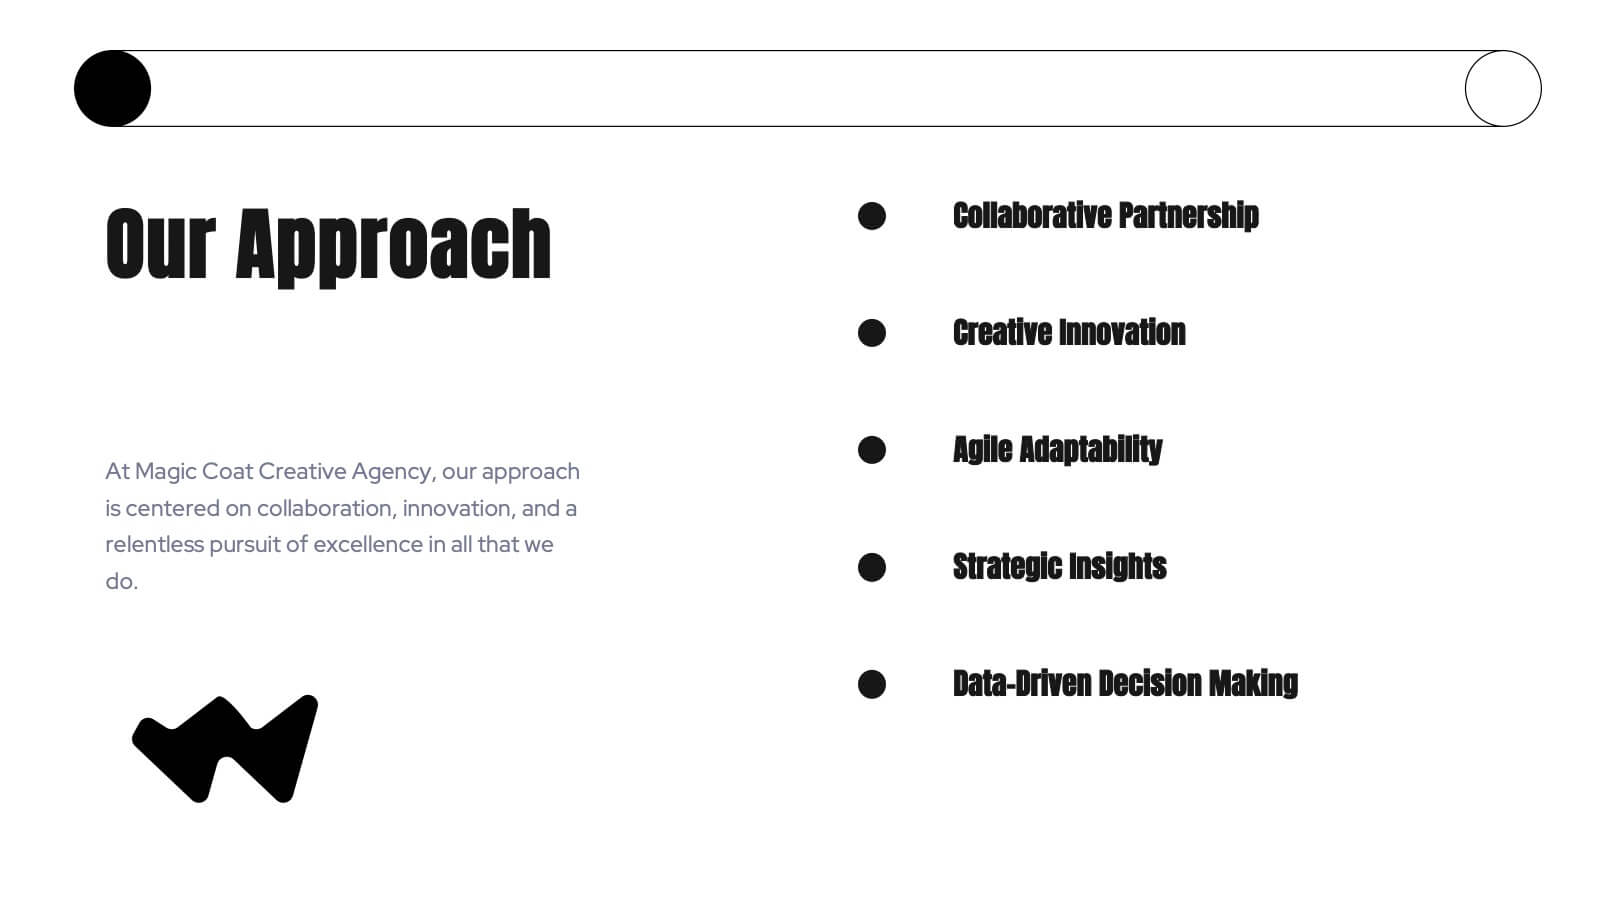
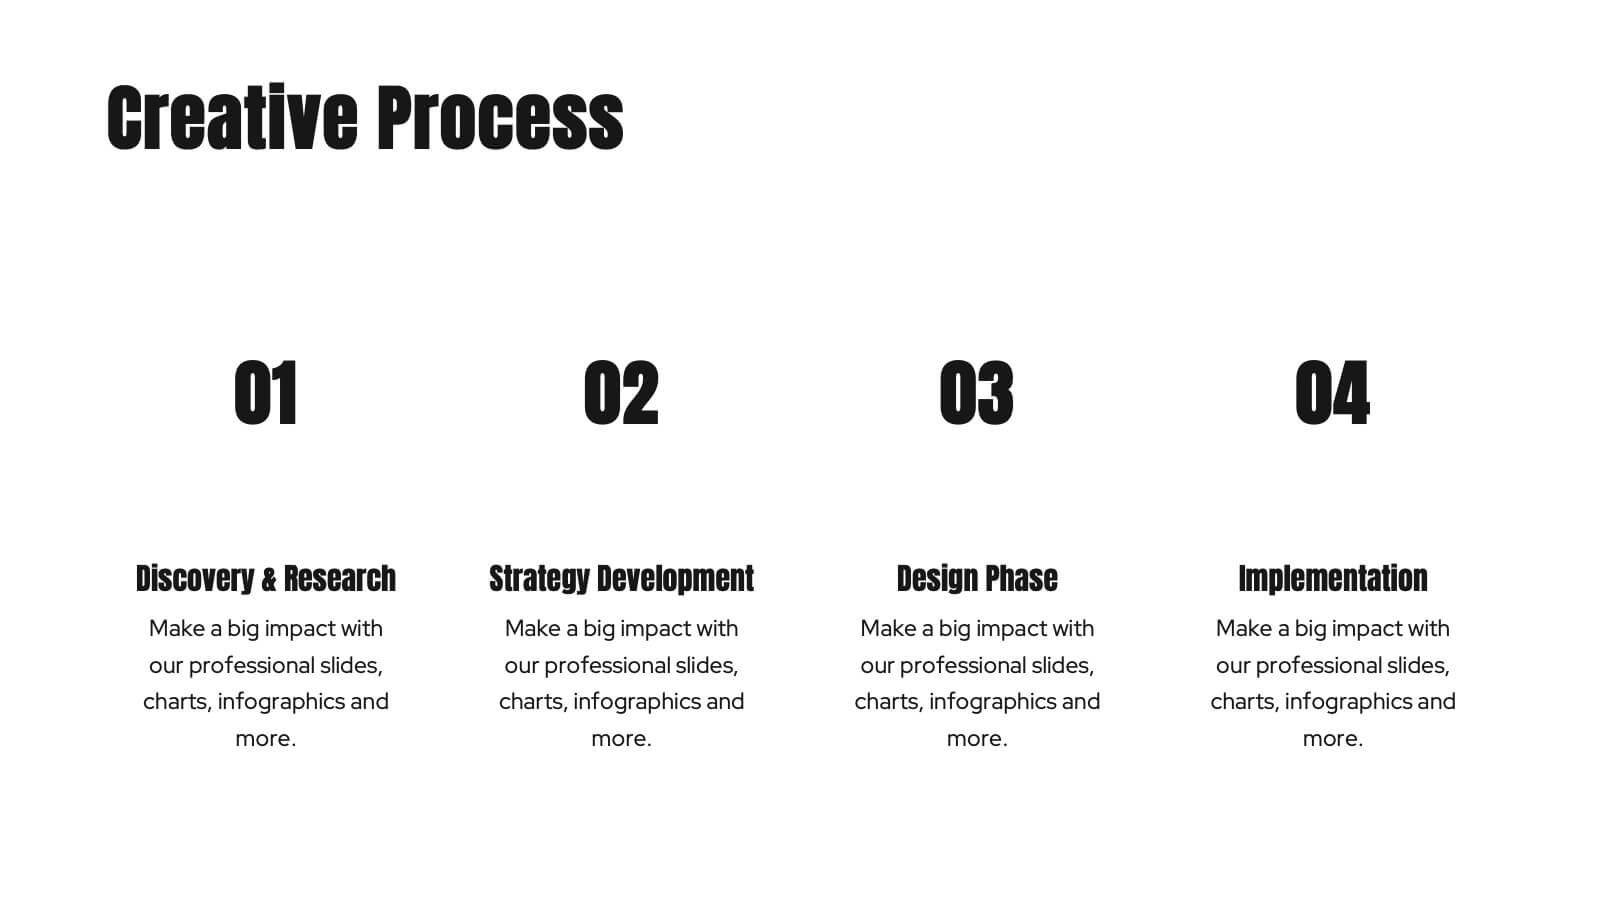
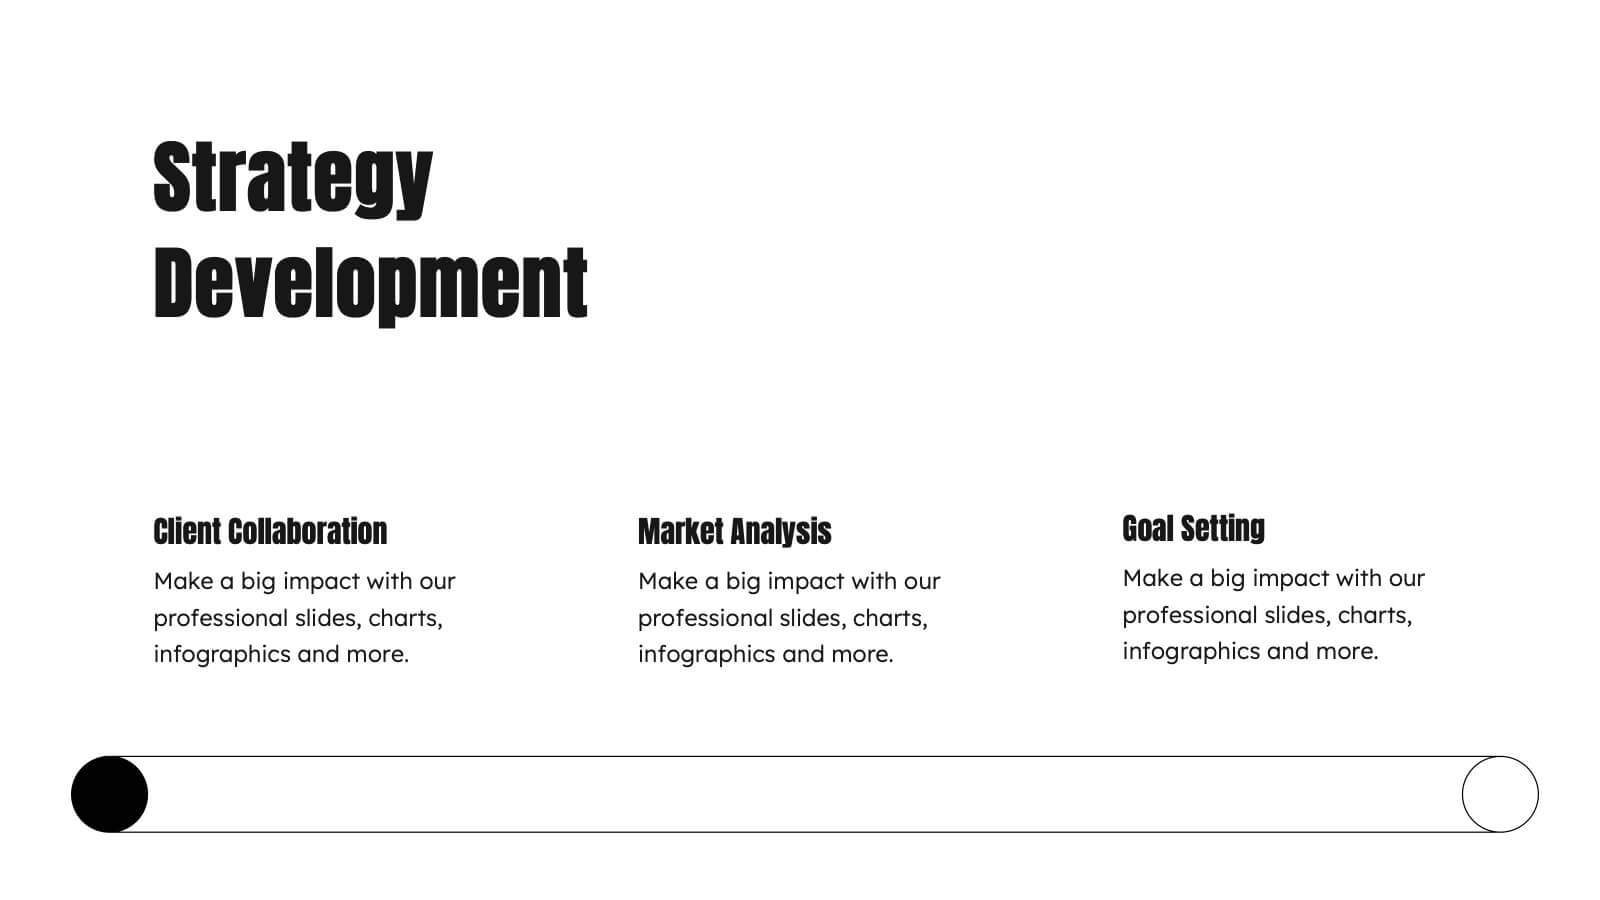
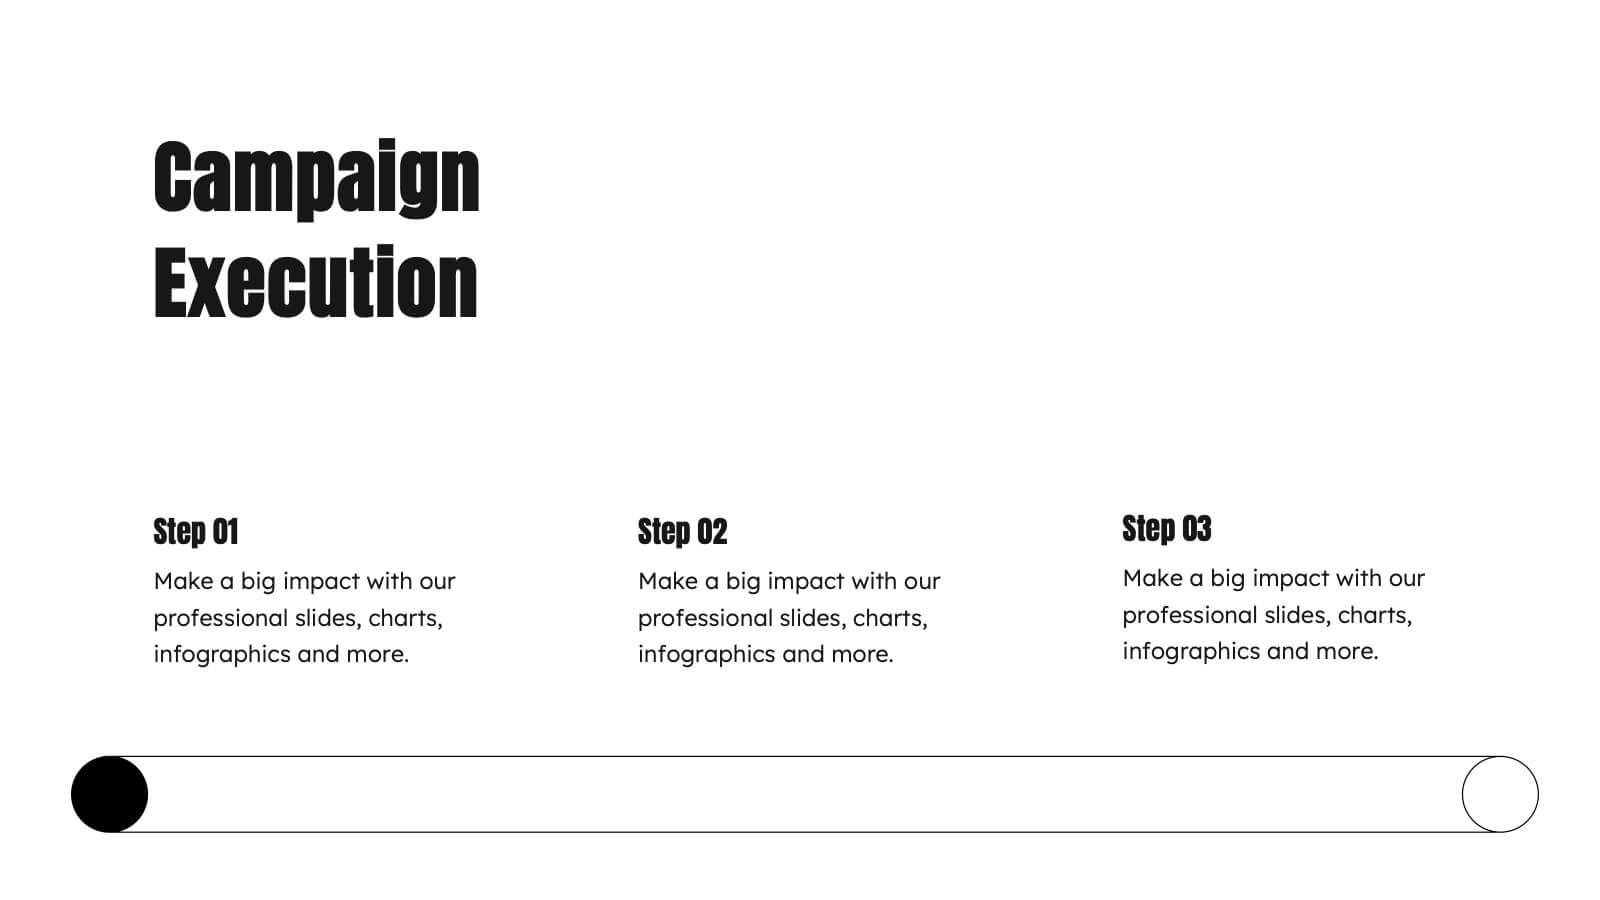
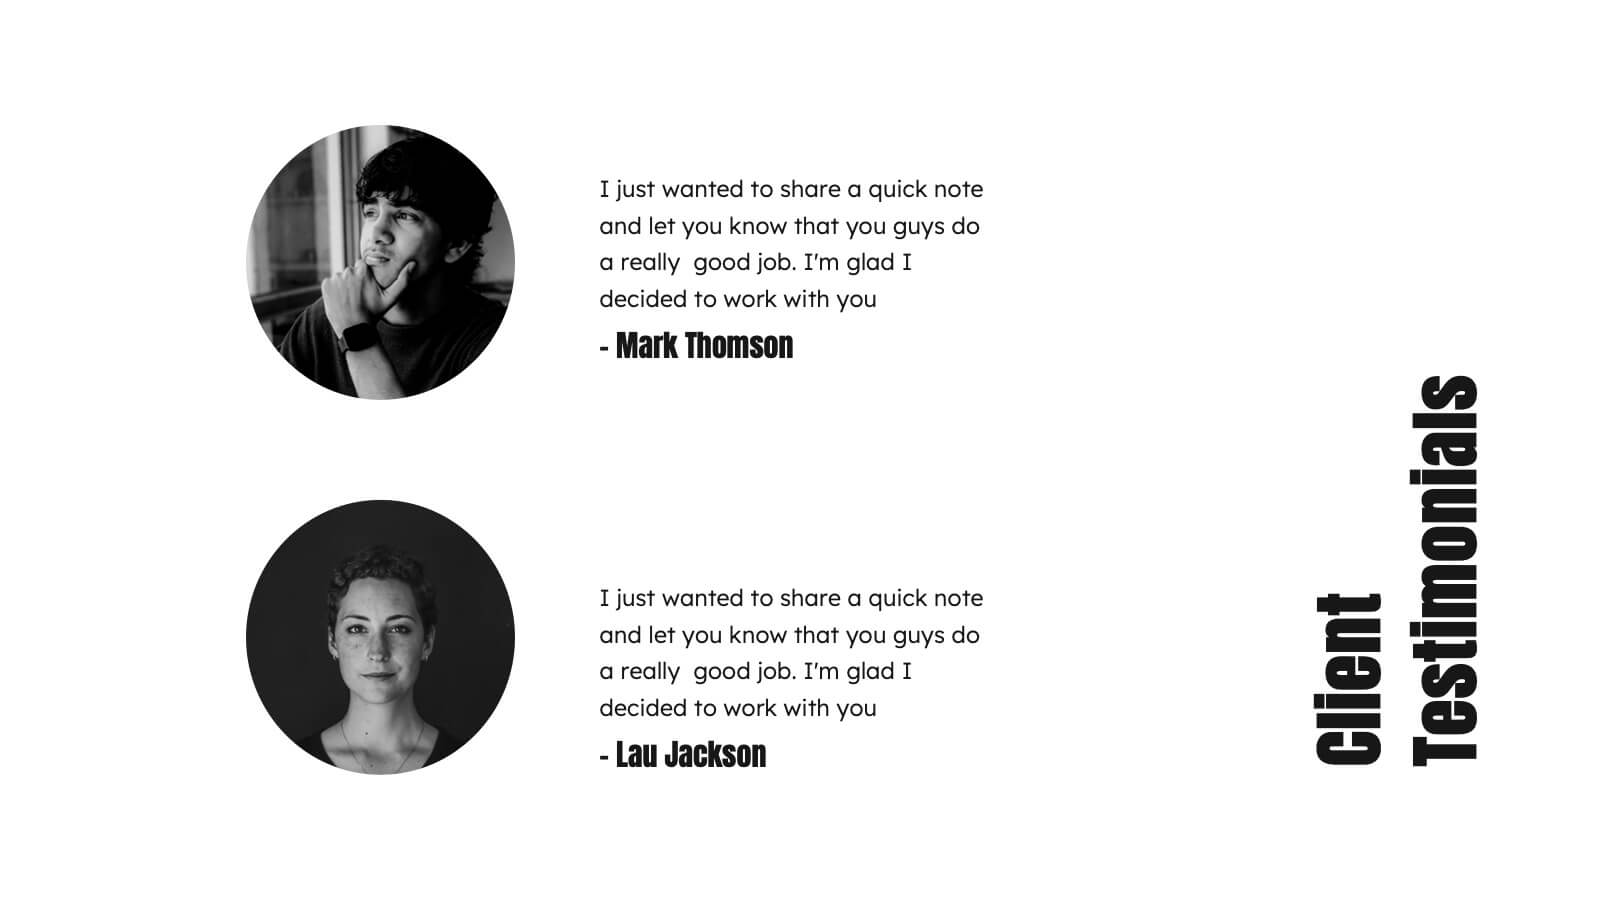
Kraken Agency Portfolio Presentation
This agency portfolio template showcases your agency's work and expertise with a sleek, modern design. It features slides for client success stories, case studies, services, market analysis, and creative process. Perfect for demonstrating your team’s skills and approach. Compatible with PowerPoint, Keynote, and Google Slides for easy customization and presentation.


6 diapositivas
Project Status Analysis Infographics
Analyze your project's status effectively with our Project Status Analysis infographic template. This template is fully compatible with popular presentation software like PowerPoint, Keynote, and Google Slides, allowing you to easily customize it to illustrate and communicate the key elements of project status analysis. The Project Status Analysis infographic template offers a visually engaging platform to depict project progress, milestones, risks, and key performance indicators. Whether you're a project manager, team leader, or business professional, this template provides a user-friendly canvas to create informative presentations and reports on your project's status. Optimize your project management and reporting with this SEO-optimized Project Status Analysis infographic template, thoughtfully designed for clarity and ease of use. Customize it to showcase project timelines, status updates, issue tracking, and strategies for project success, ensuring that your audience gains a comprehensive understanding of the project's current situation. Start crafting your personalized infographic today to excel in project status analysis.


6 diapositivas
Customer Feedback Insights Chart Presentation
Visualize feedback data effectively with this sleek, horizontal bar chart layout. Highlight percentages per category with bold labels and color accents to emphasize results. Ideal for surveys, product reviews, or satisfaction ratings. Fully customizable in Canva, PowerPoint, or Google Slides for a professional, easy-to-read presentation experience.