


Características


¿Tienes alguna pregunta?
Recomendar


5 diapositivas
Employee Feedback Survey Report Presentation
Deliver clear insights into team sentiment with this employee rating slide. Designed with star rating visuals and thumbs-up iconography, it's perfect for showcasing staff satisfaction, engagement, and performance reviews. Easy to customize in PowerPoint, Keynote, and Google Slides.


6 diapositivas
Career Goals Infographic
Career goals refer to the professional objectives and aspirations that individuals set for themselves to achieve in their chosen careers. This infographic template serves as a powerful tool for individuals to map out their career aspirations, create a clear roadmap, and communicate their goals effectively. This template is designed to articulate and communicate your career aspirations and goals. This infographic provides a clear and organized overview of career objectives, steps for achieving those goals, and key milestones along the way. Compatible with Powerpoint, Keynote, and Google Slides.


6 diapositivas
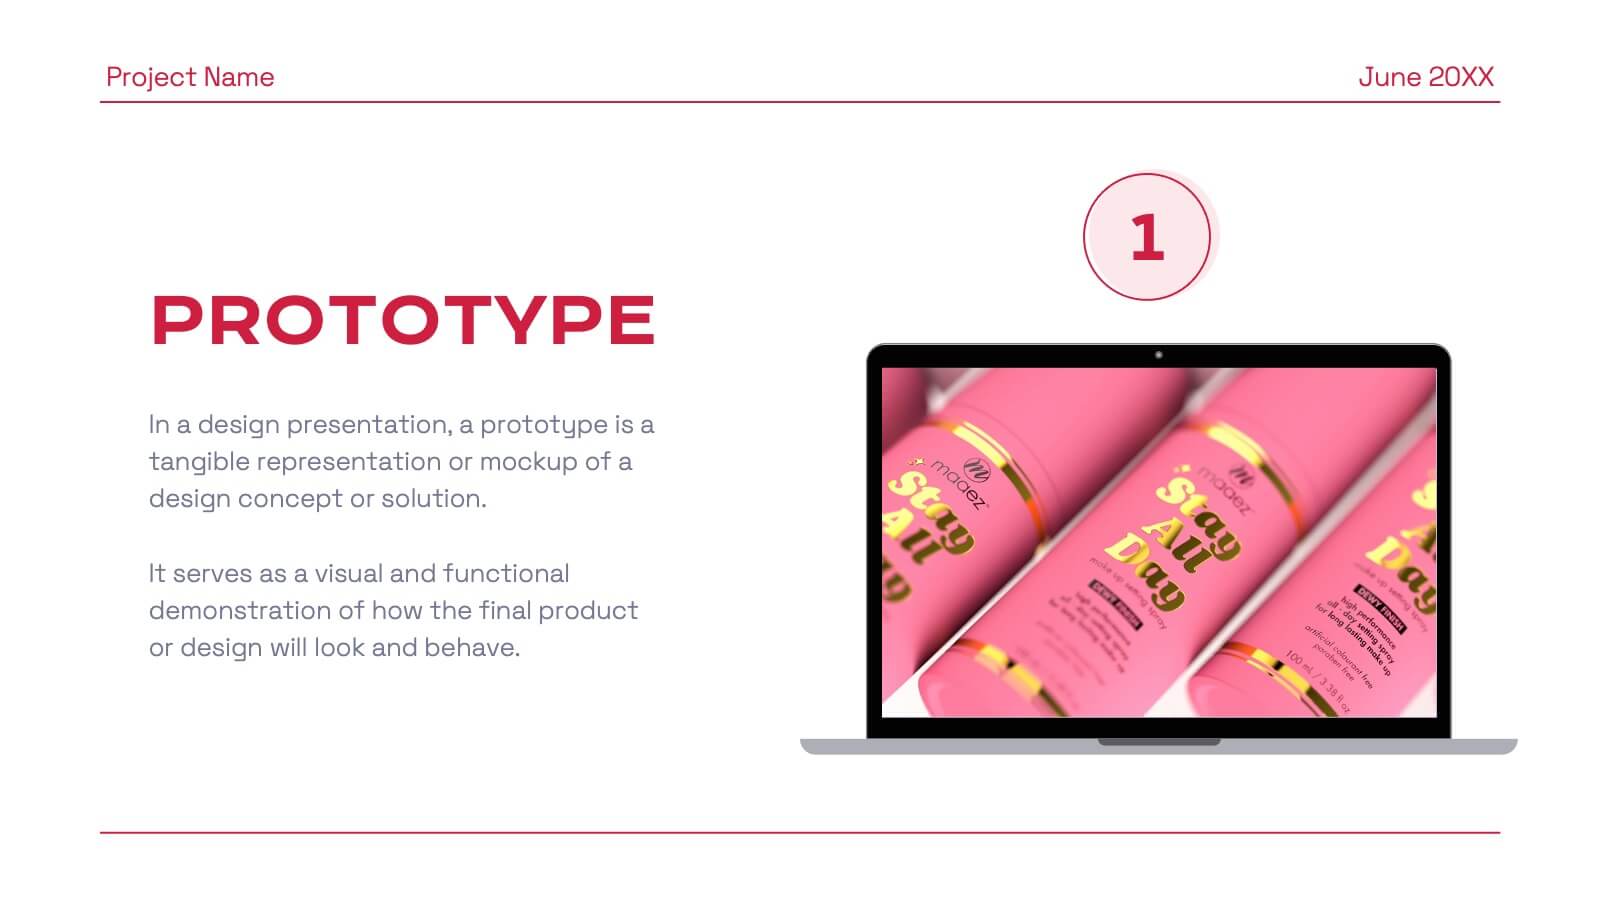
Strategic Triangle Layout Presentation
Turn your ideas into a visual roadmap with this sleek, geometric layout that balances design and strategy. Perfect for illustrating workflows, key milestones, or connected concepts, it helps your message flow seamlessly across stages. Fully editable and compatible with PowerPoint, Keynote, and Google Slides for effortless customization.


22 diapositivas
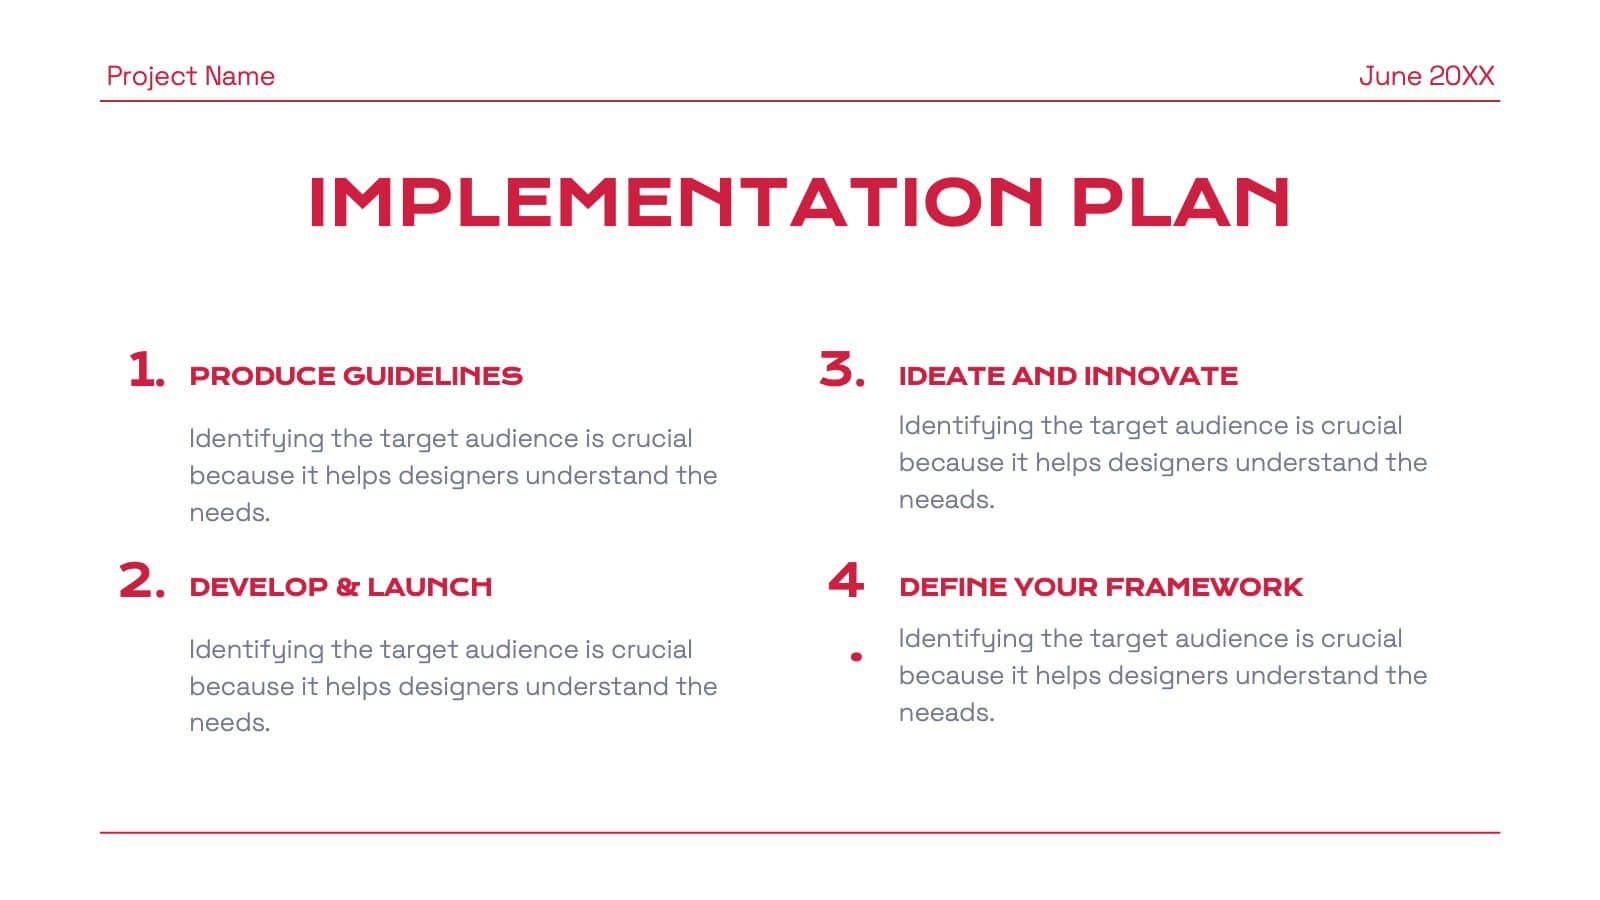
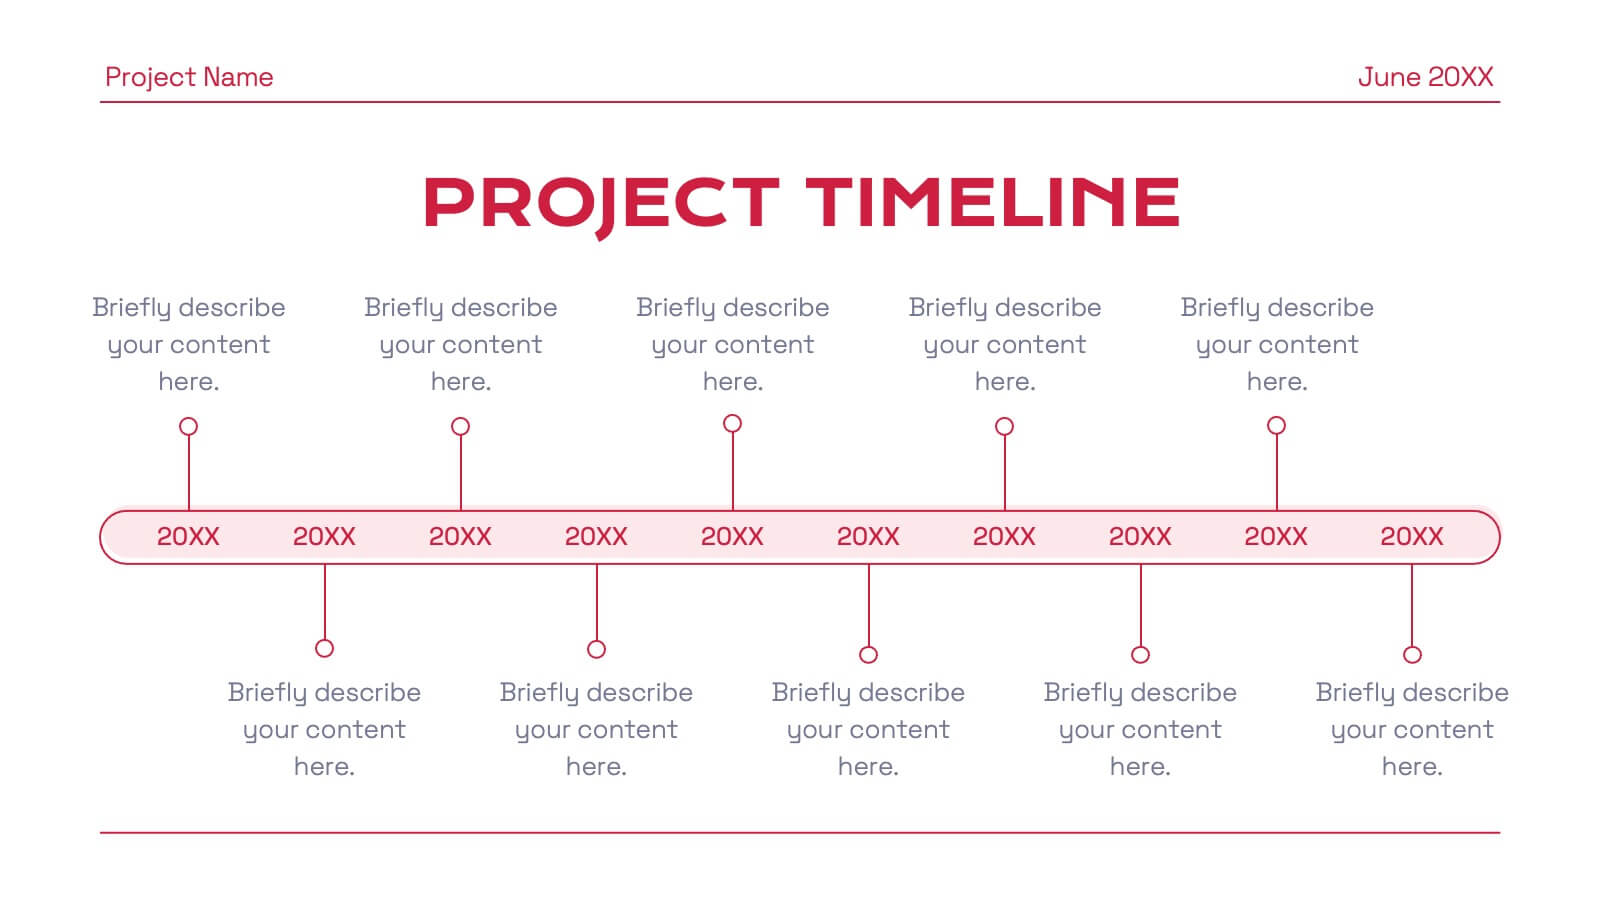
Eclipse Graphic Design Project Plan Presentation
Develop a winning marketing strategy with this dynamic template. Dive into current trends, consumer behavior, and innovative techniques. Perfect for social media, influencer marketing, and data-driven campaigns. Fully compatible with PowerPoint, Keynote, and Google Slides.


8 diapositivas
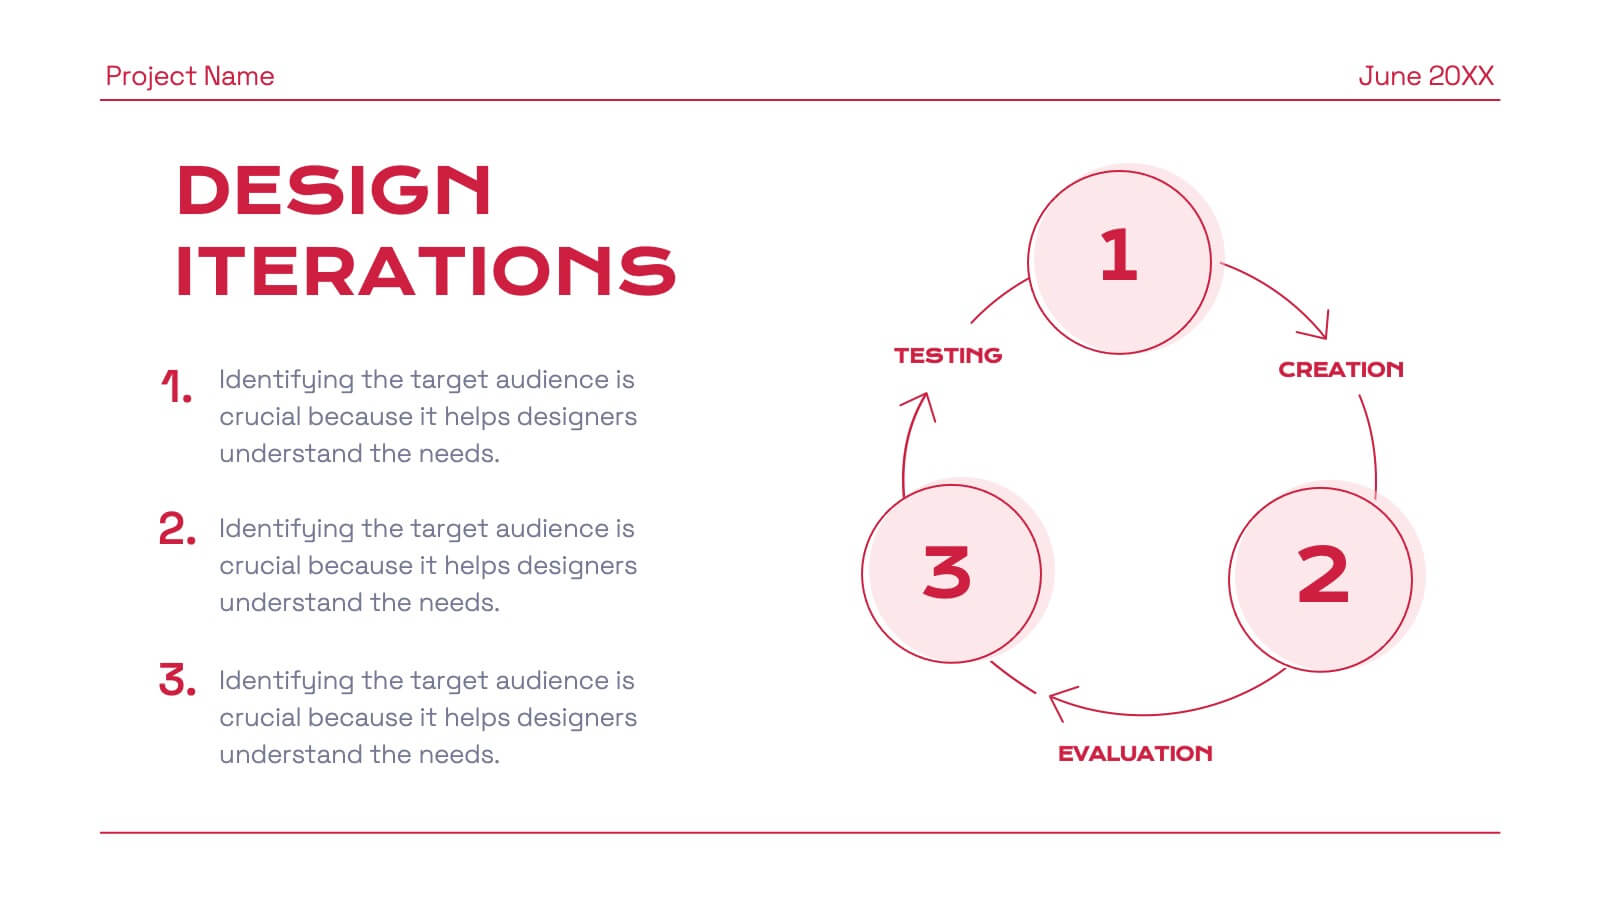
Governance and Compliance Framework
Streamline your compliance reporting with this triangle-based governance framework slide. Featuring three core pillars—Risk, Strategy, and Leadership—this layout visually connects your organizational roles, responsibilities, and regulatory measures. Each corner is paired with numbered titles and editable icons, perfect for illustrating audits, policies, or internal controls. Fully editable in PowerPoint, Keynote, and Google Slides.


20 diapositivas
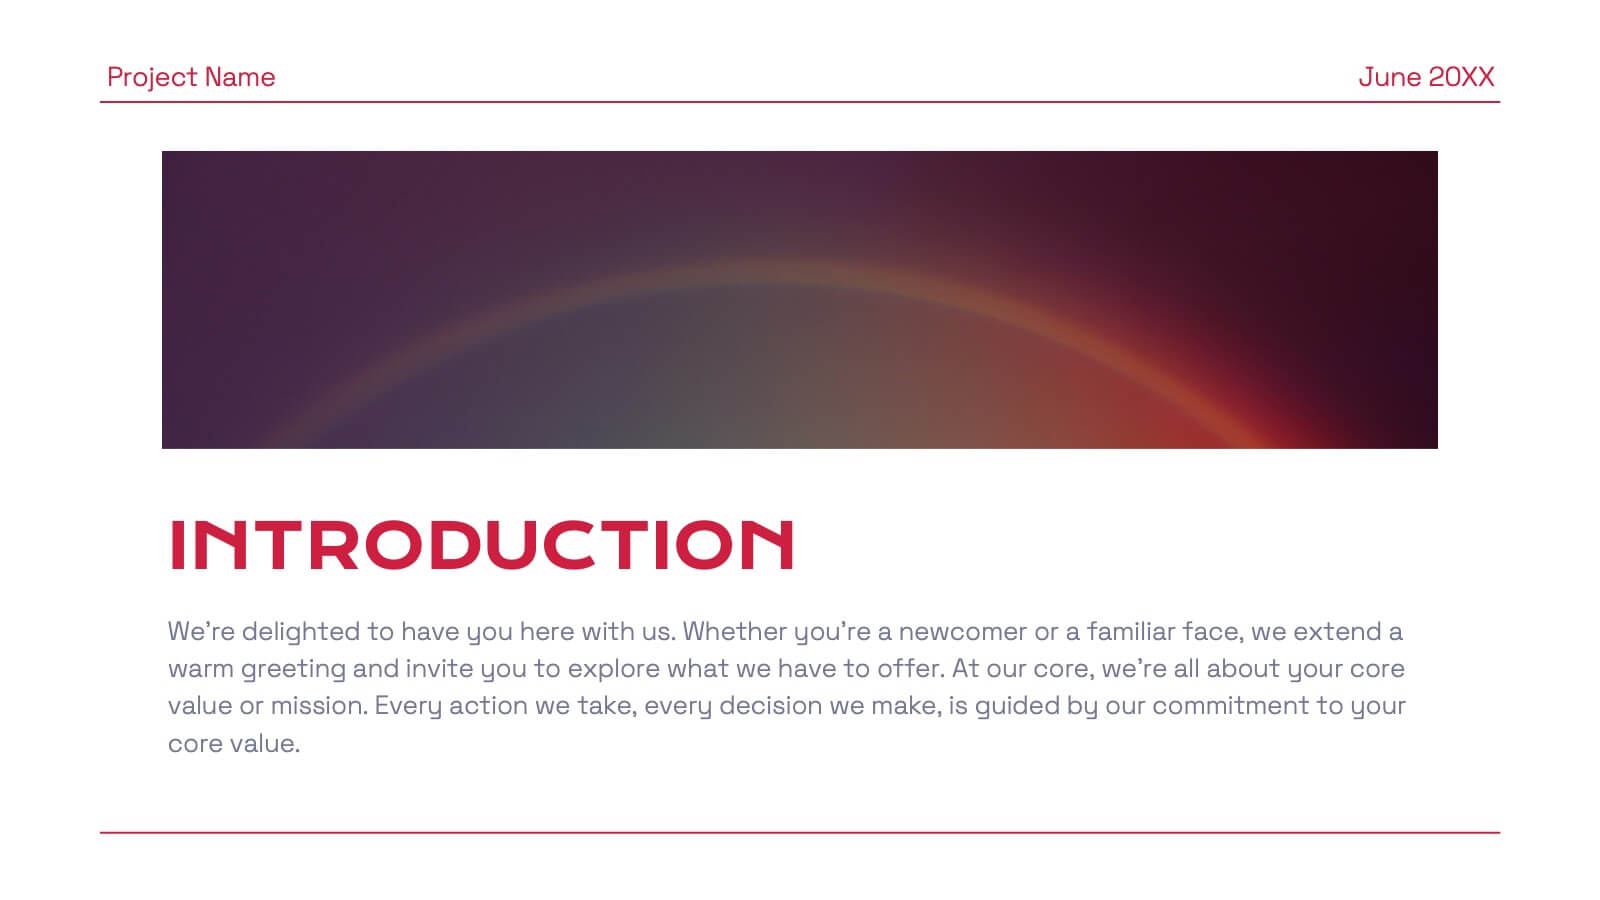
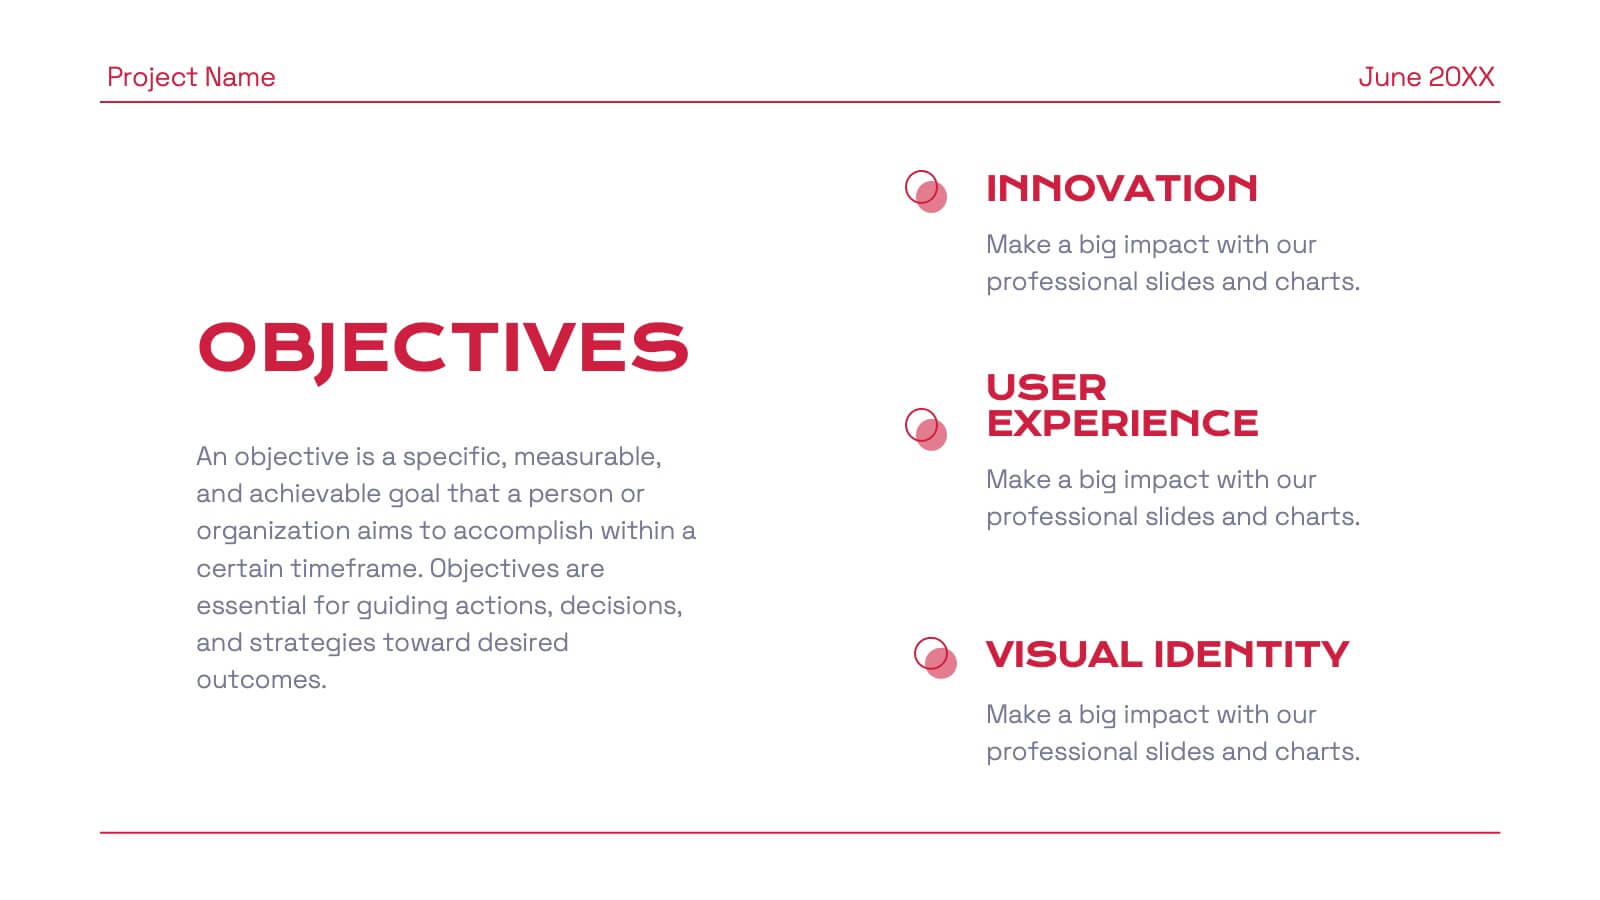
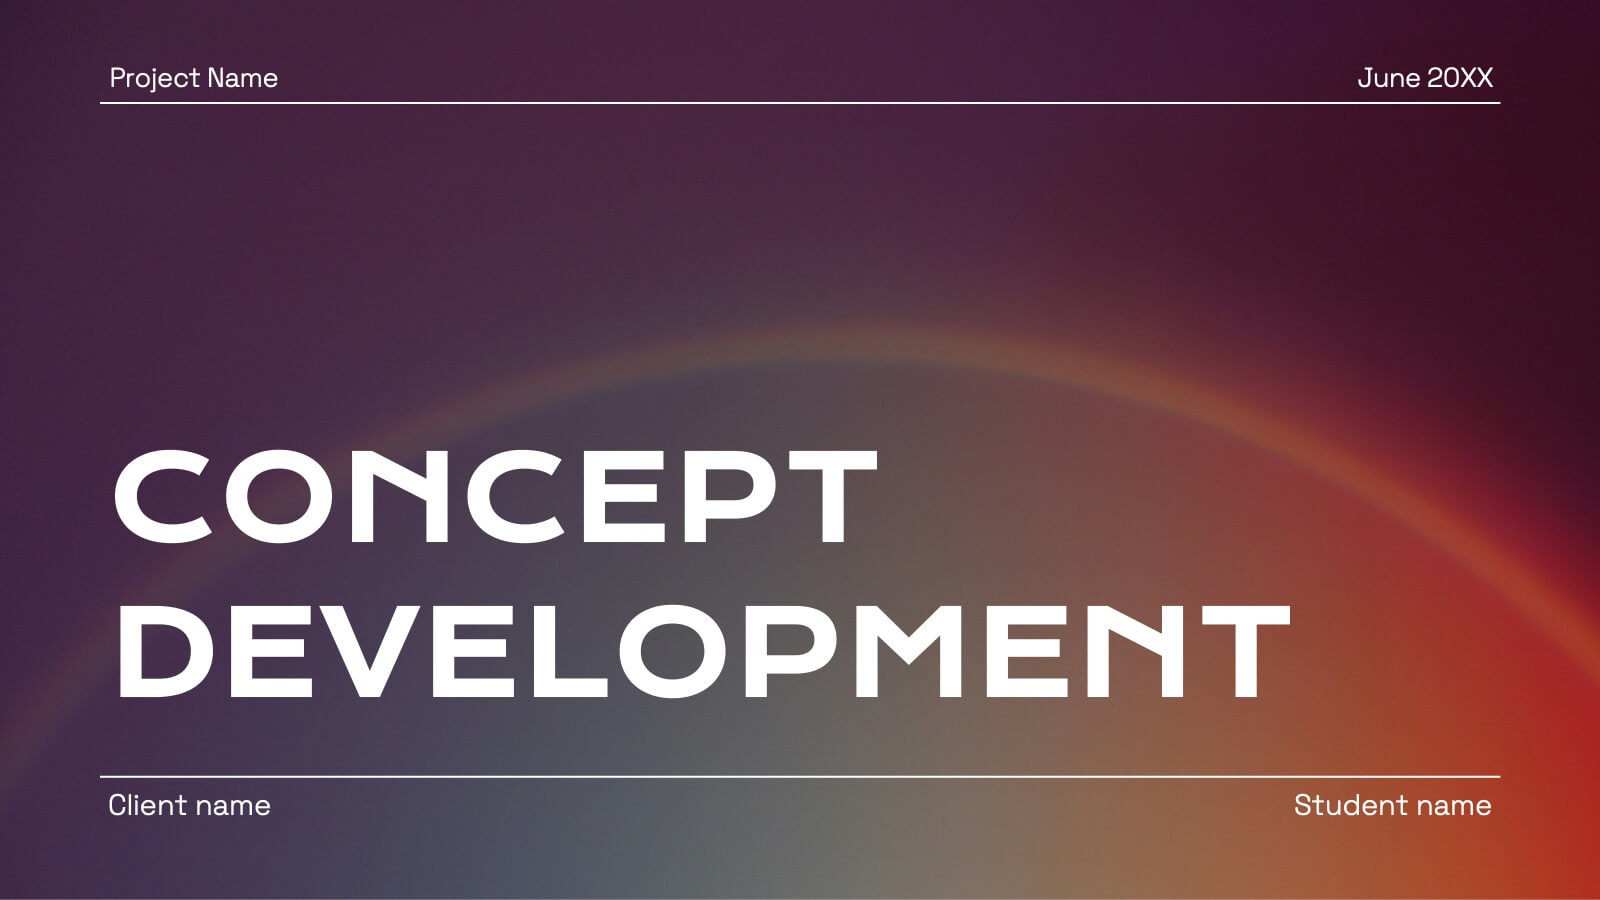
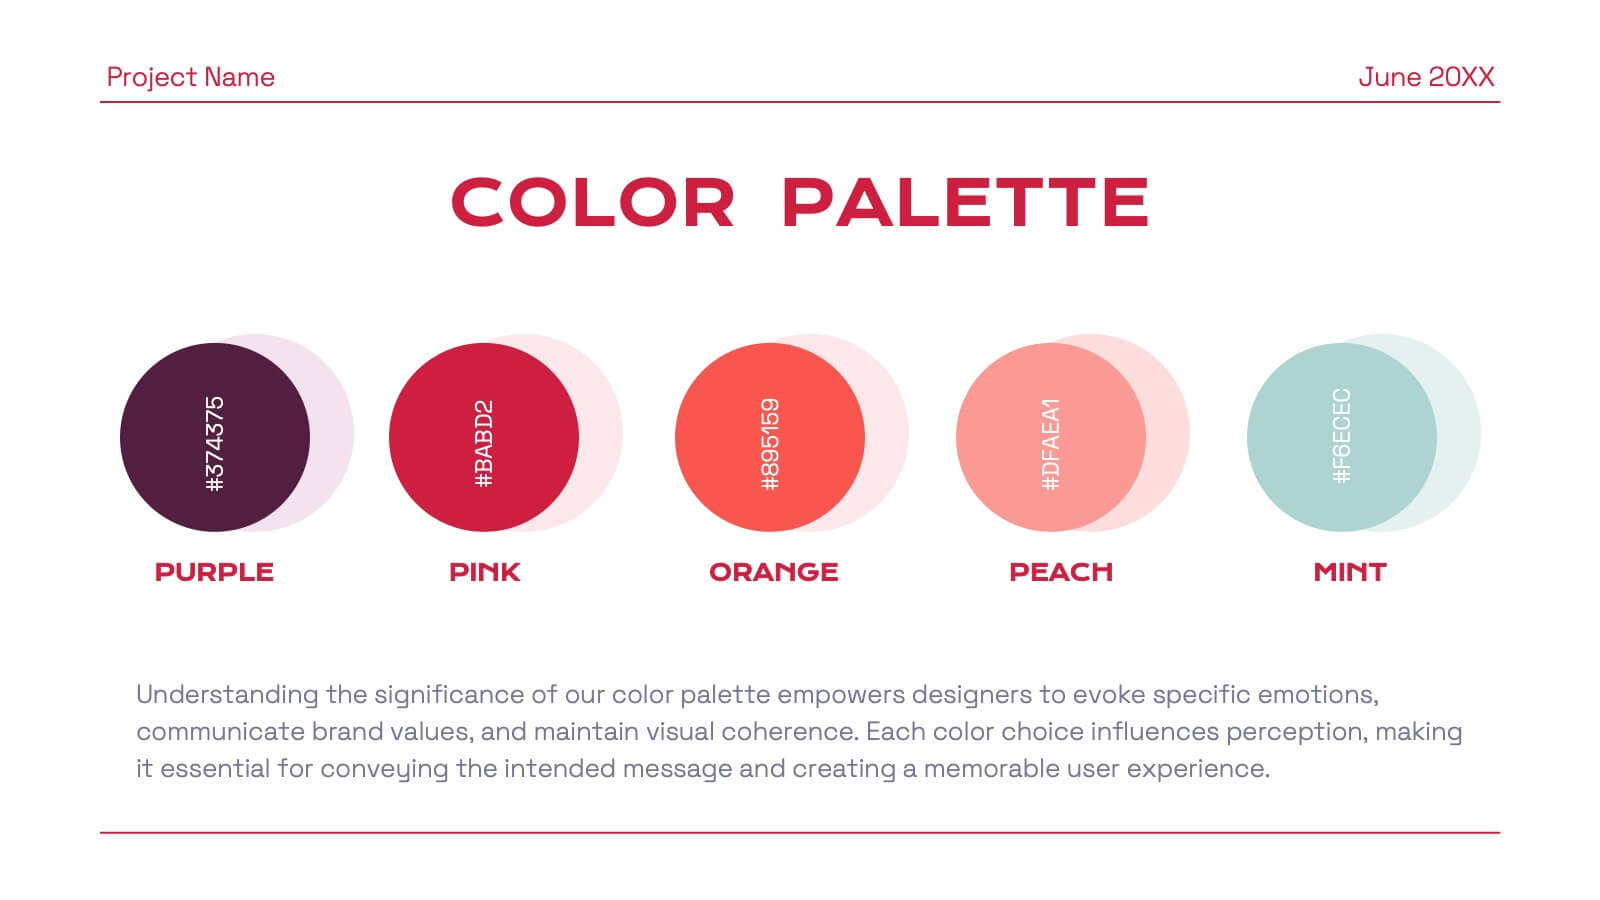
Dreamspire Academic Research Report Presentation
Present your research findings with impact using this bold and dynamic report template! It includes essential sections such as objectives, methodology, key findings, and future research directions, ensuring a comprehensive overview. Perfect for academic, business, or industry research presentations, this template is fully compatible with PowerPoint, Keynote, and Google Slides.


5 diapositivas
Risk and Return Investment Presentation
Navigate the high seas of finance with our captivating infographic presentation template, designed to visually break down the complex relationship between risk and return in investments. This template simplifies presenting key data points, making it ideal for financiers and investors looking to make informed decisions. Each slide is meticulously crafted to ensure clarity and impact, highlighting the balance of potential rewards against possible risks. Perfect for use in PowerPoint, Keynote, and Google Slides, this template is a must-have tool for anyone in the financial sector aiming to convey their strategy with precision and flair.


6 diapositivas
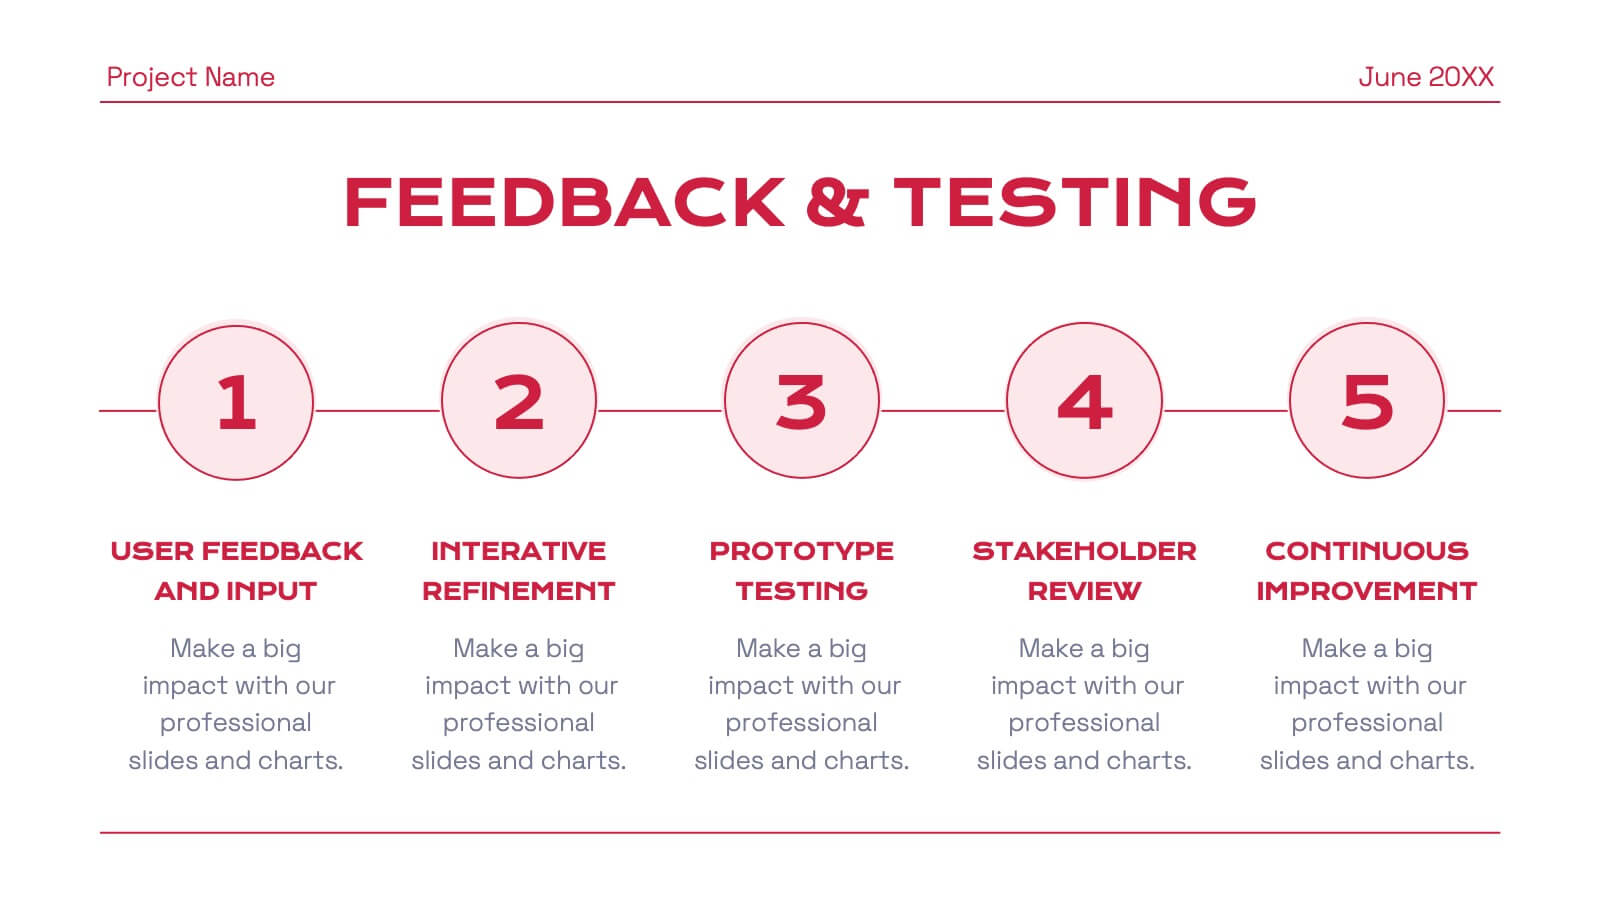
Six Sigma DMAIC Method Presentation
Bring clarity and momentum to your improvement plan with this dynamic presentation, designed to visually guide teams through each stage of a structured problem-solving process. It helps you present goals, insights, and actions with confidence while keeping the workflow clear and engaging. Fully compatible with PowerPoint, Keynote, and Google Slides.


5 diapositivas
Data Breach Infographics
A data breach refers to an incident where unauthorized individuals gain access to sensitive, confidential, or protected information. This infographic is designed to educate and raise awareness about data breaches, their causes, impacts, and preventive measures. It presents complex information in an understandable way, making it accessible to a wide range of audiences. The template incorporates relevant statistics and data to provide a comprehensive understanding of the prevalence and scale of data breaches. It includes graphs, charts, and infographics to visualize the frequency, magnitude, and industries most affected by data breaches.


6 diapositivas
Business Case Study Slide Deck Presentation
Bring your success story to life with a clean, data-driven layout designed to showcase real results and insights. Perfect for highlighting challenges, solutions, and measurable outcomes, this presentation helps make your analysis clear and engaging. Fully compatible with PowerPoint, Keynote, and Google Slides for easy customization and professional delivery.


5 diapositivas
Fitness Program Infographics
A fitness program is a structured plan designed to improve and maintain physical health and well-being. These vertical infographics outline the key elements and benefits of a fitness program. This template is ideal for gyms, personal trainers, and fitness enthusiasts looking to educate and inspire others to adopt a healthy and active lifestyle. The infographics offer space to include customizable workout plans tailored to different fitness levels, such as weight loss, muscle gain, or overall fitness improvement. Helpful nutrition tips are incorporated to complement the fitness program, emphasizing the importance of achieving fitness goals.


7 diapositivas
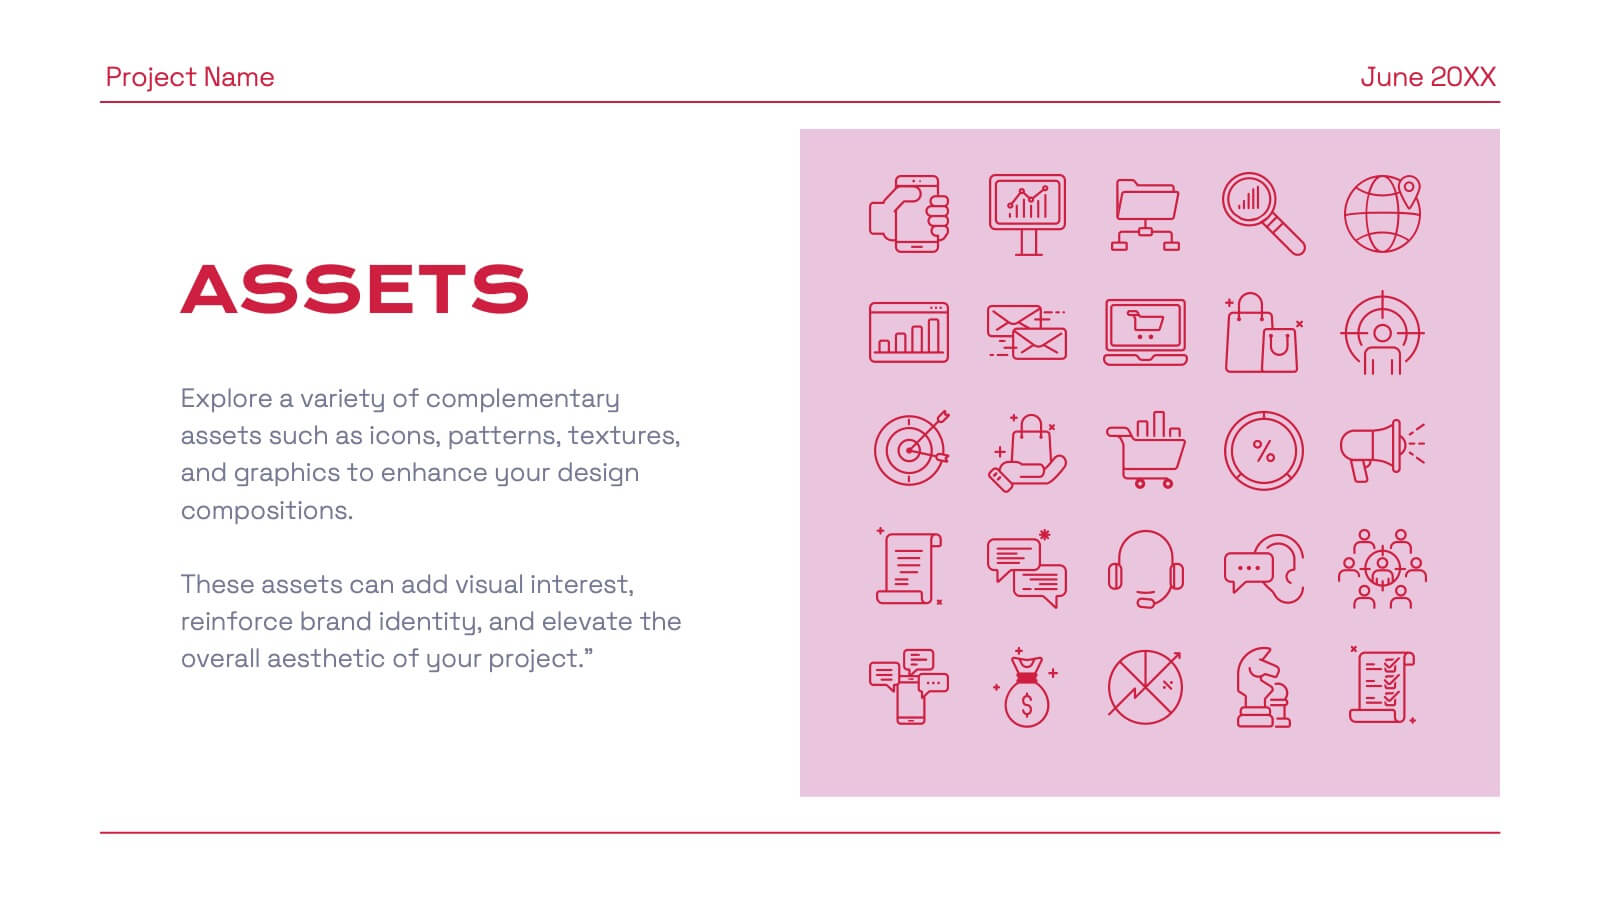
Pillar Distribution Infographic
Discover a striking visual representation of data with the pillar distribution Infographic. Bathed in shades of blue, white, and green, this template masterfully showcases the core foundations of any topic in a 'pillar' format. Specifically tailored for business analysts, educators, and marketers, the infographic aids in simplifying dense information. With its crisp graphics, bespoke icons, and dedicated image placeholders, conveying your insights becomes an engaging narrative experience. Its versatility ensures smooth integration with PowerPoint, Keynote, and Google Slides, transforming any presentation into a captivating visual story.


8 diapositivas
International Data Visualization Map Presentation
Present global data with clarity using this International Data Visualization Map. Highlight regional performance, market share, or user distribution through clean, infographic-style visuals. Ideal for business reports, global strategy updates, or research findings. Fully editable in PowerPoint, Keynote, and Google Slides—designed for sleek, professional storytelling across international audiences.


4 diapositivas
Target Market Strategy Map Presentation
Bring your strategy to life with a bold visual that makes your target market impossible to miss. This presentation helps you outline customer priorities, growth opportunities, and key competitive insights in a clean, intuitive format that keeps teams aligned and focused. Fully compatible with PowerPoint, Keynote, and Google Slides.


6 diapositivas
Internal and External Communication Plan Presentation
Enhance your Internal and External Communication Plan with this professional infographic template. Designed to illustrate key communication strategies, this slide ensures clear and effective collaboration within teams and with external stakeholders. Fully customizable in PowerPoint, Keynote, and Google Slides, making it ideal for corporate meetings, business strategy presentations, and workflow planning.


26 diapositivas
Warm Tones Real Estate Presentation
Create an engaging and inviting Warm Tone Real Estate presentation with this easy to use template. The color scheme of this welcoming template features warm tones to set the mood for a peaceful, natural environment. The cover slide features emerald green and brown, while the next two slides use warmer brown, tan shades, keeping the same theme going. Fully customizable, this template is ready to help you sell and promote properties quickly and easily. This layout is perfect for showcasing properties with a premium feel that’ll inspire confidence in both buyers and sellers alike.


8 diapositivas
Healthcare Data Analysis Presentation
The "Healthcare Data Analysis Presentation" template offers a streamlined visual representation ideal for communicating complex healthcare data insights effectively. Designed with clarity in mind, it features sleek graphics symbolizing medical elements and clear percentage tags that quantify data in an immediately understandable way. This template facilitates the presentation of key data such as patient outcomes, treatment efficacy, or operational efficiency within healthcare settings. Its visual simplicity makes it an excellent choice for healthcare professionals and administrators who need to convey detailed statistics and results to stakeholders, ensuring that the key points are easily digestible and actionable.