


Características


¿Tienes alguna pregunta?
Recomendar


21 diapositivas
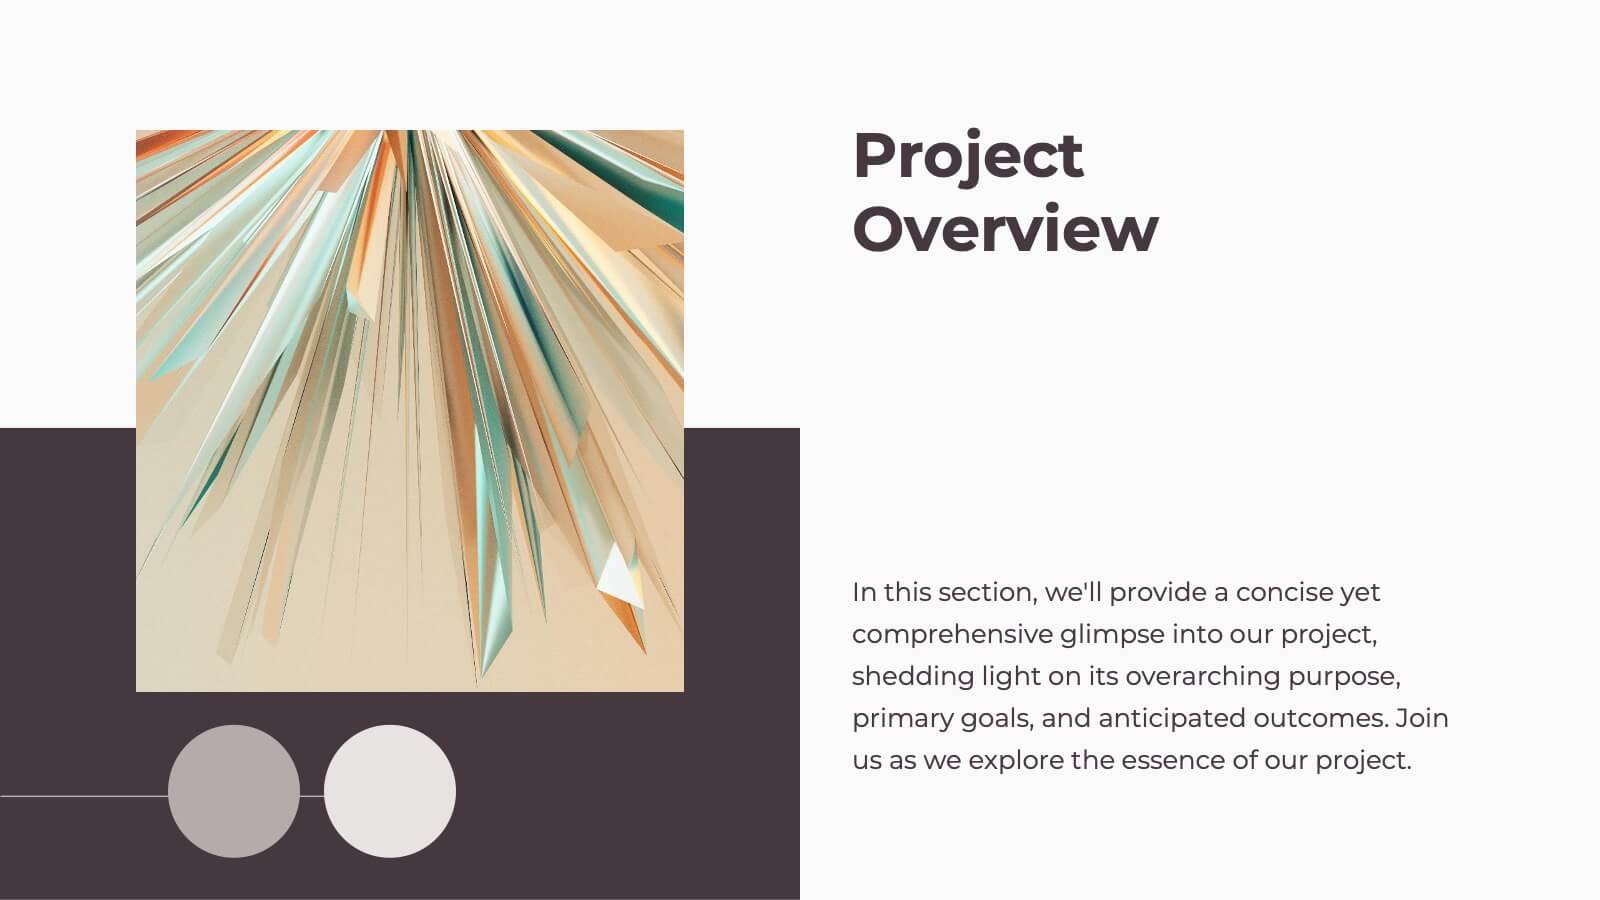
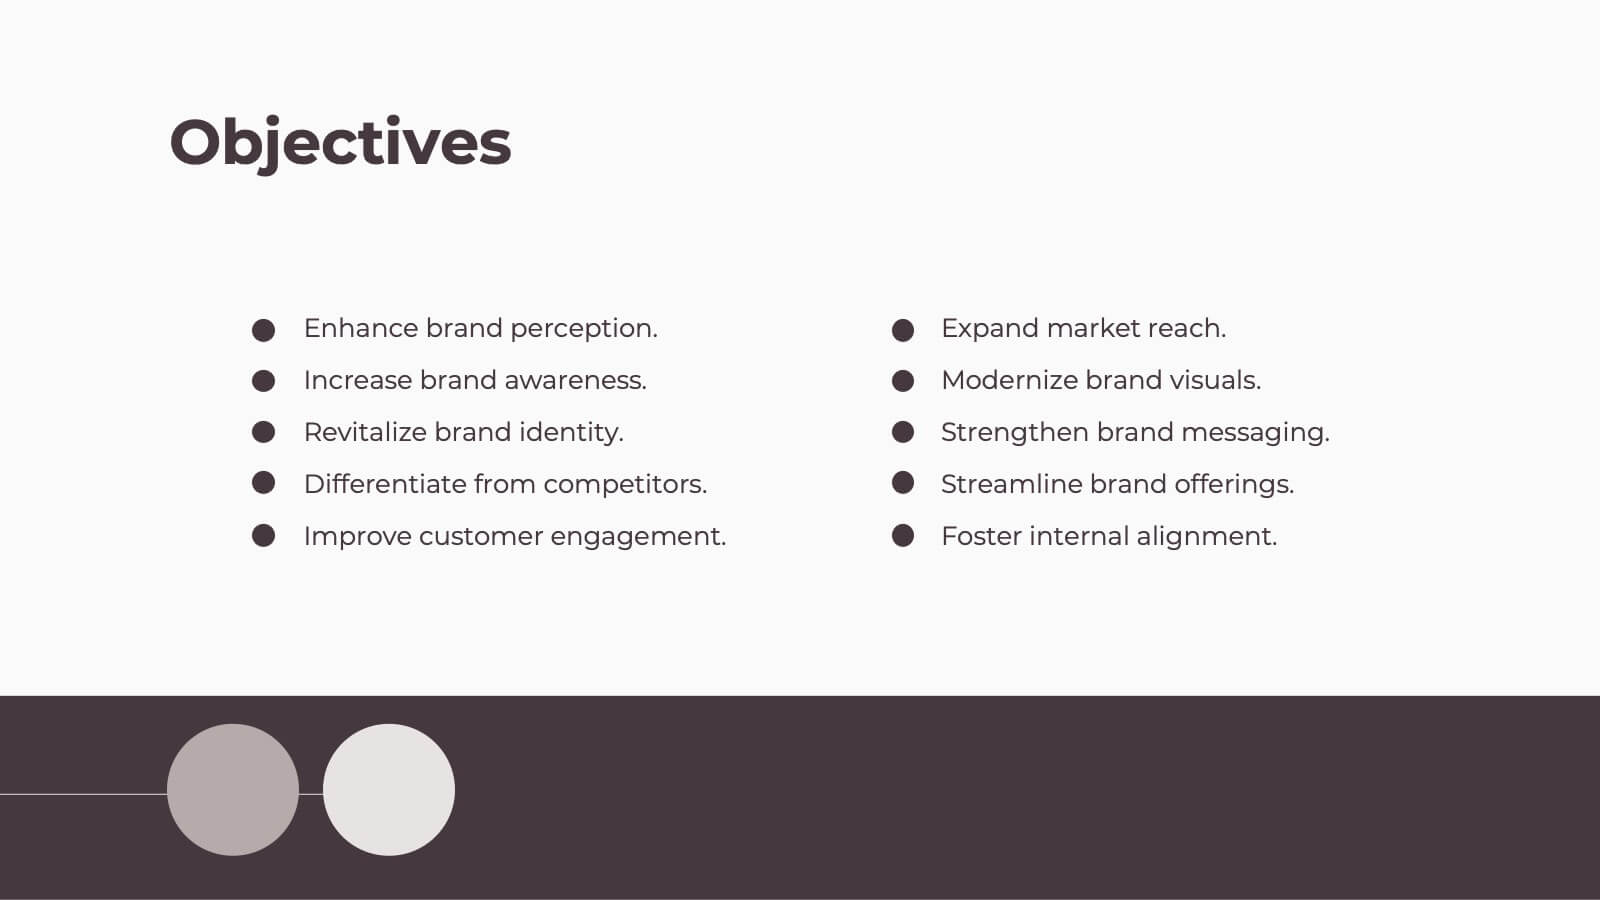
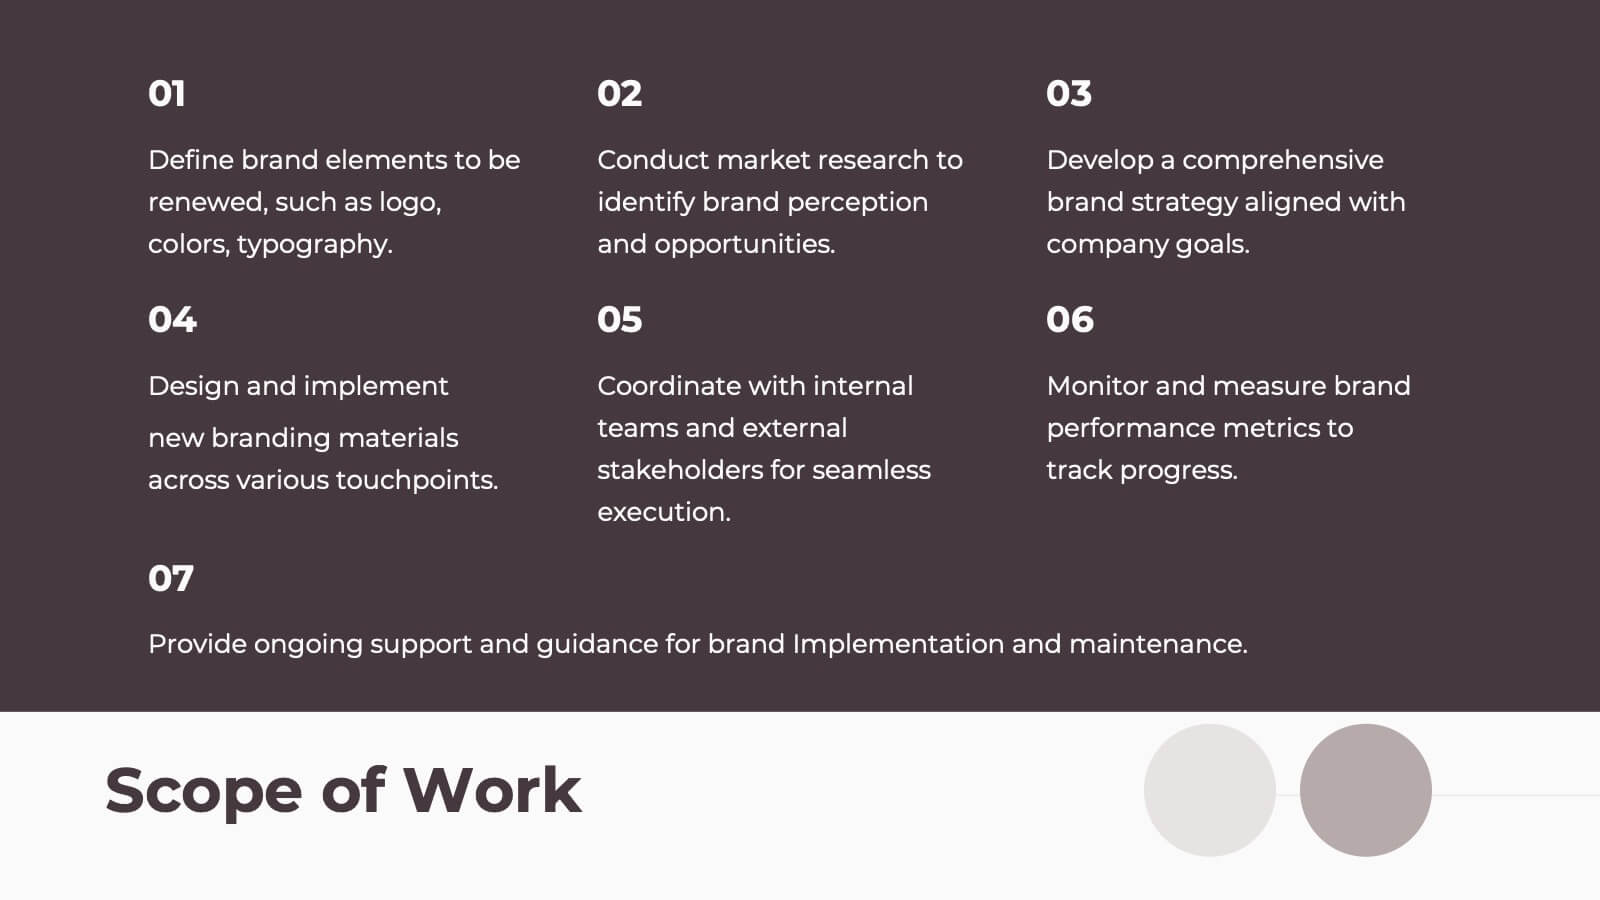
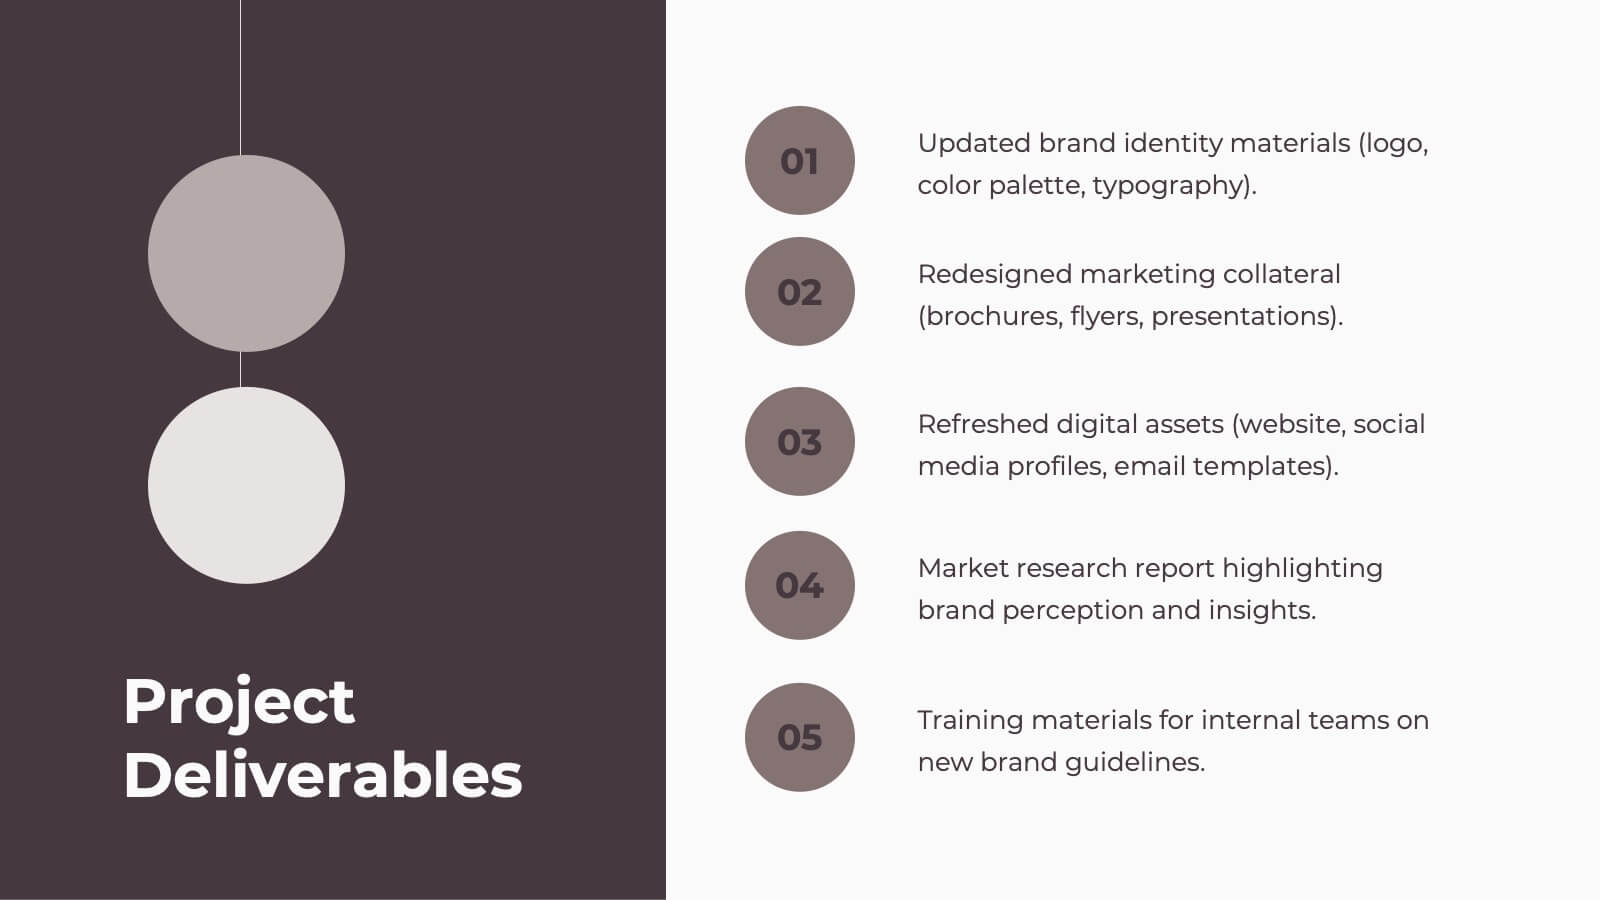
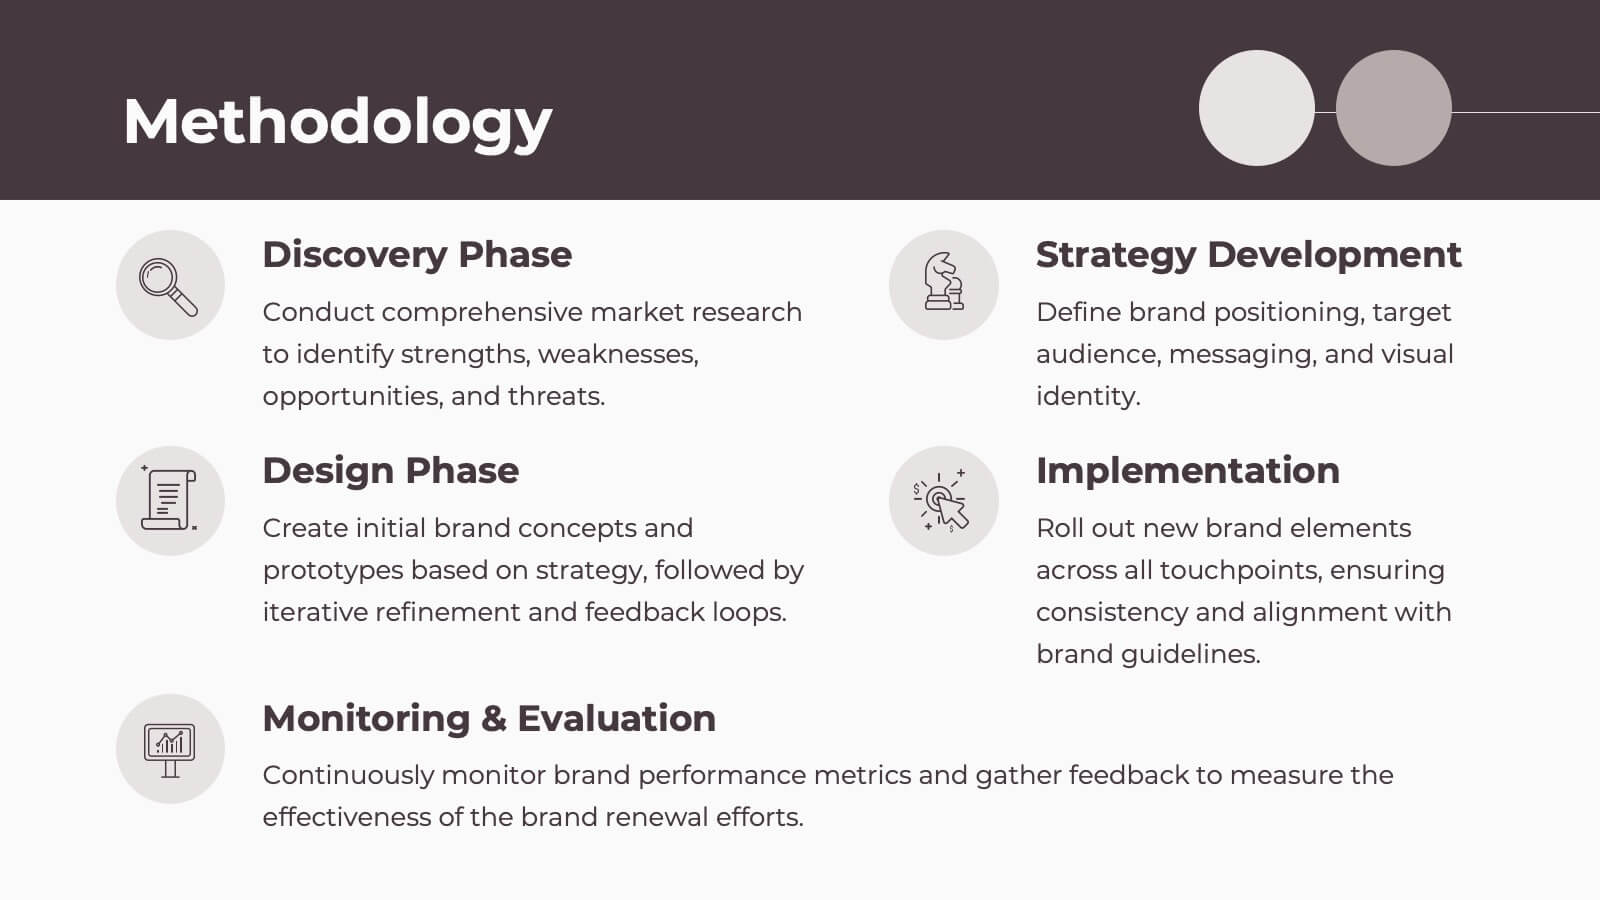
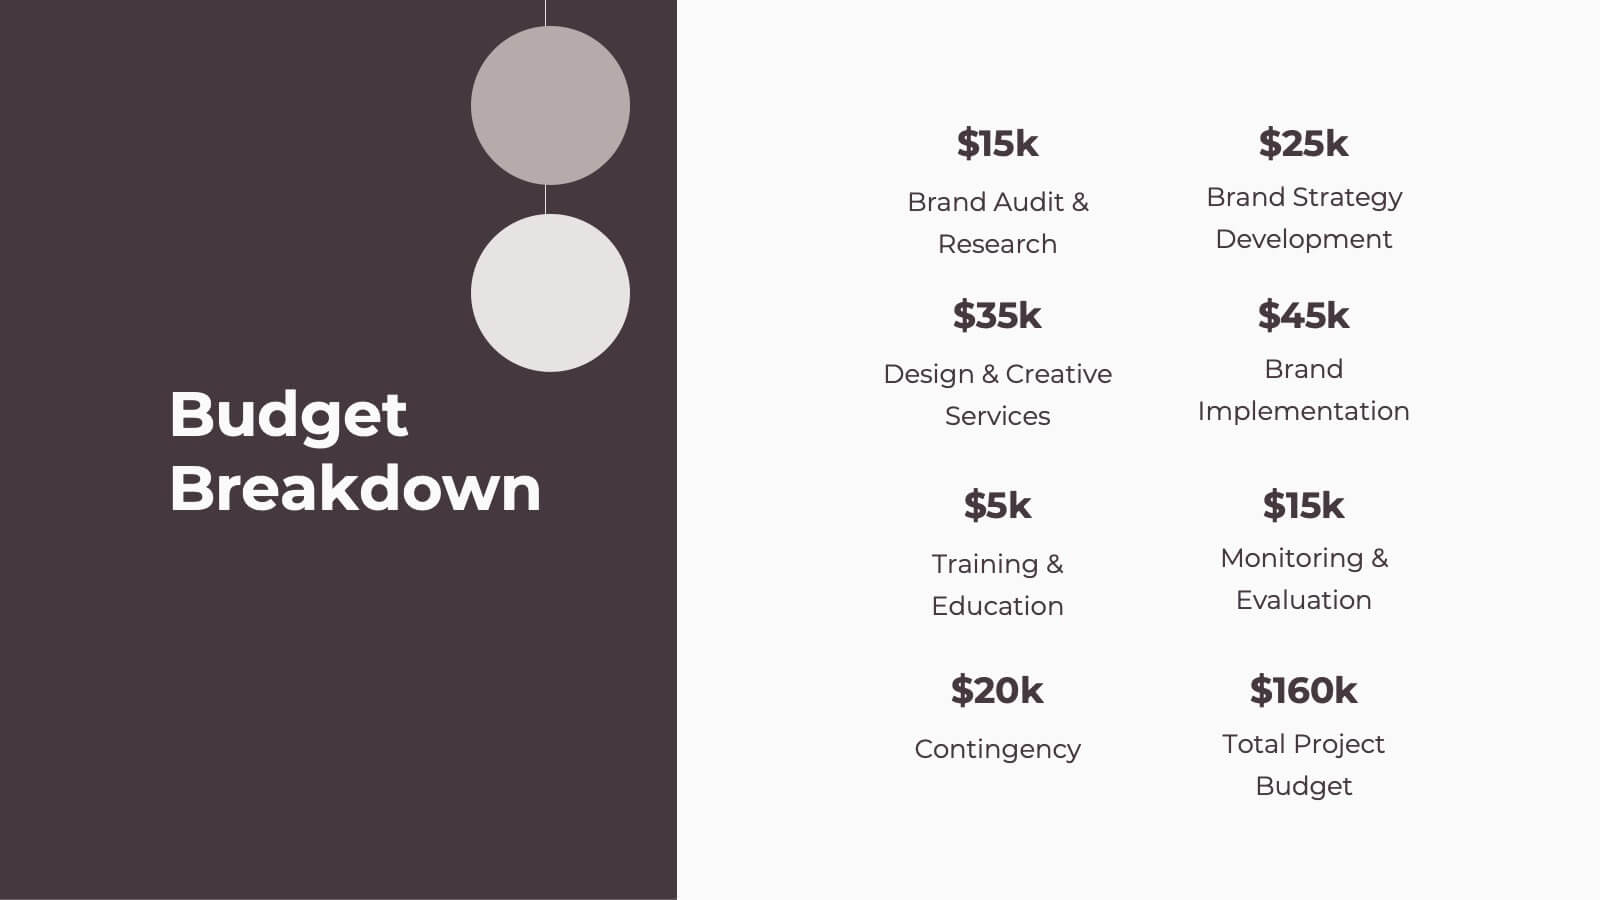
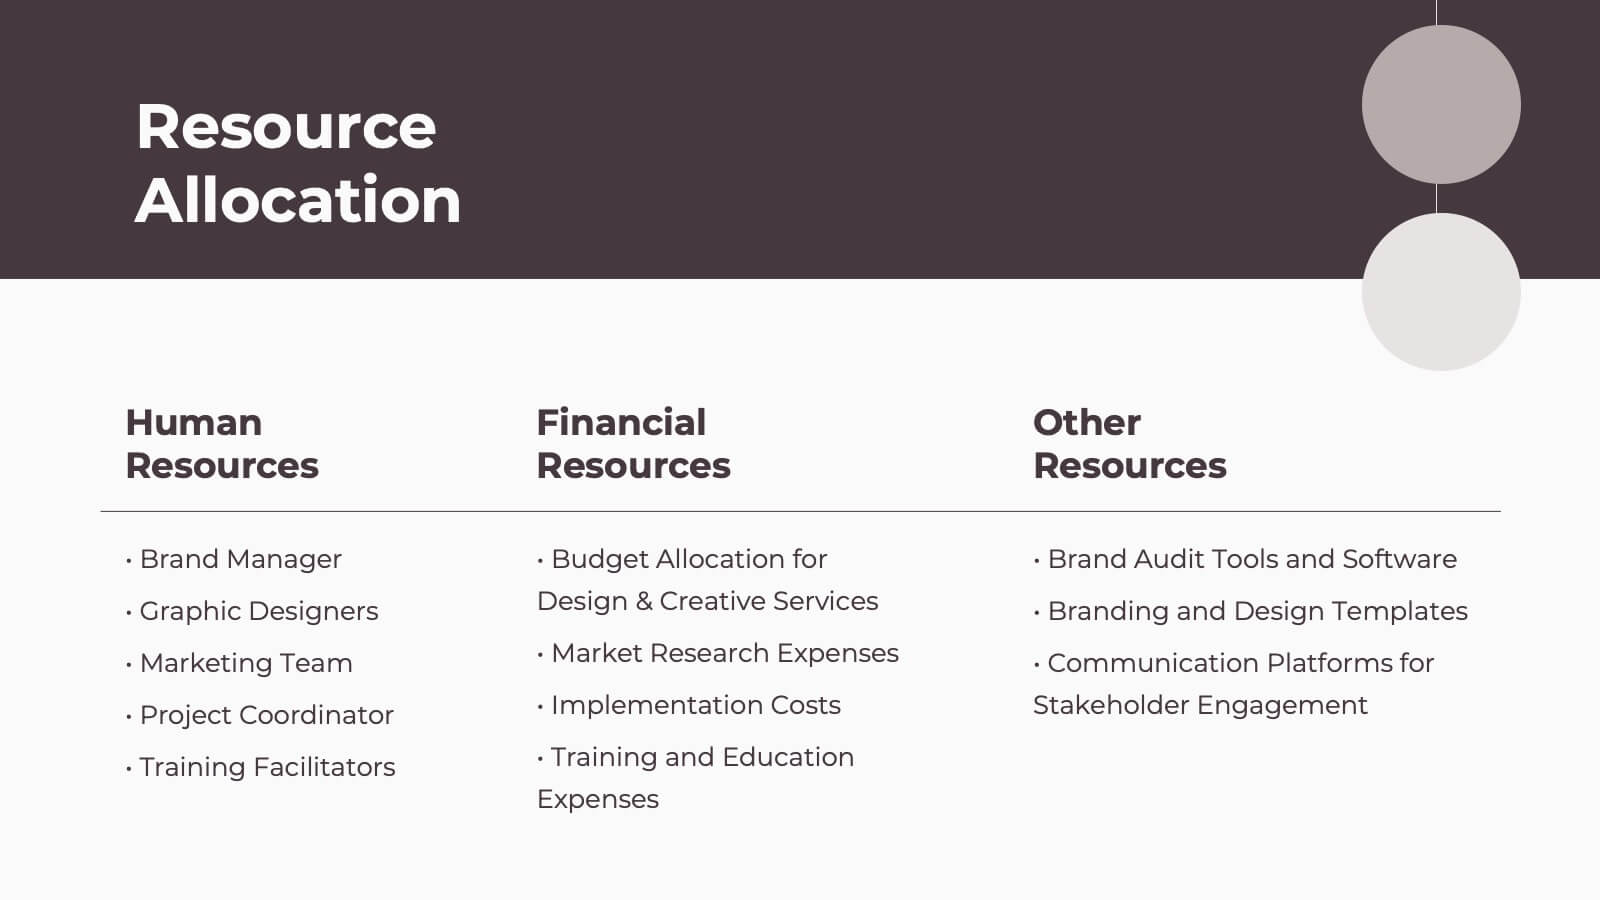
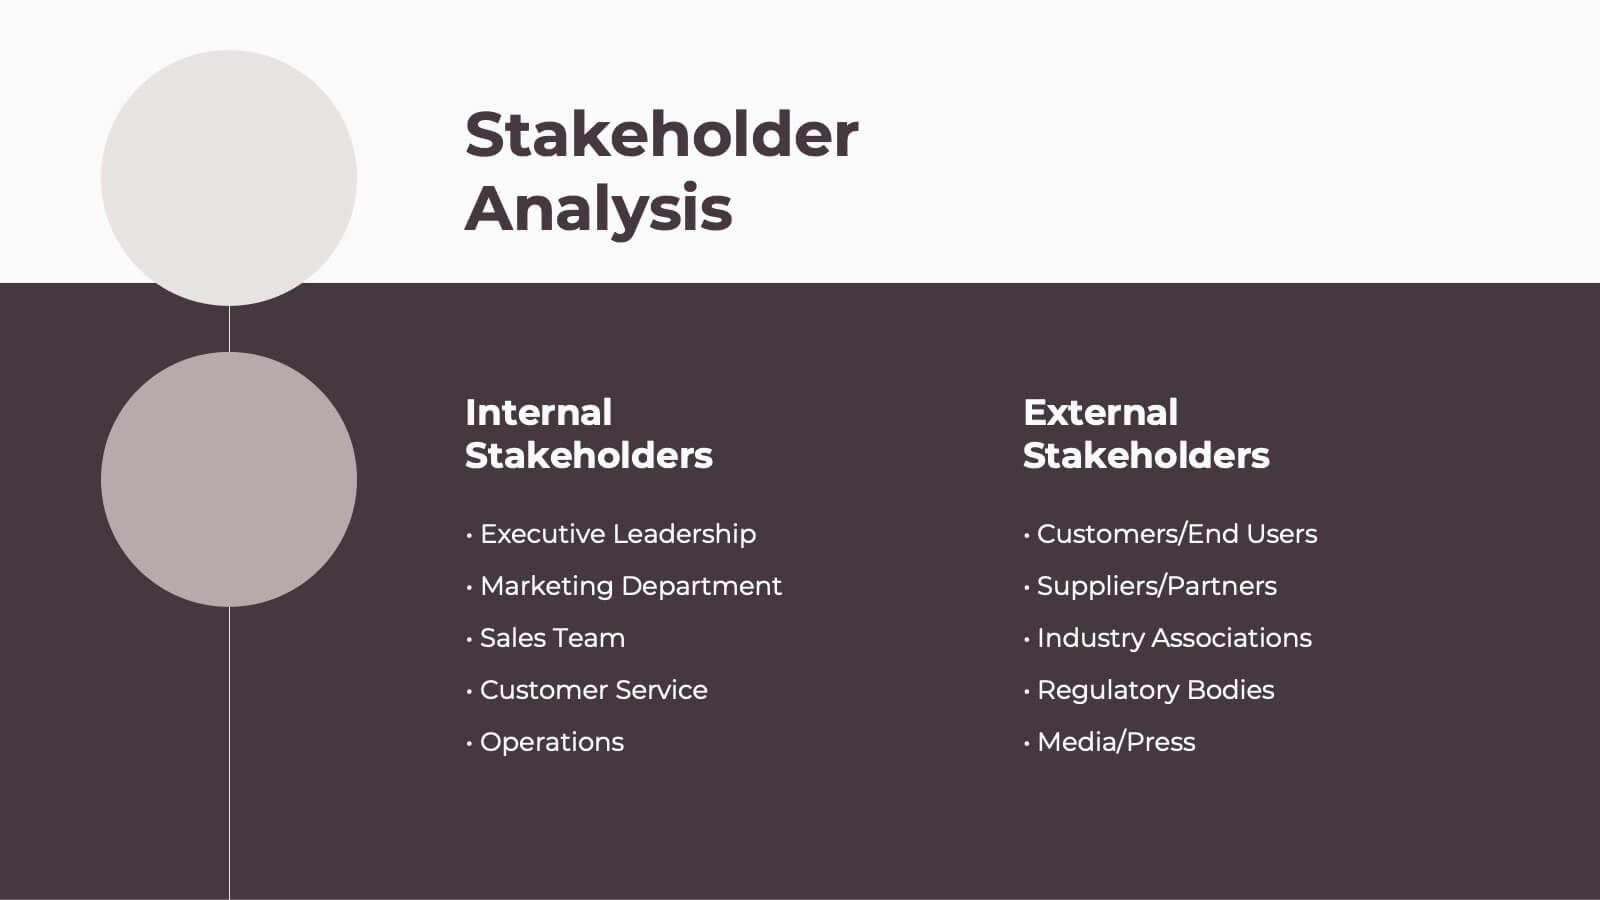
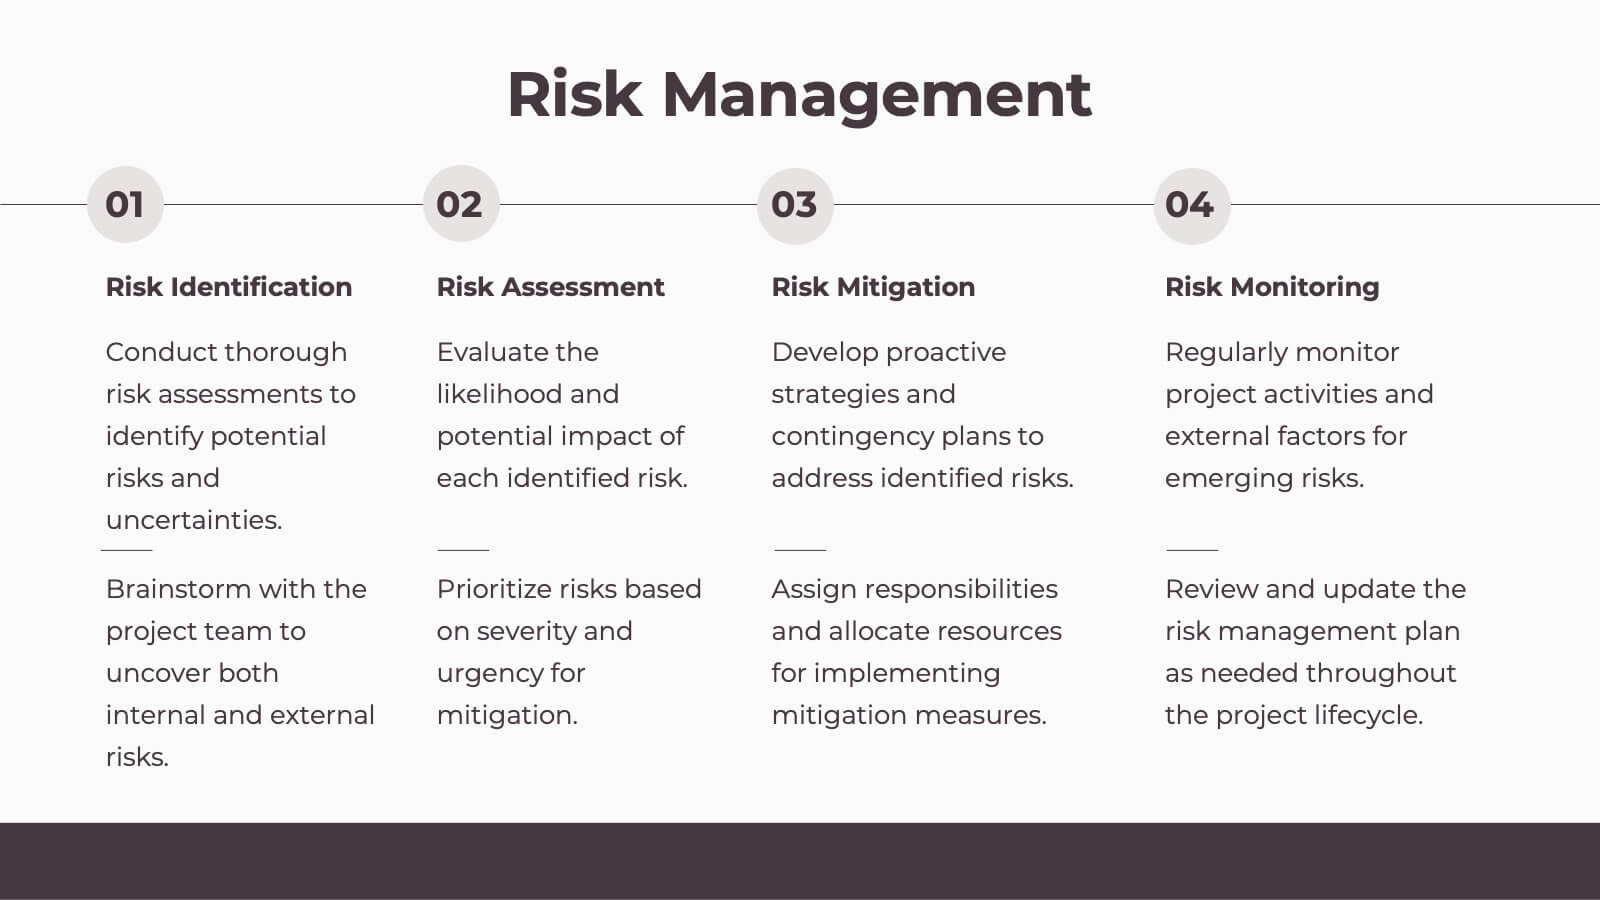
Spectrum Project Timeline Presentation
Plan and execute your projects with precision using this detailed project plan template! Perfect for outlining objectives, timelines, and resource allocation. Ideal for project managers and teams aiming to ensure successful project delivery. Compatible with PowerPoint, Keynote, and Google Slides, this template keeps your project organized, clear, and on track. Ensure project success!


6 diapositivas
McKinsey Model for Business Optimization Presentation
Illustrate business alignment with the McKinsey Model for Business Optimization Presentation. This hexagonal diagram clearly maps out the seven interdependent elements of the 7S Framework—Structure, Strategy, Systems, Skills, Staff, Style, and Shared Values—at the core. Ideal for strategy consultants, executive teams, and transformation leaders. Editable in PowerPoint, Keynote, Canva, and Google Slides.


4 diapositivas
Modern 3D Business Diagram
Bring a fresh, dimensional twist to your business strategy with this modern 3D layout. Featuring interlocking puzzle elements on a tilted grid, this slide is perfect for showcasing interrelated departments, processes, or multi-stage plans. Compatible with PowerPoint, Keynote, and Google Slides.


4 diapositivas
Key Performance Indicators Presentation
Hit every target with a bold, visual layout that helps you present performance insights with clarity and impact. This presentation makes it easy to highlight goals, measure progress, and showcase meaningful data in a clean, modern design. Fully editable and compatible with PowerPoint, Keynote, and Google Slides.


22 diapositivas
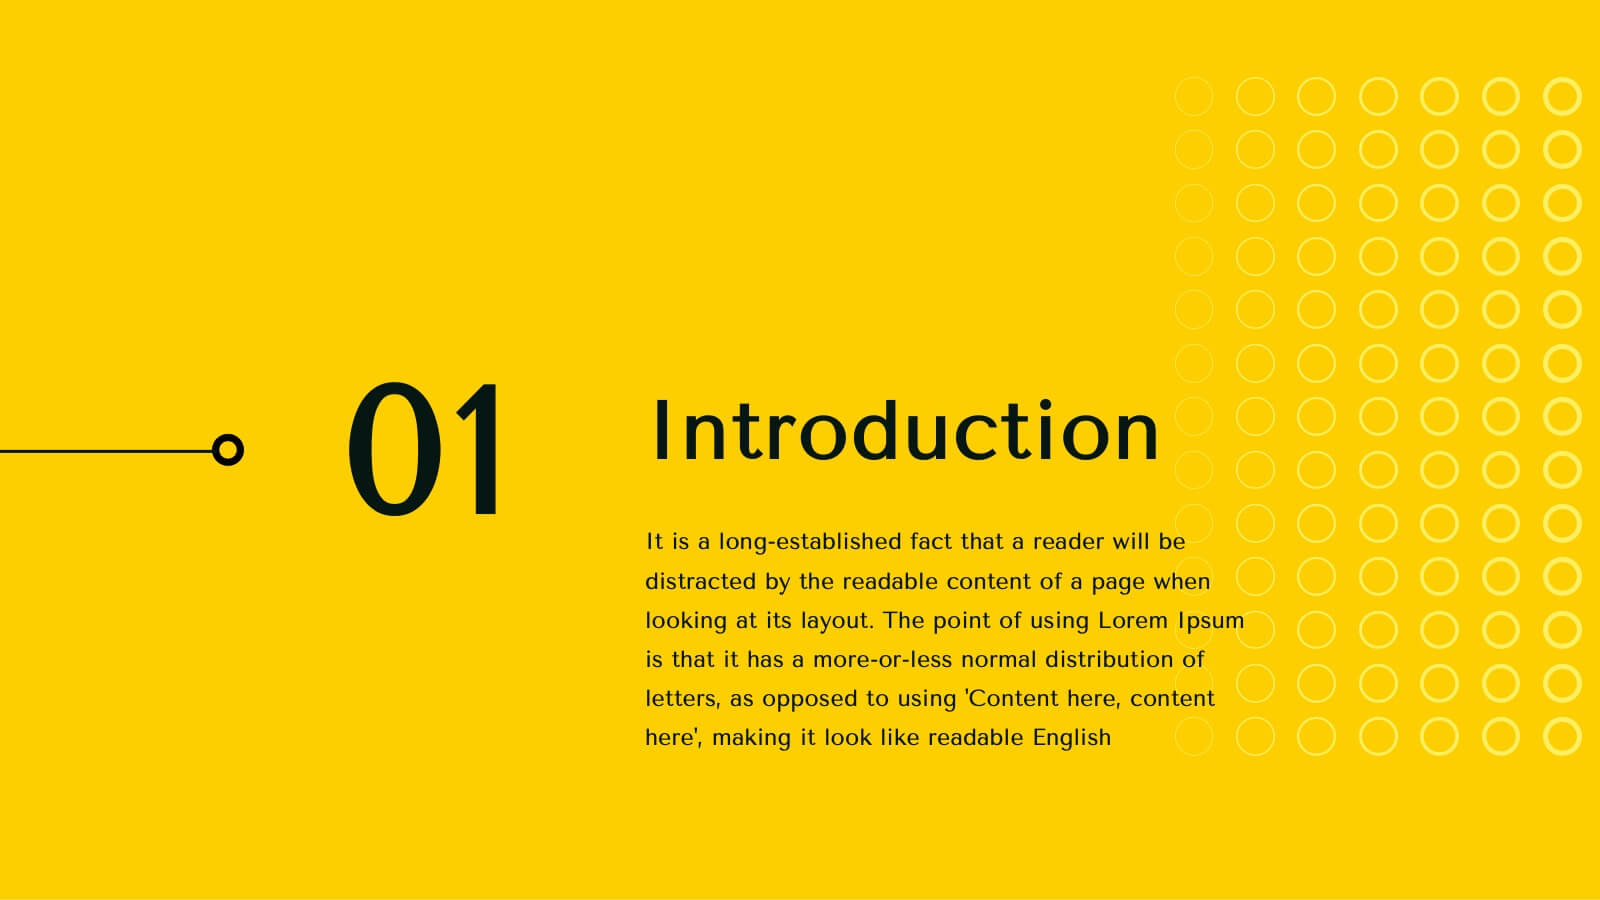
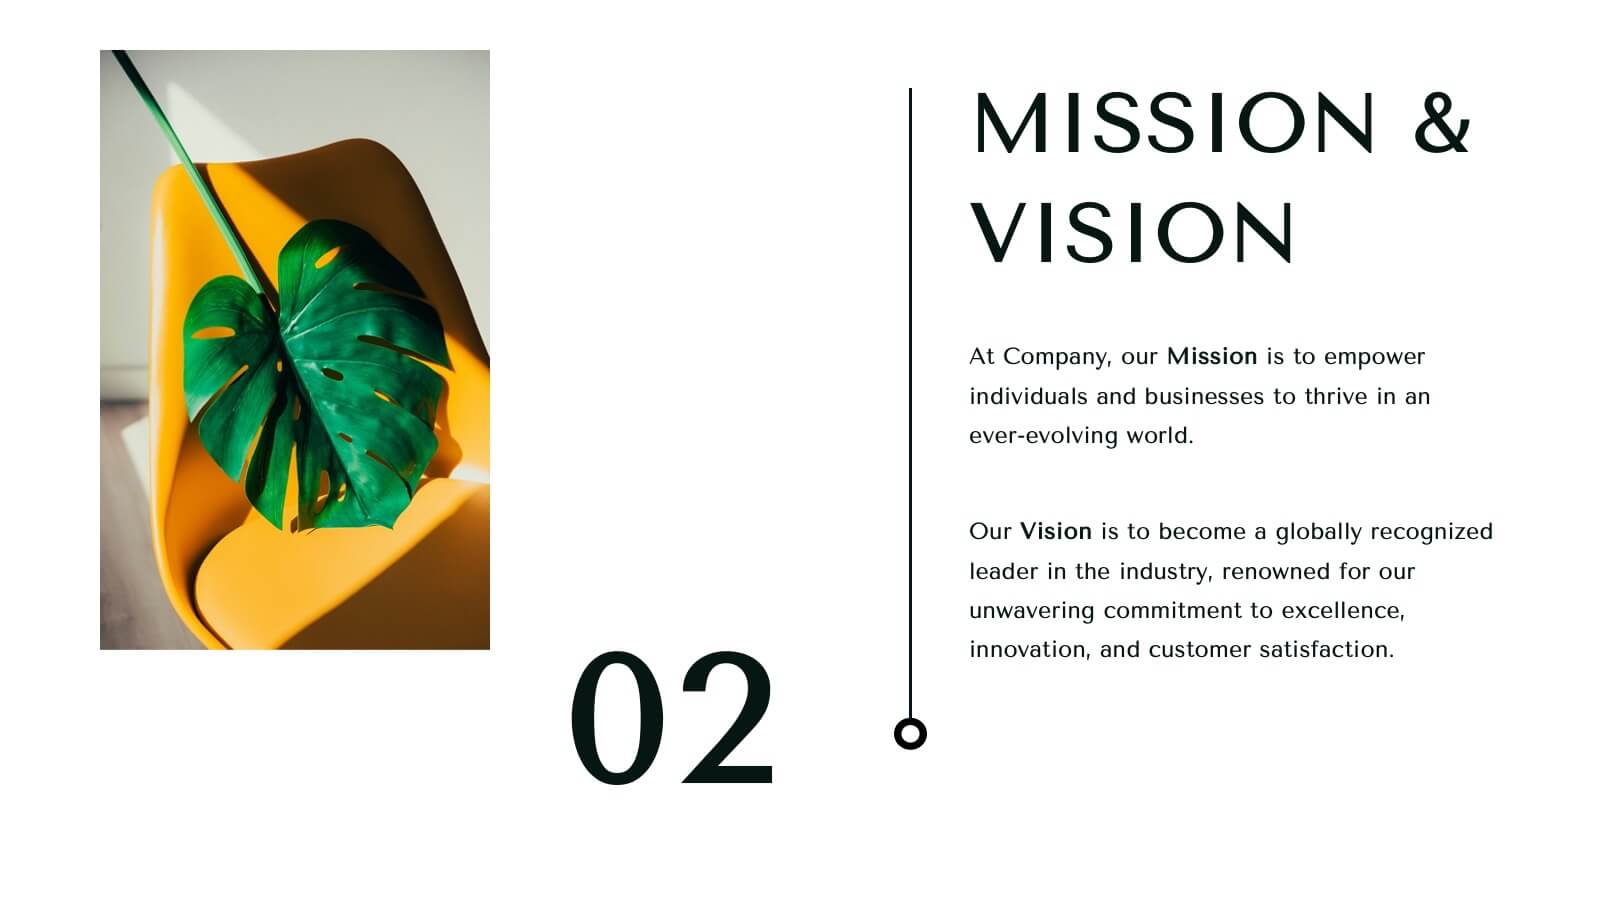
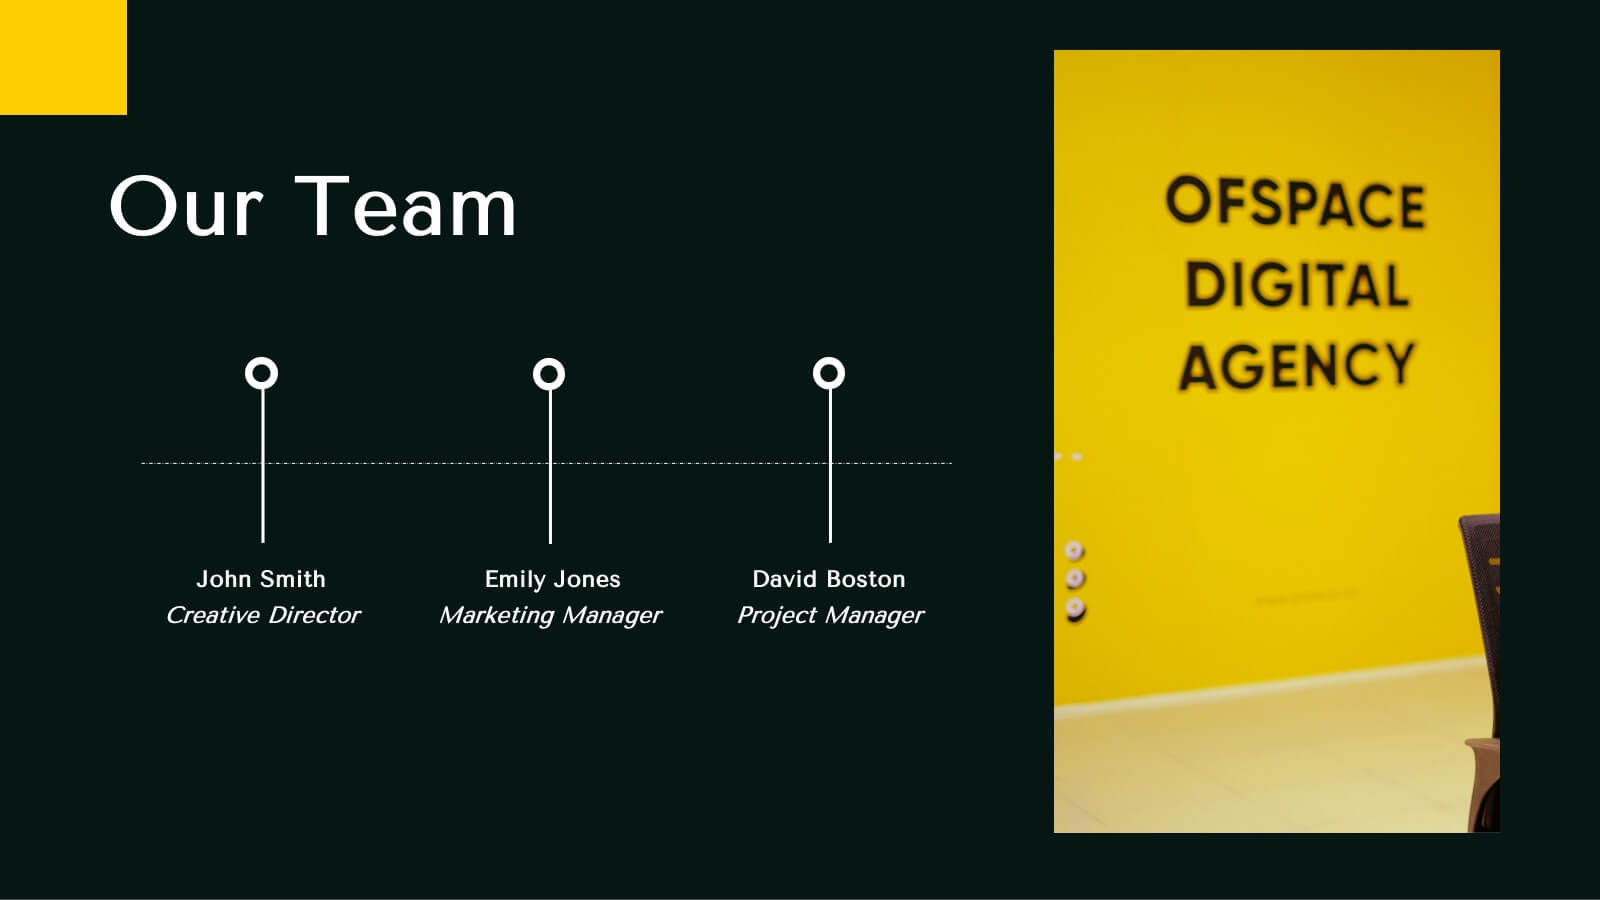
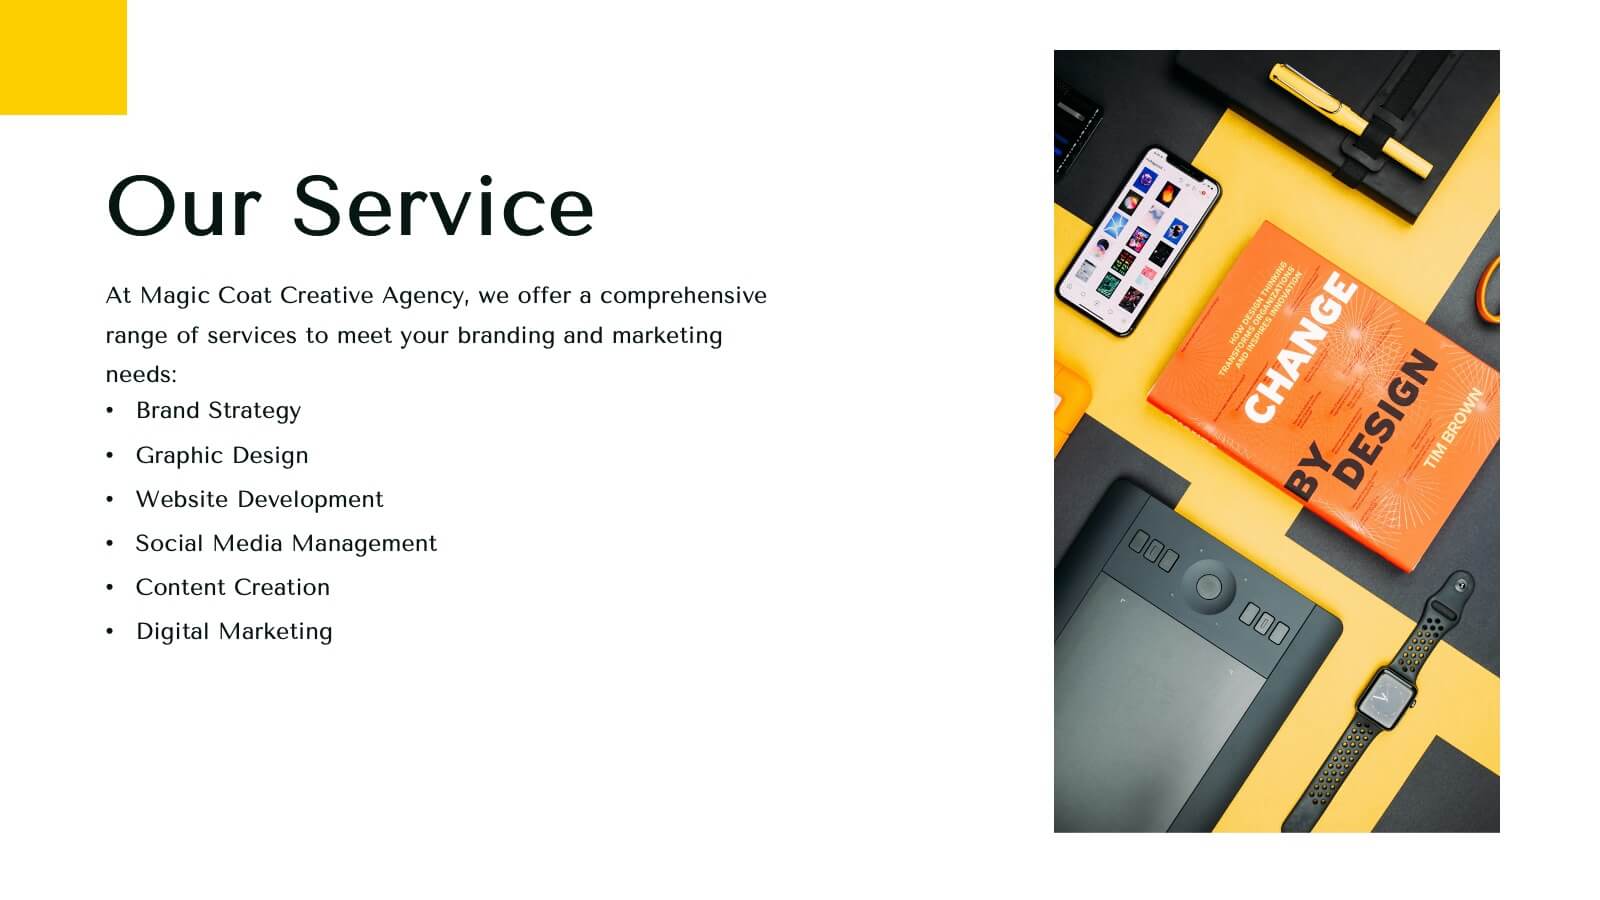
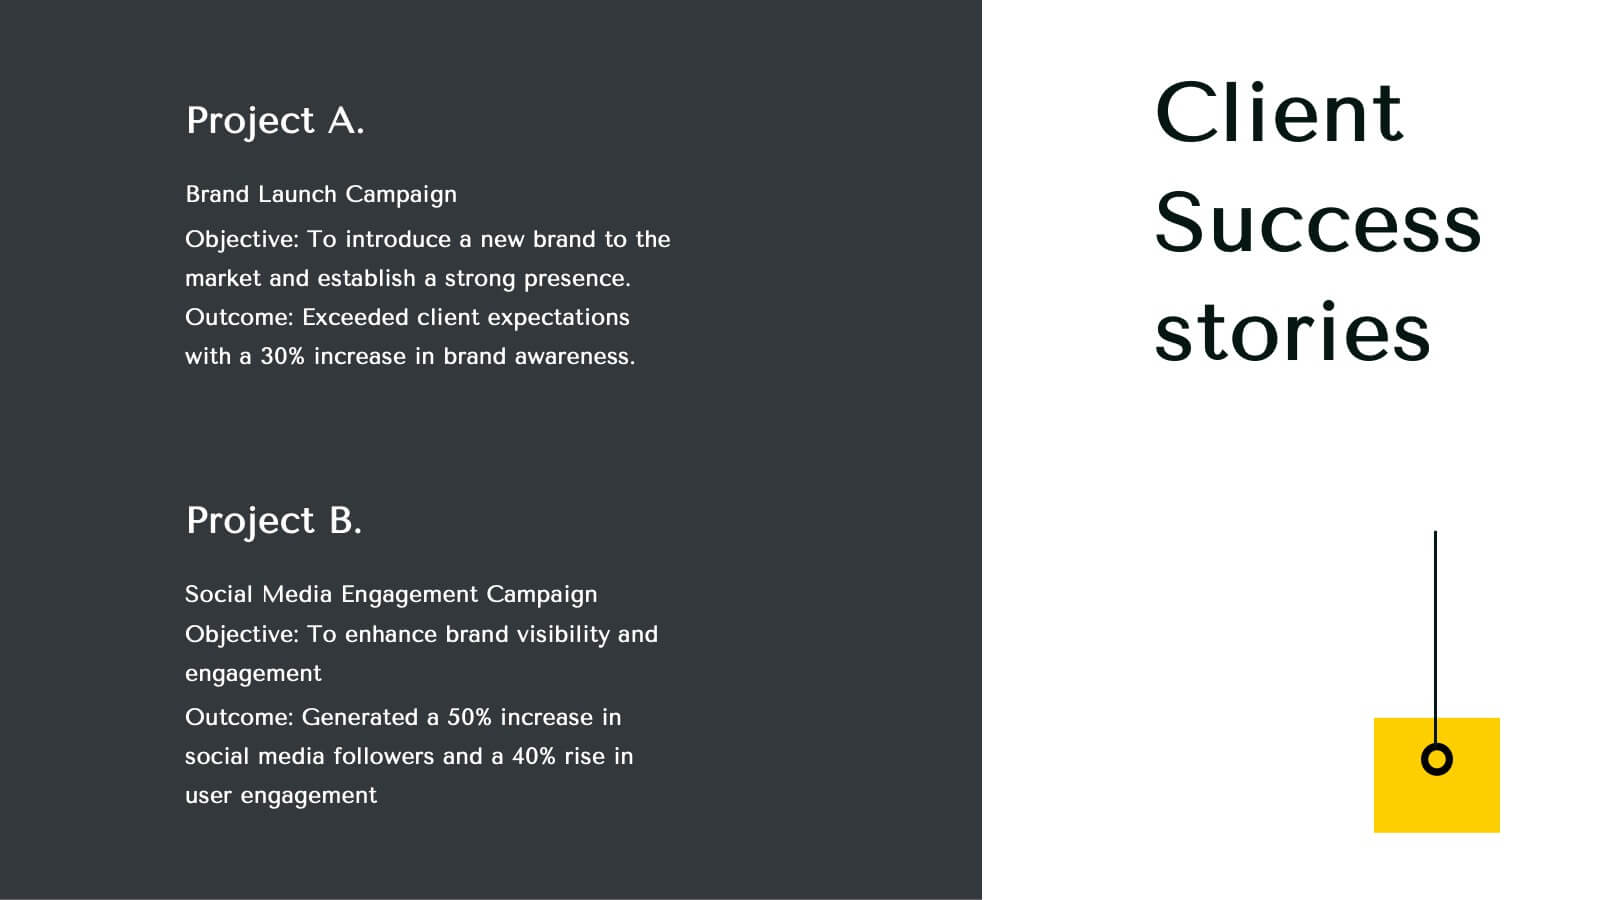
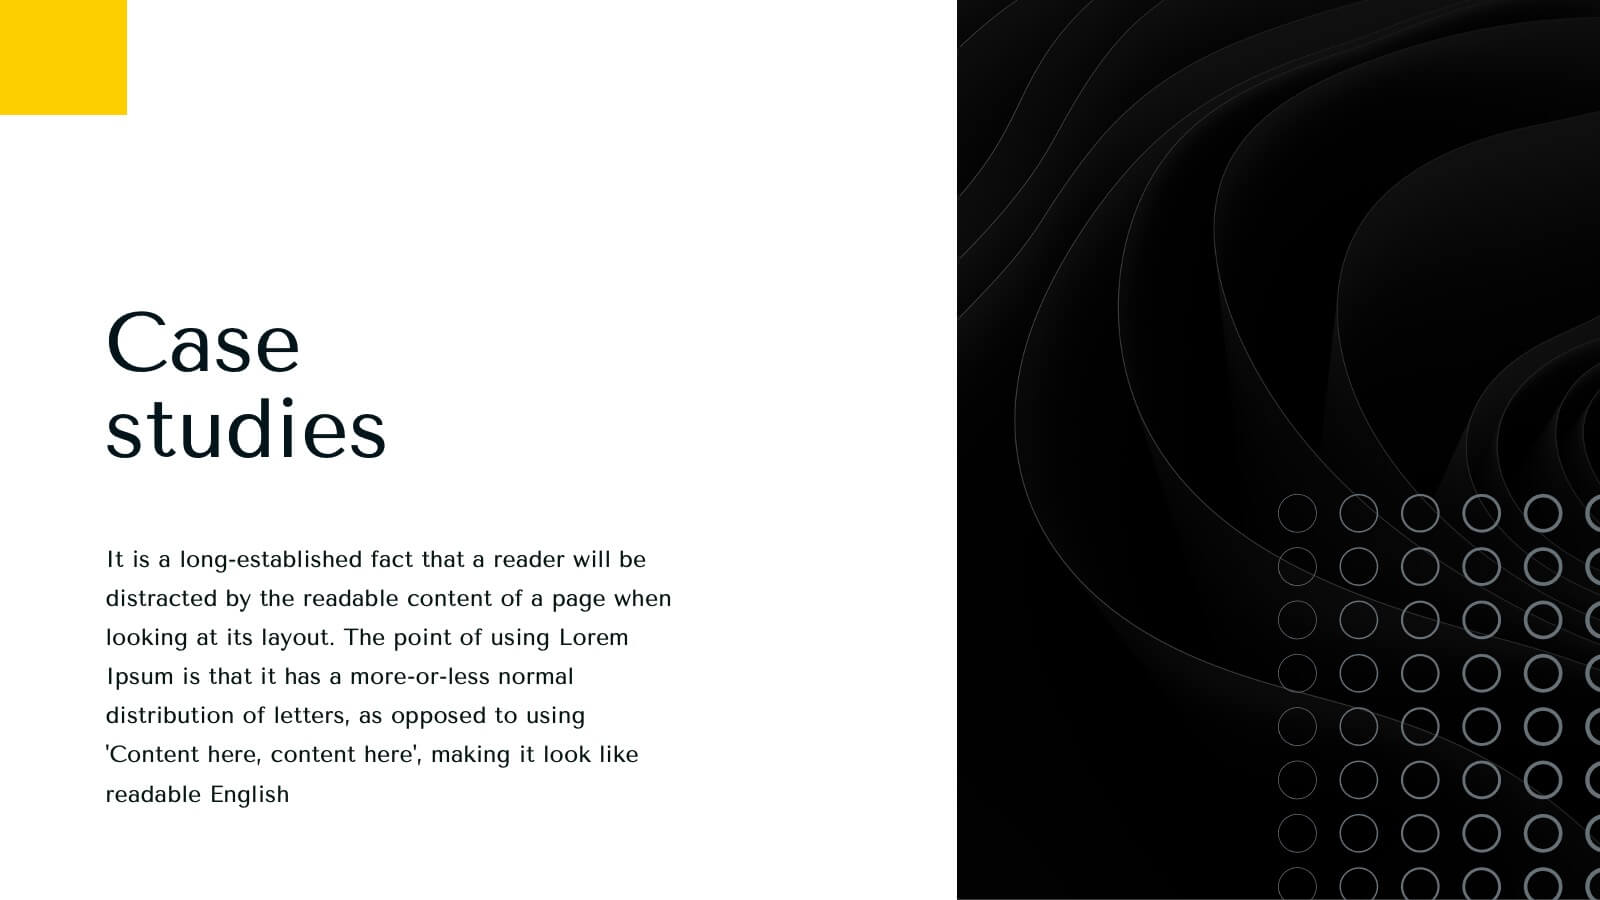
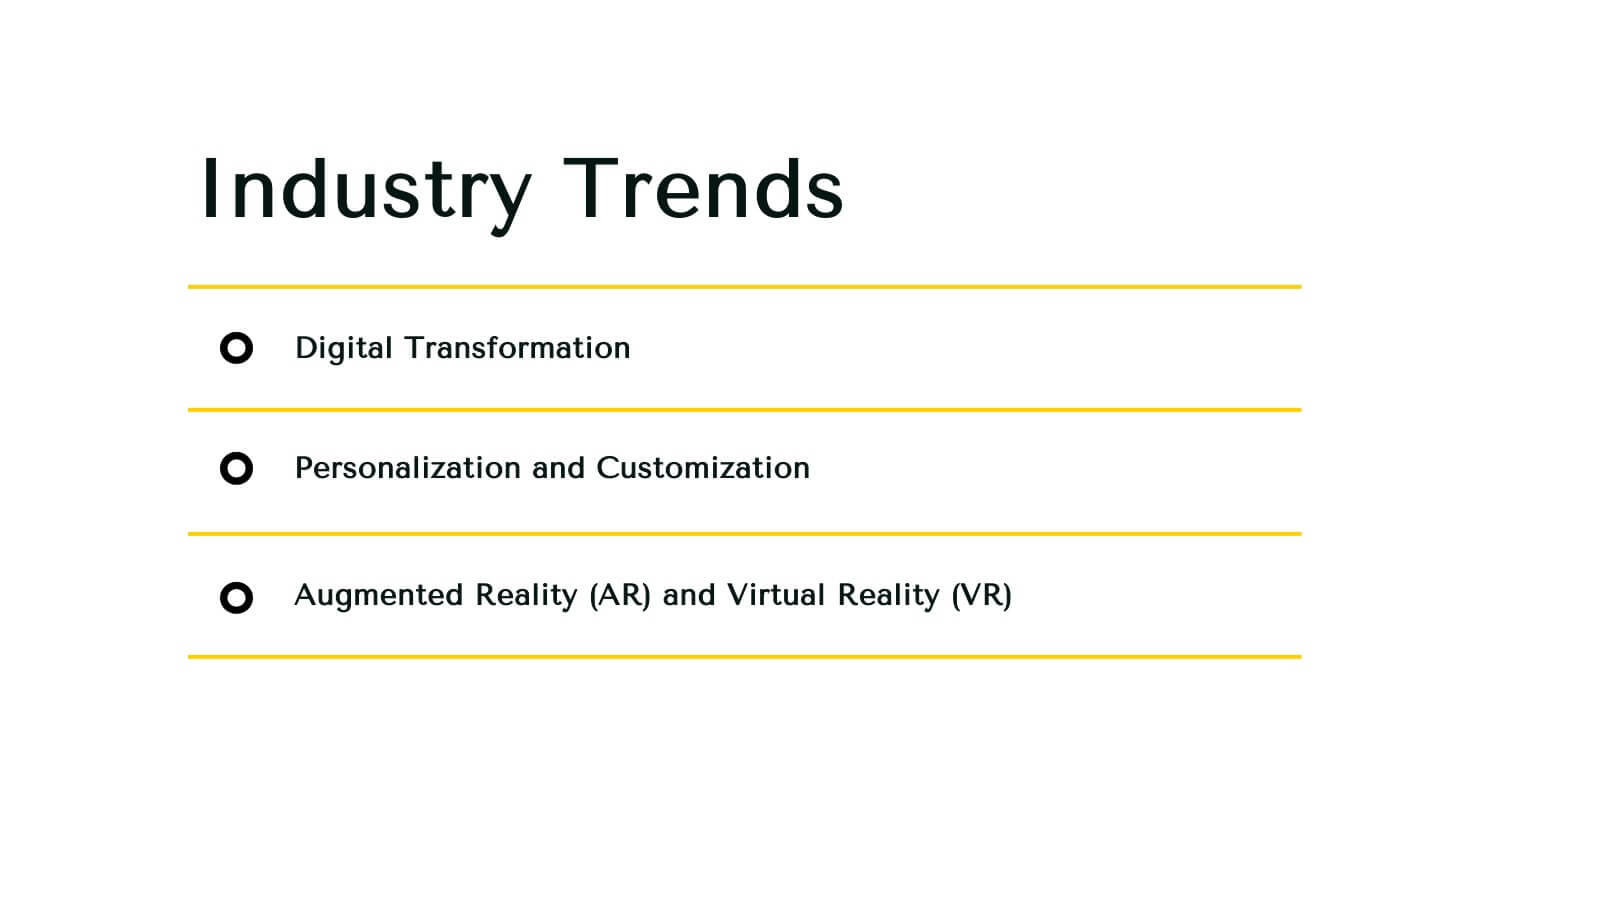
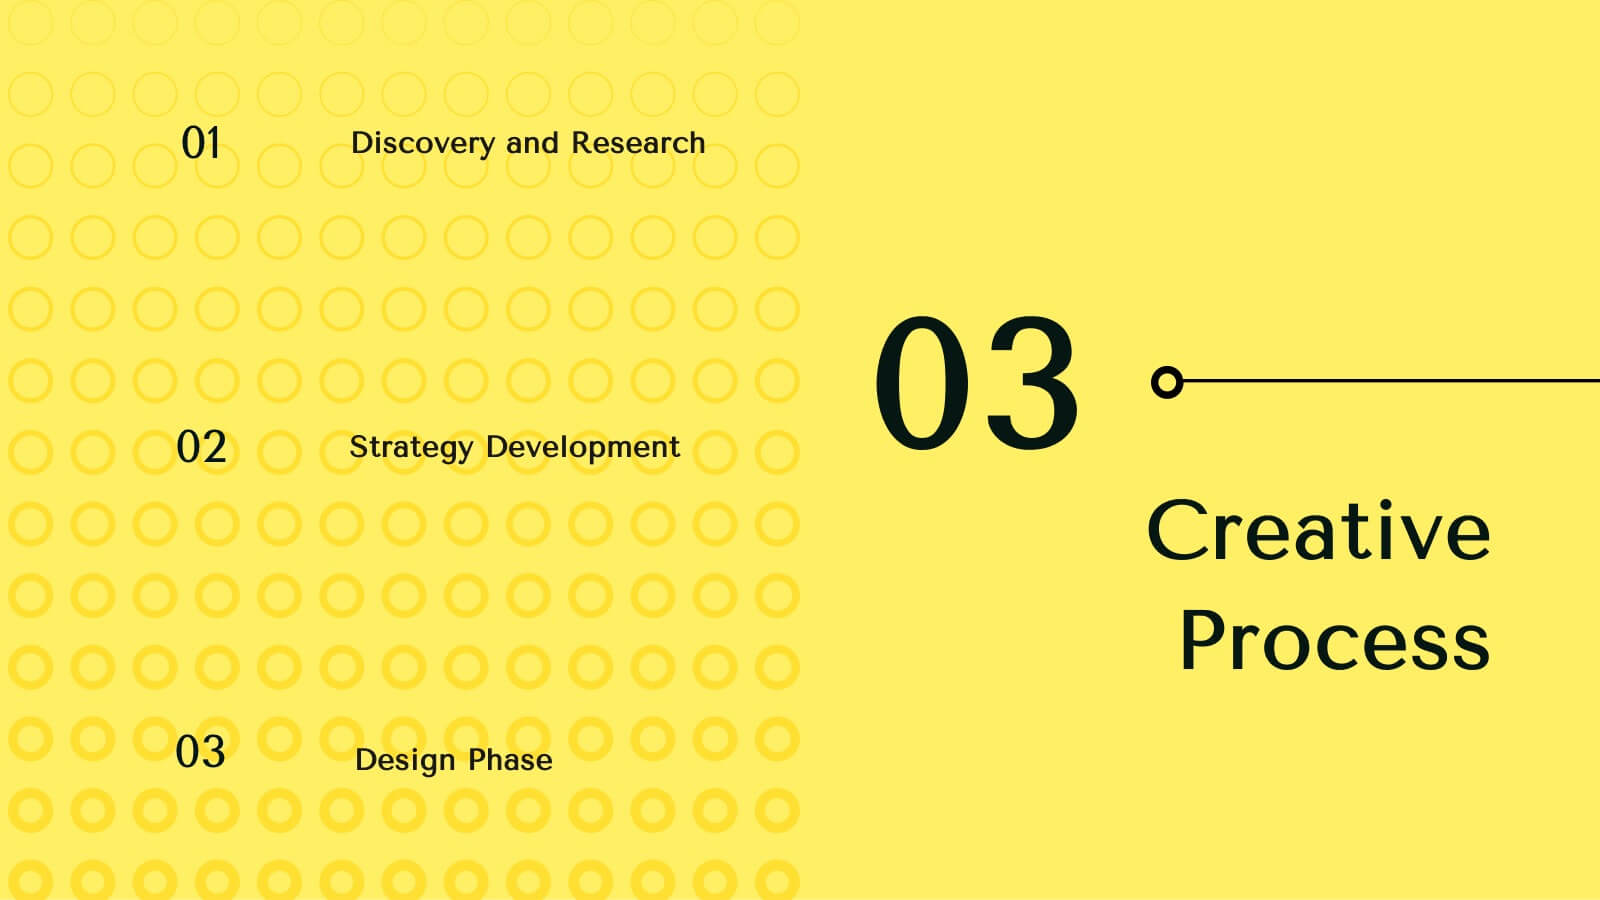
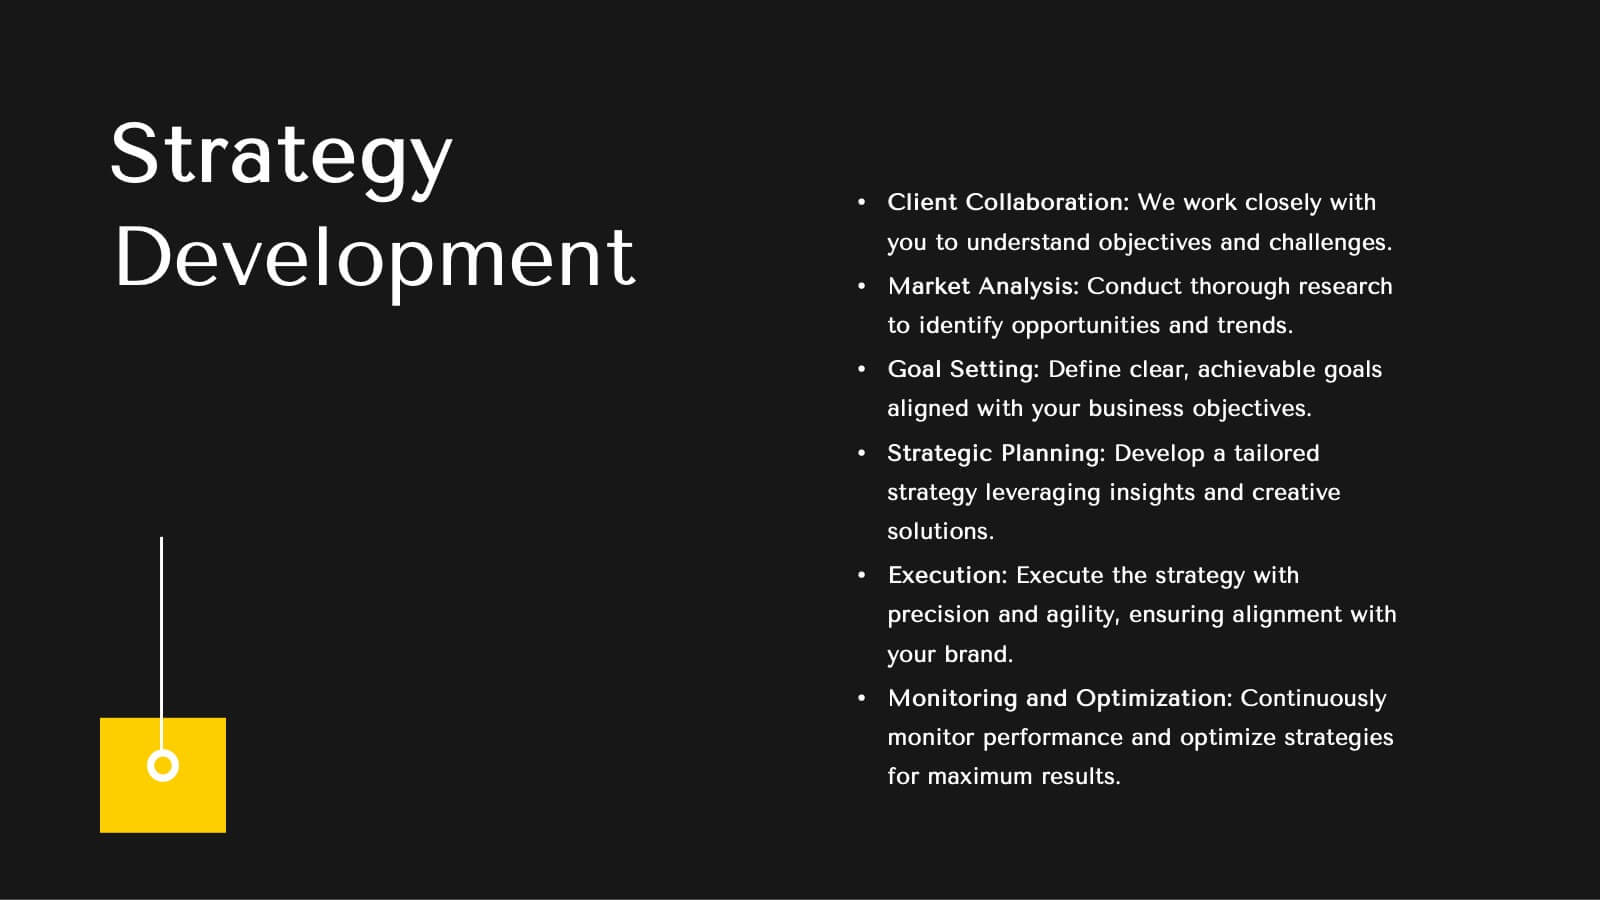
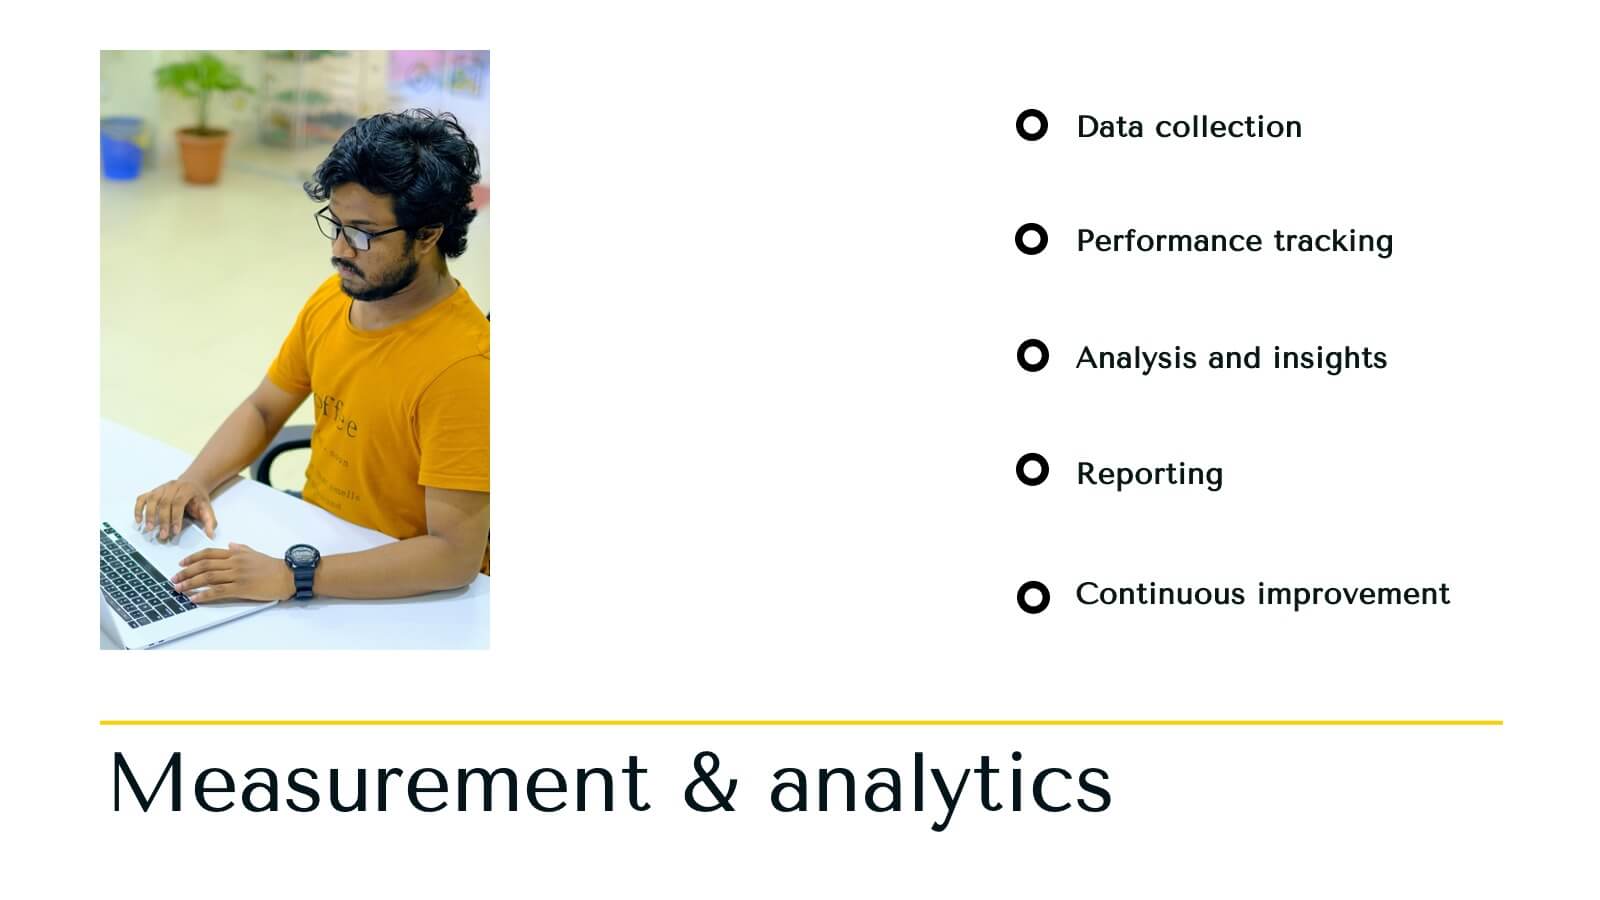
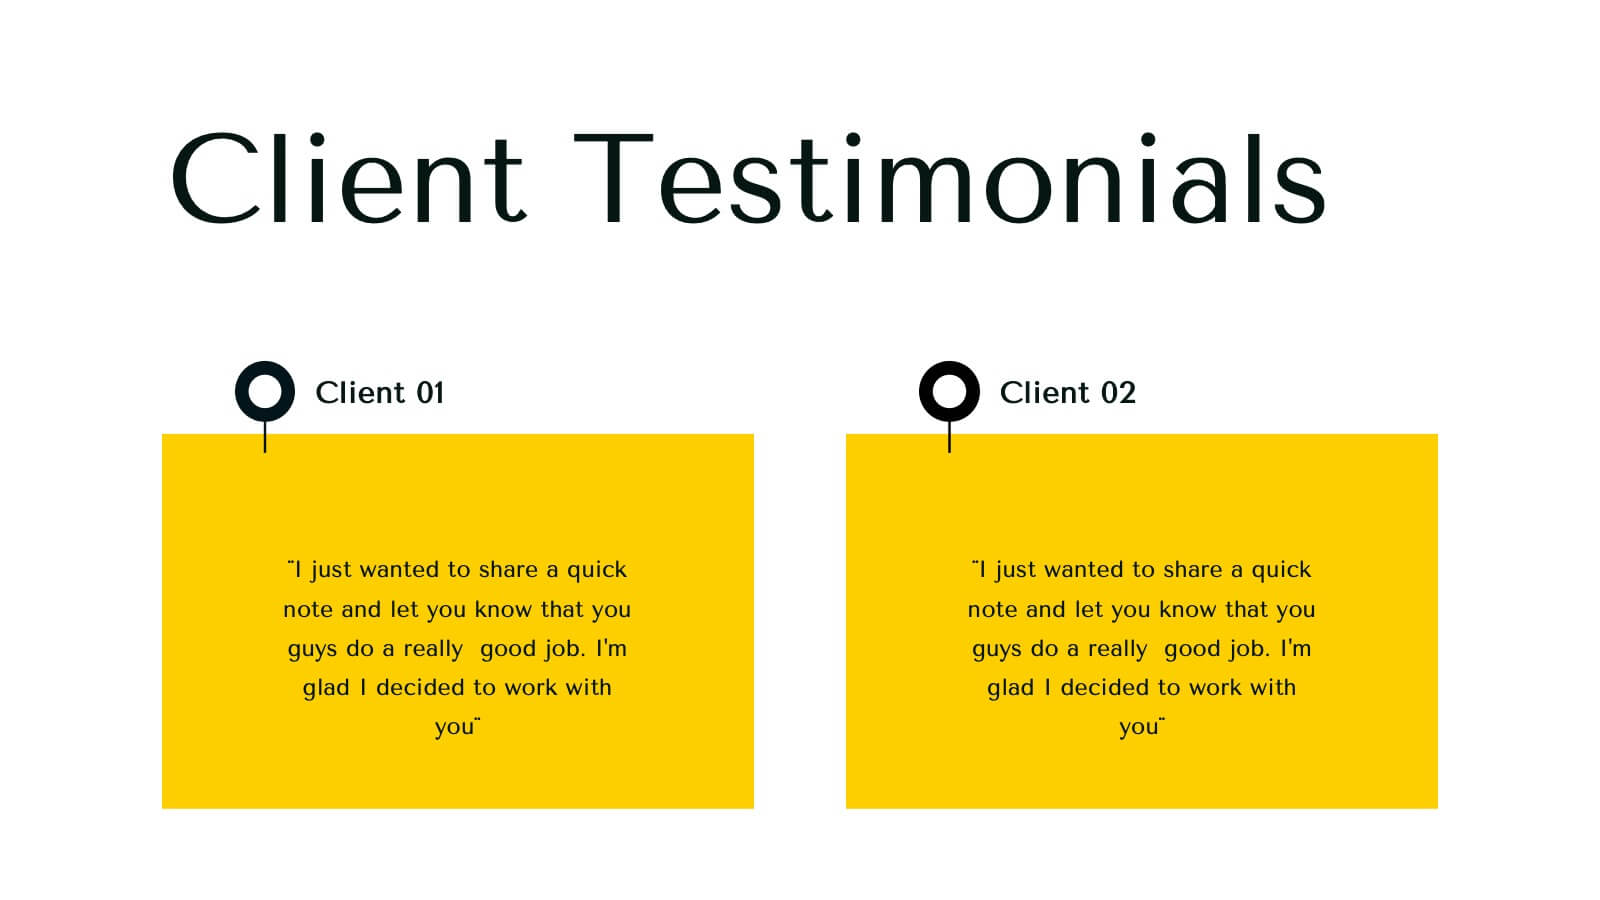
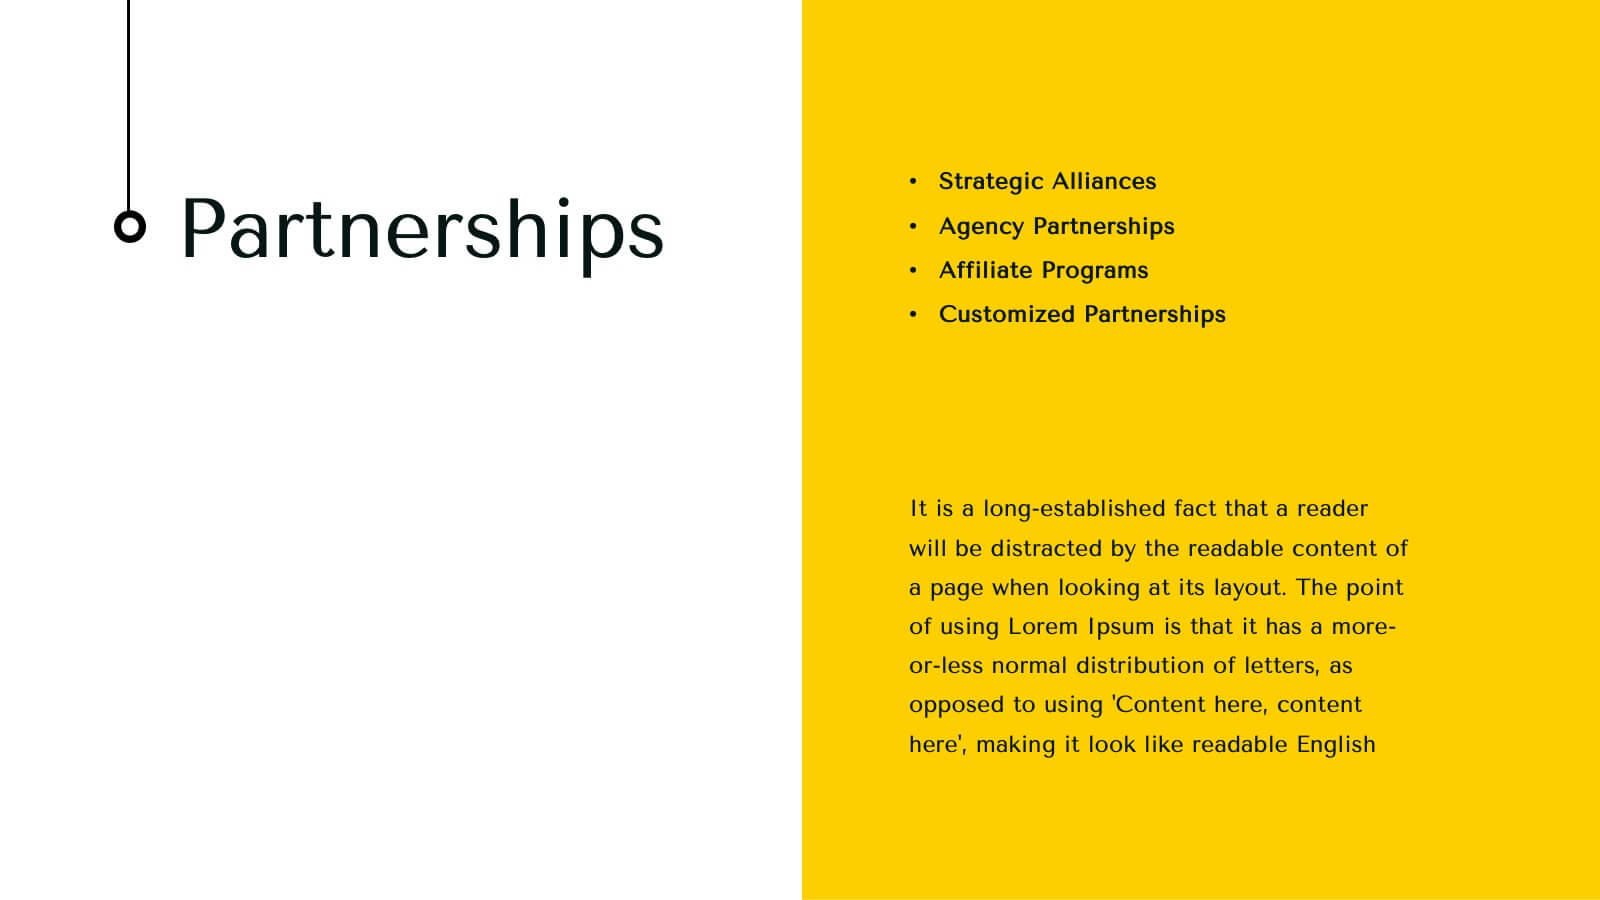
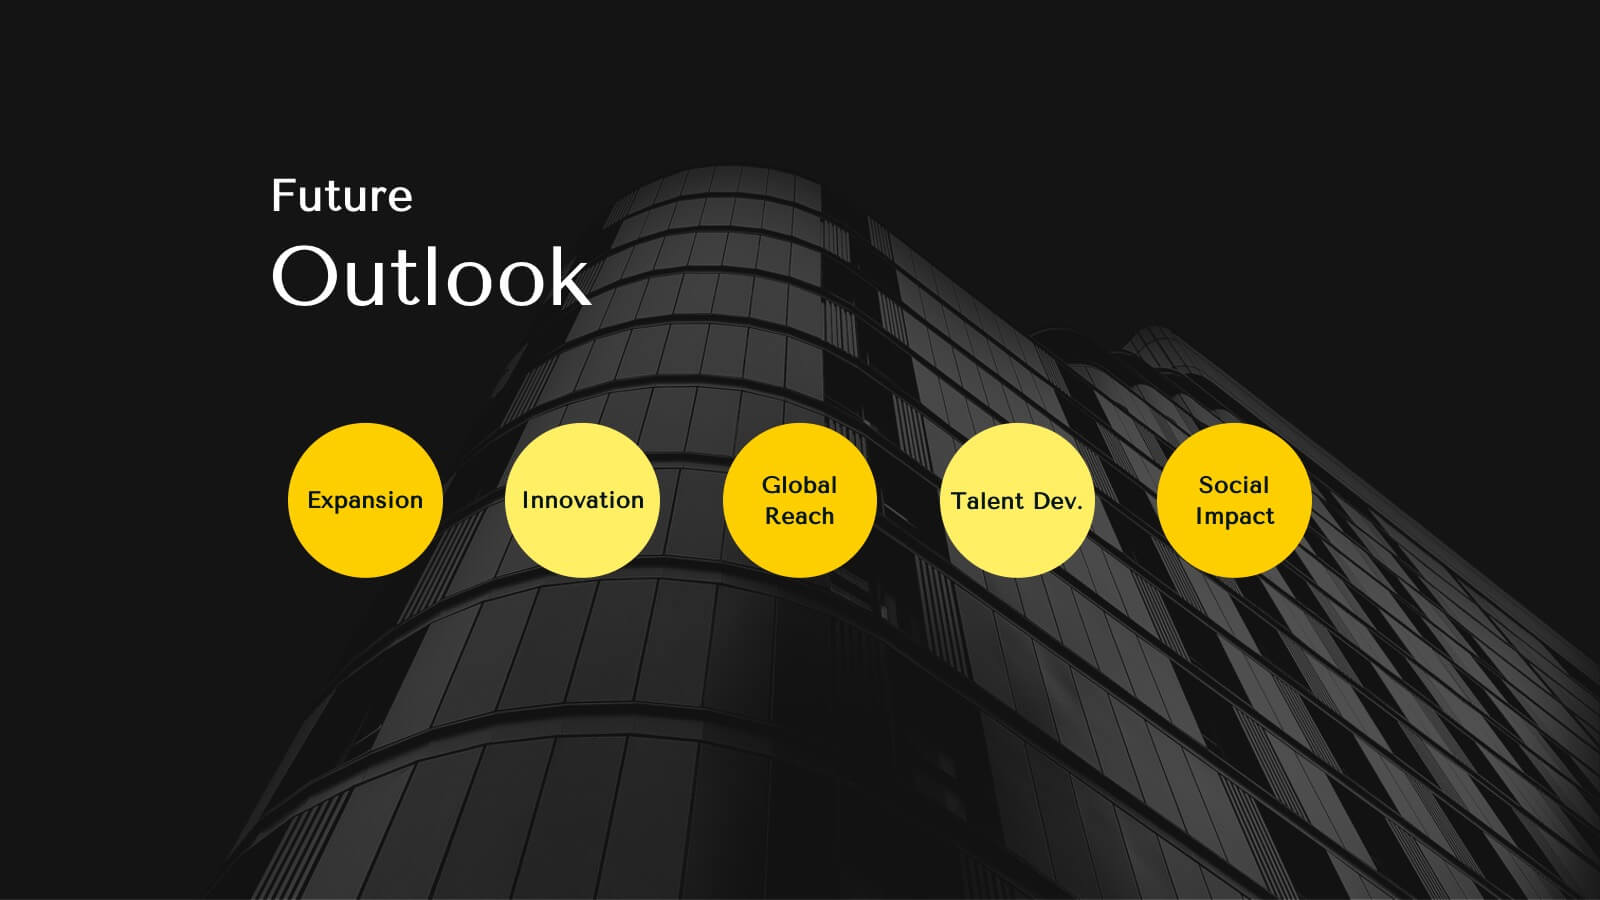
Infinity Agency Portfolio Presentation
Showcase your agency's excellence with this dynamic and modern presentation template. Ideal for presenting market analysis, client success stories, and strategic development plans, it features a bold design with a vibrant yellow and black theme. Highlight your unique approach and creative process to captivate your audience. Compatible with PowerPoint, Keynote, and Google Slides, it's perfect for any platform.


23 diapositivas
Twilora Business Plan Presentation
Present your business strategy with a comprehensive and visually engaging template designed to impress stakeholders and investors. This template covers key elements of a business plan, including company background, market opportunities, business objectives, and key milestones. Showcase your product offerings, target audience, and competitive advantages through clear, professional visuals and data-driven charts. Highlight your financial performance, investment opportunities, and operational plans with precision and clarity. Tailor the design to reflect your brand's identity and goals. Fully compatible with PowerPoint, Google Slides, and Keynote, this versatile template is perfect for startups, established businesses, and entrepreneurs aiming to present a strong and compelling business case.


5 diapositivas
Task Automation Process Flow Presentation
Streamline operations with this visual task automation flowchart. Perfect for illustrating automated sequences, decision nodes, and multi-branch logic. Clearly labeled elements guide viewers through each step. Ideal for tech teams, process designers, and workflow planning. Fully editable in PowerPoint, Keynote, and Google Slides to match your branding and automation strategy.


21 diapositivas
Nimbus Startup Growth Plan Presentation
Supercharge your startup's growth with this vibrant presentation template! Ideal for outlining your business plan, it includes slides for mission, market analysis, and financial overview. Capture investor attention with clear visuals and compelling content. Compatible with PowerPoint, Keynote, and Google Slides for a seamless presentation experience on any platform.


4 diapositivas
Butterfly Graph for Diverging Metrics Presentation
Easily compare opposing values with the Butterfly Graph for Diverging Metrics Presentation. Ideal for visualizing split opinions, pros vs. cons, or pre- and post-metrics across multiple categories. The clean, mirrored layout helps audiences grasp key differences at a glance. Compatible with PowerPoint, Google Slides, Canva, and Keynote.


5 diapositivas
Climate Change Response Strategy Deck Presentation
Communicate your climate action roadmap clearly with this Climate Change Response Strategy Deck Presentation. Featuring a directional arrow flow design, this layout helps visualize progressive steps in sustainability, adaptation, or policy initiatives. Ideal for ESG reporting, environmental briefings, or nonprofit strategy sessions. Works seamlessly with PowerPoint, Keynote, and Google Slides.


5 diapositivas
Visual Mind Connections Bubble Chart Presentation
Visualize interconnected concepts with clarity using the Visual Mind Connections Bubble Chart Presentation. This engaging layout centers around a core idea, surrounded by supporting points in a clean, circular flow. Ideal for mapping strategies, team roles, or processes. Fully editable in PowerPoint, Keynote, or Google Slides—perfect for business, education, or coaching.


10 diapositivas
Project Launch in 4 Structured Phases Presentation
Present your roadmap with clarity using this four-phase launch diagram. Designed for planning, strategy, or product rollout presentations, each step is illustrated in a 3D layered format with editable text sections. Fully customizable in PowerPoint, Keynote, and Google Slides—ideal for project managers and teams outlining sequential development or launches.


6 diapositivas
Overcoming Market Challenges Strategy Presentation
Tackle industry obstacles with clarity using this dynamic teamwork-themed visual. Featuring illustrated characters passing puzzle pieces along a circular process, this design is perfect for illustrating phased strategies, collaborative efforts, or key milestones. Great for strategic planning or team alignment presentations. Fully editable in PowerPoint, Keynote, and Google Slides.


5 diapositivas
Strategic Business Pillars Model Presentation
Visualize your core strategies with this vertical pillar infographic slide. Each level represents a key focus area or foundational element essential for business success. Ideal for leadership talks, team alignment, or growth strategies. Fully editable in PowerPoint, Keynote, and Google Slides.


4 diapositivas
Business Report Conclusion Slide Presentation
Summarize findings with impact using the Business Report Conclusion Slide Presentation. This template provides a structured, four-step layout that helps you clearly present key takeaways, data highlights, or action points. Clean design with icon integration makes it easy to follow. Fully editable and compatible with PowerPoint, Keynote, and Google Slides.


6 diapositivas
Sales Strategy 30-60-90 Day Plan Presentation
Drive sales success with this structured 30-60-90 day strategy template! Designed to help sales teams and professionals set clear objectives, track progress, and optimize performance, this layout ensures a smooth transition from planning to execution. Fully customizable and compatible with PowerPoint, Keynote, and Google Slides for seamless presentations.


5 diapositivas
Brainstorming Session Diagram Presentation
Spark creativity and structure your next idea session with the Brainstorming Session Diagram Presentation. Featuring a central brain icon and four labeled input areas, this layout makes it easy to visualize and organize group contributions. Fully editable in PowerPoint, Canva, and Google Slides for seamless collaboration and customization.