


Características


¿Tienes alguna pregunta?
Recomendar


7 diapositivas
PESTEL Framework for External Analysis Presentation
Evaluate external factors with ease using the PESTEL Framework for External Analysis Presentation. This structured layout helps you assess Political, Economic, Social, Technological, Environmental, and Legal influences on your business. Perfect for market research, risk assessment, and strategic planning. Fully customizable in PowerPoint, Canva, and Google Slides.


5 diapositivas
Digital Marketing Infographics
Digital Marketing refers to the use of digital channels, platforms, and strategies to promote products, services, and brands to reach and engage with target audiences. These infographic templates are perfect for explaining concepts, illustrating processes, showcasing data, or comparing information. They are commonly used in digital marketing to provide information to clients, educate consumers, and promote products and services. These Infographics can be shared on social media, websites, and blogs to increase engagement and drive traffic to a brand's online presence. Compatible with Powerpoint, Keynote, and Google Slides.


6 diapositivas
7S Framework for Organizational Alignment Presentation
Present a cohesive organizational strategy using the 7S Framework slide. With hexagonal visuals highlighting key elements—Strategy, Structure, Systems, Shared Values, Style, Staff, and Skills—this template simplifies complex alignment concepts. Ideal for leadership, consulting, or HR presentations. Fully editable for PowerPoint, Google Slides, and Keynote to match your brand.


21 diapositivas
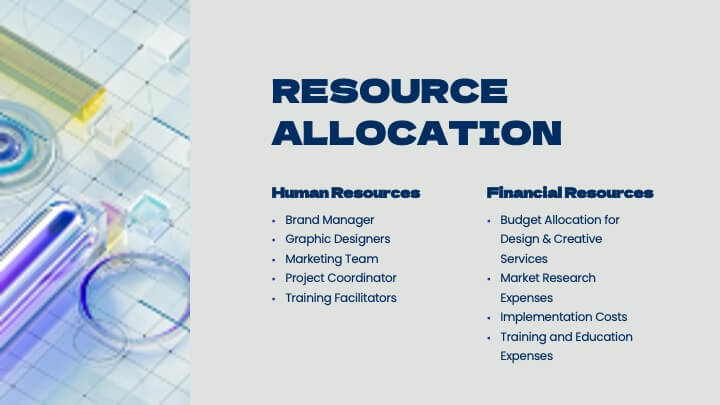
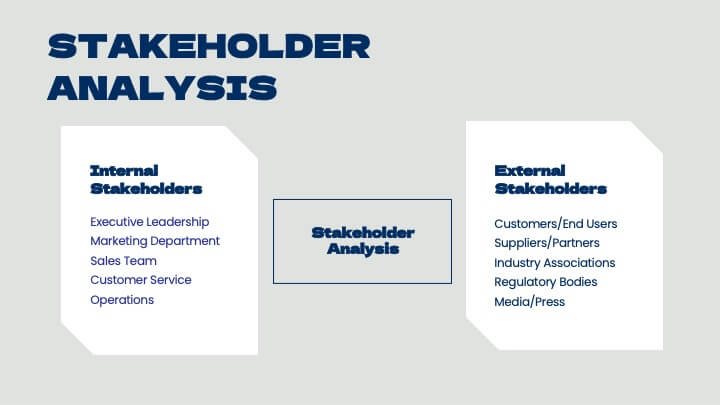
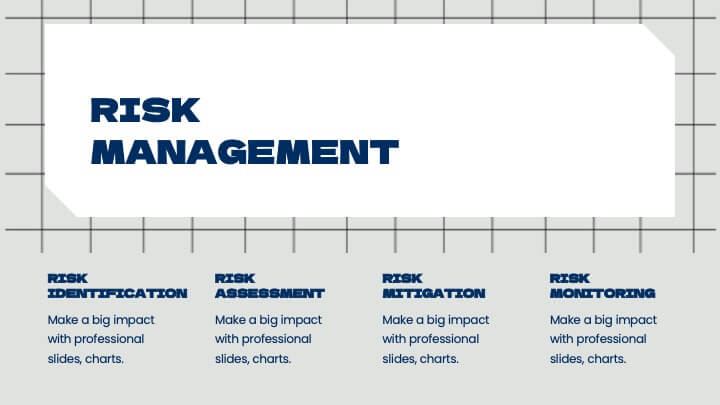
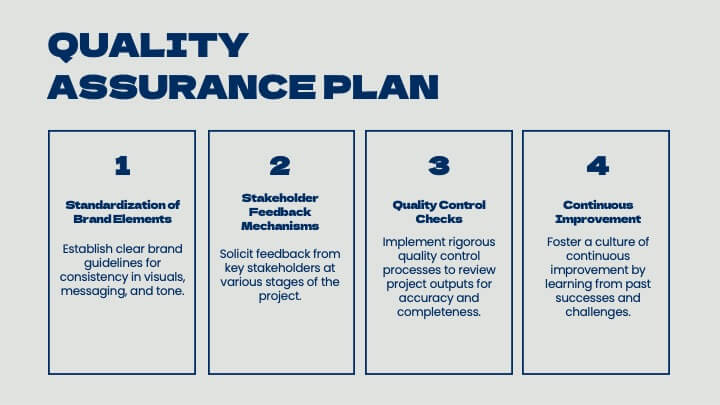
Flare Project Management Plan Presentation
Unleash the full potential of your projects with a dynamic plan template that makes every detail shine! This vibrant and clear design is built to guide your team and stakeholders through every phase of your project with confidence and clarity. Starting with a compelling introduction and project overview, this template captures attention and sets the stage for success. Dive deep into problem statements, objectives, and the scope of work, all presented in a visually appealing and easy-to-digest format. With sections dedicated to timelines, milestones, budget breakdowns, and resource allocation, this template ensures every aspect of your project is meticulously planned and communicated. The inclusion of stakeholder analysis, risk management, and quality assurance plans showcases your thorough approach to project management. Perfectly compatible with PowerPoint, Keynote, and Google Slides, this template is your go-to tool for creating project plans that are both inspiring and effective. Get ready to impress and lead your projects to success!


4 diapositivas
Business Operations Office Theme Presentation
Make your workflow feel effortless with this sleek, illustrated office layout designed to simplify complex business operations. Ideal for presenting processes, responsibilities, or resource planning, the clean visuals and structured format help communicate your message clearly. Fully editable and compatible with PowerPoint, Keynote, and Google Slides for seamless customization.


7 diapositivas
30 60 90 Business Plan Infographic
A 30-60-90 day plan is a strategic outline of goals and objectives that a person plans to achieve within specific timeframes—30, 60, and 90 days. Dive into the heart of strategic planning with our 30 60 90 business plan infographic. This bold and dynamic template is a visual roadmap, guiding you through the critical phases of a business plan and setting a solid course for success. Compatible with Powerpoint, Keynote, and Google Slides. This infographic is a powerful tool, illustrating the journey from inception to triumph in 90 days. Explore each crucial phase in crafting an effective business plan.
6 diapositivas
Performance Tracking Using OKRs
Visualize your team’s progress across people, process, and products with this OKR-focused performance tracking slide. Designed for managers and leaders aiming to align execution with key results. Compatible with PowerPoint, Keynote, and Google Slides for full customization.


12 diapositivas
Alphabet Learning and Education Presentation
Introduce concepts creatively with this bold "A"-shaped infographic designed for education topics. Each segment of the letter highlights a numbered point, making it ideal for step-by-step instructions, learning stages, or literacy development. Use it to simplify complex ideas visually. Fully editable in PowerPoint, Keynote, and Google Slides.


7 diapositivas
PESTEL Analysis Infographic Presentation Template
A PESTEL Analysis Infographic is a great tool to highlight the risks and opportunities of a market. Based on the needs of your customers, this Infographic can help you communicate key information about competition, regulatory environment and economic outlook. This template can also be used for stocks of any company from any industry. This is a comprehensive pestel analysis infographic that will show you the factors that are driving and restraining the growth of your industry. This template can help companies to identify their weaknesses and drive their strengths with the pestel analysis.


26 diapositivas
Spa and Wellness Company Profile Presentation
Embark on a journey to wellness and relaxation with our serene well spa & wellness company profile presentation. This template will Immerse your audience in a world of calmness, rejuvenation, and health. Present your company's mission and vision for promoting wellness. Compatible with Powerpoint, Keynote, and Google Slides. The soothing shades of pastels and soft hues create a peaceful atmosphere. This template integrates elements of nature like leaves, flowers, or waves to evoke serenity. This presentation is designed to captivate your audience and immerse them in the world of relaxation.


21 diapositivas
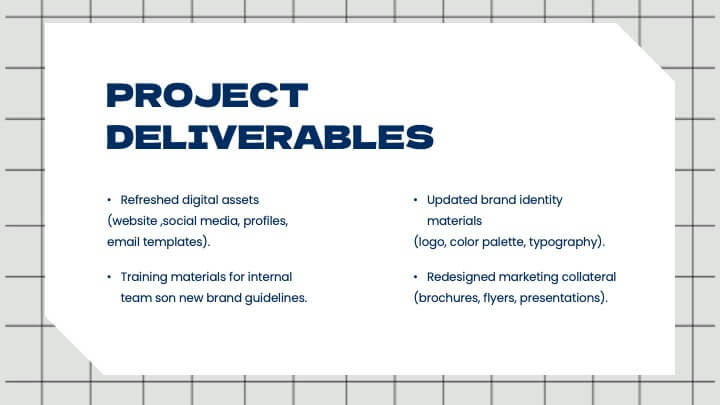
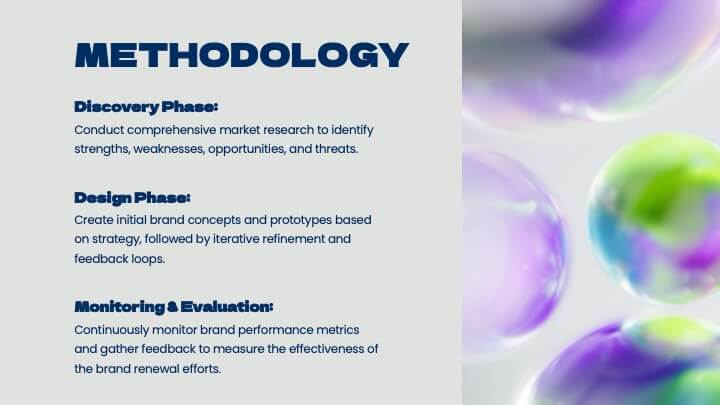
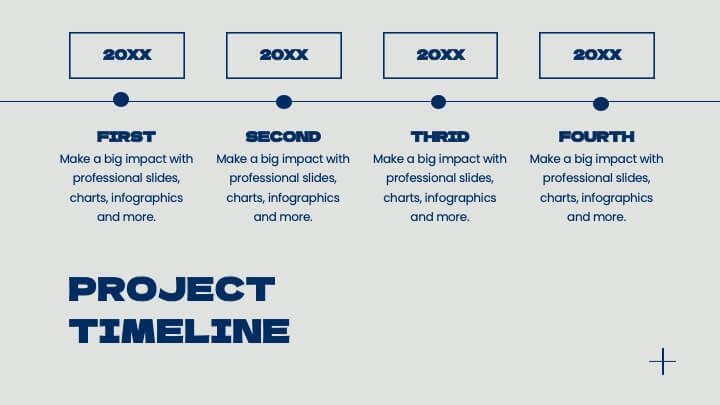
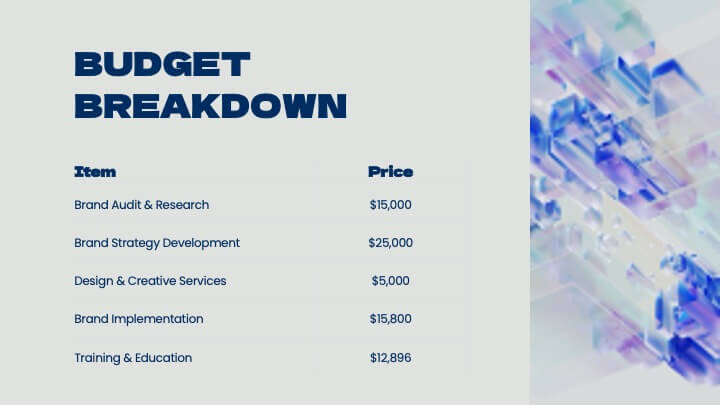
Frost Design Proposal Presentation
Present your design proposal with sophistication and clarity using this elegant template! Perfect for outlining your project summary, objectives, and proposed solutions, this template covers everything from scope of work and budget breakdowns to deliverables and team expertise. Fully compatible with PowerPoint, Keynote, and Google Slides, it's designed for seamless, professional presentations.


6 diapositivas
Data Table Format Presentation
Bring clarity to your data with a clean, modern layout that helps your audience compare details at a glance. This presentation is perfect for pricing, feature breakdowns, or structured business insights, keeping information organized and easy to read. Fully compatible with PowerPoint, Keynote, and Google Slides.


4 diapositivas
Cost Breakdown Table Presentation
Make your numbers speak with style using a clean, structured layout that simplifies pricing and cost analysis. This presentation is perfect for comparing plans, budgets, or expenses in a clear and visually engaging way. Fully editable and compatible with PowerPoint, Keynote, and Google Slides.


7 diapositivas
Pricing Comparison Table Infographic
Dive into the strategic world of pricing with our intricately designed pricing table infographic. Imbued with the trustworthiness of blue, the crisp clarity of white, the optimism of yellow, and the urgency of red, our template visualizes pricing strategies in an engaging manner. Furnished with detailed infographics, distinct icons, and adaptable image placeholders, it translates complex pricing data into an easy-to-grasp format. Seamlessly crafted for Powerpoint, Keynote, or Google Slides. A vital asset for business analysts, marketers, sales professionals, or any brand strategizing its pricing model. Engage your audience; let every slide be a value proposition.


6 diapositivas
Responsibility Assignment Matrix Level Infographic
A Responsibility Assignment Matrix (RAM), is a useful tool in project management to define and clarify roles and responsibilities for various tasks and activities. This infographic template is a tool used in project management and organizational structure to define and communicate the roles and responsibilities of team members in tasks. This template will ensure that everyone involved in the project or process understands their roles and tasks, reducing confusion and improving accountability. This infographic will summarize the key points of your Responsibility Assignment Matrix. Compatible with Powerpoint, Keynote, and Google Slides.


21 diapositivas
Minoan Project Timeline Presentation
Step back in time with this beautifully crafted Minoan-inspired presentation, perfect for outlining your project timeline! With an elegant design and clear structure, this template helps you showcase key milestones, deadlines, and deliverables in a visually stunning way. Keep your project on track. Compatible with PowerPoint, Keynote, and Google Slides.


7 diapositivas
Mind Map Process Infographic
A Mind Map Process Infographic is a visual representation that illustrates a process or a series of steps using the structure and principles of a mind map. This template diagram is a dynamic visual guide to help individuals and teams harness the true potential of mind mapping. This is used to visually organize information in a hierarchical and interconnected manner, often starting with a central concept or theme and branching out into related ideas or subtopics. Mind maps are the ultimate tool for brainstorming, planning, and innovating, and this template is your gateway to unlocking their full potential.