


Características


¿Tienes alguna pregunta?
Recomendar


20 diapositivas
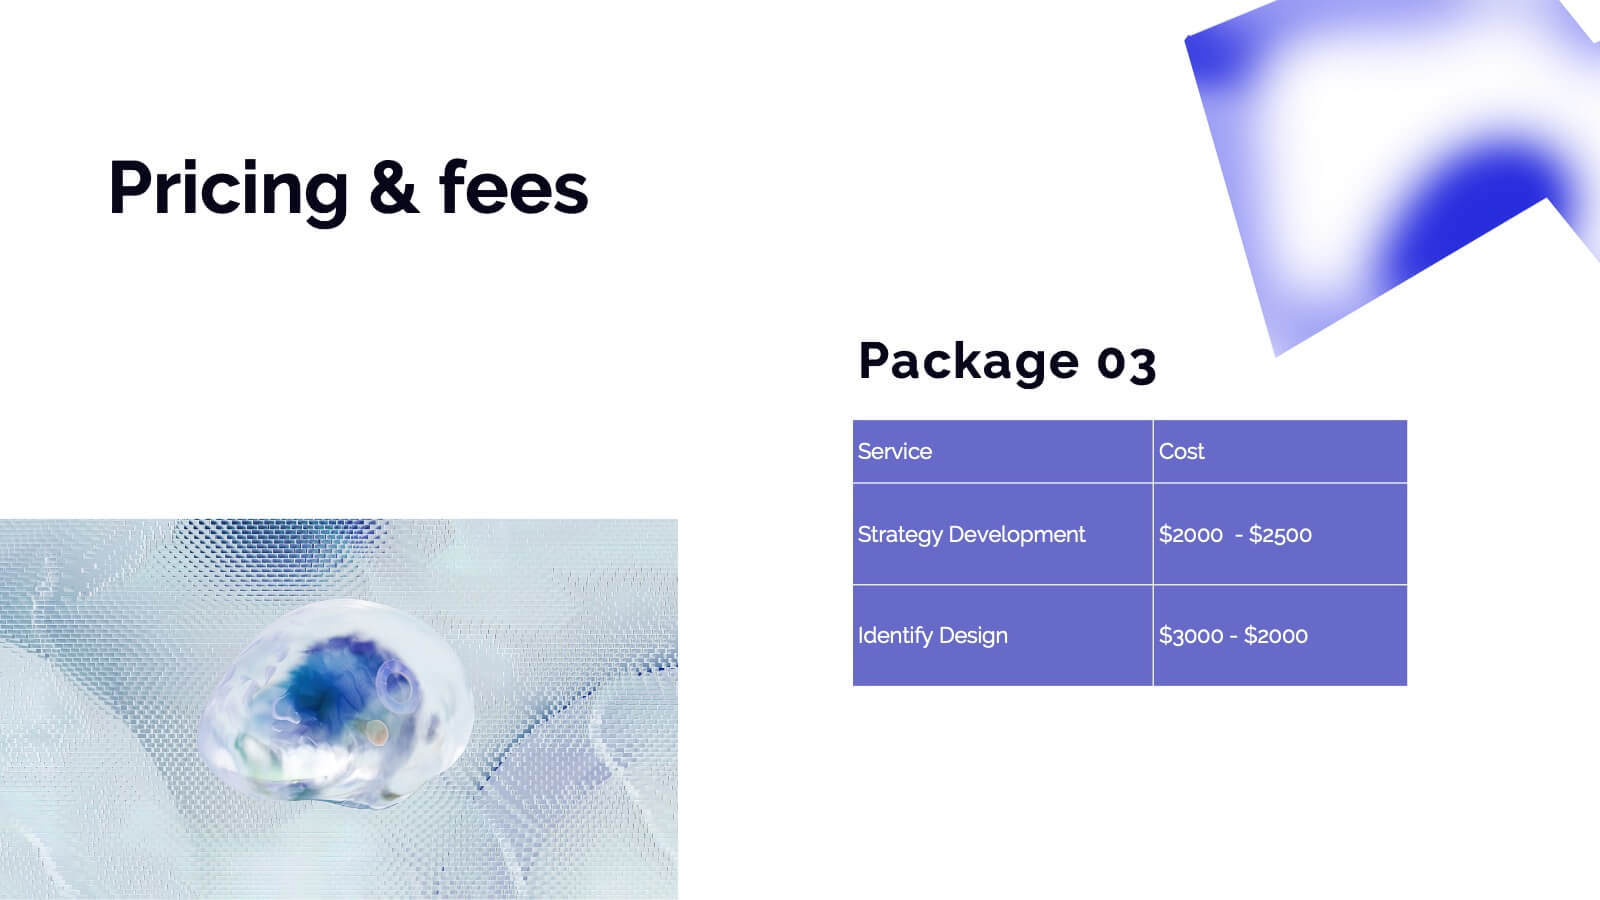
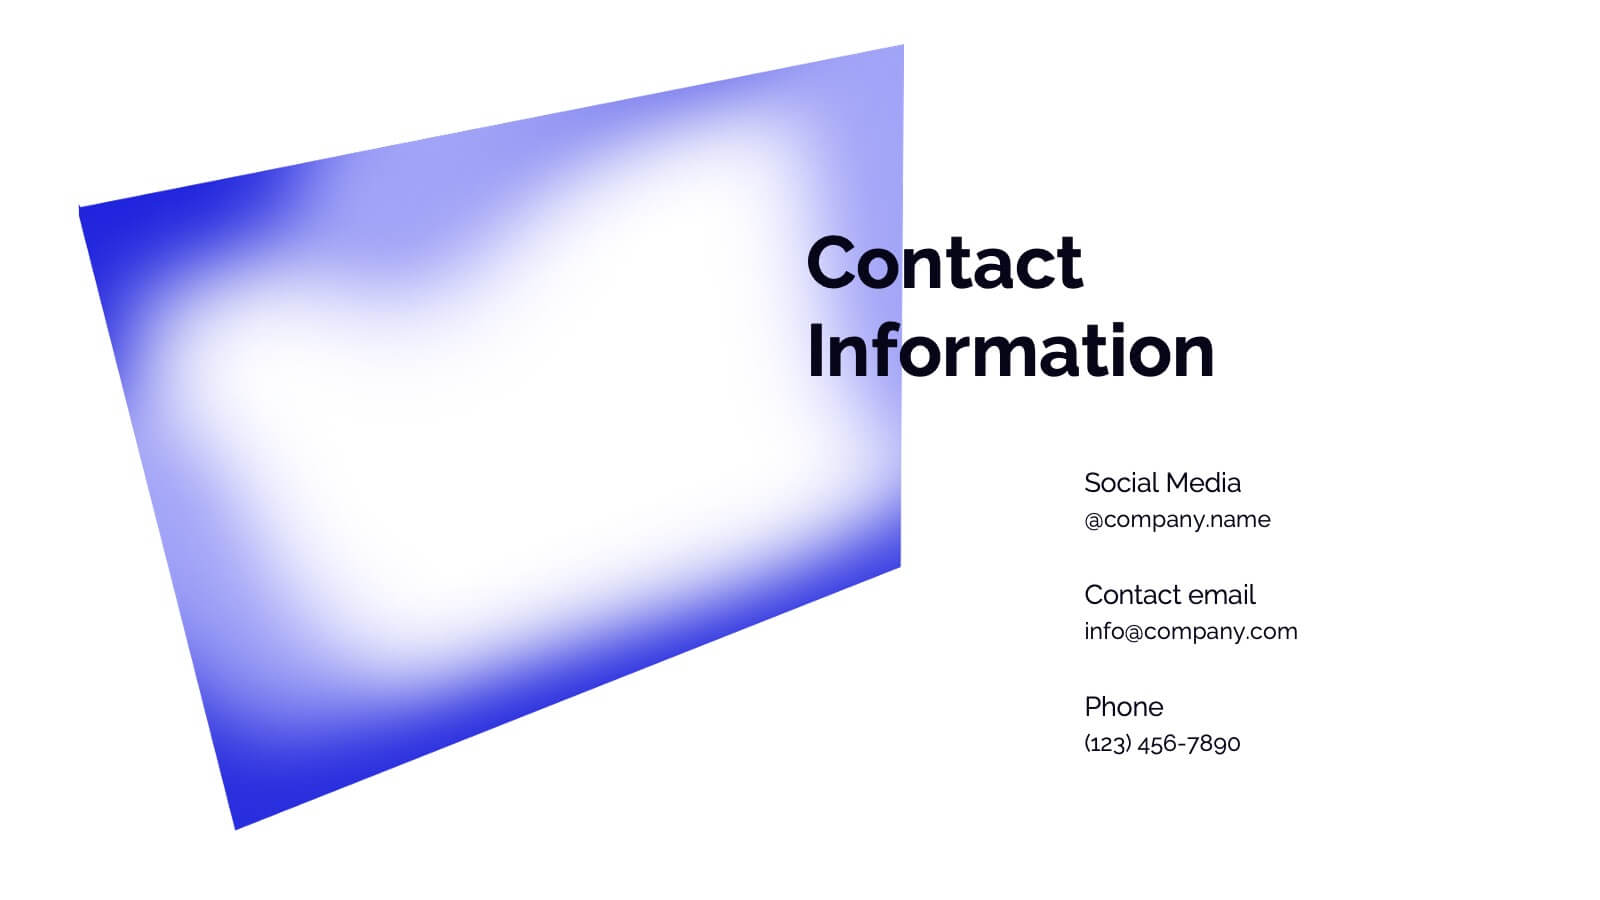
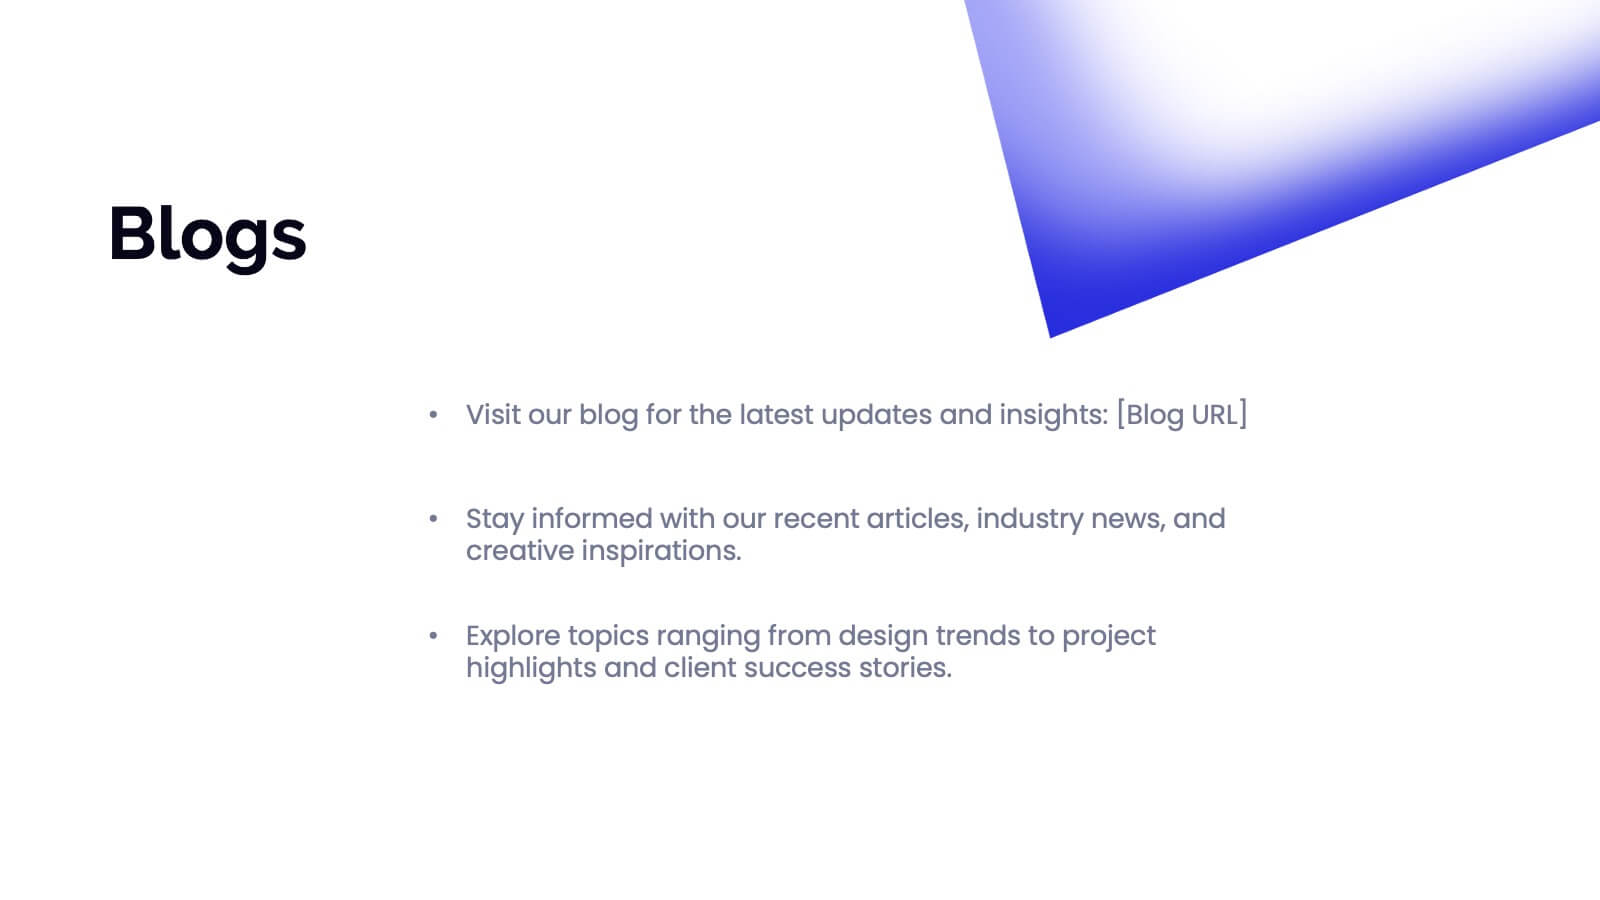
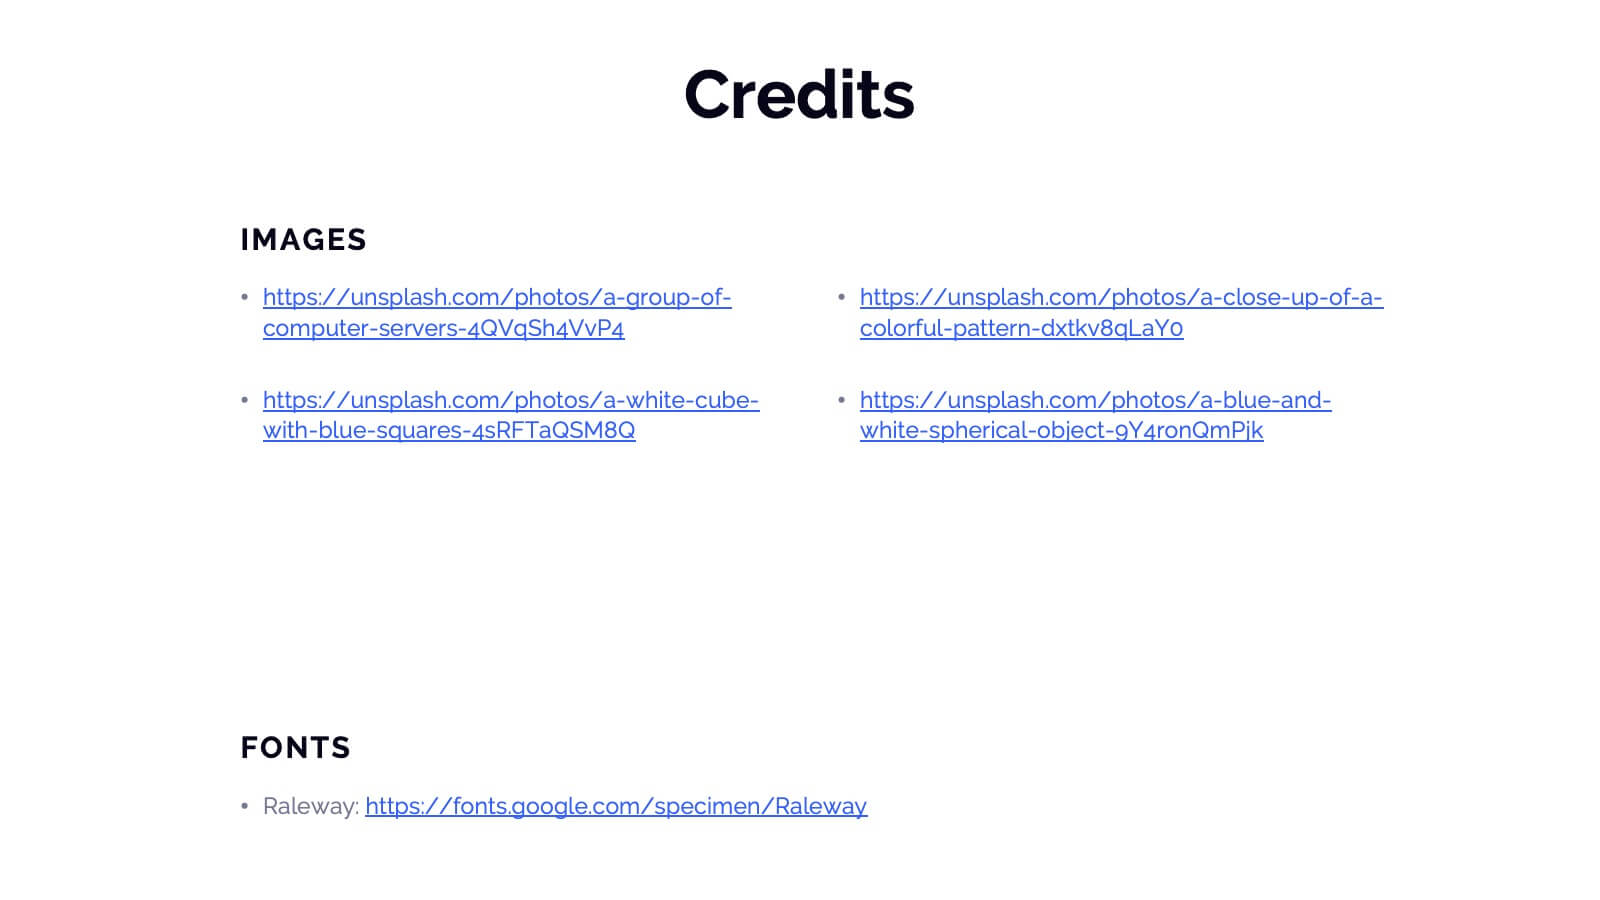
Cascade Detailed Project Execution Plan Presentation
Embark on your next big project with confidence using the Cascade Project Plan template! This visually stunning and meticulously designed template is perfect for laying out the roadmap for any project, whether it's launching a new product or managing a complex initiative. The template features sections for project overview, scope of work, budget breakdown, and risk management, ensuring every aspect of your project is thoroughly covered. Its clean and modern design allows you to present your ideas with clarity, while the customizable slides offer the flexibility to tailor the presentation to your specific needs. With dedicated slides for stakeholder analysis, resource allocation, and timeline milestones, this template helps you keep all parties informed and aligned. Compatible with PowerPoint, Keynote, and Google Slides, the Cascade Project Plan template is your ultimate tool for professional and effective project management presentations. Get ready to impress your team and stakeholders with a well-organized and impactful presentation!


23 diapositivas
Ethelin Digital Strategy Presentation
The digital strategy presentation template is designed to showcase your company's goals, market analysis, and strategic initiatives. Featuring slides for SWOT analysis, performance metrics, and action plans, it’s perfect for business planning and stakeholder engagement. Fully customizable and compatible with PowerPoint, Keynote, and Google Slides.


22 diapositivas
Athena Creative Design Report Presentation
Showcase your creative projects with this vibrant design report template! Highlight objectives, concept development, prototypes, and design iterations with sleek visuals. Perfect for designers and creative teams. Compatible with PowerPoint, Keynote, and Google Slides.


7 diapositivas
Structure Infographic Presentation Template
A structure infographic is a visual aid that is designed to help present information about the structural components of a particular topic. This template can be used to create presentations on a variety of subjects, such as education, business, buildings, machines, or organisms, and can help to break down complex information. Use this PowerPoint template to structure your most important ideas and impress your audience with more than just a bullet point list. Take a look at our infographic presentation templates if you want to add a bit of personality to your next presentation design!


23 diapositivas
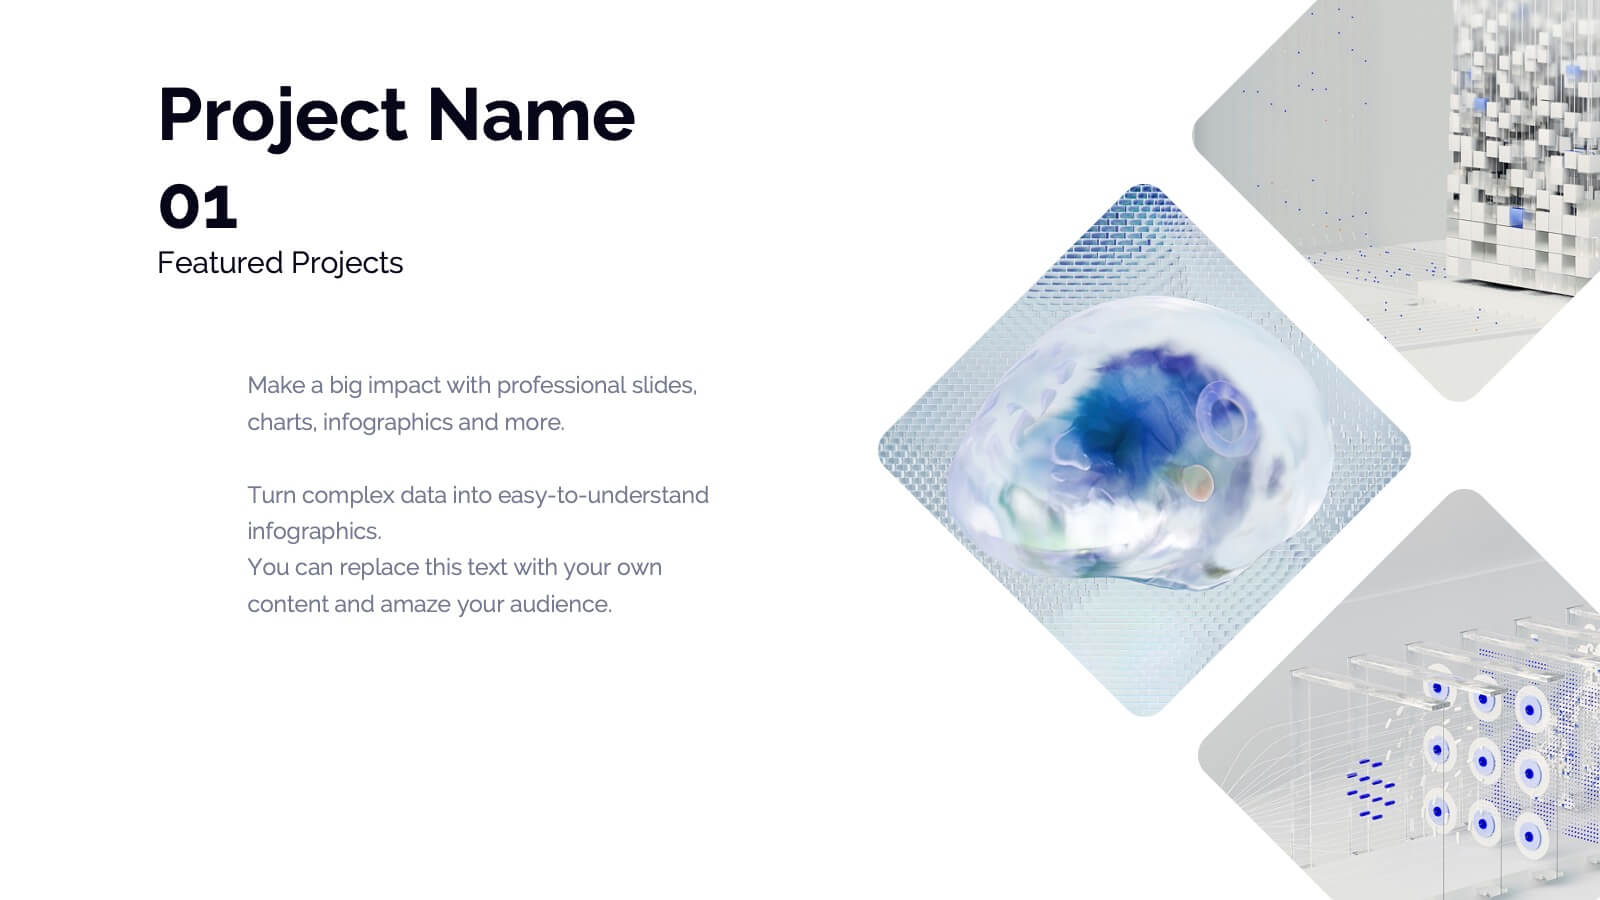
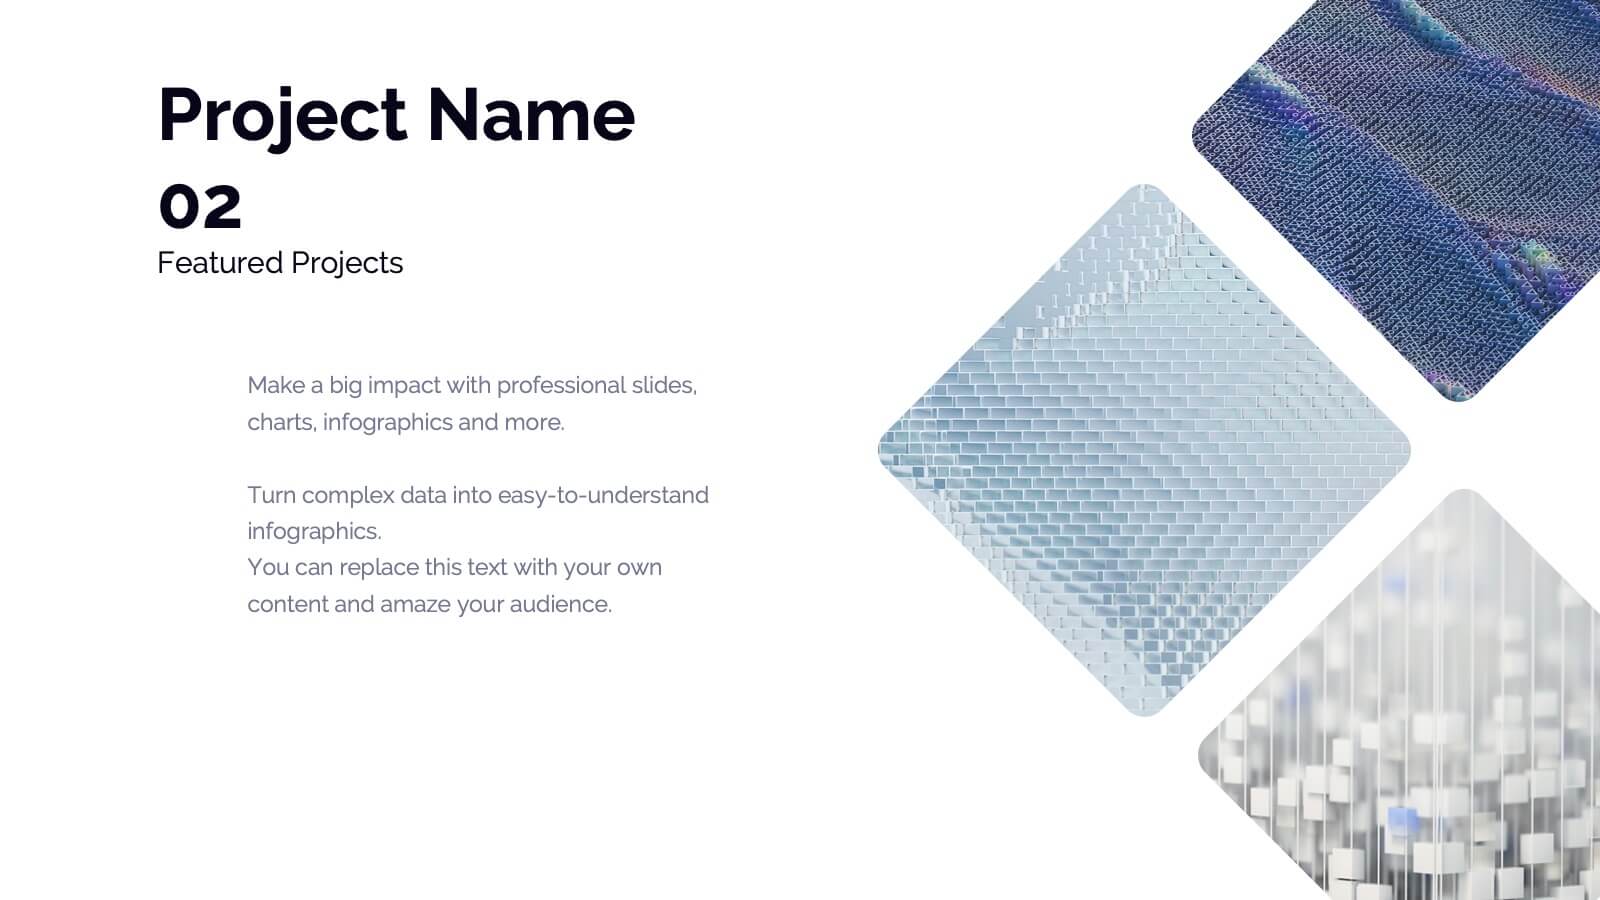
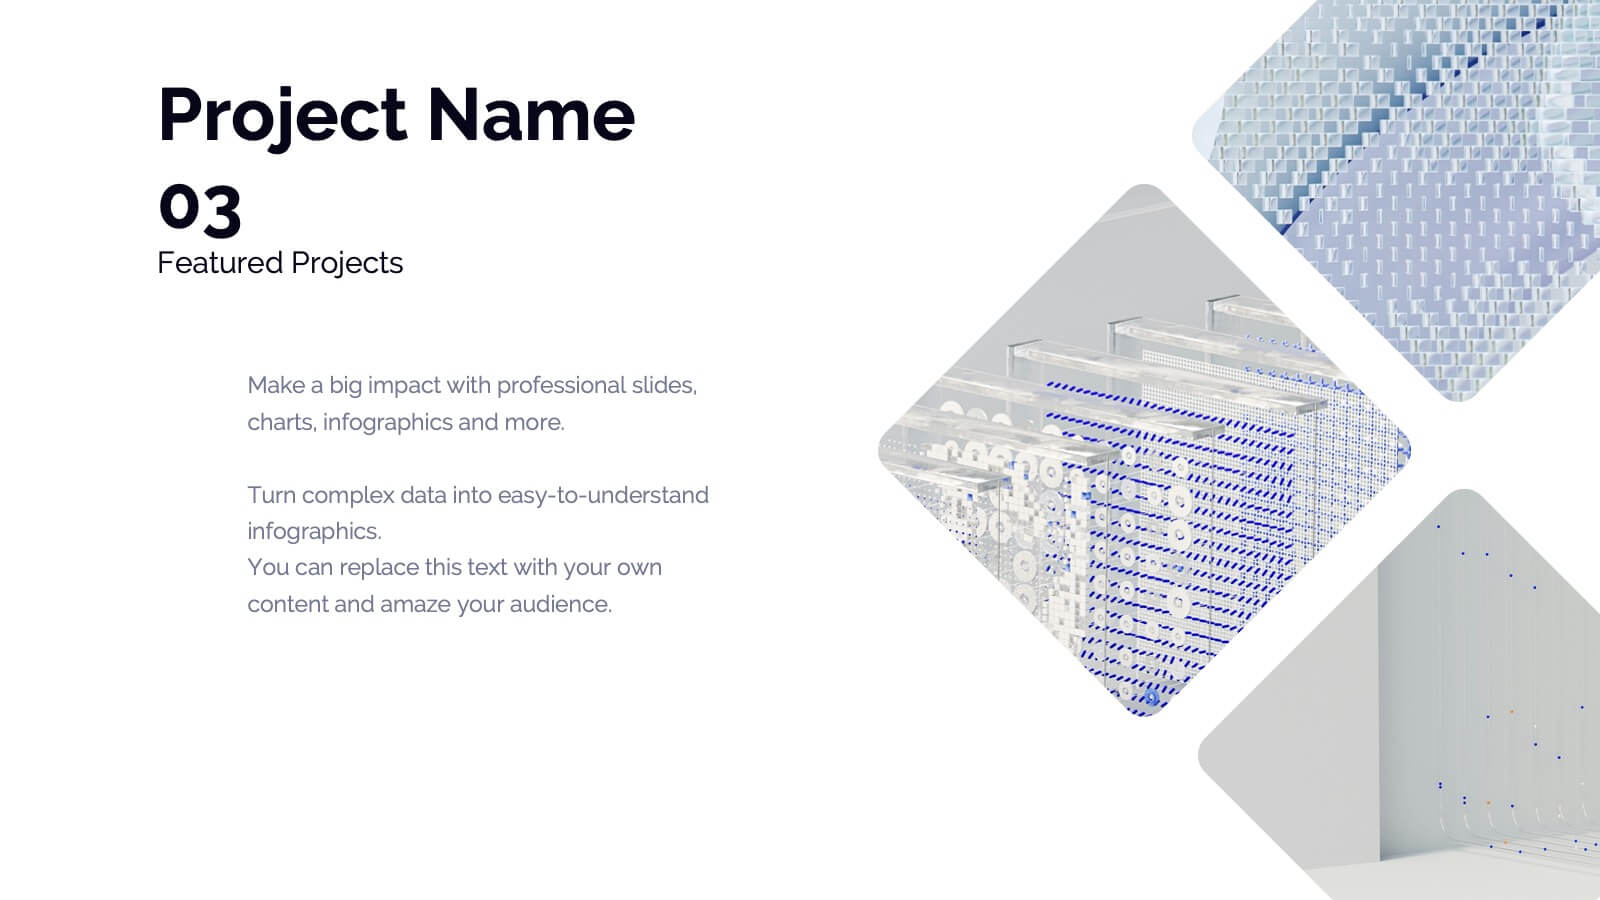
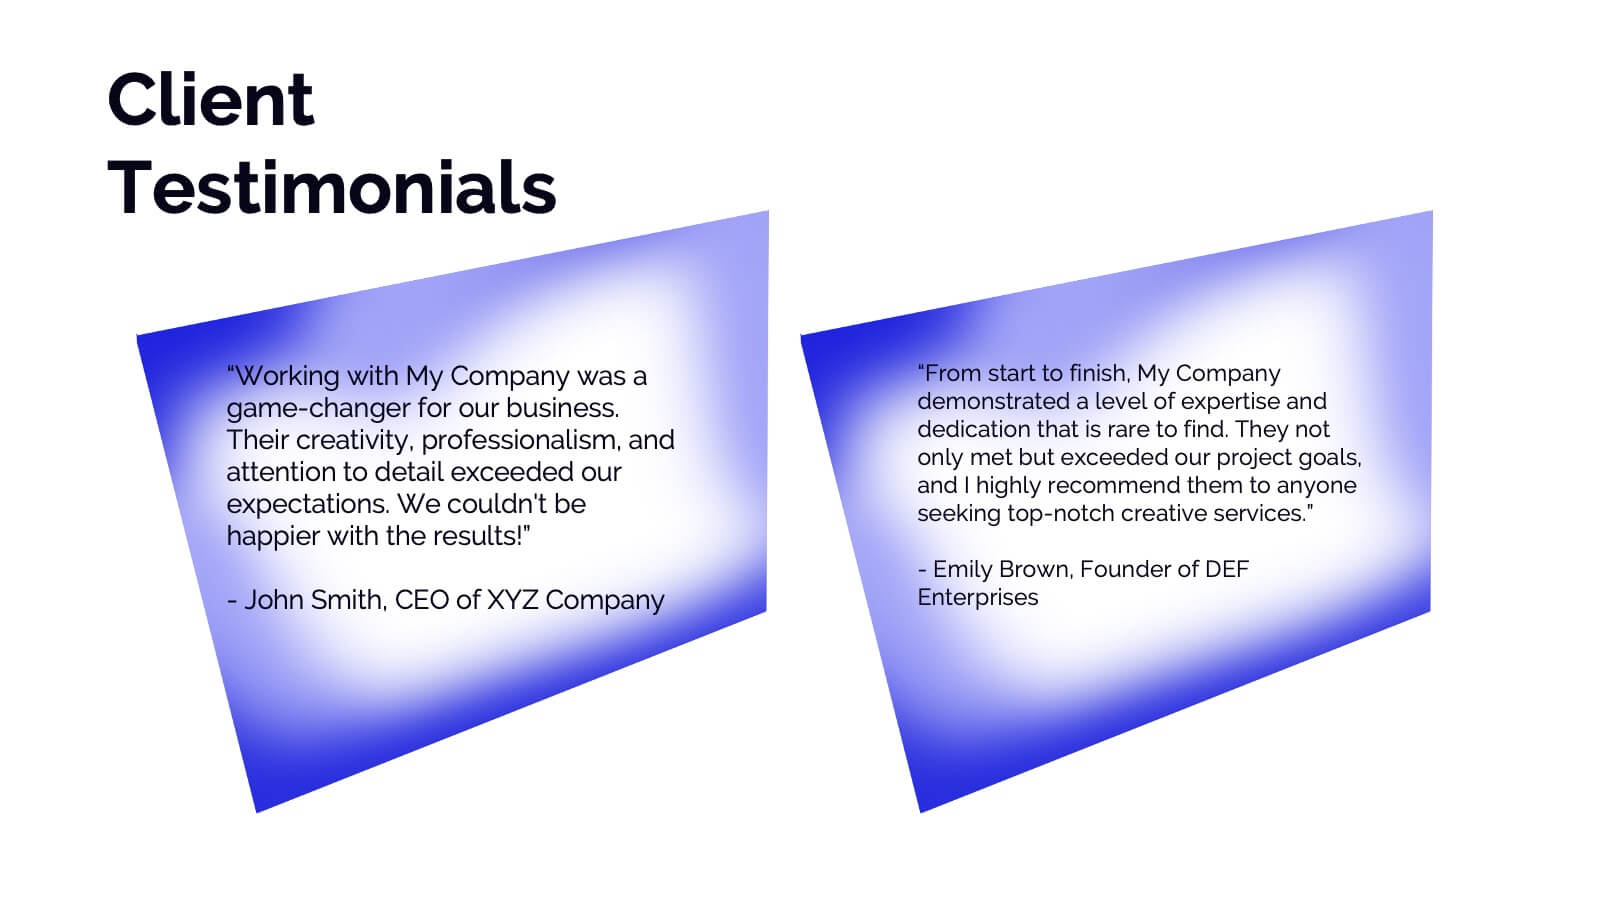
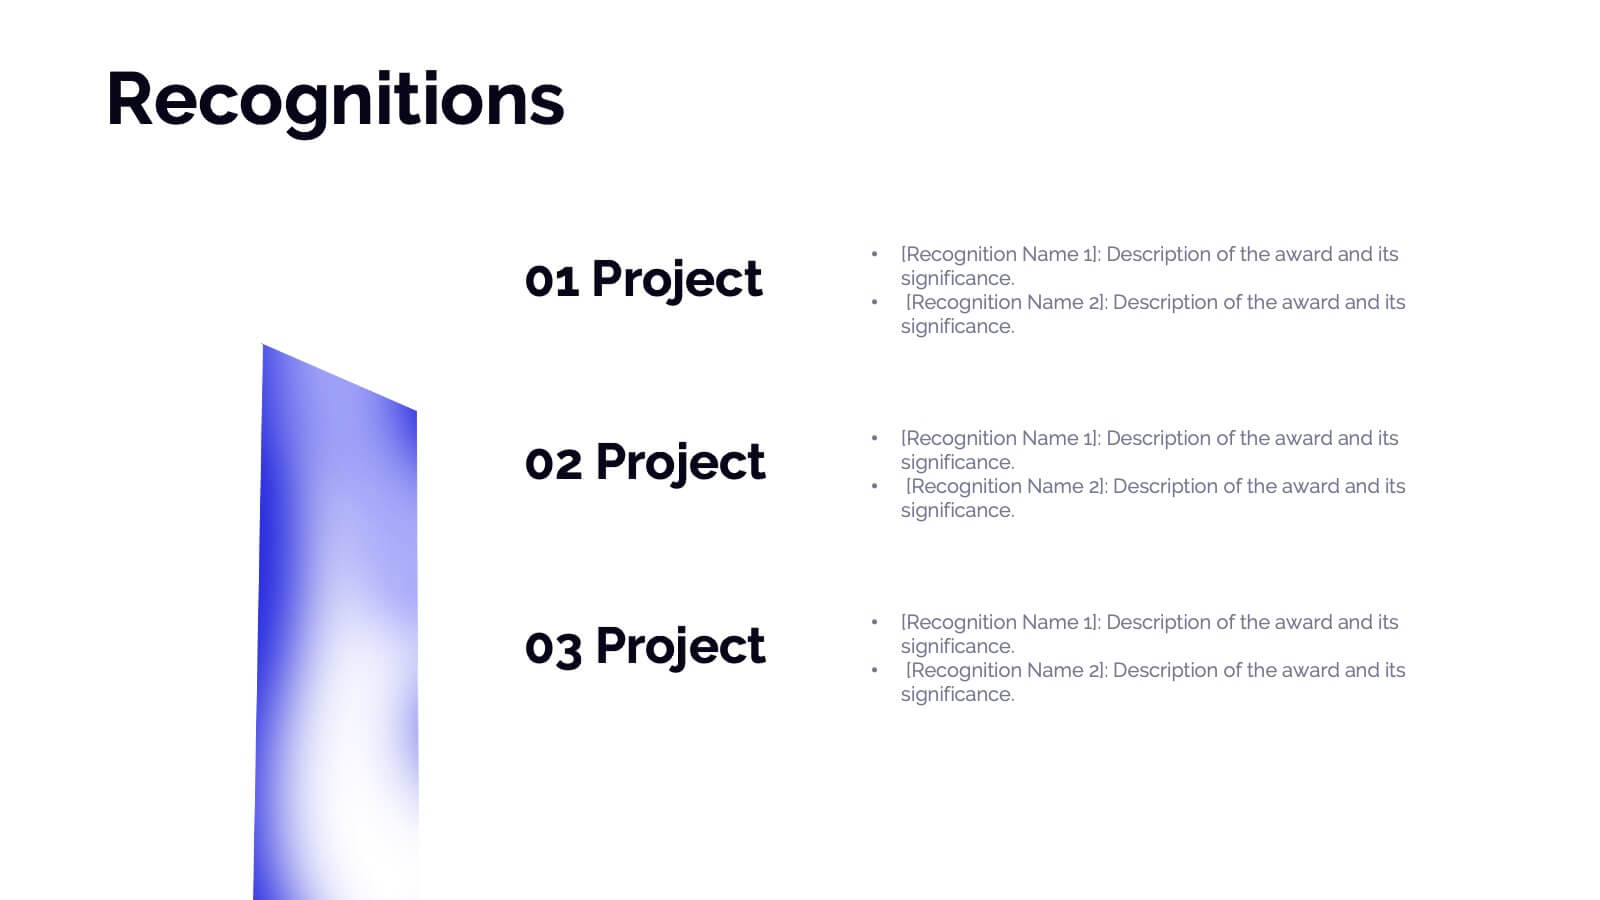
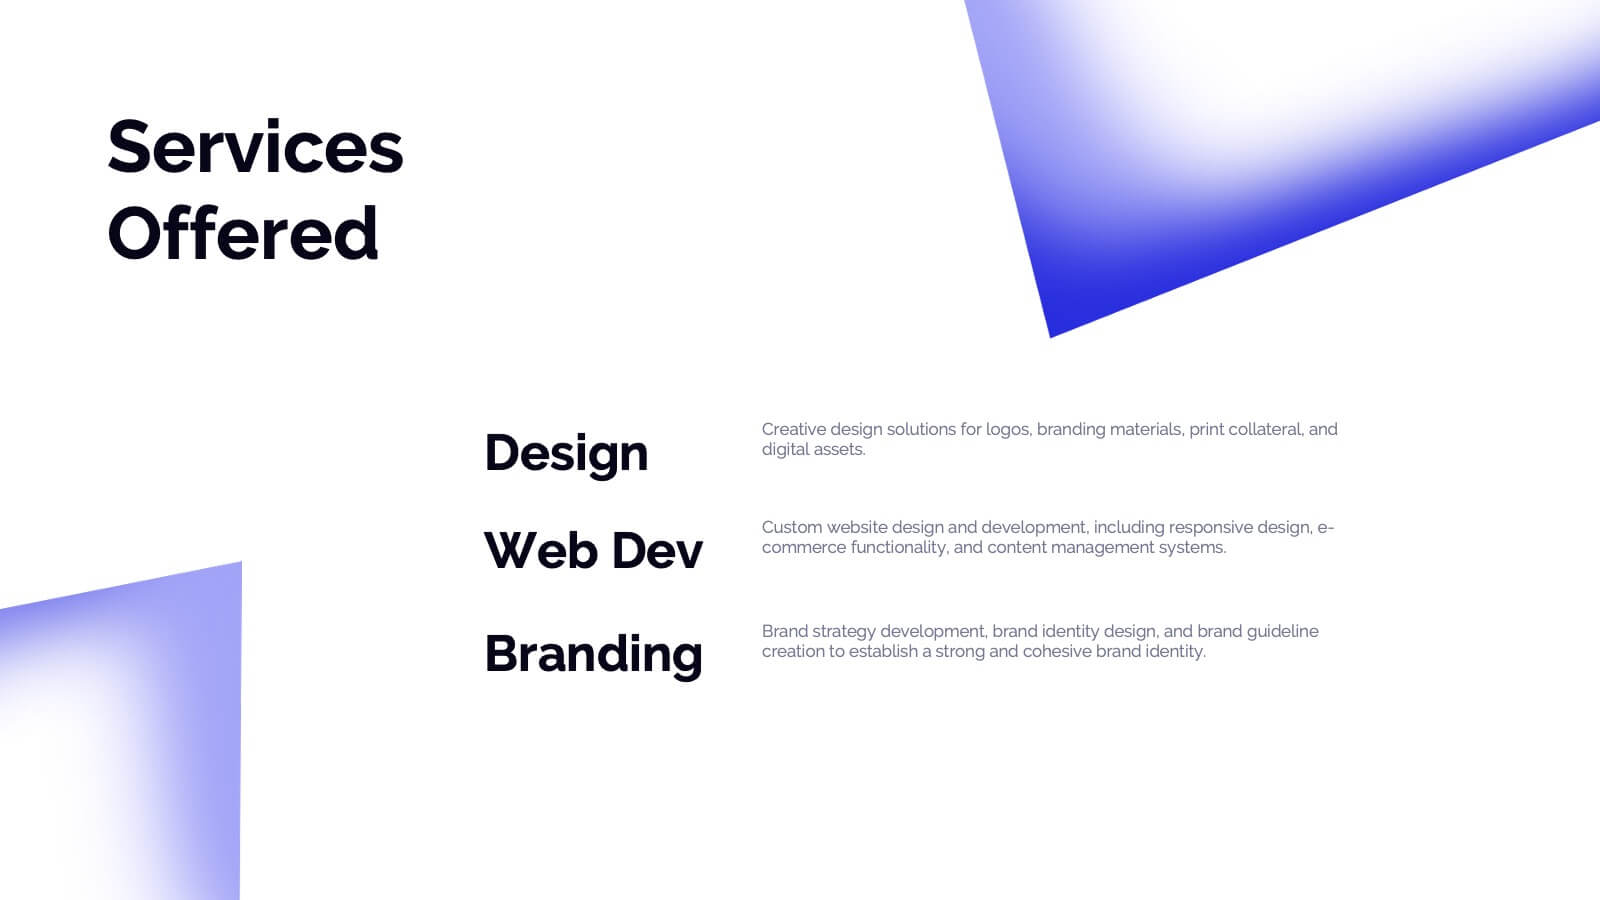
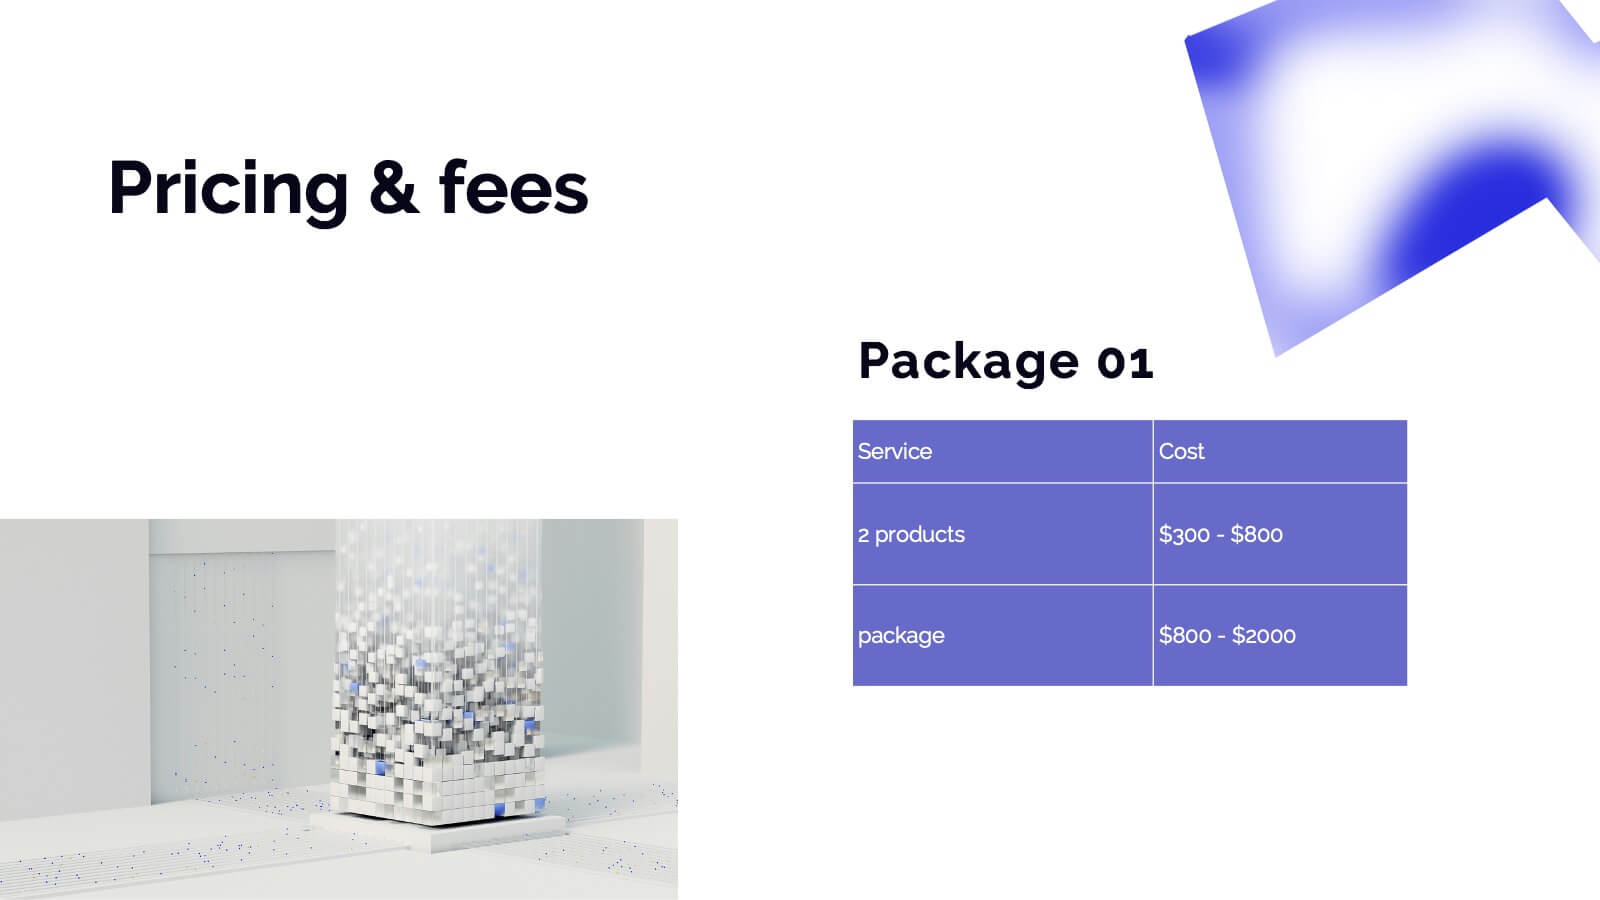
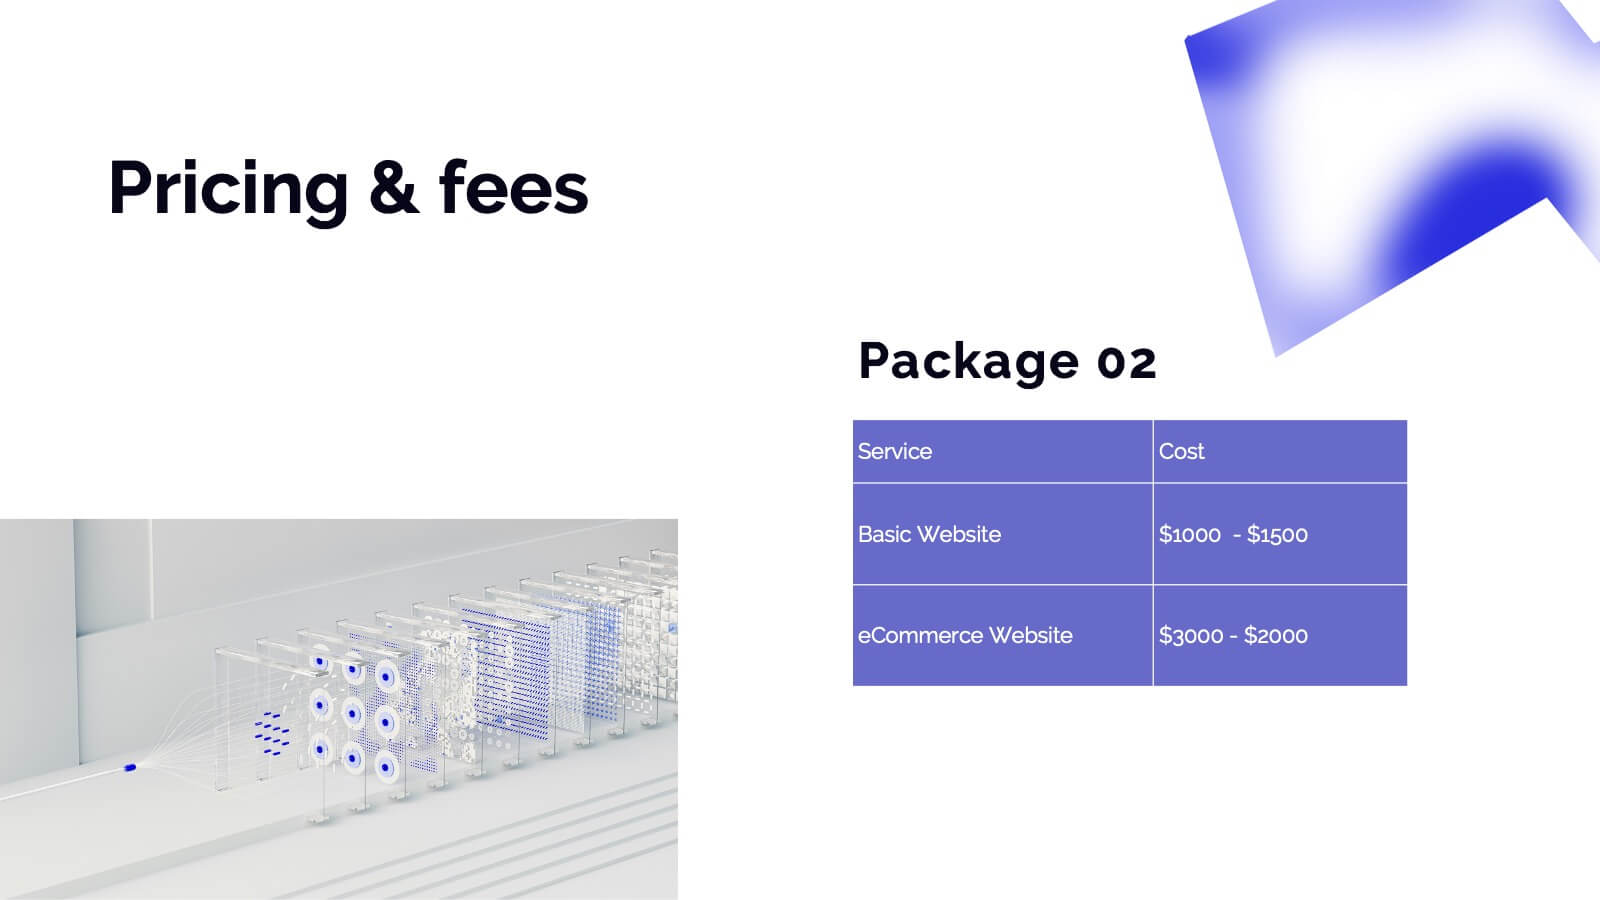
Dryad Photography Portfolio Template Presentation
Showcase your photography skills with this elegant and professional portfolio presentation template! Perfect for highlighting your projects, style, and creative process, this template covers everything from client testimonials to pricing and services offered. It’s ideal for photographers wanting to present their work with style and clarity. Compatible with PowerPoint, Keynote, and Google Slides for effortless sharing and presentations.


5 diapositivas
Conference Agenda Slide Presentation
Keep your sessions structured and engaging with the Conference Agenda Slide Presentation. Designed with a visual screen-style format, it showcases a 4-part schedule using color-coded blocks for clarity. Perfect for corporate events, speaker lineups, or workshops. Fully editable in PowerPoint, Keynote, and Google Slides.


28 diapositivas
Glowspire Brand Guidelines Proposal Presentation
This brand identity template covers essential components: logo, imagery, color, typography, and voice & tone. It includes slides for consumer persona, market analysis, USP, brand positioning, and strategy. Ideal for establishing a cohesive brand, it highlights brand touchpoints across digital, print, packaging, and advertising mediums. Customizable for various platforms.


23 diapositivas
Quest Corporate Strategy Proposal Presentation
Unlock success with this powerful corporate strategy template! Detail strategic objectives, market trends, and growth opportunities. Ideal for business leaders aiming to drive growth. Compatible with PowerPoint, Keynote, and Google Slides, this template ensures your strategy is clear, professional, and compelling. Make your vision a reality with impactful presentations.


10 diapositivas
Profitability and Cost Analysis
Streamline your financial storytelling with this interlinked diagram template. Designed for business consultants, CFOs, and analysts, it helps visualize cost components and profit drivers across five stages. Each segment is clearly labeled and color-coded for easy comprehension. Fully customizable in PowerPoint, Keynote, and Google Slides.


5 diapositivas
Business Process Checklist Presentation
Ensure smooth workflows with the Business Process Checklist template. This visually structured layout simplifies process tracking, highlighting key steps and completion percentages. Perfect for project managers and teams looking to optimize efficiency. Fully editable and compatible with PowerPoint, Keynote, and Google Slides for easy customization and seamless presentation.


6 diapositivas
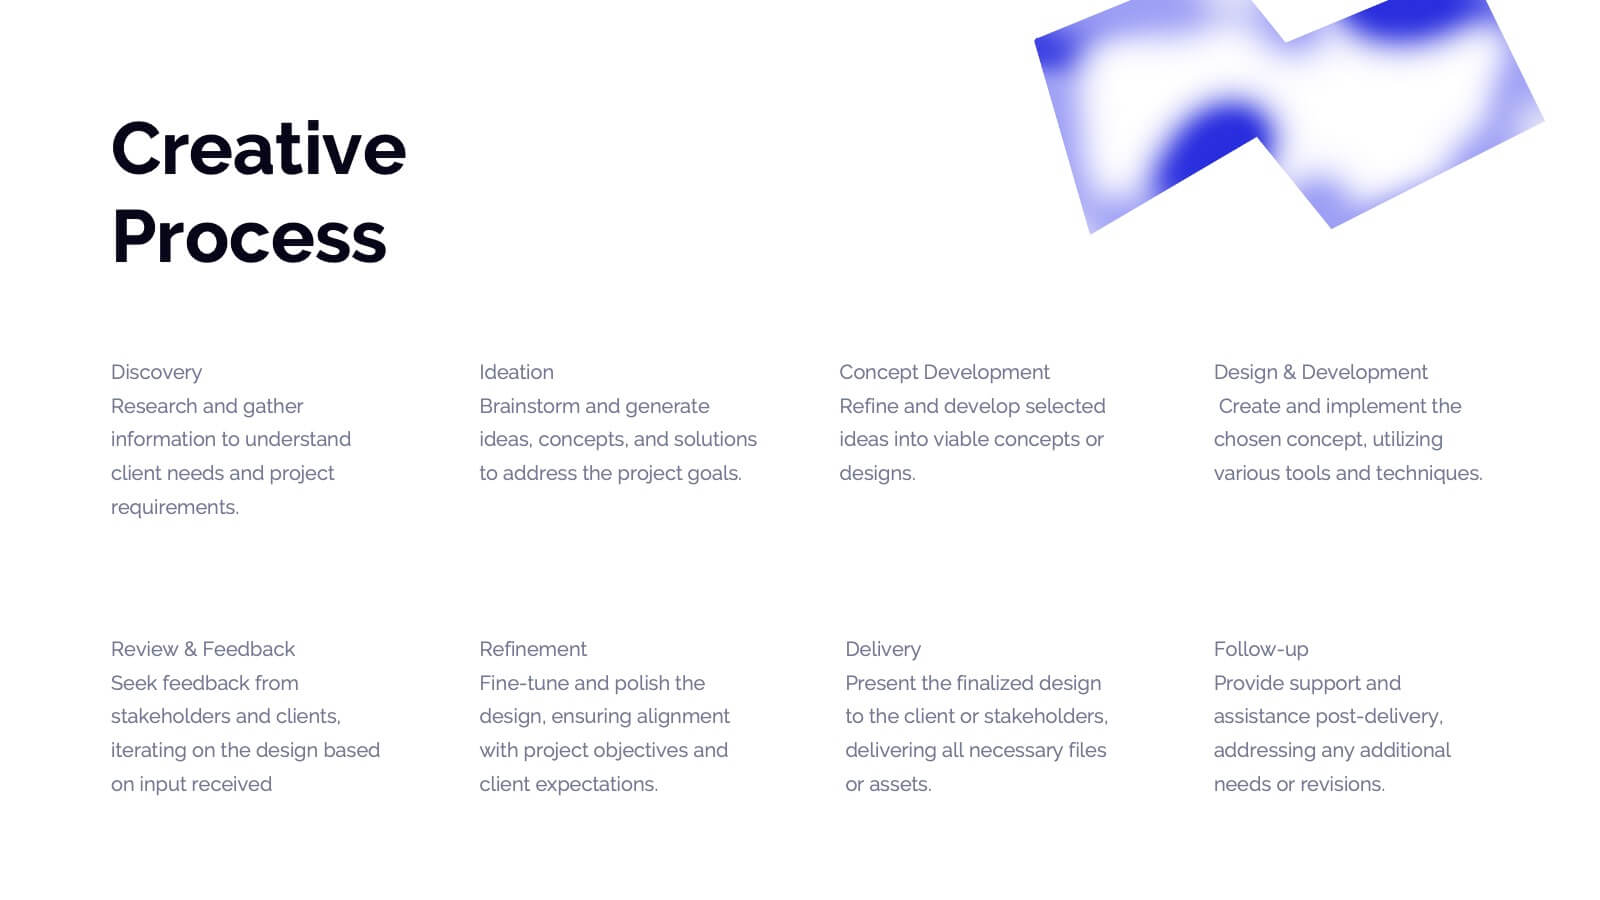
Product Development Cycles Presentation
A great product starts with a clear, engaging story—this presentation brings that journey to life. It outlines each stage of the development cycle in a simple, visual flow that helps teams communicate progress, milestones, and next steps. Perfect for strategy, planning, and updates. Fully compatible with PowerPoint, Keynote, and Google Slides.


22 diapositivas
Simple Pitch Deck Presentation
Streamline your pitch process with this no-frills Pitch Deck template, designed for clear communication and powerful impact. From the get-go, the cover slide clearly announces your purpose, inviting audiences into your business narrative. The template smoothly transitions from one slide to the next, each one a stepping stone in building your case — from problem to solution. It includes a neatly organized table of contents, thought-provoking mission and vision statements, and data-rich slides for a deep dive into your business metrics. Each section, marked with bold, numbered headers, keeps your presentation on track and your audience engaged. A final 'Thank You' slide adds a touch of professionalism, and the credits section ensures that your sources are transparently acknowledged. This pitch deck is ideal for startups and businesses looking to capture attention and convey their story succinctly.


5 diapositivas
Creative Geometric Infographic Presentation
The "Creative Geometric Infographic" presentation template leverages dynamic circular shapes and interconnected designs to elegantly display information. This template provides a fresh, visually engaging way to present business insights, data points, or key concepts across multiple areas or themes. The use of distinct icons and varying color palettes within each segment helps highlight different aspects effectively while maintaining an organized look. It is an excellent choice for presentations that require a blend of creativity and clarity to communicate complex information efficiently. This setup is particularly useful for visually summarizing relationships or processes in business, technology, or educational fields.


6 diapositivas
Audience Segmentation by Region Presentation
Discover where your audience truly connects with a visually engaging layout that highlights market insights across regions. This presentation helps businesses identify, compare, and target audiences by location for smarter decision-making. Fully customizable and compatible with PowerPoint, Keynote, and Google Slides for seamless professional use and presentation flexibility.


10 diapositivas
Concentric Circles Business Model Presentation
Visualize Your Business Strategy with Clarity using this Concentric Circles Business Model Presentation template. This design helps you illustrate core business concepts, hierarchical structures, and strategic layers in a simple yet engaging format. Ideal for business planning, process optimization, and strategic growth presentations, this template makes complex relationships clear and easy to understand. Fully editable and available for PowerPoint, Keynote, and Google Slides.


26 diapositivas
Soren Presentation Template
Soren is a cool, clean, simple easy to use template. This beautiful template is great for all types of businesses and creative projects. The colors are bold and simple to capture the audience needs. Soren is a multipurpose theme that can be used to capture the attention of your clients in a friendly, unique way. This template is a minimalistic design to attract your customers. The simple text, charts and tables make it easy to customize this template to match your brand. Whether you’re in need of a business presentation, newsletter or even social media posts – Soren is the perfect fit for you.


6 diapositivas
Create Challenge Infographic
Challenges are obstacles, difficulties, or problems that individuals, organizations, or societies face while trying to achieve their goals or navigate through various situations. This infographic template involves visually presenting a specific challenge, its context, and possible solutions in an informative way. Summarize the key takeaways from the infographic, emphasizing the importance of addressing the challenge and implementing the suggested solutions. An effective challenge infographic can be used for educational purposes, presentations, or as a reference guide to help individuals and teams overcome challenges in a structured and informed manner.