


Características


¿Tienes alguna pregunta?
Recomendar


7 diapositivas
Construction Infographics Presentation Template
Featuring our construction template this is a great way to show off your next project. It features a construction background with illustrations and the slide icons include all your progress steps. It is the perfect choice to present your work or to showcase a product, it has a beautiful design and informative data that will be sure to increases sales for you. This template is part of our construction category and features a construction infographic design. It is an engaging and colorful way to present your message in a clean and bright format. Perfect for any presentation you can imagine!


6 diapositivas
Multiple Choice Options Slide Presentation
Make your ideas stand out with a bold, interactive design that organizes multiple options clearly and visually. Ideal for showcasing comparisons, scenarios, or decision pathways, this presentation keeps audiences engaged and informed. Fully compatible with PowerPoint, Keynote, and Google Slides for seamless customization and professional results.


23 diapositivas
Maverick Business Plan Presentation
Navigate your business journey with ease using this comprehensive business plan presentation template. Structured to guide you through each critical aspect of your business, from market analysis and operational strategies to financial projections and employee management, this template provides a solid foundation for conveying your business objectives and plans. Ideal for startups and established enterprises alike, it's designed to facilitate discussions on company direction and strategic decisions. Compatible with PowerPoint, Google Slides, and Keynote, this template is accessible across devices, ensuring you can pitch or plan wherever you are.


6 diapositivas
Engagement Survey Results Infographics
Effectively communicate your engagement survey results with our Engagement Survey Results infographic template. This template is fully compatible with popular presentation software like PowerPoint, Keynote, and Google Slides, allowing you to easily customize it to illustrate and convey your survey findings. The Engagement Survey Results infographic template offers a visually engaging platform to present survey data, key findings, and insights related to employee or customer engagement. Whether you're an HR professional, manager, or business leader, this template provides a user-friendly canvas to create informative presentations and reports on engagement survey outcomes. Optimize your communication of survey results with this SEO-optimized Engagement Survey Results infographic template, thoughtfully designed for clarity and ease of use. Customize it to showcase survey methodology, response rates, visualizations of data, and action plans based on the findings, ensuring that your audience gains a comprehensive understanding of the survey results and their implications. Start crafting your personalized infographic today to effectively communicate engagement survey outcomes.


3 diapositivas
First 90 Days Action Strategy Plan Presentation
Get ready to crush your first 90 days with a strategy layout that actually makes sense. This template helps you outline clear goals, actions, and milestones to hit during your critical first quarter—perfect for managers or new hires. Fully customizable and compatible with PowerPoint, Keynote, and Google Slides for easy editing.


6 diapositivas
South America Language Map Infographics
South America is located in the Western Hemisphere and is known for its diverse landscapes, cultures, and countries. This infographic template can provide a visual representation of the countries and key information about the continent's geography, culture, economy, and more. This template is designed to help your audience gain insights into the diverse and rich continent, making it a valuable tool for educational, promotional, and informative purposes. This map infographic can be shared on websites, social media platforms, presentations, and marketing materials targeting audiences interested in South America.


5 diapositivas
Modern Design with Geometric Elements Presentation
Elevate your message with this clean, modern layout featuring four-leaf geometric icons and subtle color accents. Perfect for showcasing strategic concepts or business pillars in a stylish, easy-to-read format. Ideal for proposals, updates, or team presentations. Fully editable in PowerPoint, Google Slides, Keynote, and Canva. Professional and versatile.


7 diapositivas
Annual Report Infographics Presentation Template
Annual reports are comprehensive documents designed to provide readers with information about a company's performance in the preceding year with a focus on all major aspects of its operations. They help investors, competitors and other stakeholders understand how well a business is performing. This template is designed to help users produce annual reports for their company. Annual reports provide insights into the company's direction in the preceding year. This template includes many features to make your document as professional as possible and includes various charts and graphs.


4 diapositivas
3-Circle Overlap Venn Layout
Visually break down relationships and intersections with the 3-Circle Overlap Venn Layout Presentation. This sleek, minimalist diagram is ideal for illustrating shared values, cross-functional strategies, or concept intersections. Each circle is color-coded with space for clear titles and concise explanations. Great for strategy discussions, branding, or stakeholder presentations. Fully editable in PowerPoint, Keynote, and Google Slides.


6 diapositivas
Sales Skills Development Training Presentation
Bring your sales training to life with a sleek, infinity-loop visual that keeps learners engaged from start to finish. This template helps you map out each phase of sales skill development, from lead generation to closing. Fully customizable and compatible with PowerPoint, Keynote, and Google Slides for seamless integration.


12 diapositivas
Corporate Sustainability Strategy Presentation
Achieve your sustainability goals with the Corporate Sustainability Strategy Presentation template. This modern, visually engaging layout helps businesses showcase their environmental, social, and governance (ESG) initiatives, sustainability roadmaps, and corporate responsibility plans. Featuring clear, structured sections, this fully customizable design is perfect for corporate leaders, consultants, and eco-conscious organizations. Compatible with PowerPoint, Keynote, and Google Slides for effortless editing and presentation.


3 diapositivas
Early Detection and Prevention of Breast Cancer
Promote awareness and proactive care with this “Early Detection and Prevention of Breast Cancer” slide. Designed with an impactful visual of a female silhouette and icon-based health markers, it’s ideal for medical presentations, awareness campaigns, and corporate wellness programs. The infographic layout clearly communicates key statistics, risk factors, or steps for prevention. Fully editable in PowerPoint, Keynote, and Google Slides.


7 diapositivas
Communication Infographic Presentation Template
Communication Infographics are a more professional way of presenting facts and a great way to share your marketing strategy and goals with your team. Our template includes a variety of infographic elements, including bullet points, call to actions and persuasive slogans. This template design is ideal for presentations on subjects such as content marketing, sales, social media strategy, and many more. Our Communication Template includes graphic illustrations, slides and text boxes for your topics. In this template you can easily add your own text and images to create a meaningful presentation.


5 diapositivas
Project Management Framework
Guide your team through every project phase with this step-by-step framework presentation. Designed with a five-stage visual flow, this layout helps clearly communicate key milestones, tasks, and deliverables. Each stage is color-coded for easy tracking and includes editable text and icons. Perfect for planning, strategy, and agile workflows. Fully compatible with PowerPoint, Keynote, and Google Slides.


20 diapositivas
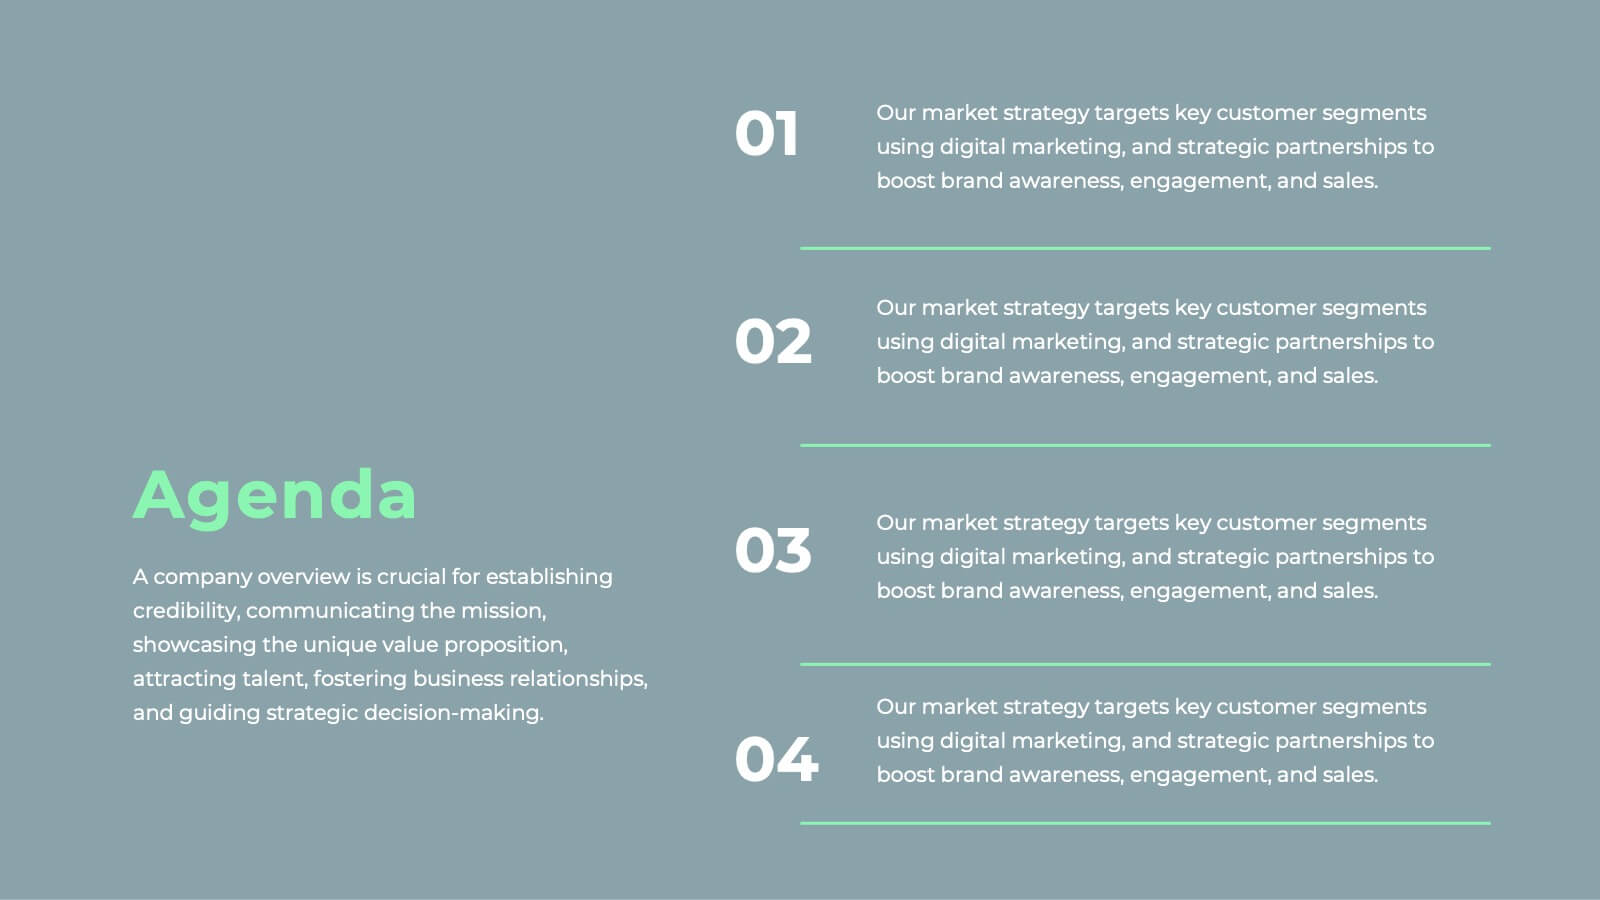
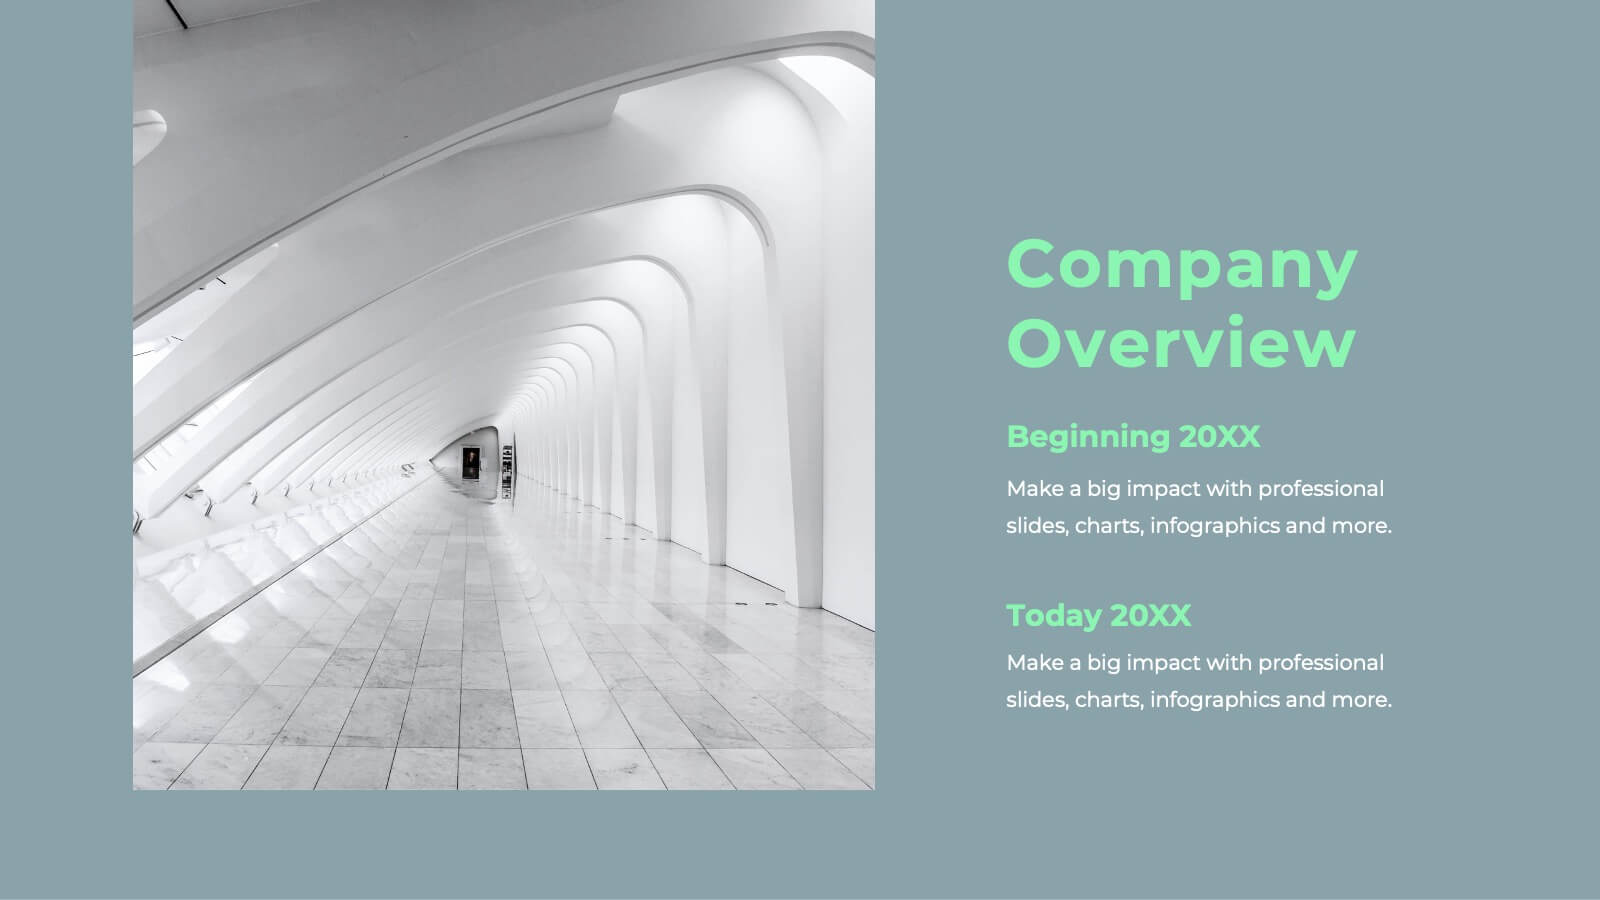
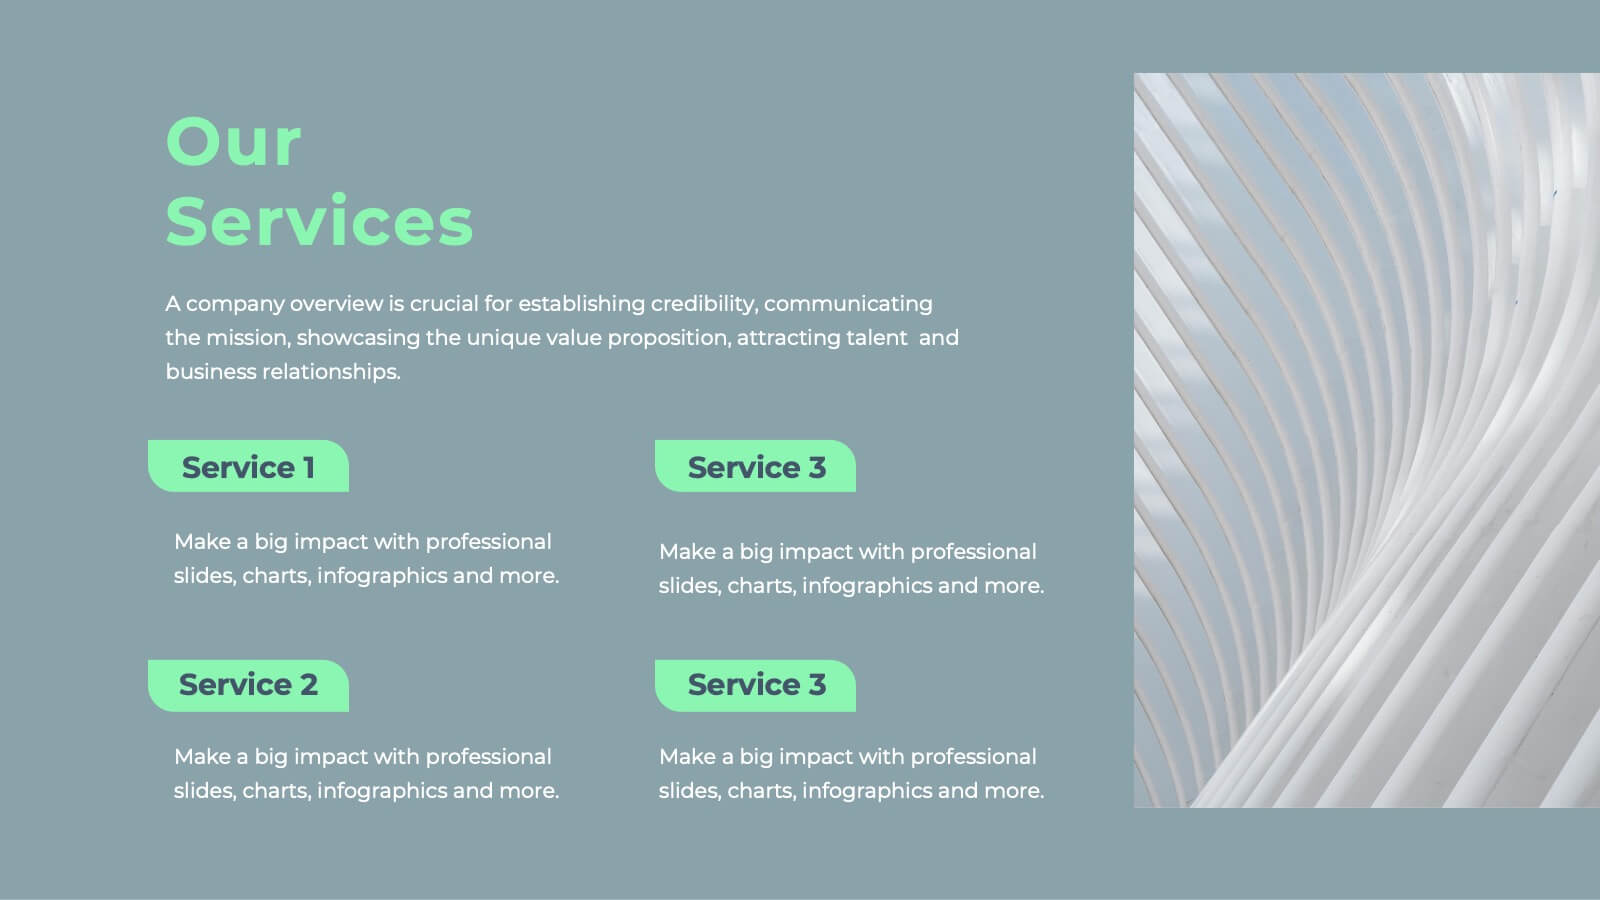
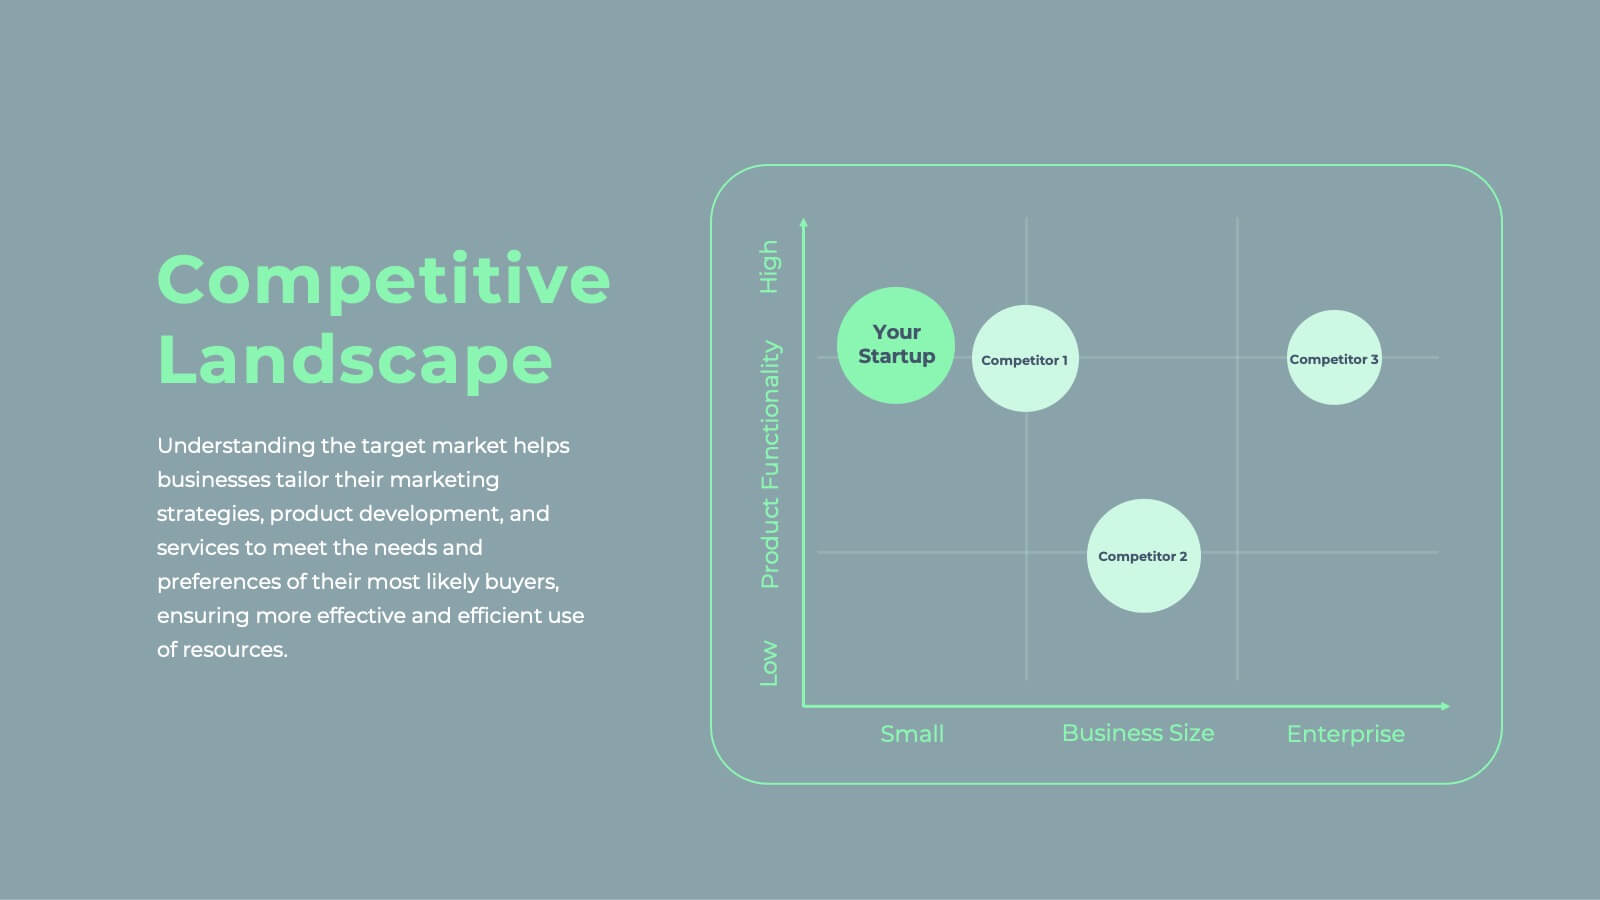
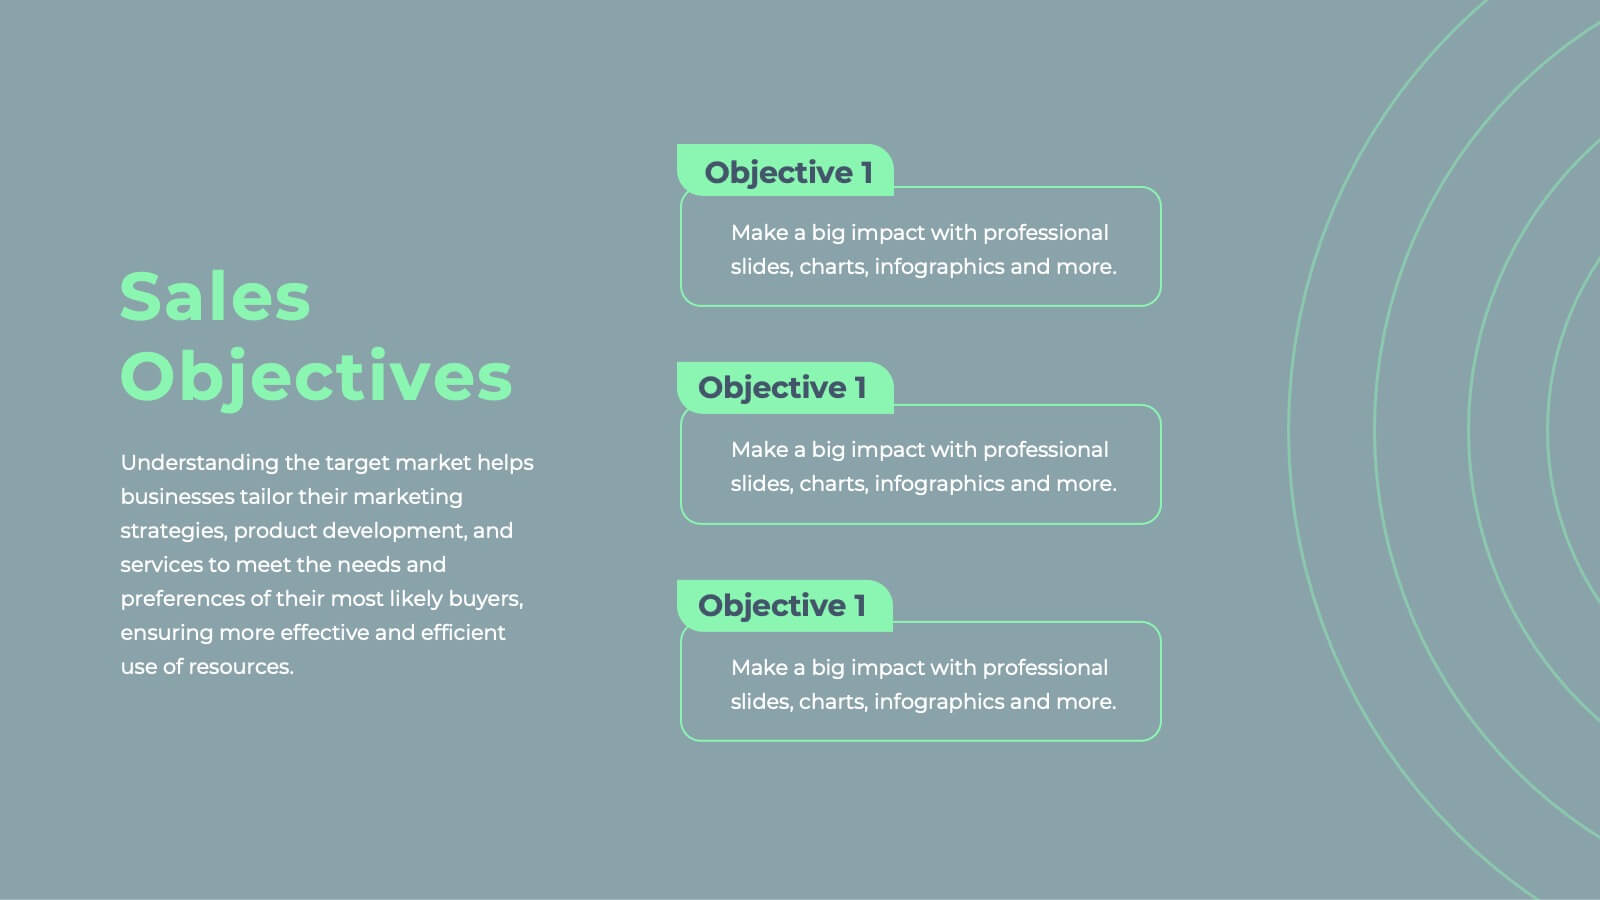
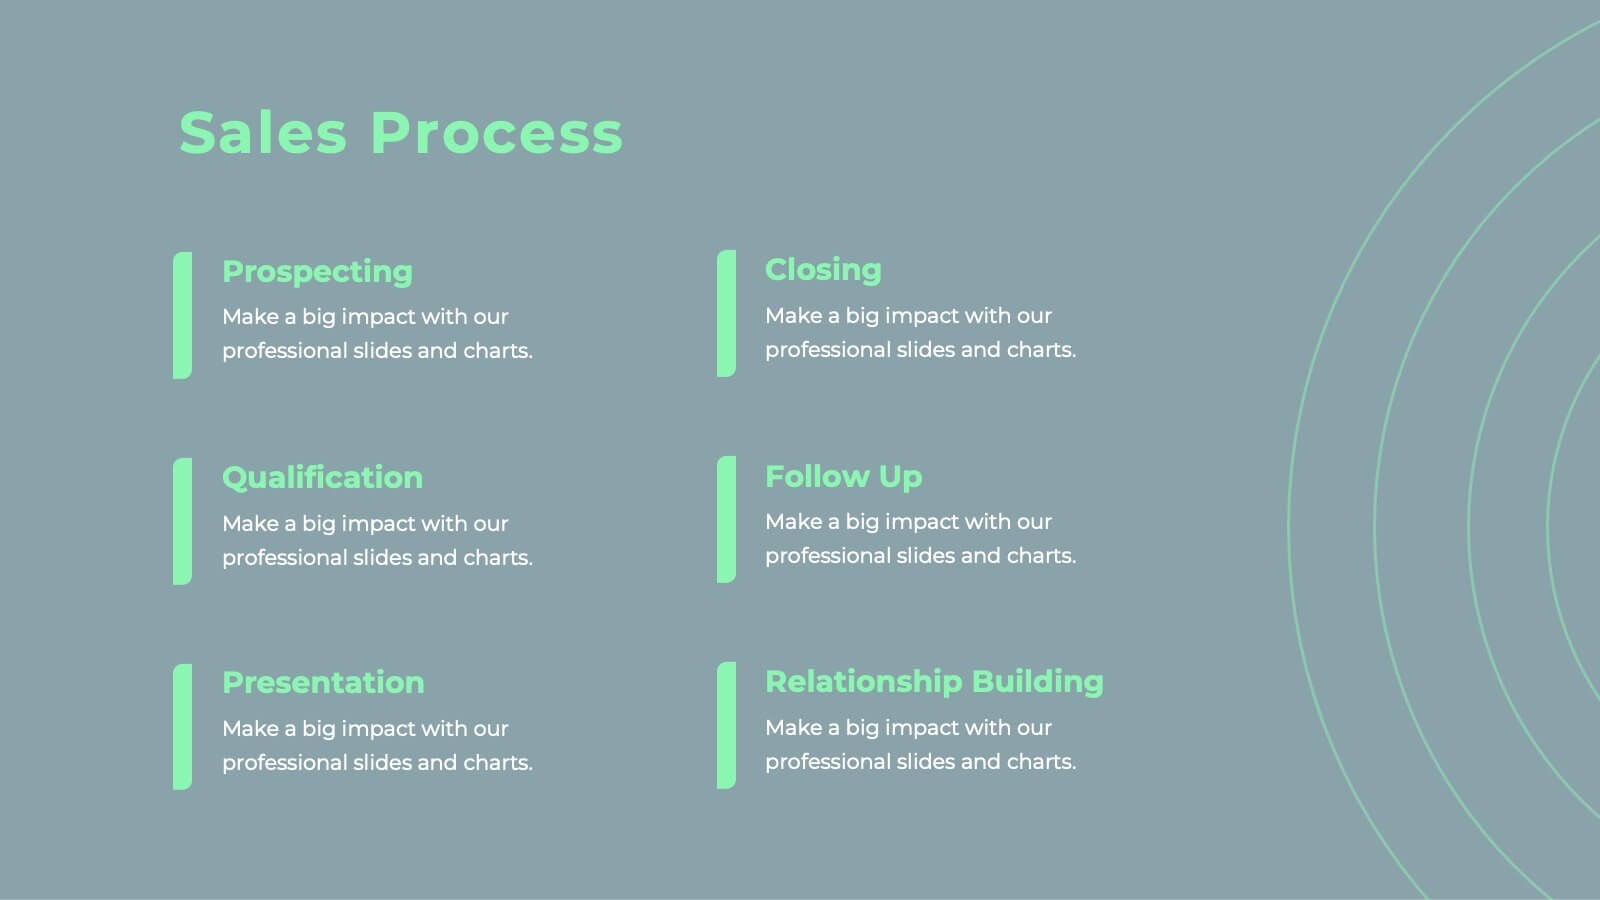
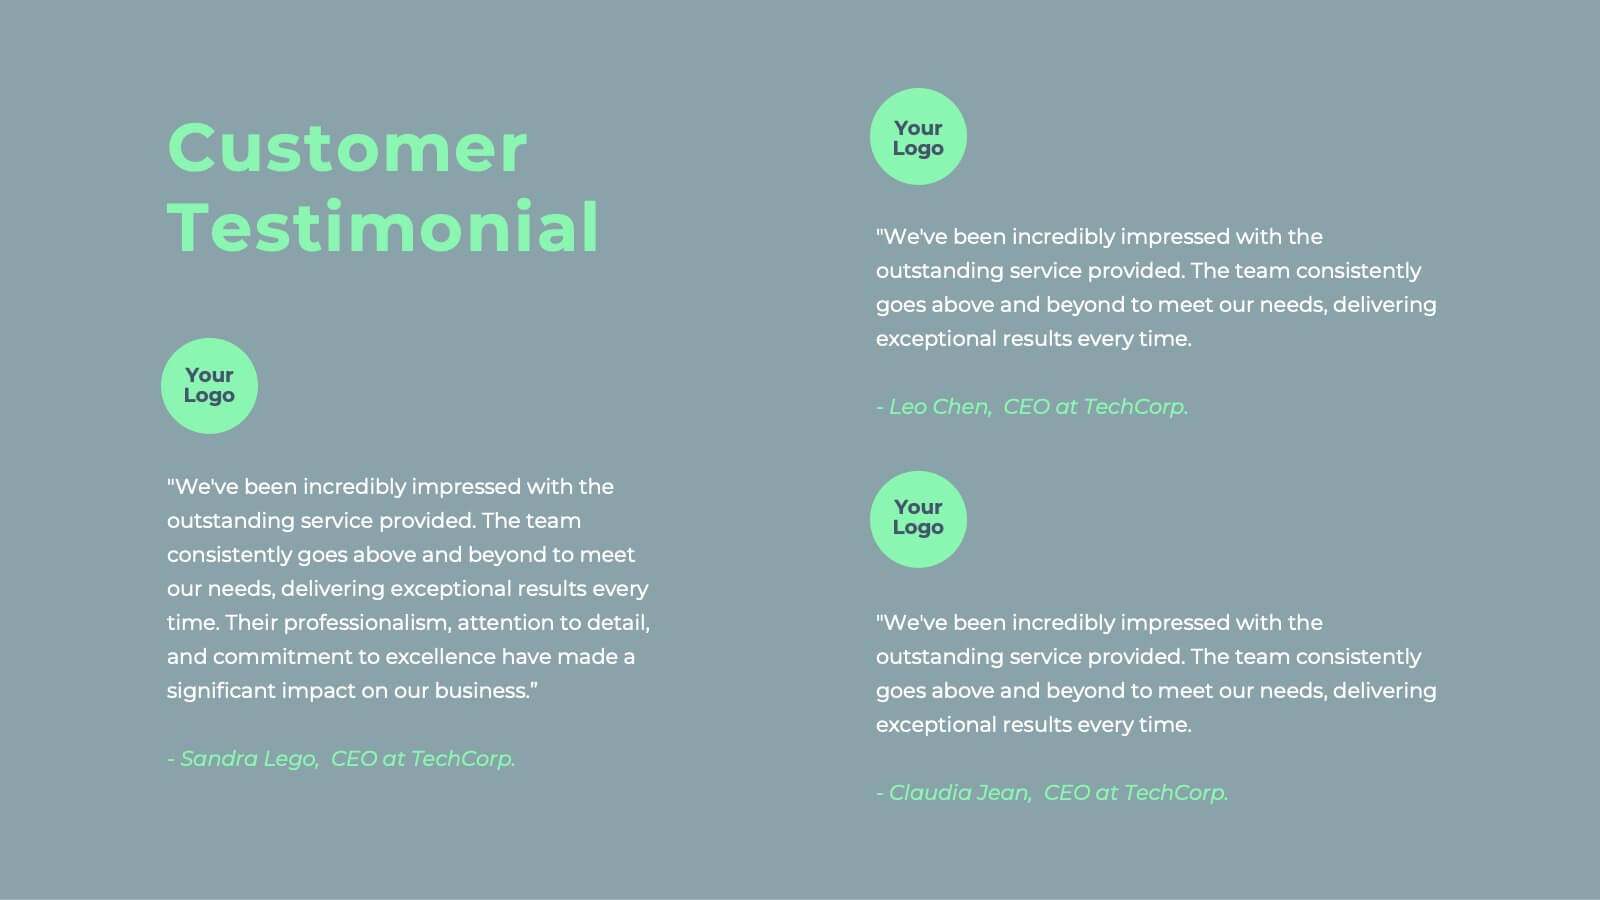
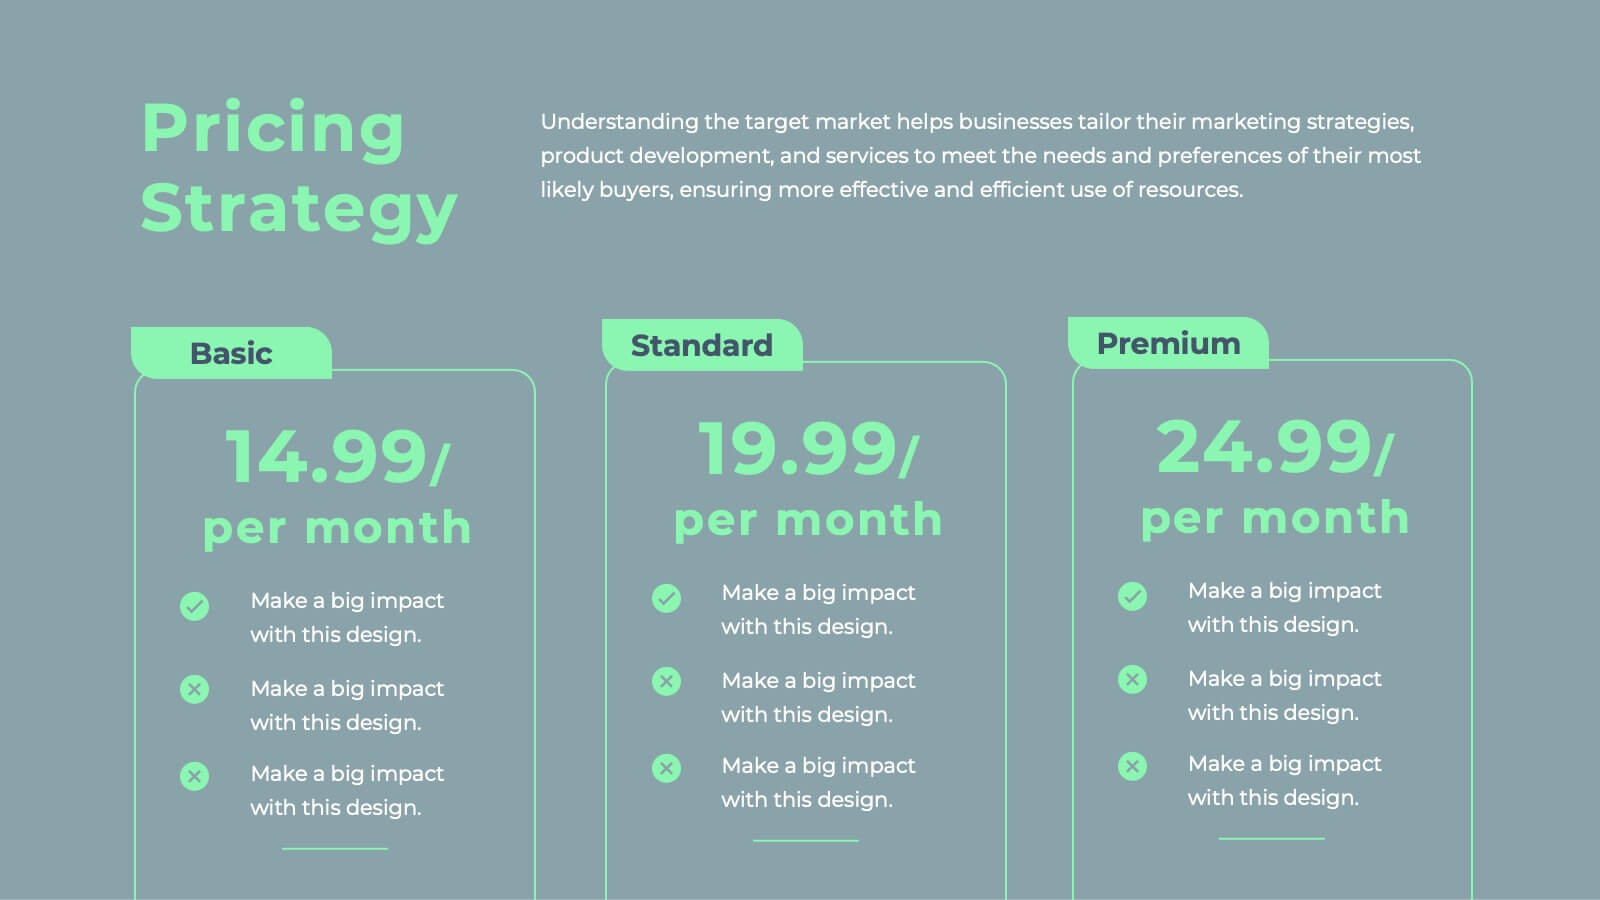
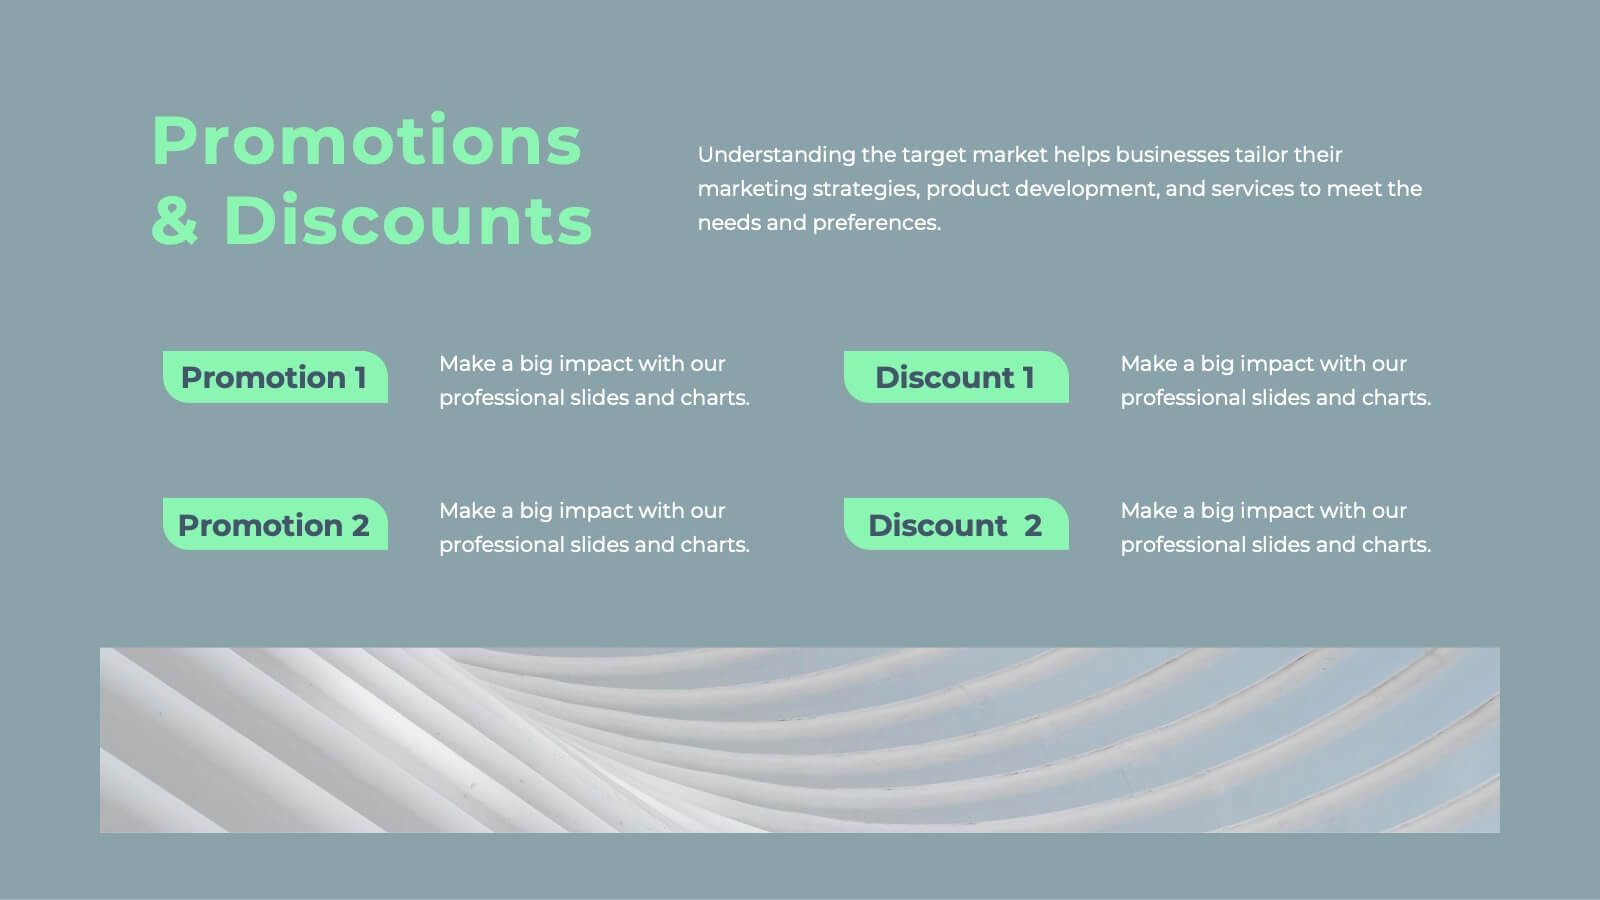
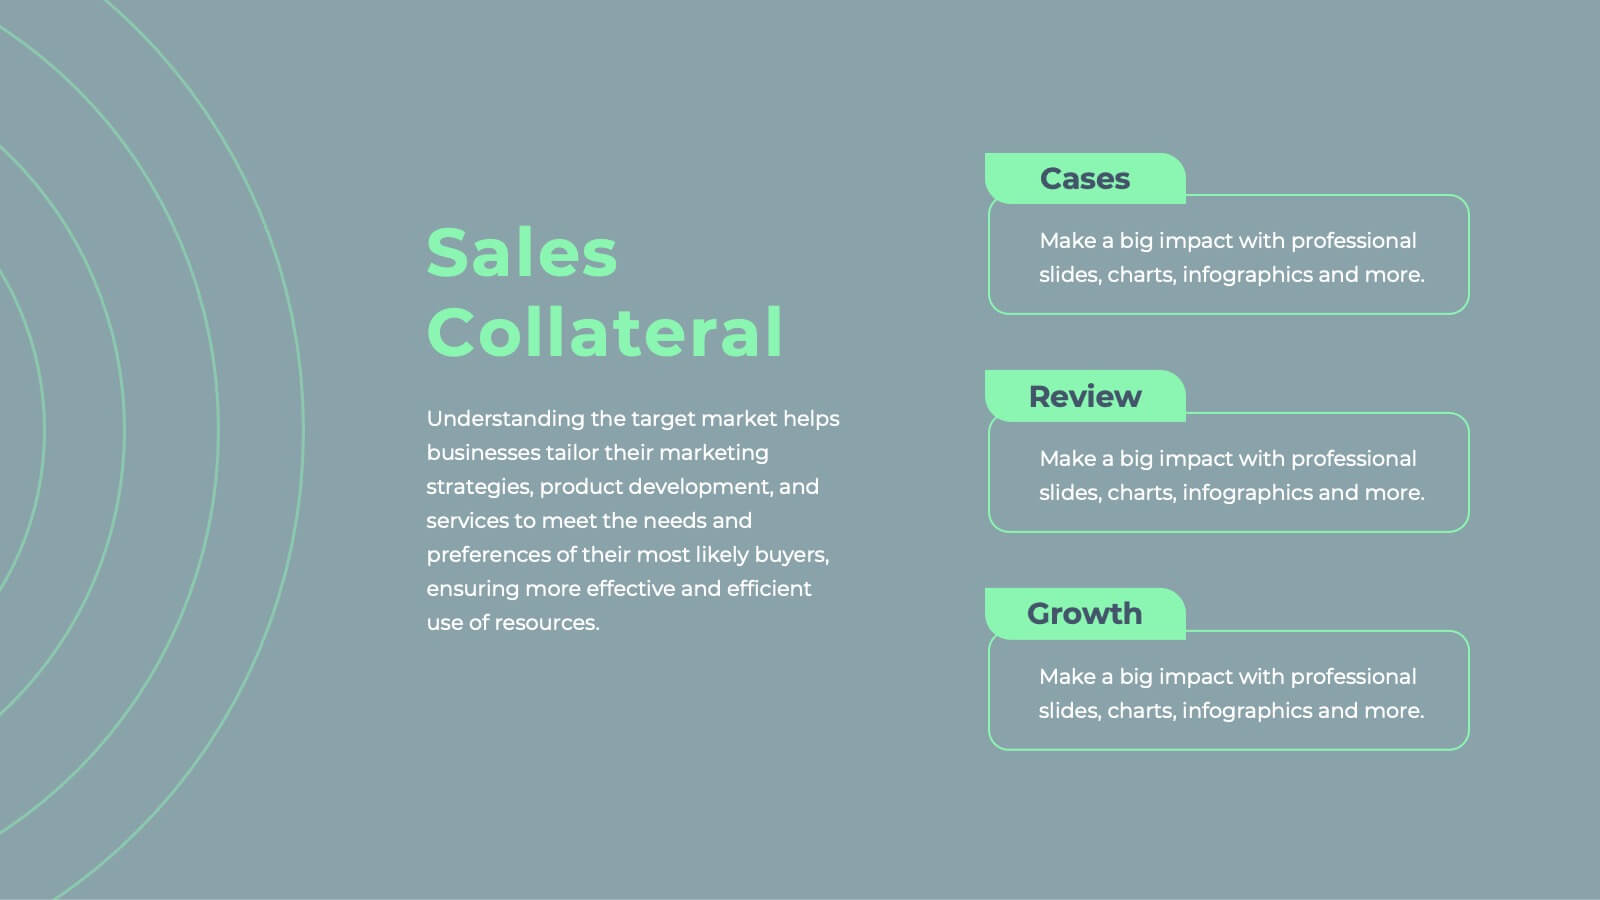
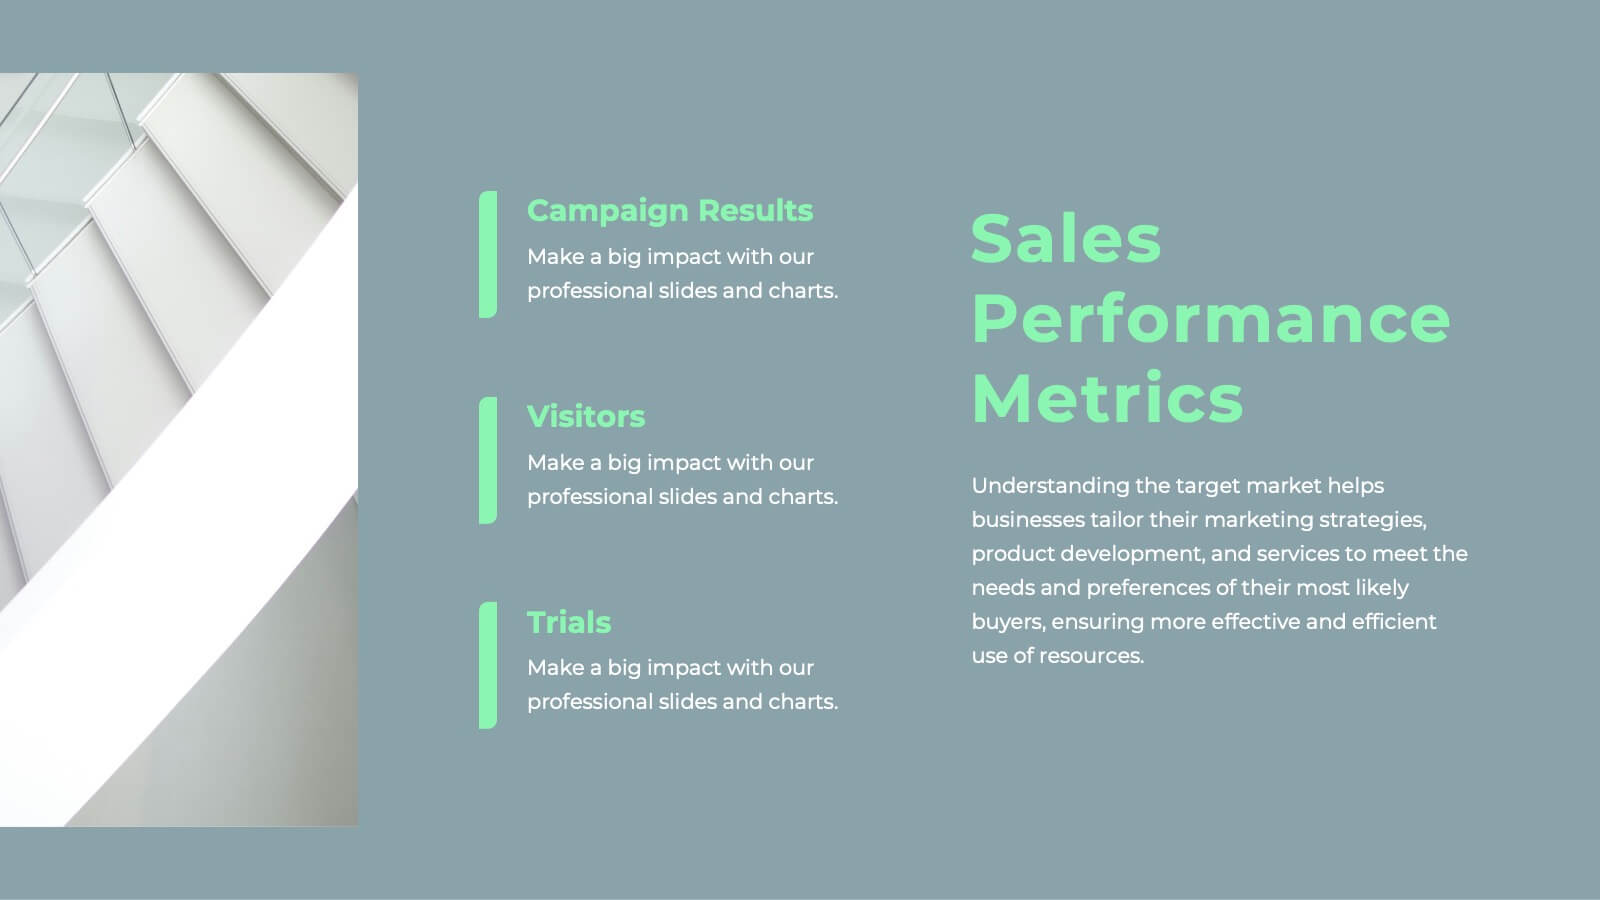
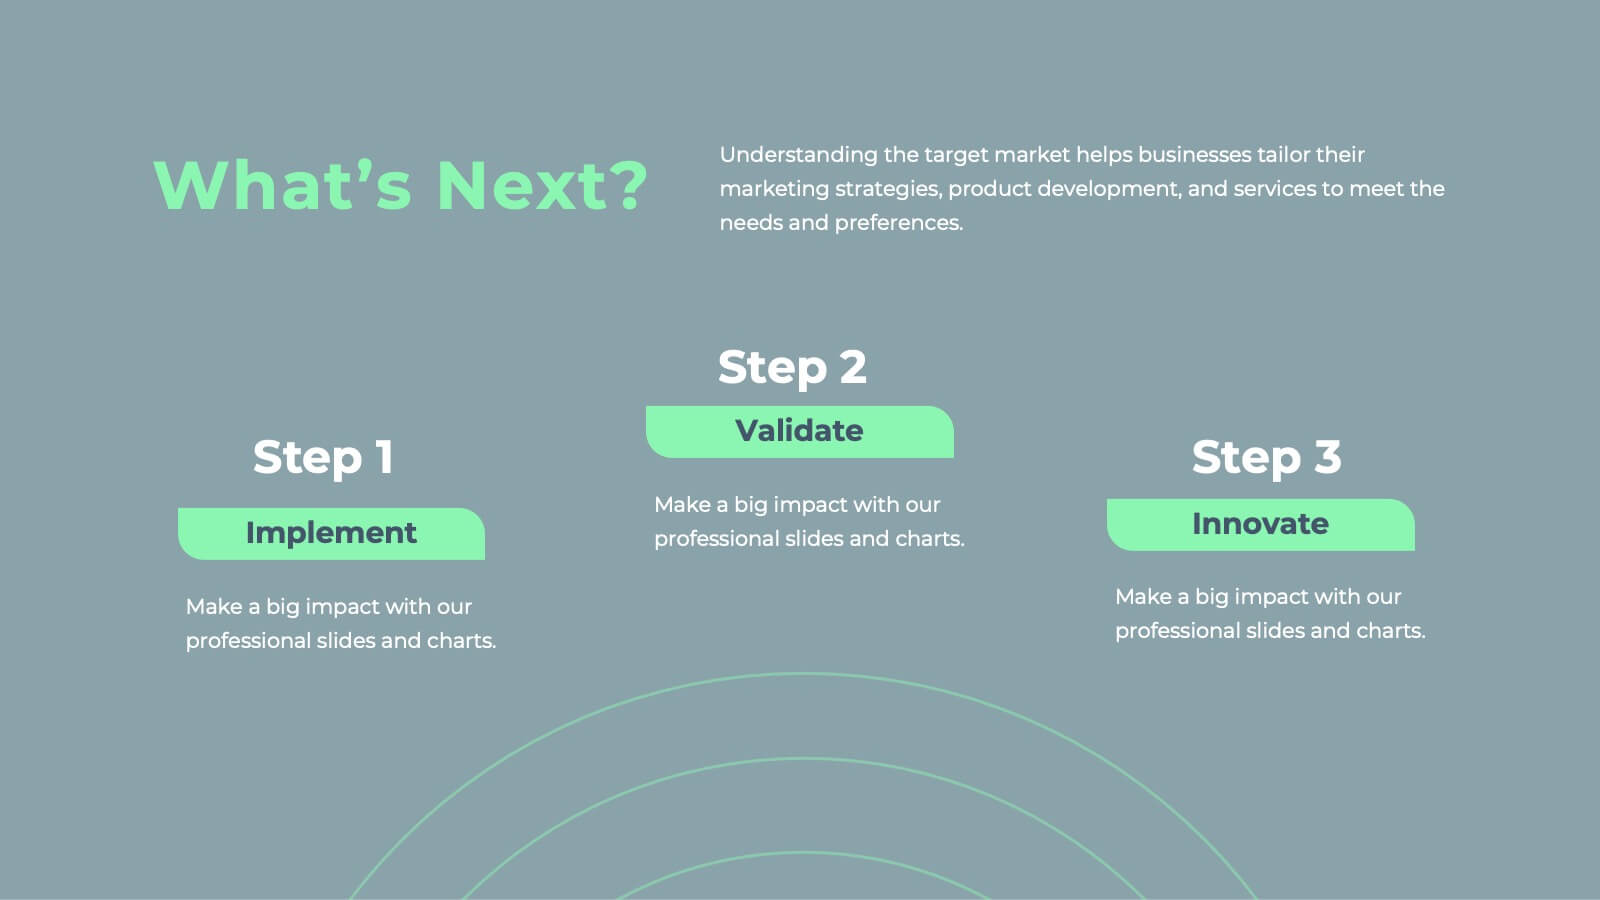
Javelin Sales Strategy Presentation
Boost your sales strategy with this sleek template! Perfect for outlining objectives, processes, performance metrics, and future opportunities. Tailored for impactful presentations to clients and teams. Fully customizable and compatible with PowerPoint, Keynote, and Google Slides.


5 diapositivas
Detailed Project Scope Definition Presentation
Bring structure and clarity to your planning process with a layout designed to define every stage of your project. Perfect for outlining goals, deliverables, and timelines, this presentation keeps information clear and organized. Fully compatible with PowerPoint, Keynote, and Google Slides for easy customization and professional results.


5 diapositivas
Fitness Trainings Infographics
Fitness Training refers to structured physical activities or exercises designed to improve and maintain physical fitness, overall health, and athletic performance. Using these infographic templates, you can effectively educate your audience about different fitness training techniques, inspire them to adopt a healthy and active lifestyle, and provide them with practical tips and guidance for their fitness journey. These are designed to showcase various fitness training concepts, techniques, and tips. Whether you're a fitness instructor, personal trainer, or fitness enthusiast, this template is a valuable resource to educate and motivate your audience about fitness training.