


Características


¿Tienes alguna pregunta?
Recomendar


4 diapositivas
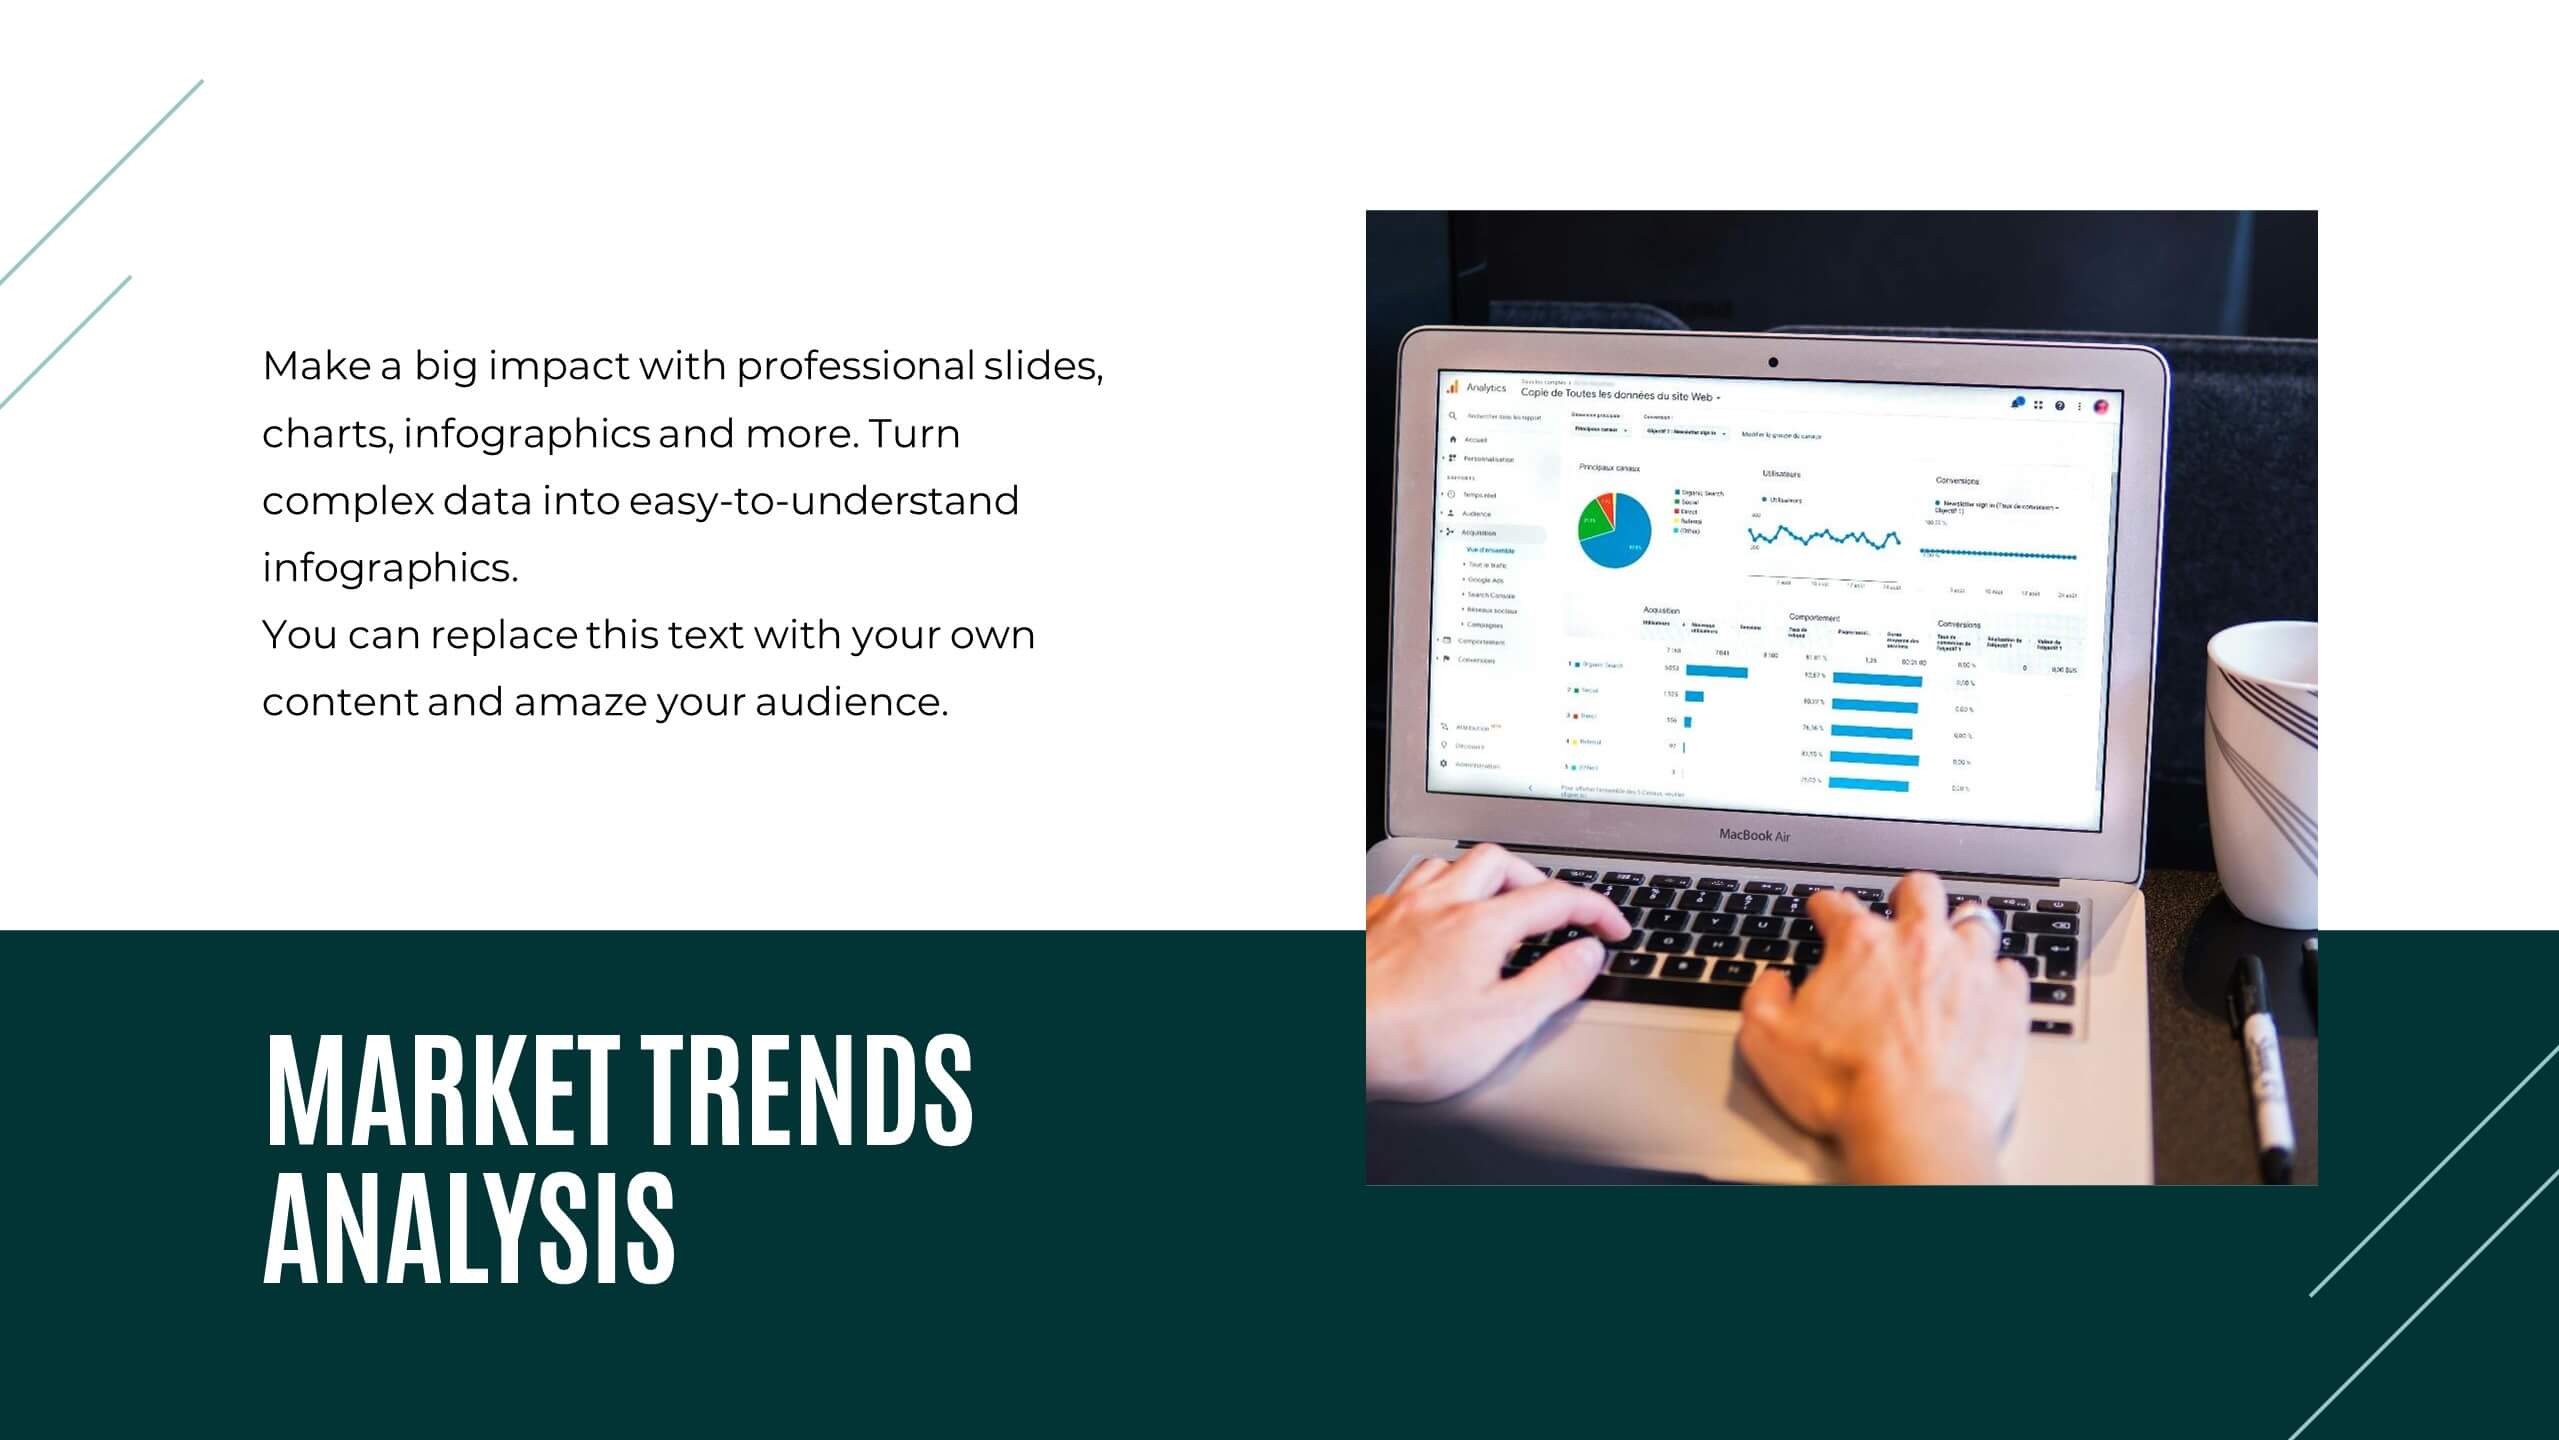
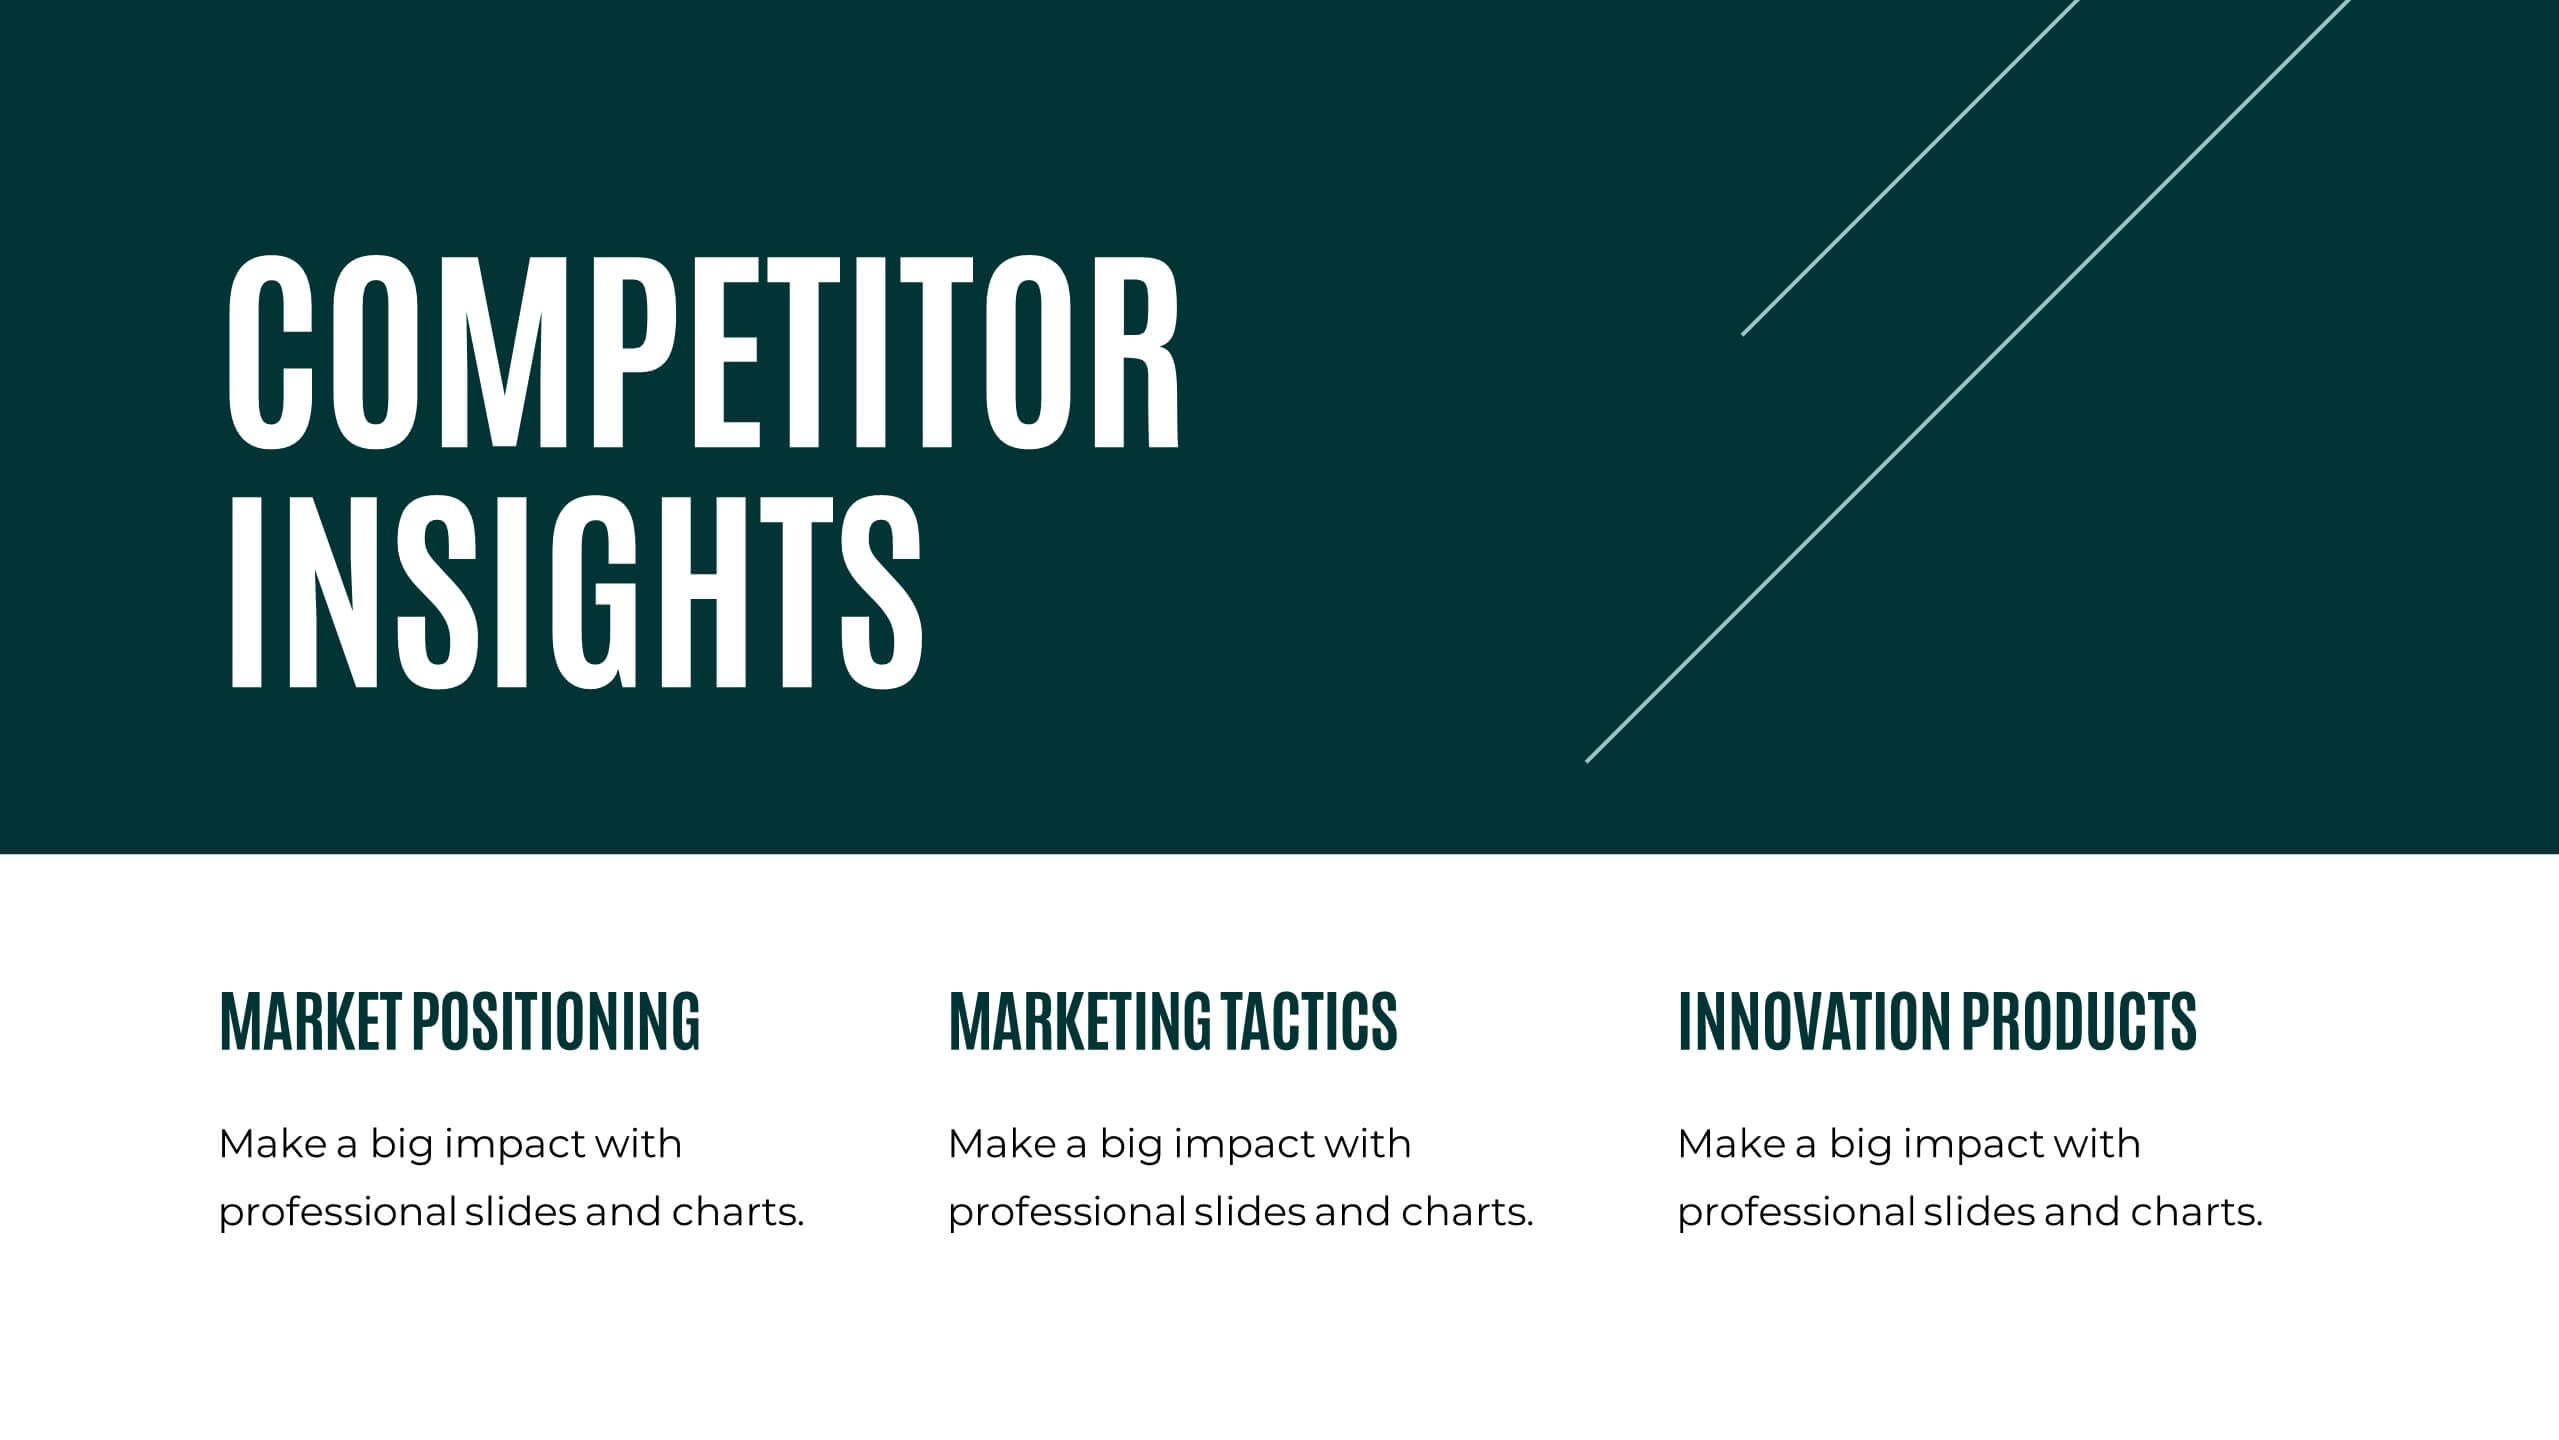
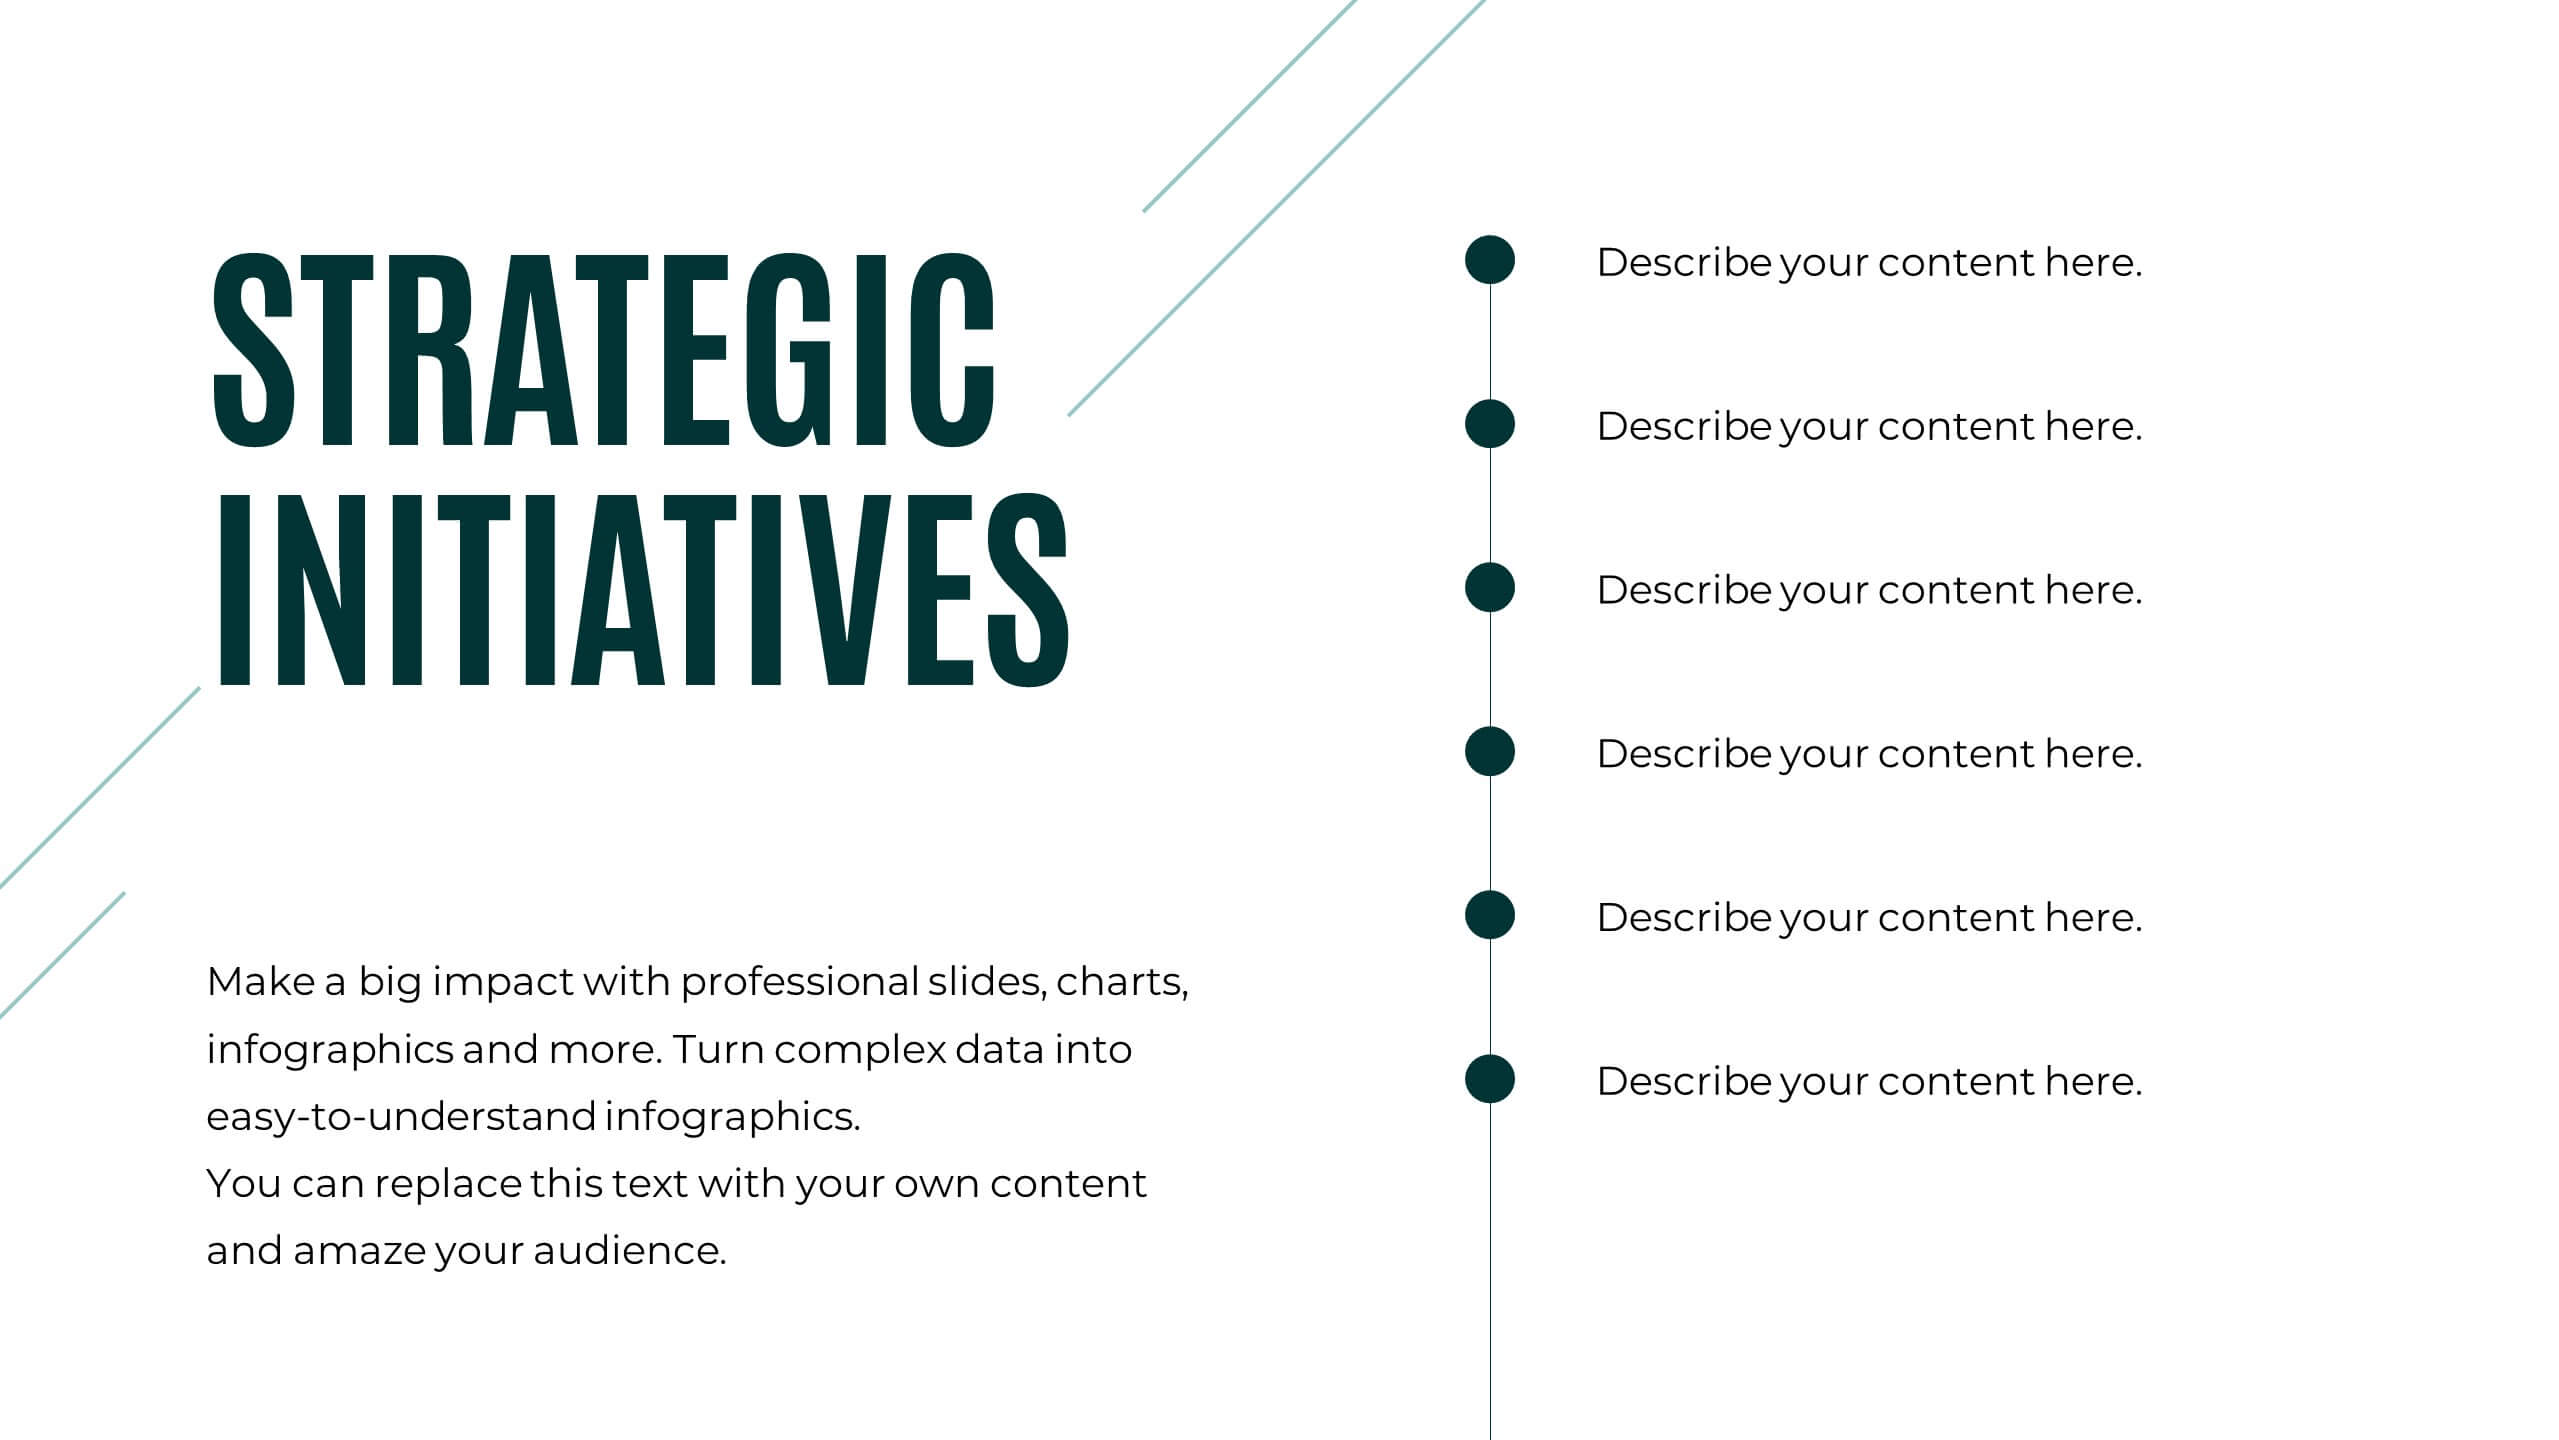
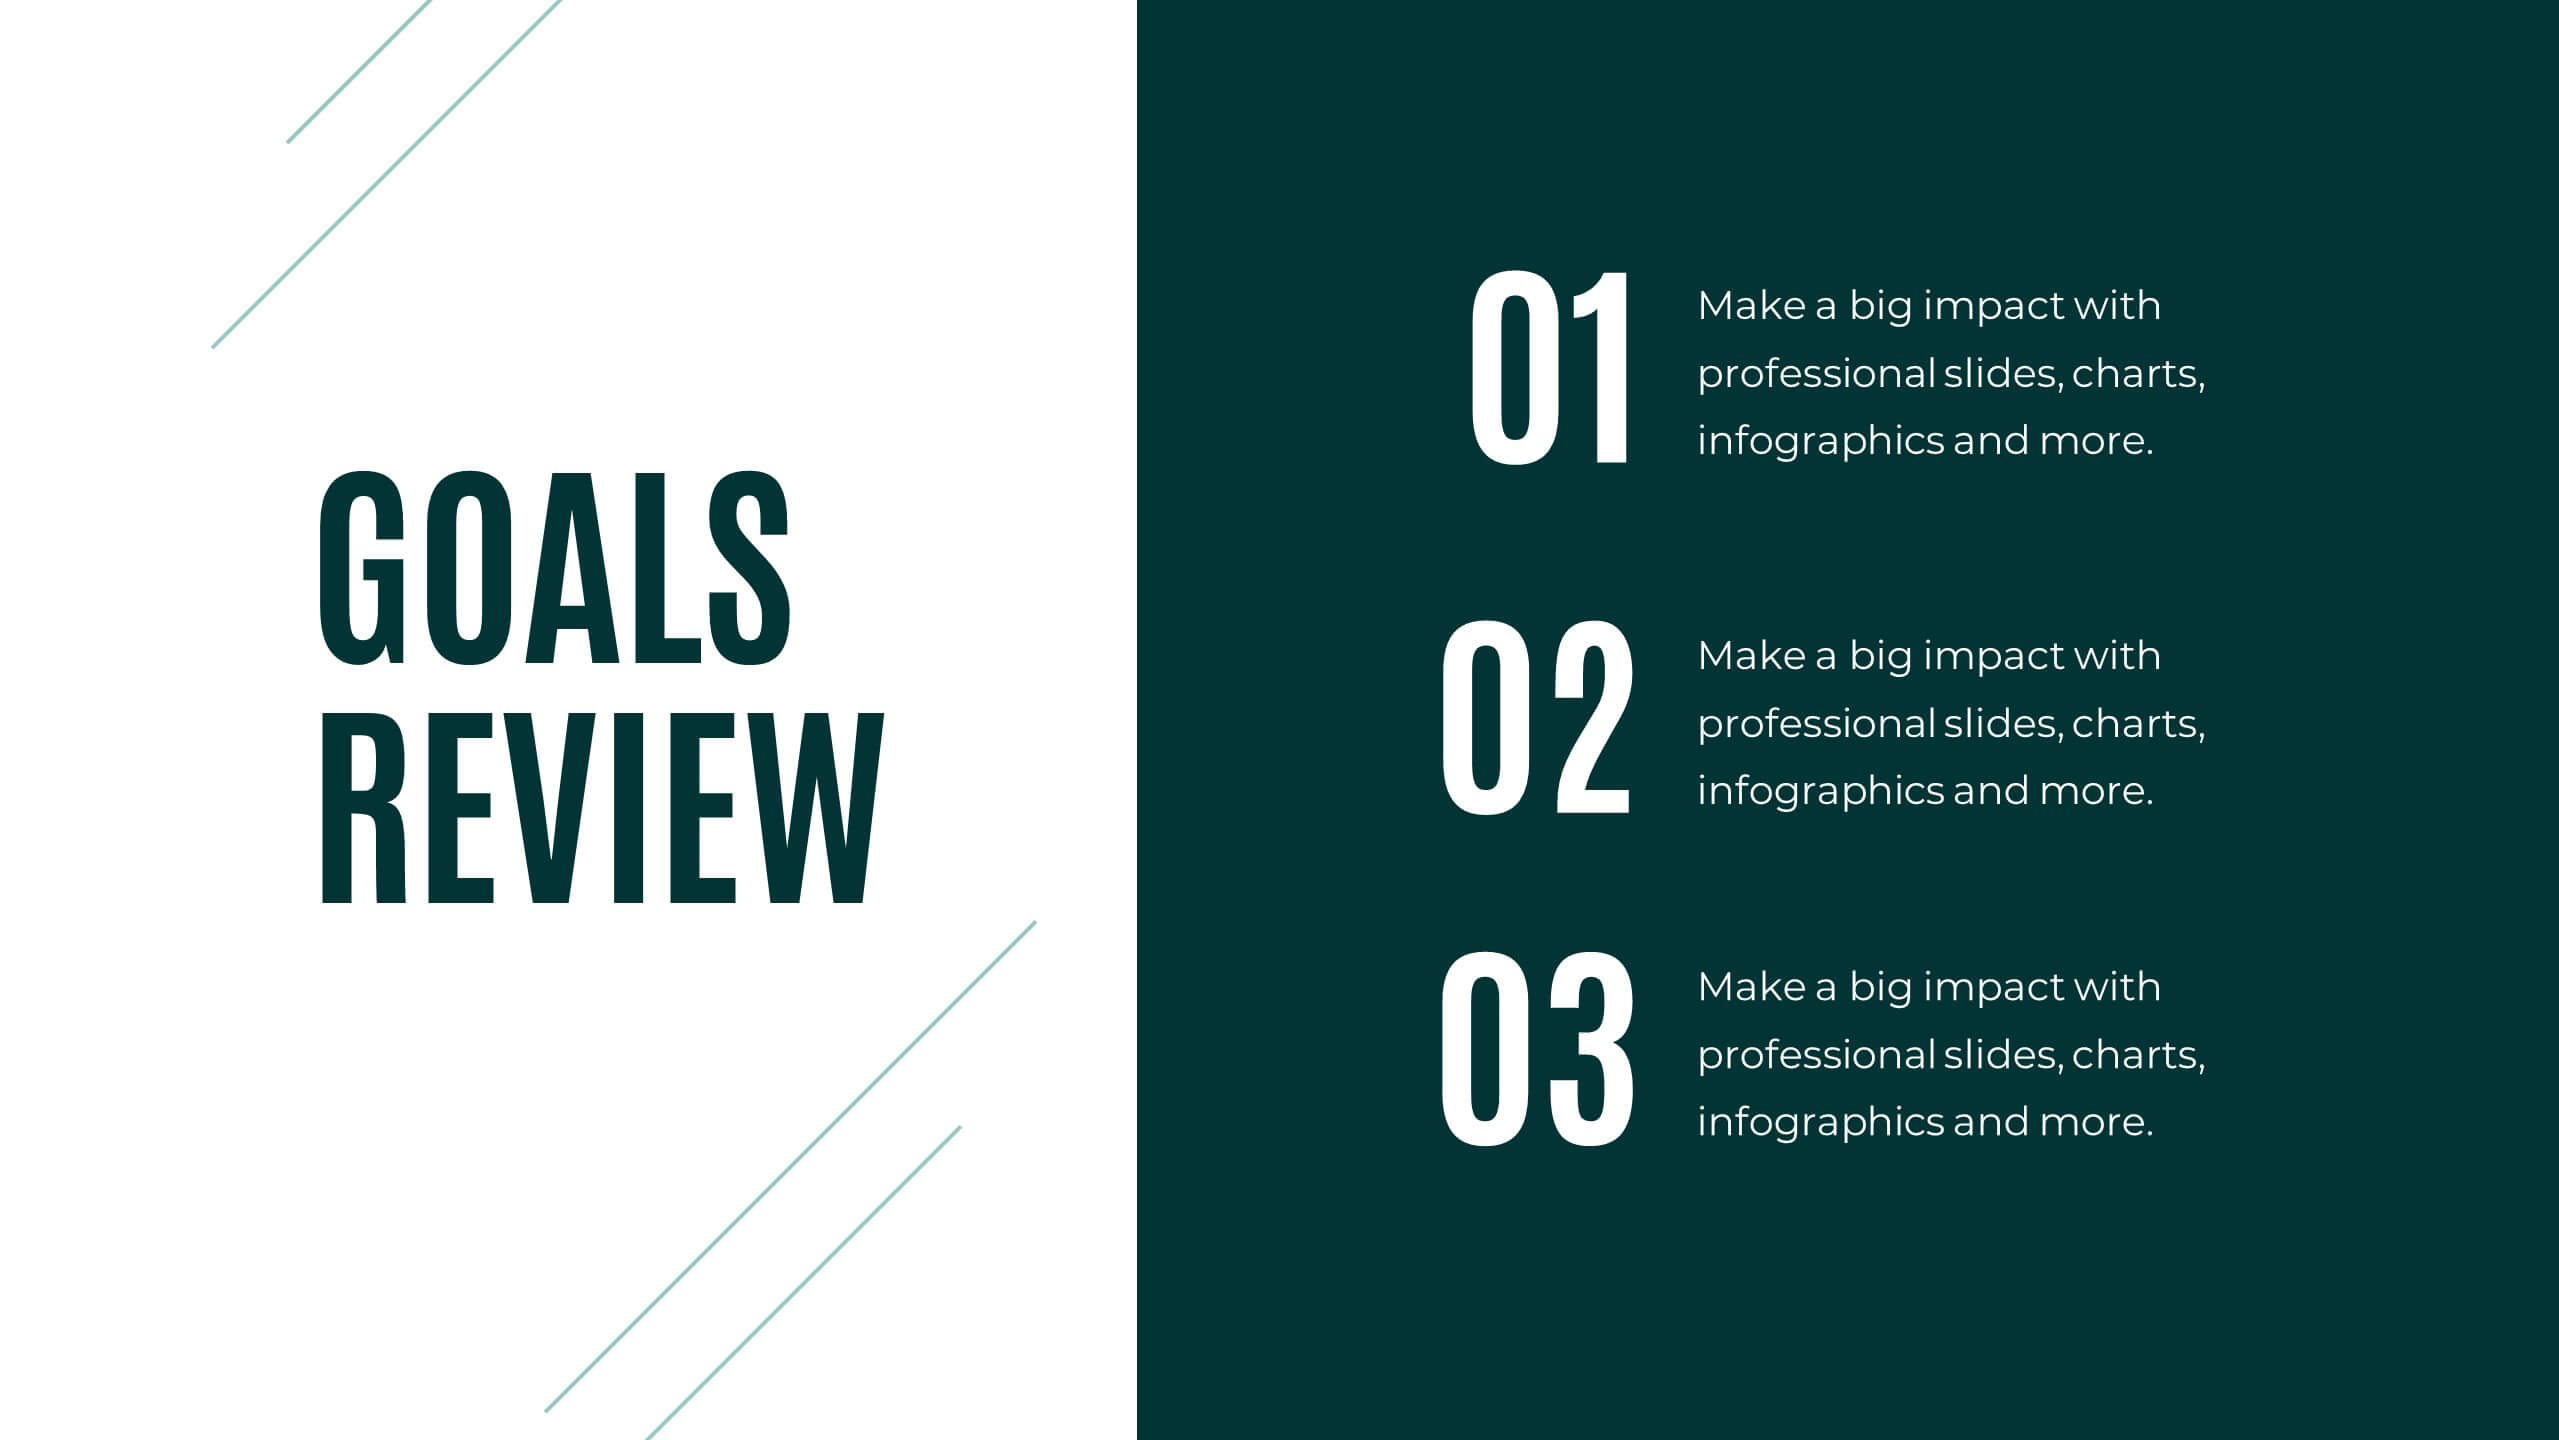
High-Performance Team Collaboration Presentation
Showcase teamwork, trust, and synergy with this bold, interconnected arms graphic. Ideal for illustrating roles, partnerships, or team frameworks, this infographic is perfect for leadership, HR, or corporate strategy slides. Fully customizable in PowerPoint, Keynote, and Google Slides.


5 diapositivas
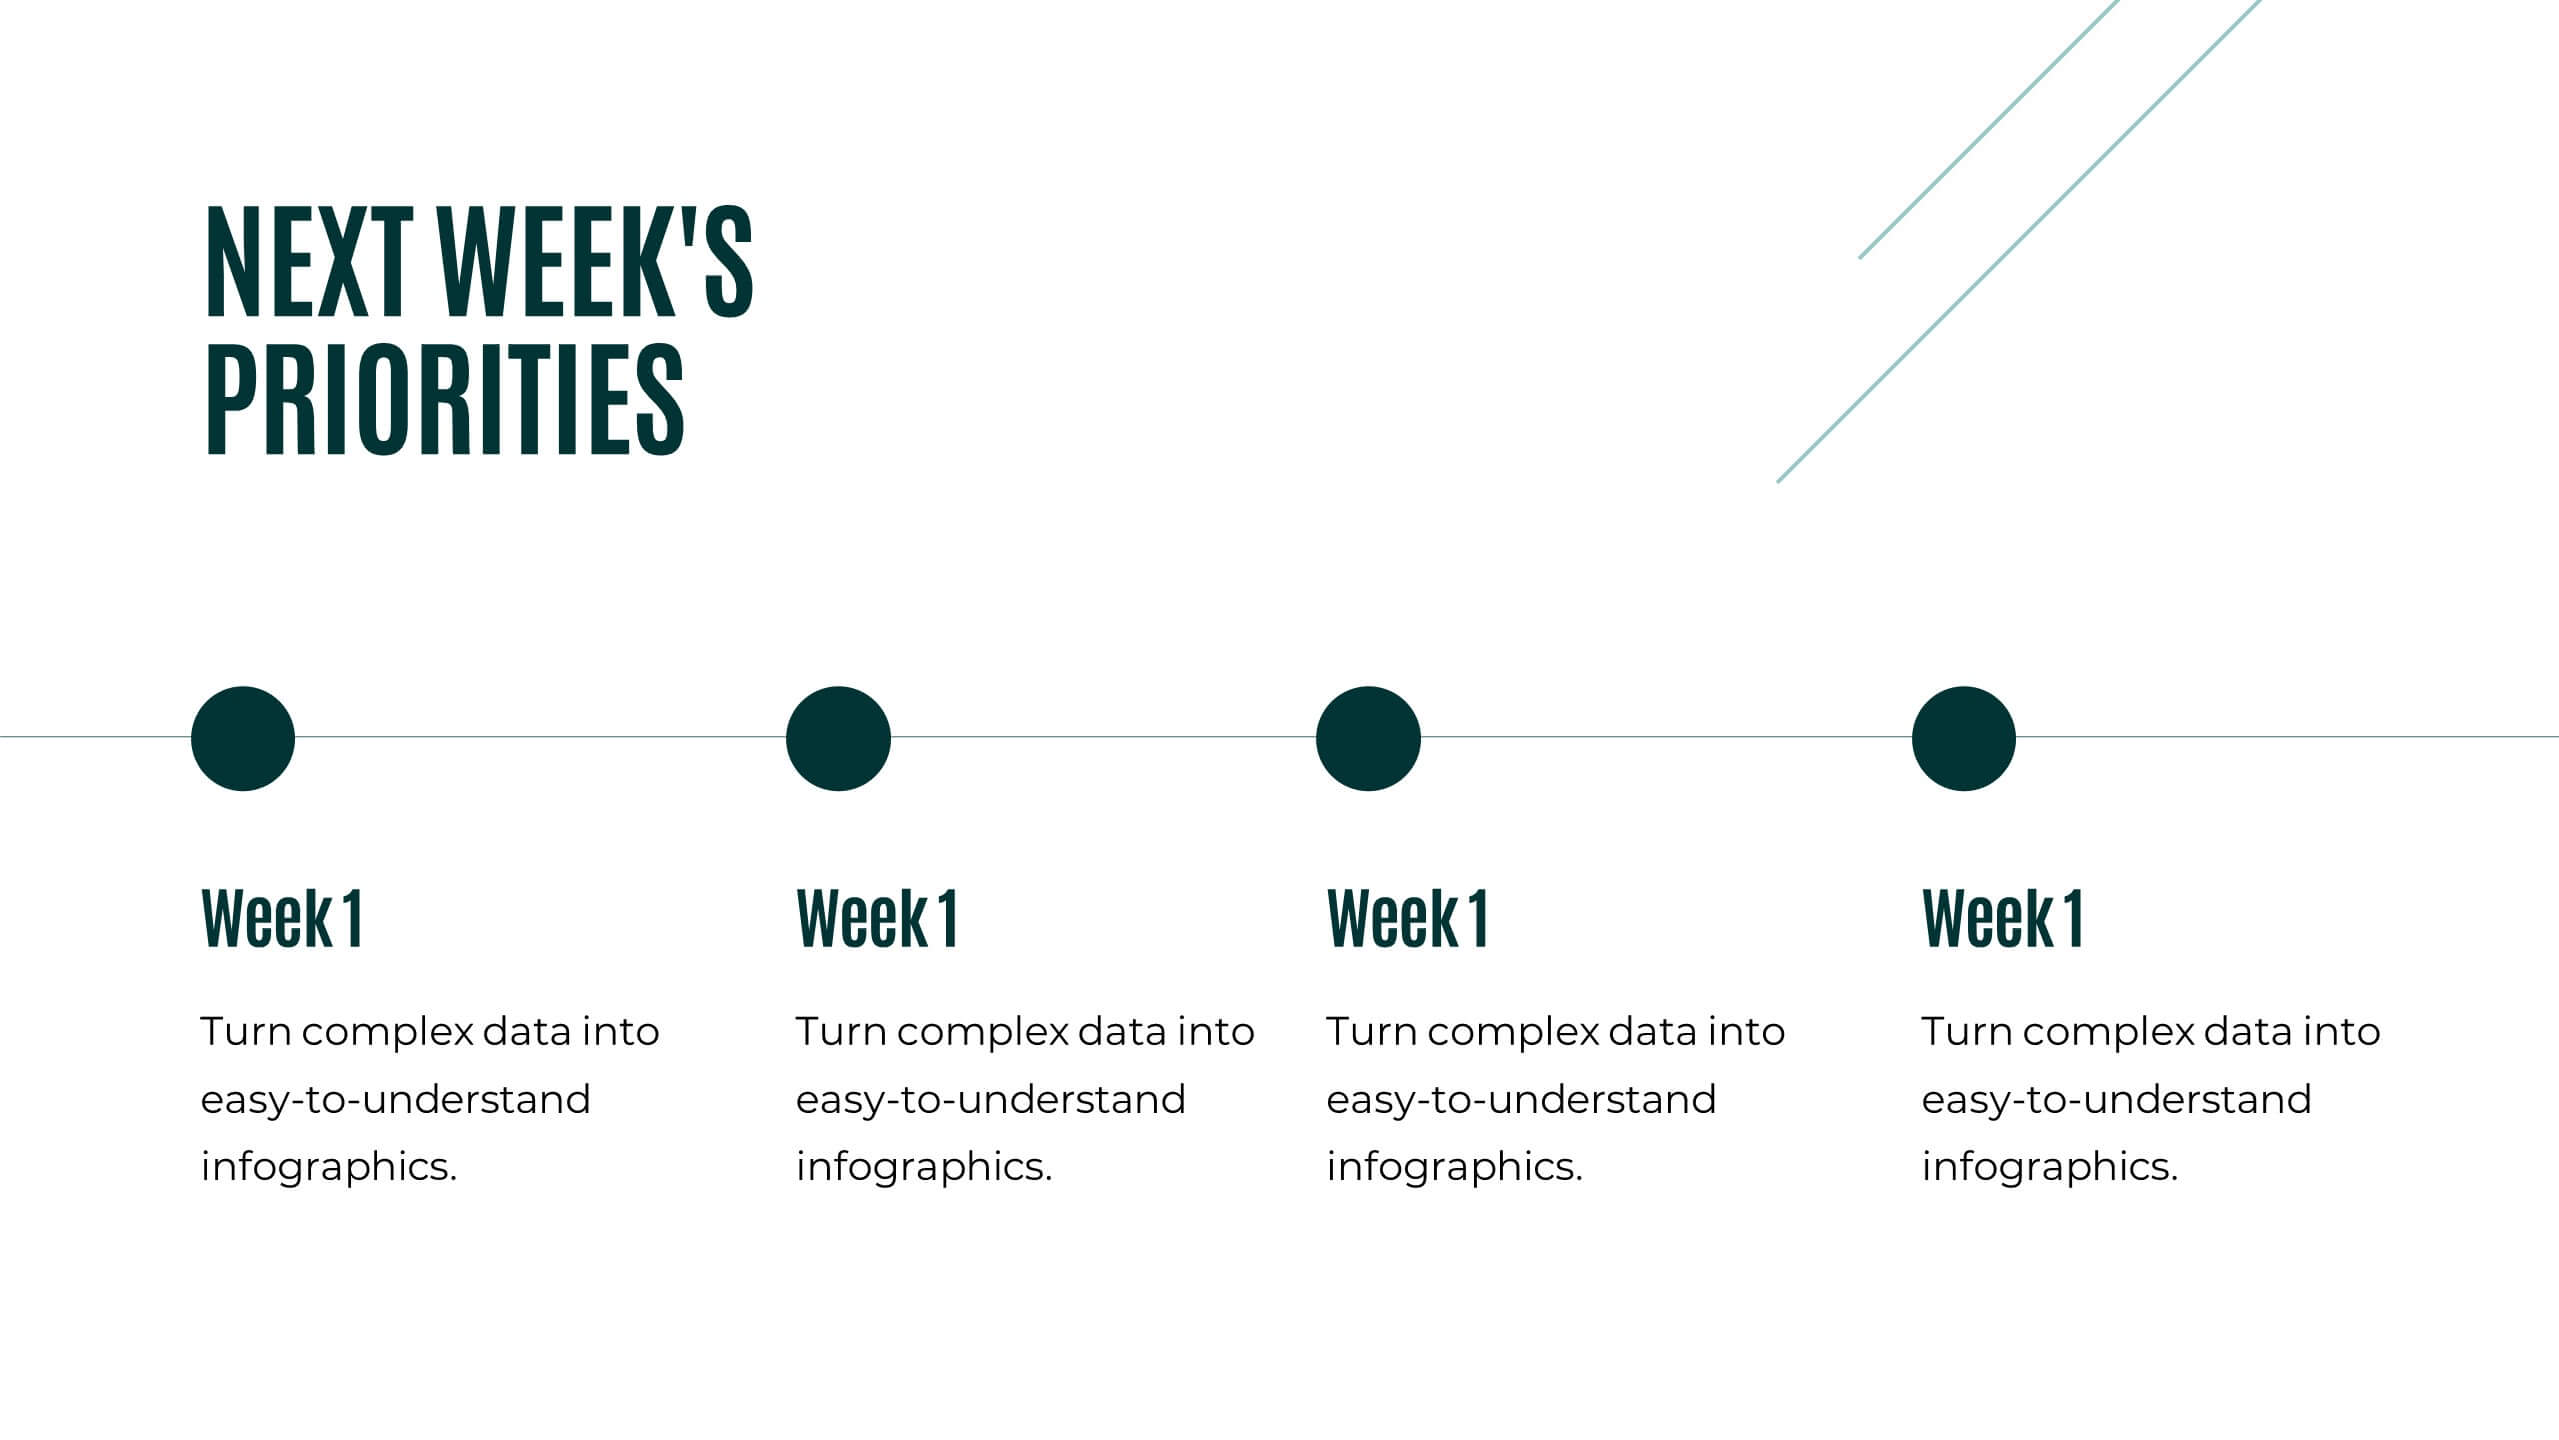
Executive Leadership Development Plan
Showcase leadership growth with the Executive Leadership Development Plan Presentation. Designed to visualize a clear progression of skills or initiatives, this four-stage layout uses diagonal segments and icons to represent each development milestone. Ideal for HR, executive coaching, or talent management presentations. Compatible with PowerPoint, Keynote, and Google Slides.


2 diapositivas
Creative Gratitude Slide
Wrap up your presentation with impact using this clean, modern “Thank You” slide. Featuring space for a photo, contact details, and playful design elements, it's perfect for leaving a lasting impression. Ideal for business proposals, pitch decks, and educational slide decks. Fully editable in PowerPoint, Keynote, and Google Slides.


4 diapositivas
4-Level Funnel Analysis Diagram Presentation
Give your insights a clear path to follow with this clean, modern diagram built to simplify layered decision-making. This presentation breaks complex stages into four easy-to-read levels, helping you explain flow, priorities, and performance with confidence. Fully compatible with PowerPoint, Keynote, and Google Slides.


21 diapositivas
Thunderbird Small Business Pitch Deck Presentation
Take flight with this dynamic Thunderbird-inspired presentation, perfect for pitching your small business! Designed to highlight your business model, market potential, and financial projections, this template ensures your pitch is clear, compelling, and professional. Its bold visuals will help you soar. Compatible with PowerPoint, Keynote, and Google Slides.


8 diapositivas
Corporate Mission Purpose Slide
Wave your flag of purpose with this bold, banner-inspired layout—ideal for communicating your corporate mission, core principles, and company values. Each section gives space to articulate what drives your business forward in a visually unified way. Fully compatible with PowerPoint, Keynote, and Google Slides.


5 diapositivas
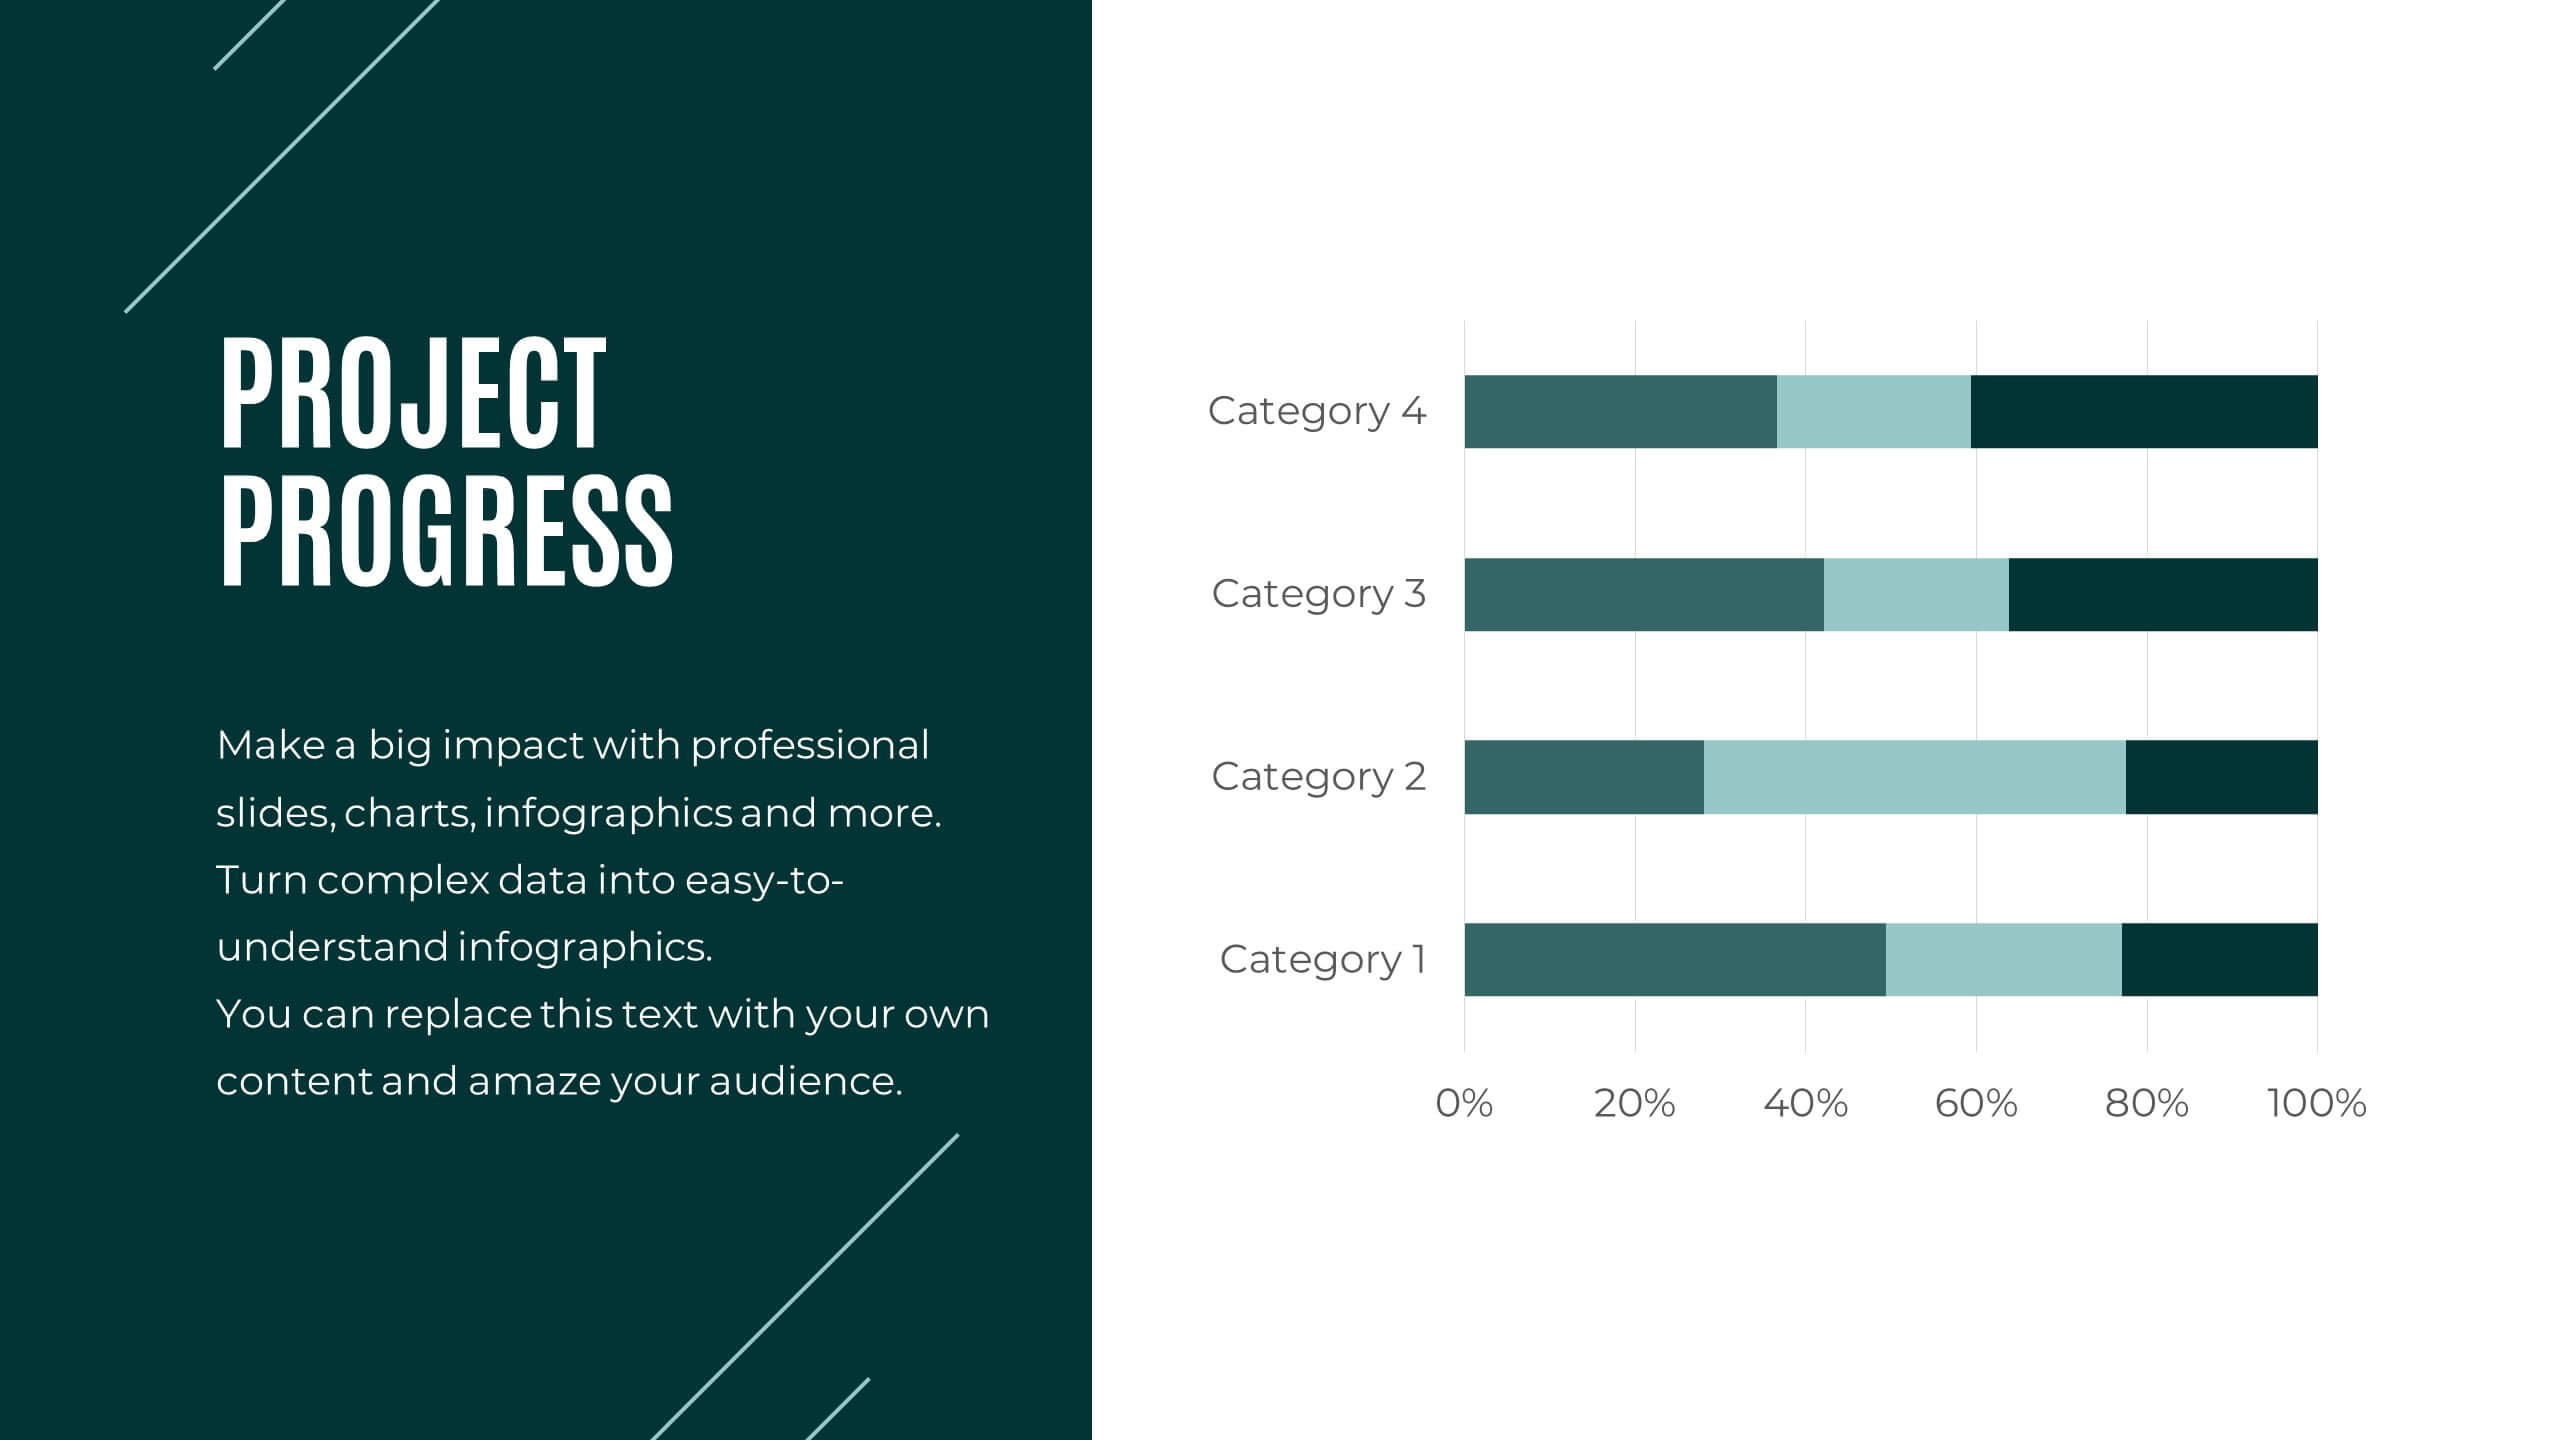
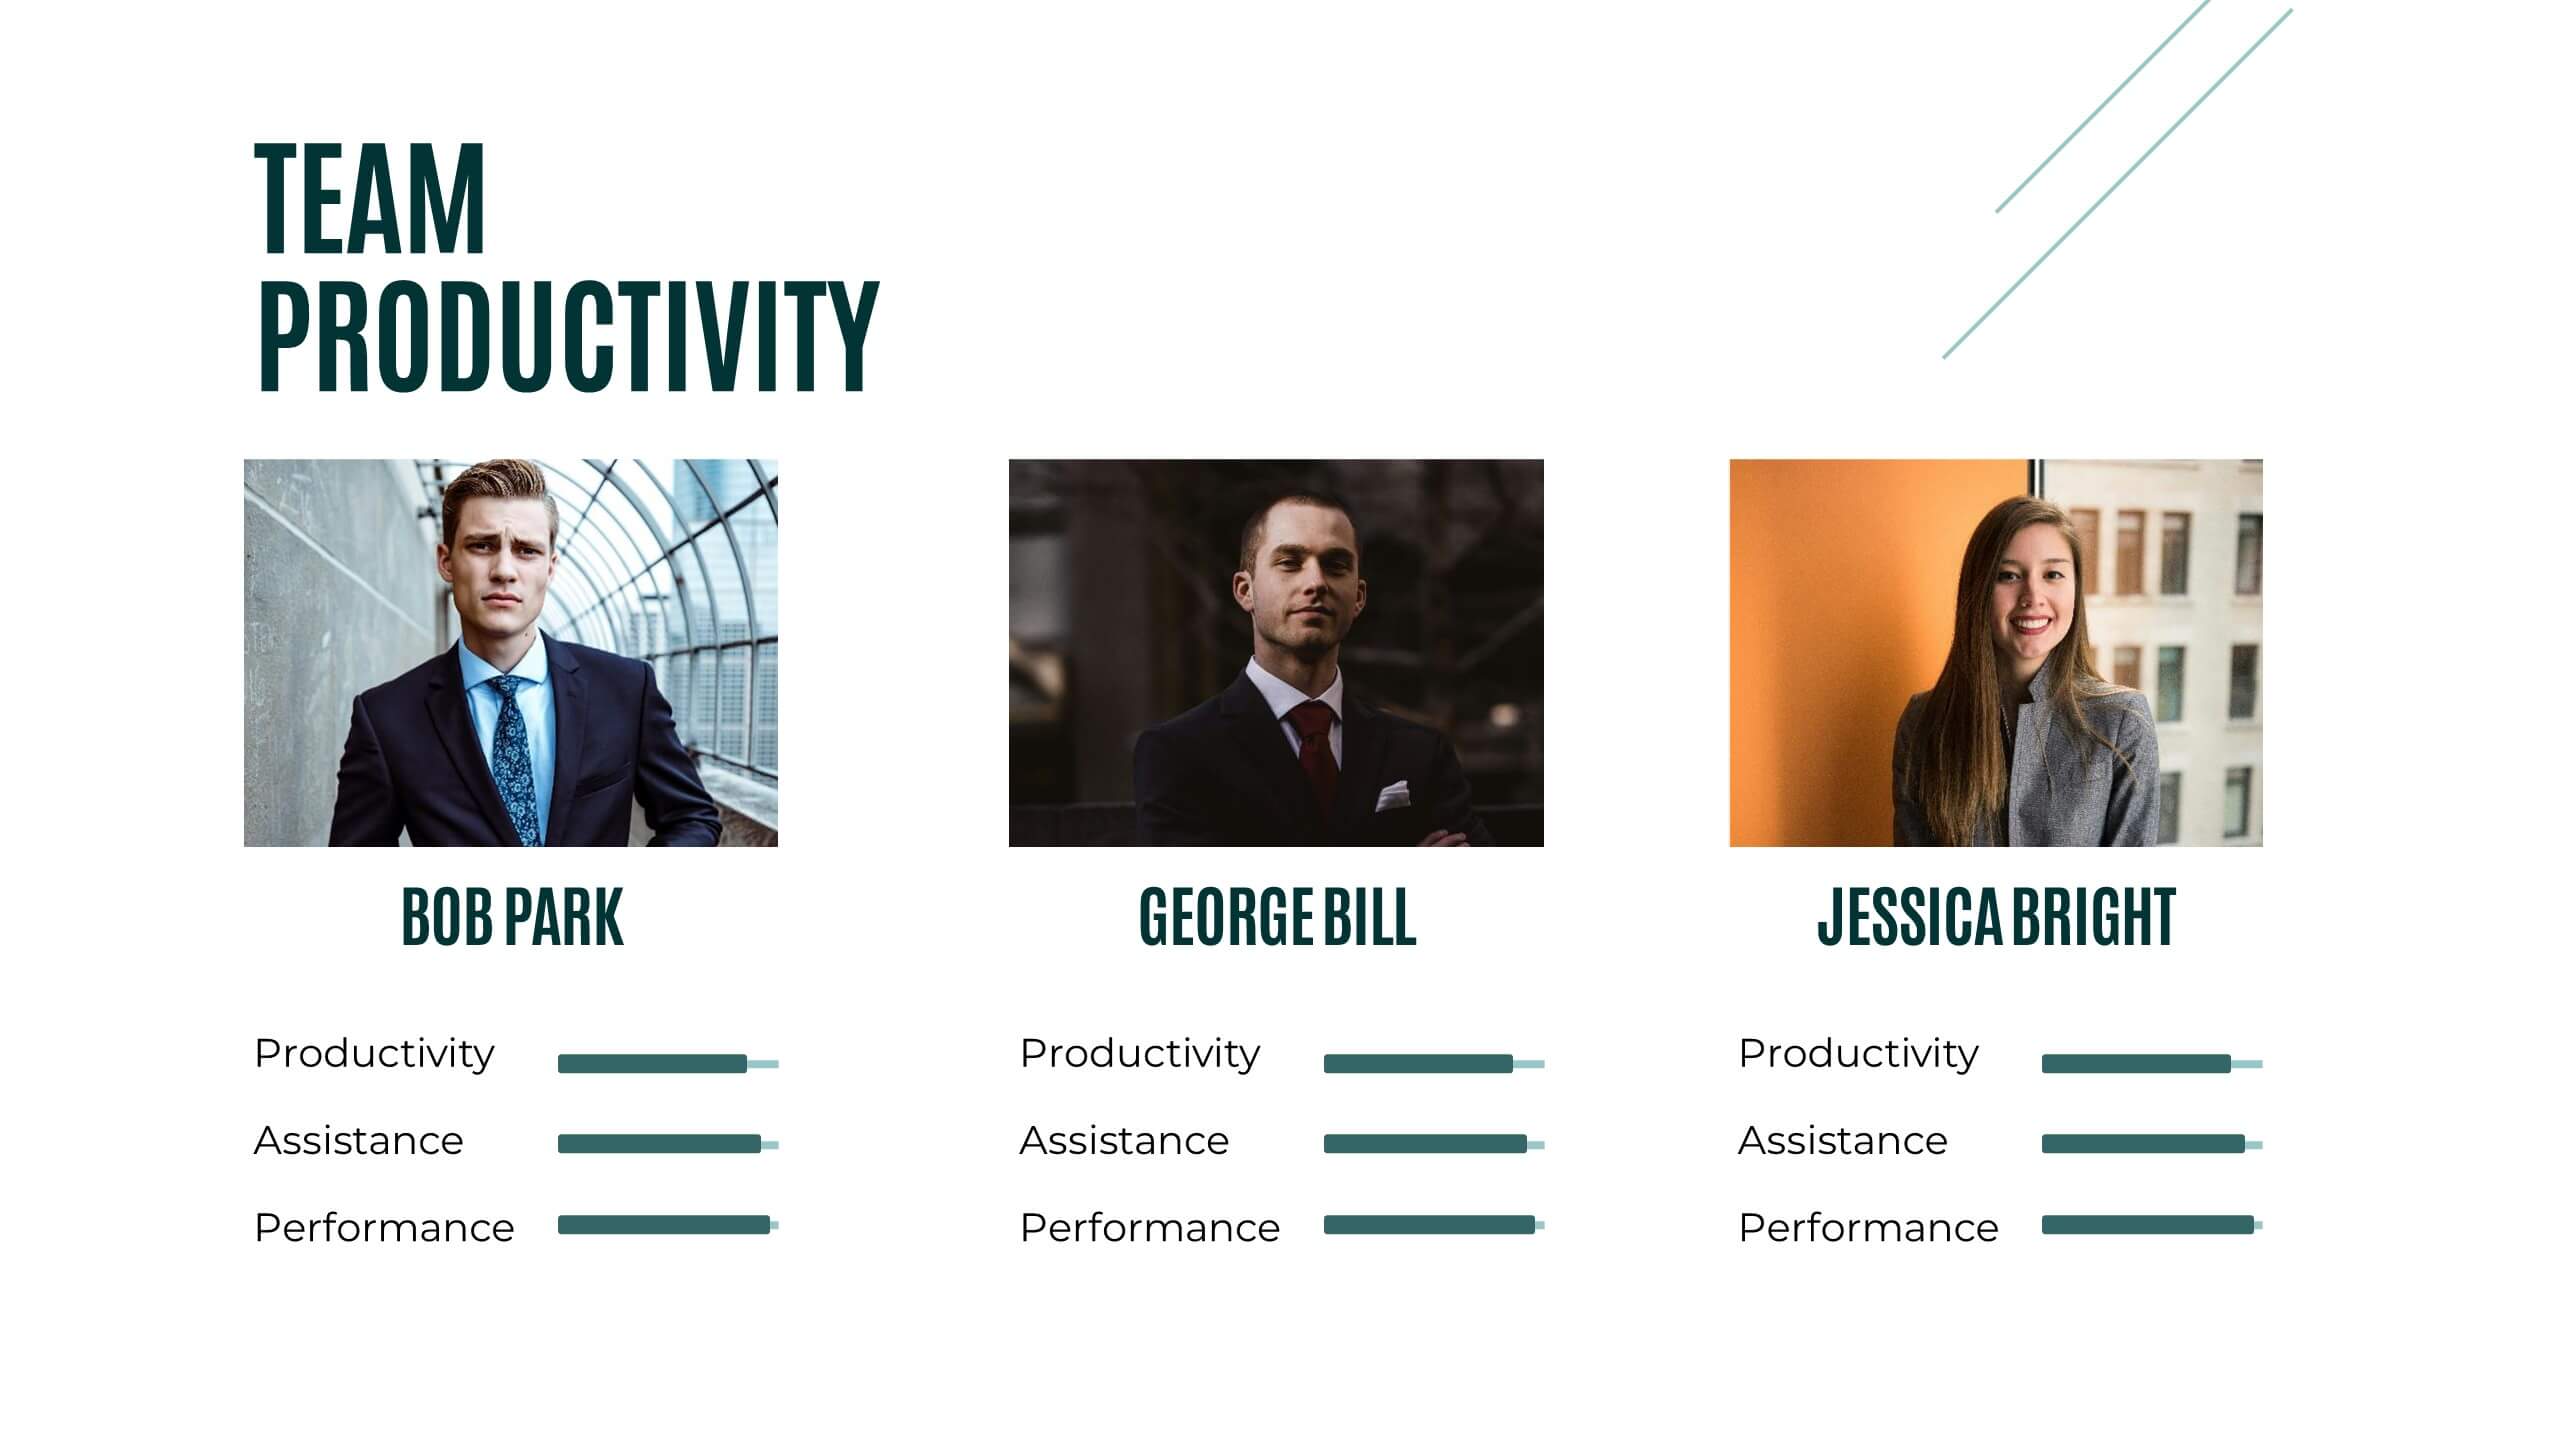
Project Status Update and Timeline Presentation
Keep your team aligned with this clean, easy-to-read status update template. Featuring progress bars, monthly Gantt chart visuals, and icons for each task, it’s perfect for tracking milestones, team updates, and project phases. Fully editable in PowerPoint, Keynote, and Google Slides.


8 diapositivas
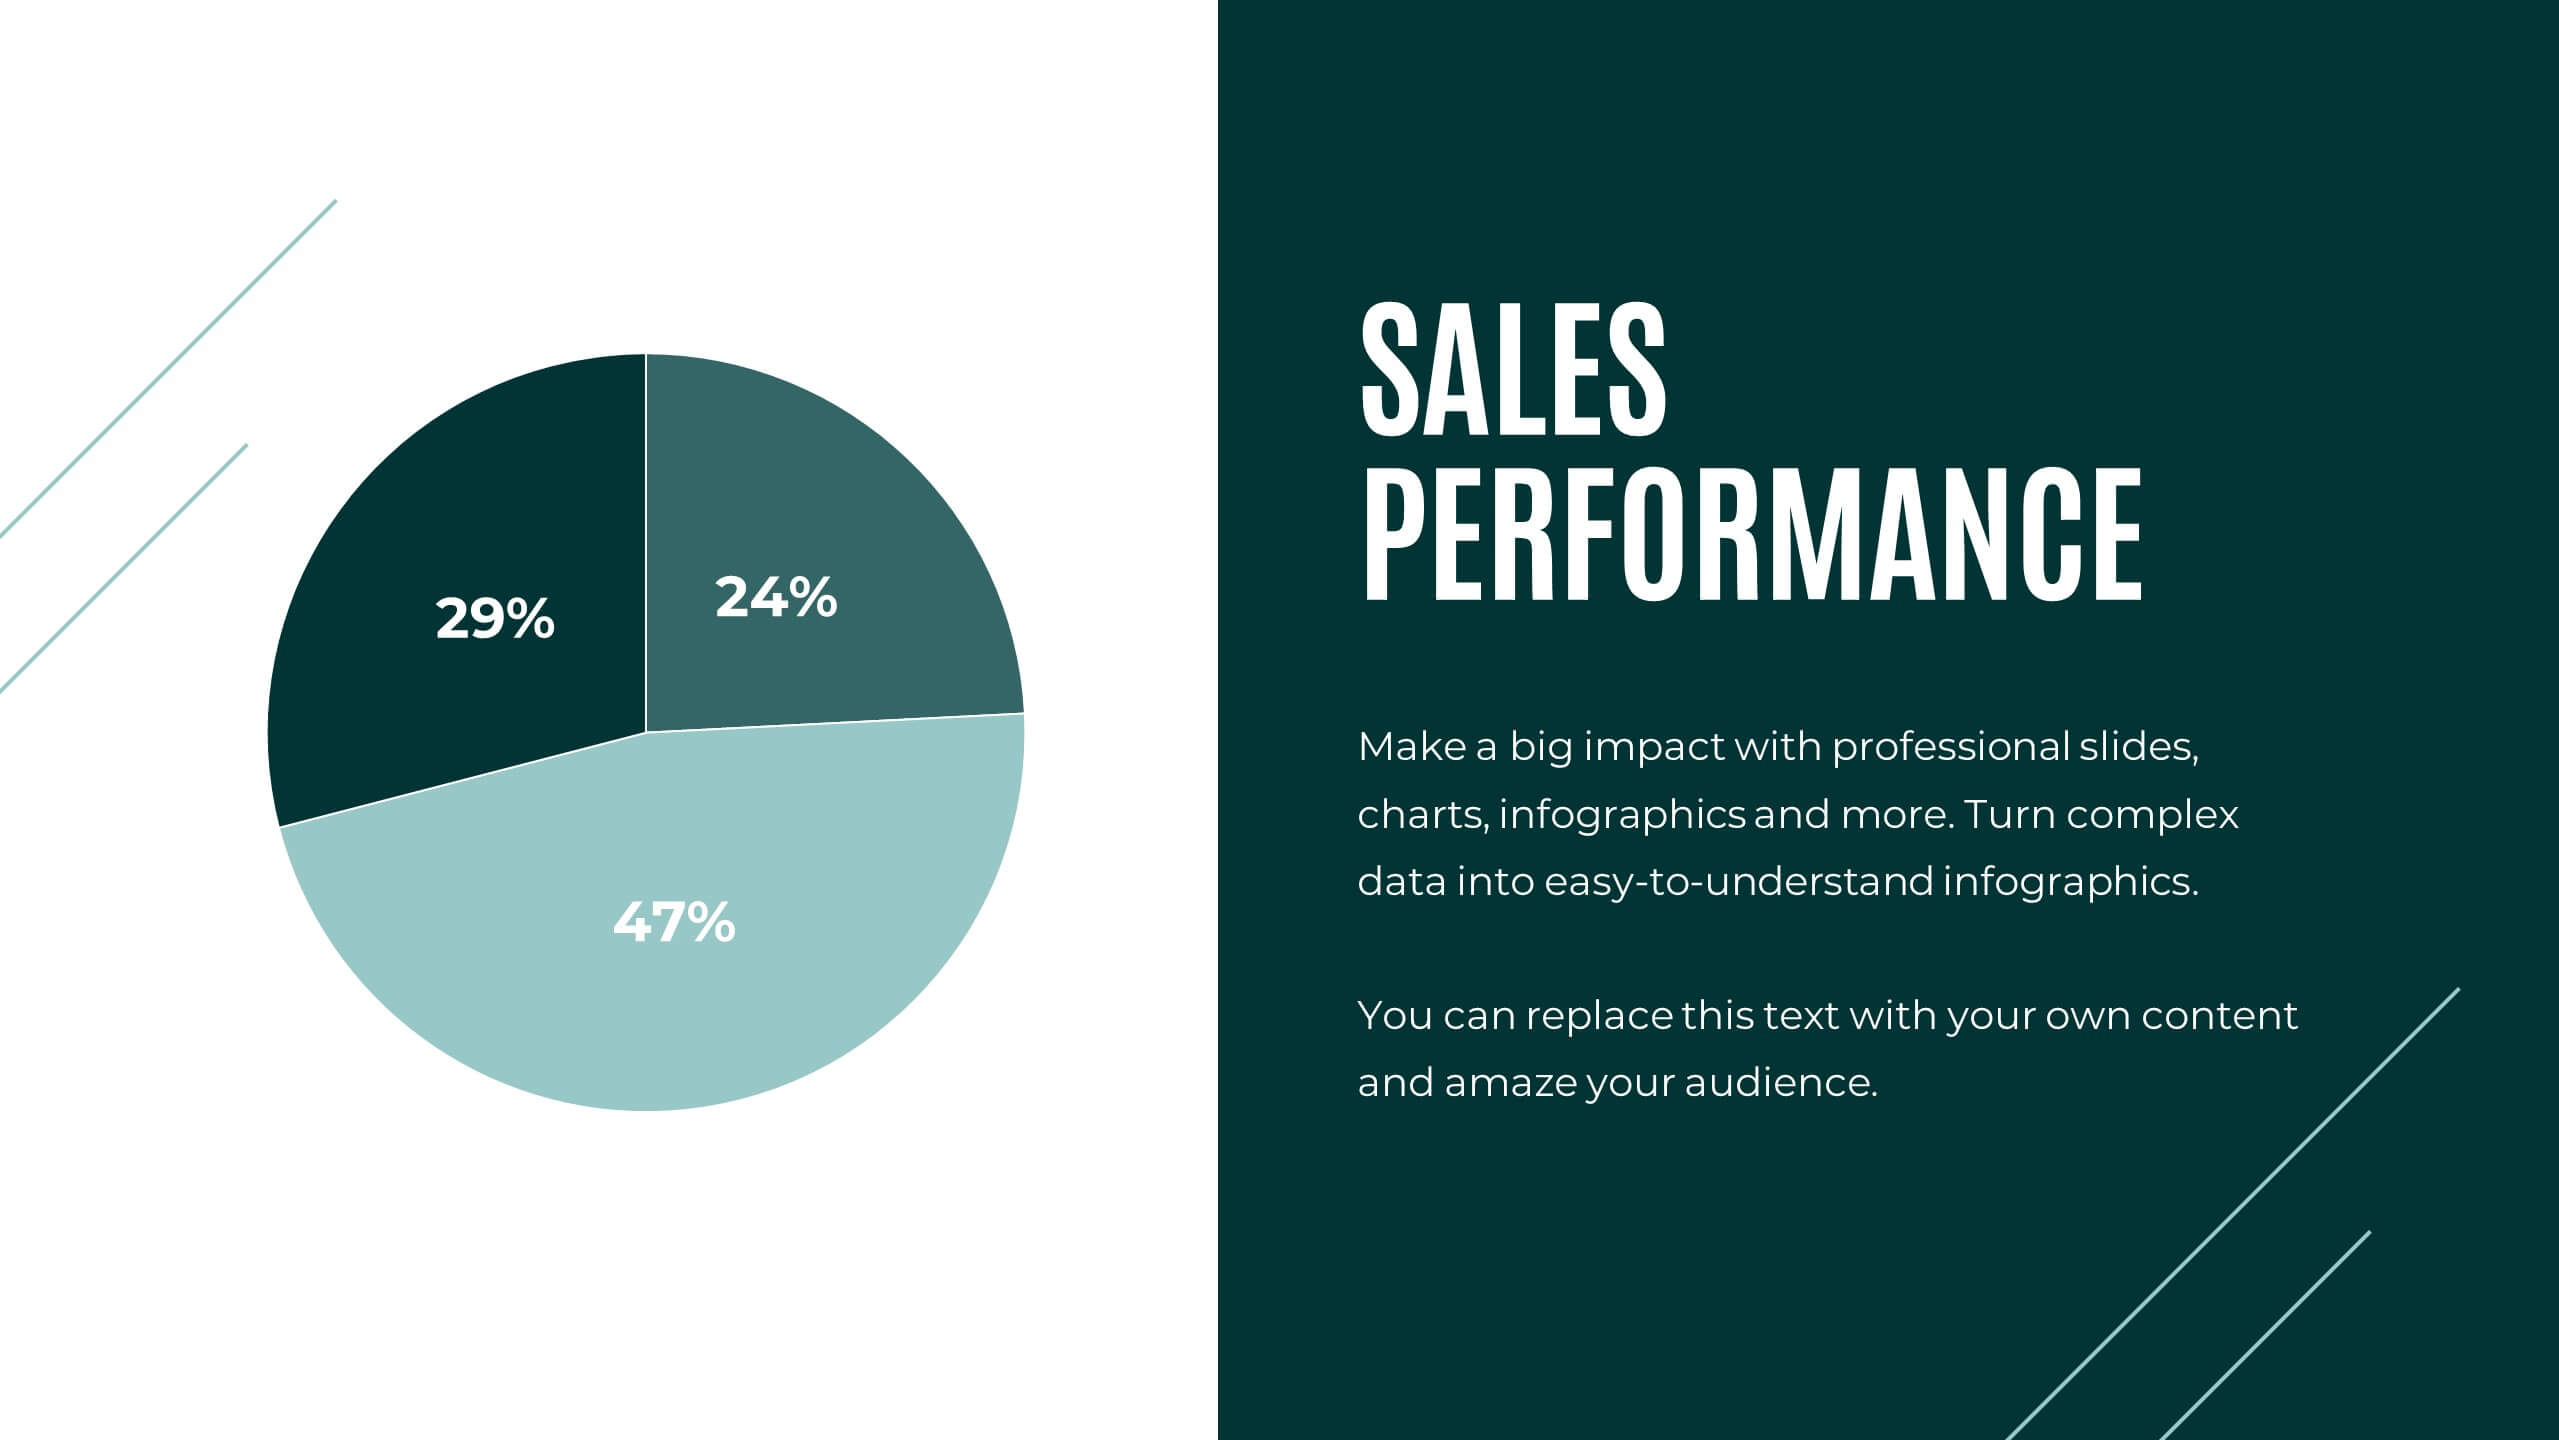
Survey Poll Results Visualization Presentation
Easily showcase your survey or poll data with this bold and modern results visualization slide. Designed with eye-catching circular charts, it helps your audience quickly grasp key insights at a glance. Perfect for business reviews, feedback summaries, or internal reports. Compatible with PowerPoint, Keynote, and Google Slides.


4 diapositivas
Business Role Structure Diagram Presentation
Bring your team structure to life with a clear, engaging visual that makes every role instantly understandable. This presentation helps you map relationships, outline responsibilities, and communicate workflow with ease. Designed for simple customization and professional clarity, it supports PowerPoint, Keynote, and Google Slides for seamless editing across platforms.


22 diapositivas
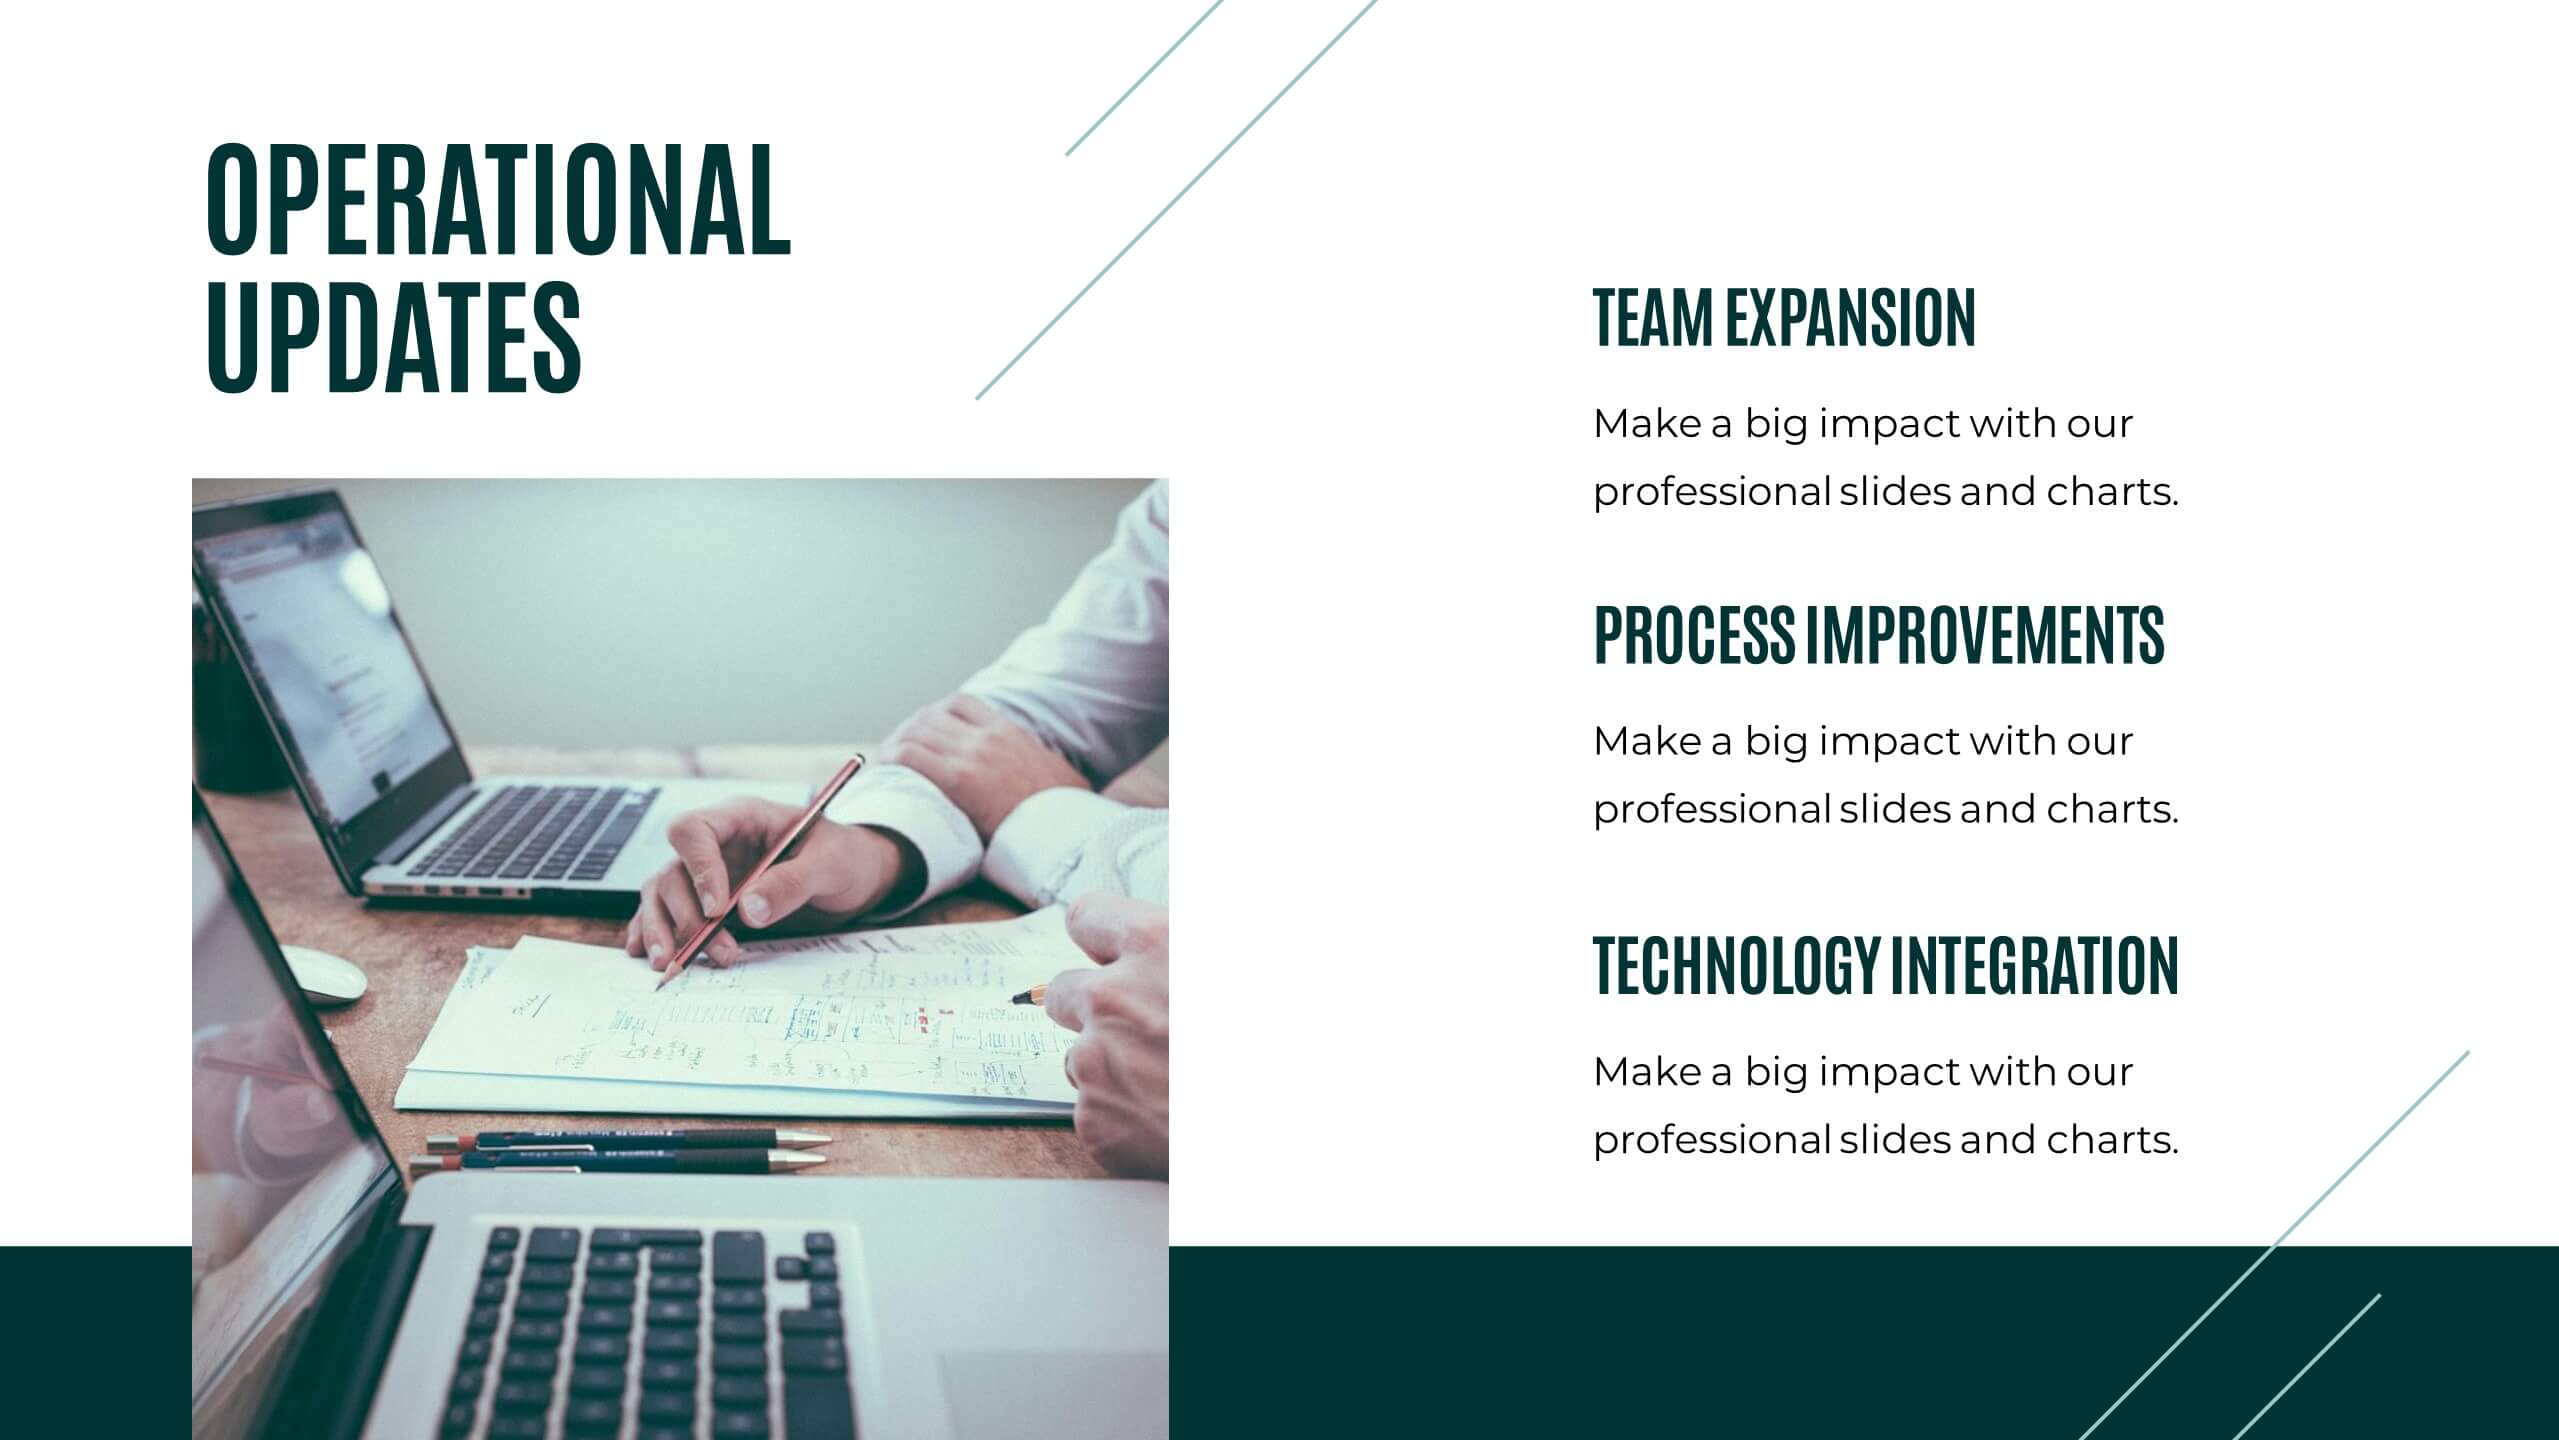
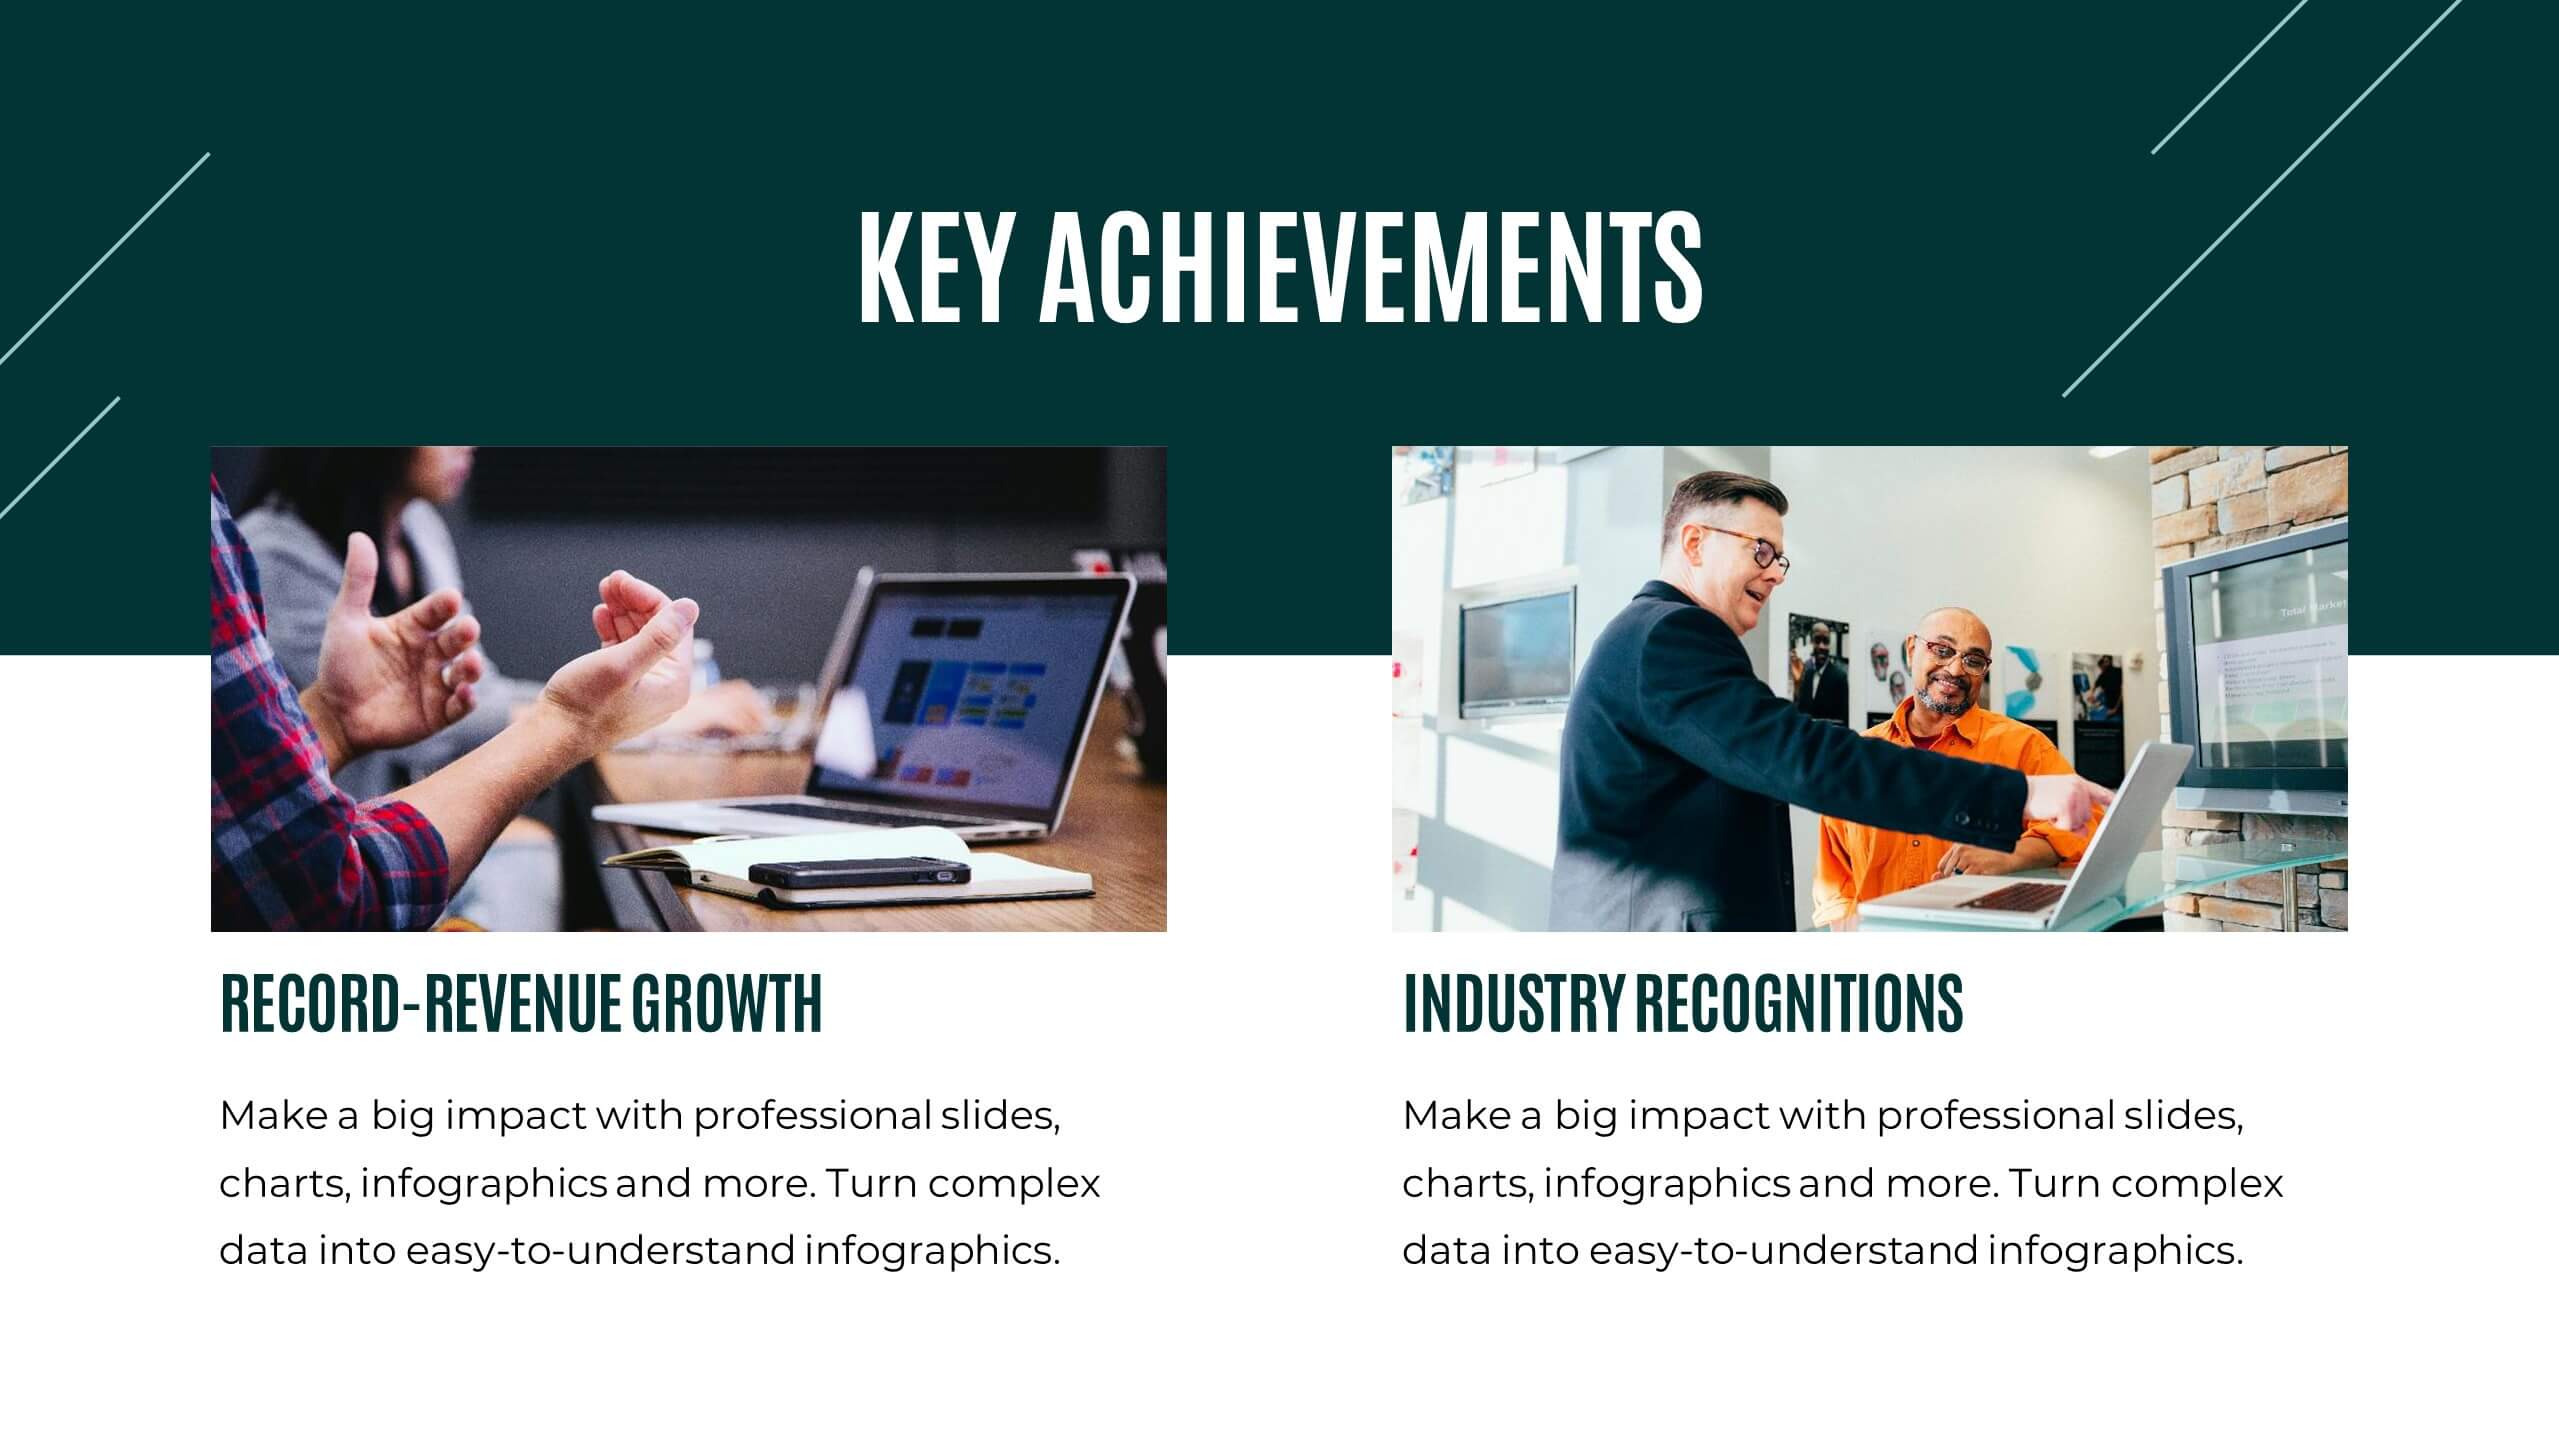
Prism Project Status Report Presentation
Deliver impactful updates with this comprehensive project status report template! Perfect for presenting key highlights, performance metrics, and strategic initiatives. Ideal for project managers aiming to keep stakeholders informed and aligned. Compatible with PowerPoint, Keynote, and Google Slides, this template ensures your reports are clear, professional, and engaging. Keep projects on track!


5 diapositivas
Relationship Mapping Diagram Presentation
Bring clarity to complex connections with this clean and modern visual layout designed to map relationships, processes, or ideas effortlessly. Perfect for presentations that require structure and flow, it balances simplicity with professionalism. Fully customizable and compatible with PowerPoint, Keynote, and Google Slides for seamless design flexibility.


5 diapositivas
Scrum Sprint Planning Presentation
Streamline your workflow presentations with this vibrant and intuitive Scrum Sprint Planning slide. Featuring a circular sprint cycle and directional flow, it clearly outlines the iterative process from planning to delivery. Perfect for agile teams presenting timelines, team roles, or workflow overviews. Easily customizable and compatible with PowerPoint, Keynote, and Google Slides.


5 diapositivas
Technological Advances in Manufacturing Infographics
Manufacturing refers to the process of converting raw materials or components into finished products on a large scale. These infographic templates provide an overview of how technology has transformed the manufacturing industry. This allows you to showcase the significant advancements and their impact on various aspects of manufacturing processes. This template serves as a valuable resource for professionals, educators, students and anyone interested in understanding the evolving landscape of manufacturing technology. Completely customizable and compatible with Powerpoint, Keynote, and Google Slides.


26 diapositivas
Maki Presentation Template
Japanese cuisine is known all around the world, there is so much to try including all the different types of sushi. Maki is a 26 slide template made to help you market your services and products. The clean, simplistic design makes it easy for you to display your content in any modernized way. Maki is designed to showcase your packages, pricing and more. Help your customers feel comfortable purchasing your service or product using this template. Present your message clearly and effectively with this presentation. You can customize the design, photos, background and fonts to make it your own.


6 diapositivas
Personal Budget Infographic
Budget forecasting is the process of estimating future income and expenses to create a financial plan for an individual, business, or organization. This infographic template is a visual representation of an individual's budget, showcasing their income, expenses, and savings in a clear and easy-to-understand format. This infographic is designed to help individuals manage their finances effectively, make informed financial decisions, and achieve their financial goals. This infographic presents complex financial information in a simplified and accessible manner to help individuals build a solid financial foundation for their future.


5 diapositivas
Benefits of Insurance Infographics
The purpose of insurance is to mitigate the financial impact of unexpected events or circumstances that may result in financial loss. These infographic templates are versatile and effective tools to convey the value of insurance to your audience. These are perfect to highlight the various advantages and importance of having insurance coverage. This serves as an engaging tool to educate and inform your audience about the benefits of different types of insurance policies. This makes it easy for viewers to understand the benefits and importance of insurance in various aspects of life. Compatible with Powerpoint, Keynote, and Google Slides.


4 diapositivas
Nutrition and Diet Plan Presentation
Present your wellness programs with clarity using this circular nutrition infographic. Ideal for showcasing food groups, dietary recommendations, or balanced meal plans, this layout uses segmented visuals and icons for better understanding. Perfect for nutritionists, wellness coaches, or healthcare professionals. Compatible with PowerPoint, Keynote, and Google Slides.