


Características


¿Tienes alguna pregunta?
Recomendar


8 diapositivas
Business Competitive Analysis
Break down your market strategy into clear, actionable steps with this streamlined analysis slide. Featuring an 8-step horizontal layout with bold icons and color-coded segments, it helps visualize competitive research and planning at a glance. Easily customizable in PowerPoint, Keynote, and Google Slides.


2 diapositivas
Digital Mockup Screens for Apps Presentation
Showcase your app in action with the Digital Mockup Screens for Apps Presentation. This bold and modern slide layout centers your mobile UI on colorful abstract shapes, drawing attention to your product. Ideal for startup demos, app features, or UI/UX portfolios. Fully editable in PowerPoint, Keynote, Canva, and Google Slides.


5 diapositivas
RAPID Decision-Making Framework Presentation
Streamline your choices and boost collaboration with a clear, structured framework that defines every role in the decision-making process. This modern circular layout helps teams visualize responsibilities, actions, and approvals for faster, smarter outcomes. Fully editable and compatible with PowerPoint, Keynote, and Google Slides for effortless customization and presentation.


6 diapositivas
Strategic Task and To-Do List Slide Presentation
Keep your team aligned and on track with the Strategic Task and To-Do List Slide Presentation. This layout is ideal for showcasing action items, project priorities, and status updates using a visual notepad style. Color-coded sections and checkmark indicators make it easy to communicate task progress. Fully customizable in PowerPoint, Keynote, and Google Slides.


22 diapositivas
Wave Startup Strategy Presentation
Pitch your startup strategy with this modern, vibrant template! It covers essentials like mission, vision, product overview, market analysis, and growth plans. Perfect for highlighting your team, financials, and milestones. Seamlessly compatible with PowerPoint, Keynote, and Google Slides for a smooth, professional presentation every time.


7 diapositivas
Target Audience Demographics Slide Presentation
Capture attention with a clean, data-driven layout that makes understanding your audience quick and intuitive. This presentation helps you showcase key demographic insights, highlight behavioral patterns, and communicate strategic findings with clarity. Designed for easy editing and smooth workflow, it’s fully compatible with PowerPoint, Keynote, and Google Slides.


23 diapositivas
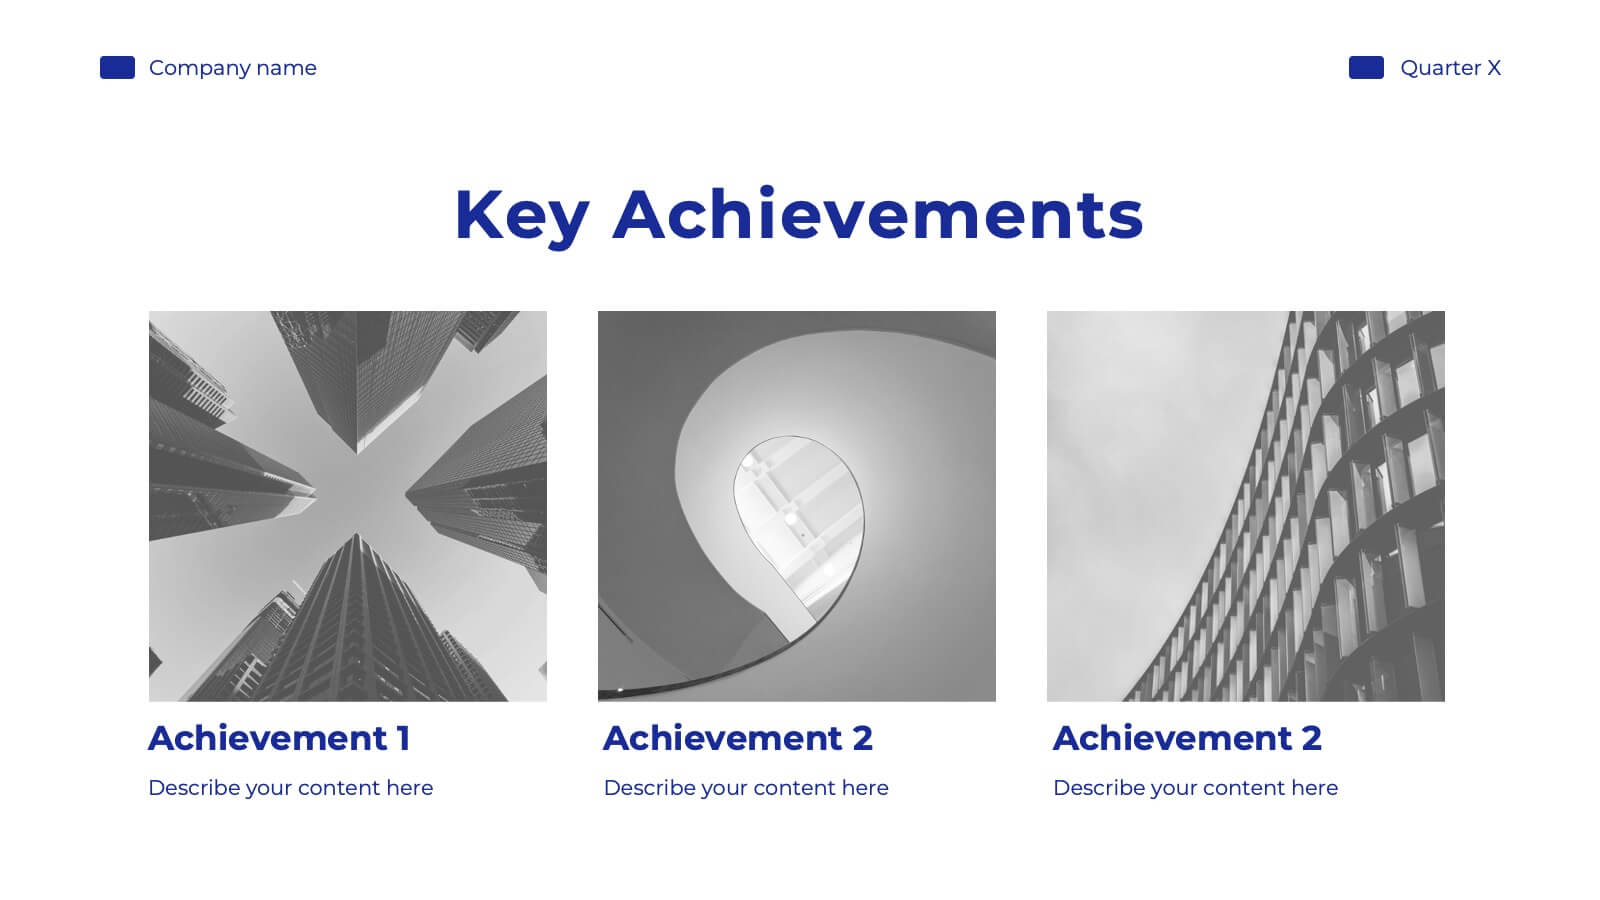
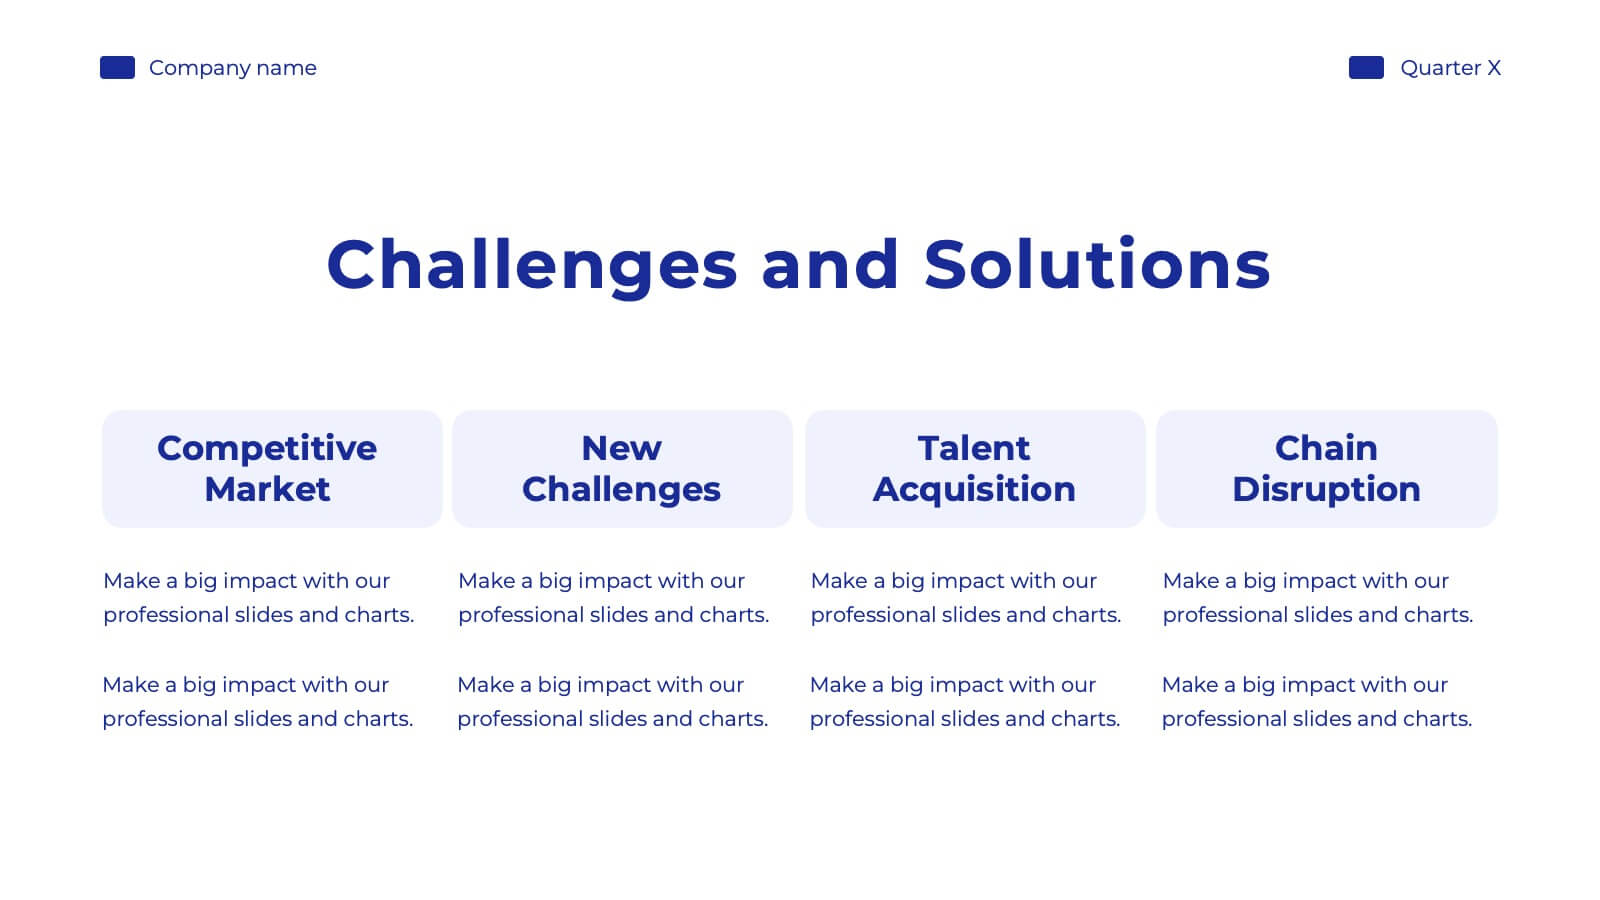
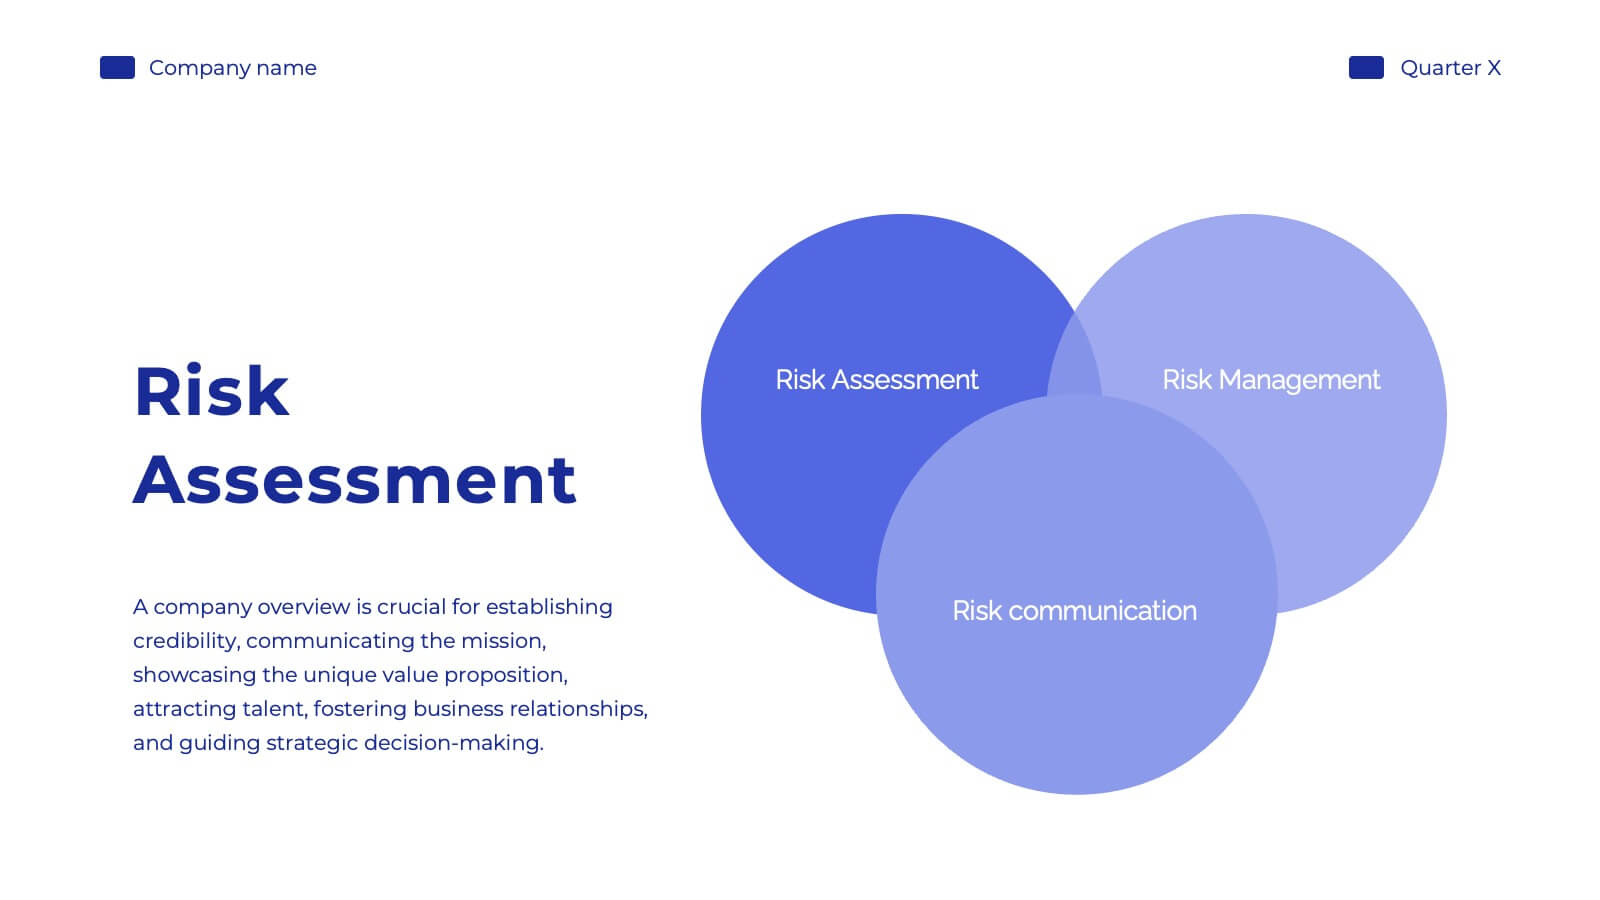
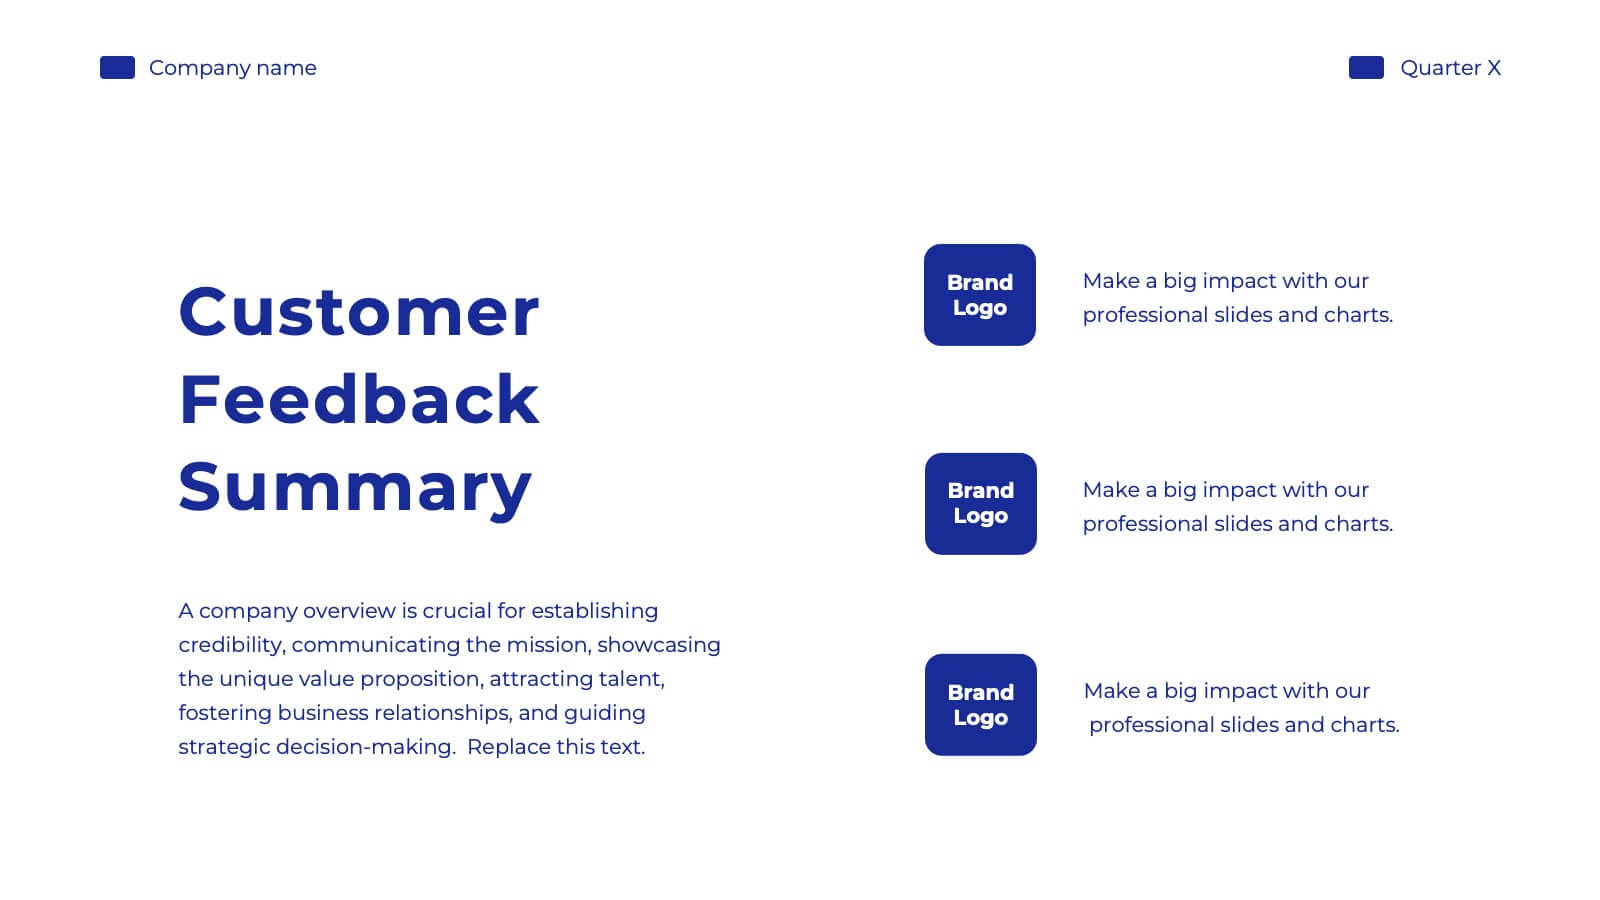
Starbloom Corporate Strategy Report Presentation
This Corporate Strategy Report Presentation Template provides a sleek and professional layout to present business insights, market opportunities, and strategic goals. It covers essential aspects like SWOT analysis, financial performance, risk management, and future outlook, making it perfect for corporate reports and investor briefings. Fully editable in PowerPoint, Keynote, and Google Slides.


5 diapositivas
Cloud Computing for Business Presentation
Present your cloud strategy with clarity using this modern five-point diagram. Each cloud icon is linked to a central device, symbolizing data flow, security, storage, and infrastructure services. Ideal for IT presentations, cloud migration plans, or SaaS workflows. Fully editable in PowerPoint, Keynote, and Google Slides.


5 diapositivas
Financial Budget Infographics
Financial goals refer to specific objectives and targets that individuals or businesses set to manage their finances effectively and achieve financial success. These vertical infographics are designed to help individuals and businesses effectively present their financial budgets and plans. Whether you're a financial analyst or a business owner, this template is perfect for conveying complex financial information in a clear and concise manner. These infographics provide an overview of the budget, showcasing key financial goals, total income, and total expenses. This features visuals to help users set and track financial goals.


5 diapositivas
Problem Statement Slide Presentation
Kick off your presentation with a bold, curiosity-driven slide that clearly defines the challenge your team aims to solve. This layout helps you outline key points, clarify project direction, and focus decision-making with clarity and impact. Fully compatible with PowerPoint, Keynote, and Google Slides.


4 diapositivas
Business Growth through AIDA Model Presentation
Visualize the buyer’s journey with this engaging AIDA model slide. Featuring rounded 3D-style shapes and clear progression from Attention to Action, this layout is ideal for marketing plans, customer engagement strategies, or sales funnels. Each stage is color-coded and icon-enhanced for clarity. Easily customizable in PowerPoint, Keynote, and Google Slides.


7 diapositivas
Executive Summary Format Infographic
Concisely communicate your organization's high-level insights with our Executive Summary Infographic, perfect for business reports and strategic presentations. This infographic is a vital tool for executives, managers, and business analysts to encapsulate key information. Our Executive Summary Infographic offers a visually engaging layout that summarizes complex data into digestible segments. It includes sections for financial highlights, performance metrics, strategic goals, and key achievements. With its customizable features, you can tailor the infographic to represent organizational successes, growth percentages, target completions, and forecasted trends. This SEO-optimized infographic ensures that your executive insights capture the attention of stakeholders and team members alike. Incorporate our infographic into your business documentation to provide a snapshot of your company's performance and strategic direction efficiently.


5 diapositivas
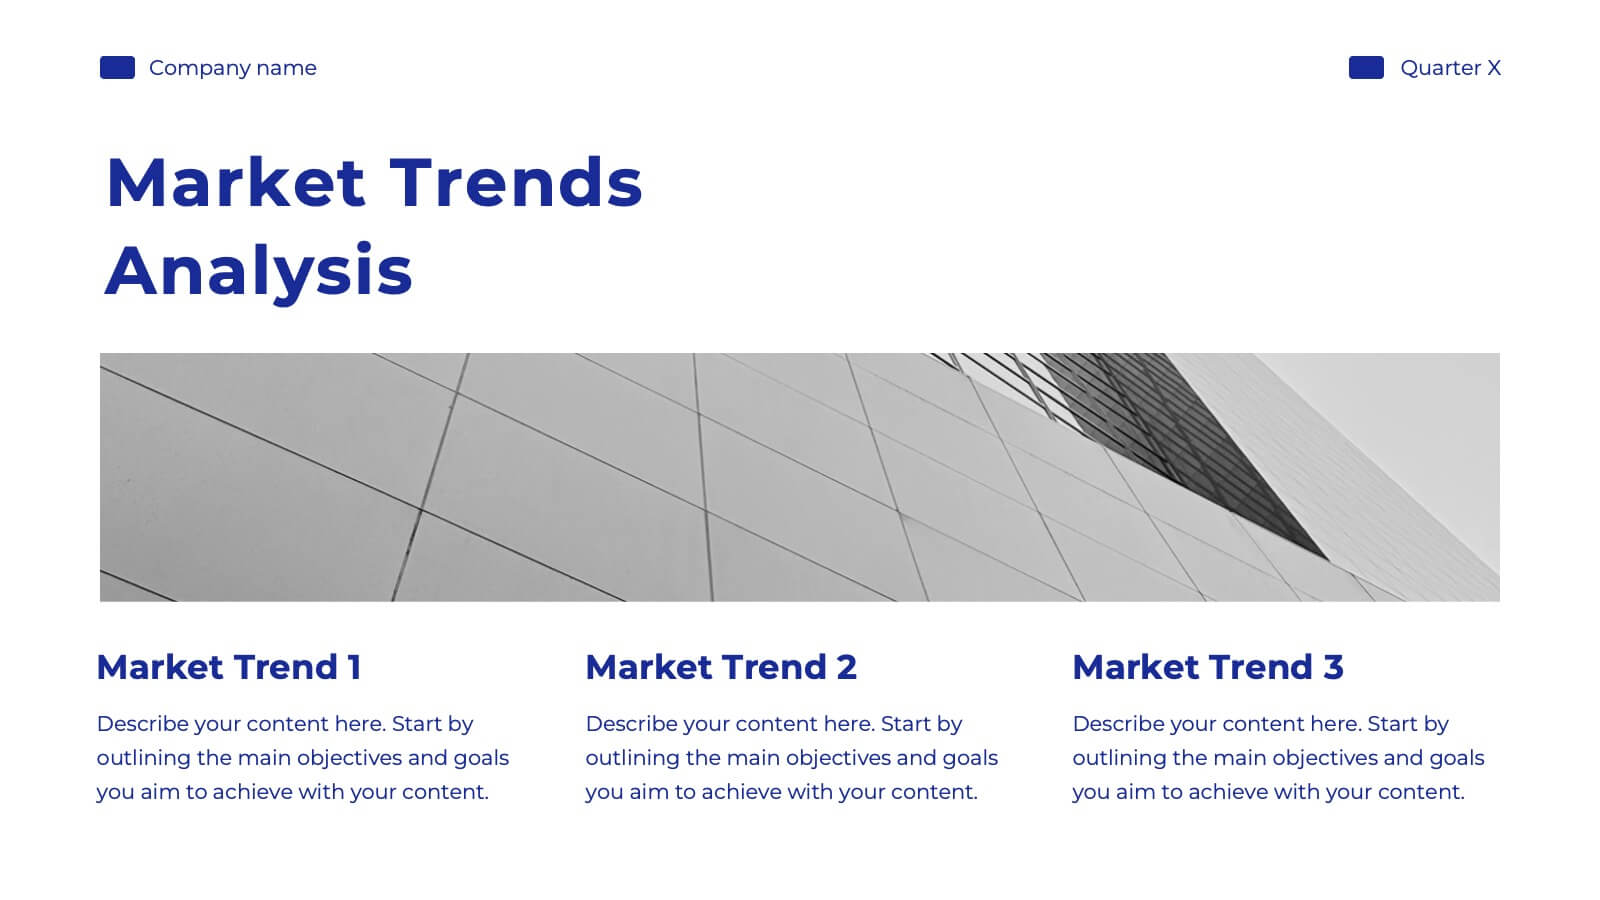
European Market Trends with Europe Map Presentation
Navigate market dynamics with the European Market Trends with Europe Map template, designed for business professionals analyzing key trends and opportunities across the region. It features an editable map, key data indicators, and graphical elements to represent market trends and opportunities. Compatible with PowerPoint and Google Slides, it's ideal for presentations on market analysis and growth strategies.


7 diapositivas
Big Data Infographic Presentation Template
This Big Data Infographic template is the perfect tool for any business presentation. This template has been designed to help you create truly engaging data-driven visuals, with powerful typography and interesting details that help draw in your audience. Introduce your business to the world with this big data infographic template. It's just what you need to describe the role of big data in the evolution of modern businesses. Our Big Data Infographic Presentation features all the tools for you to create wonderful charts, graphs, transitions and striking shapes both for your text and images.


22 diapositivas
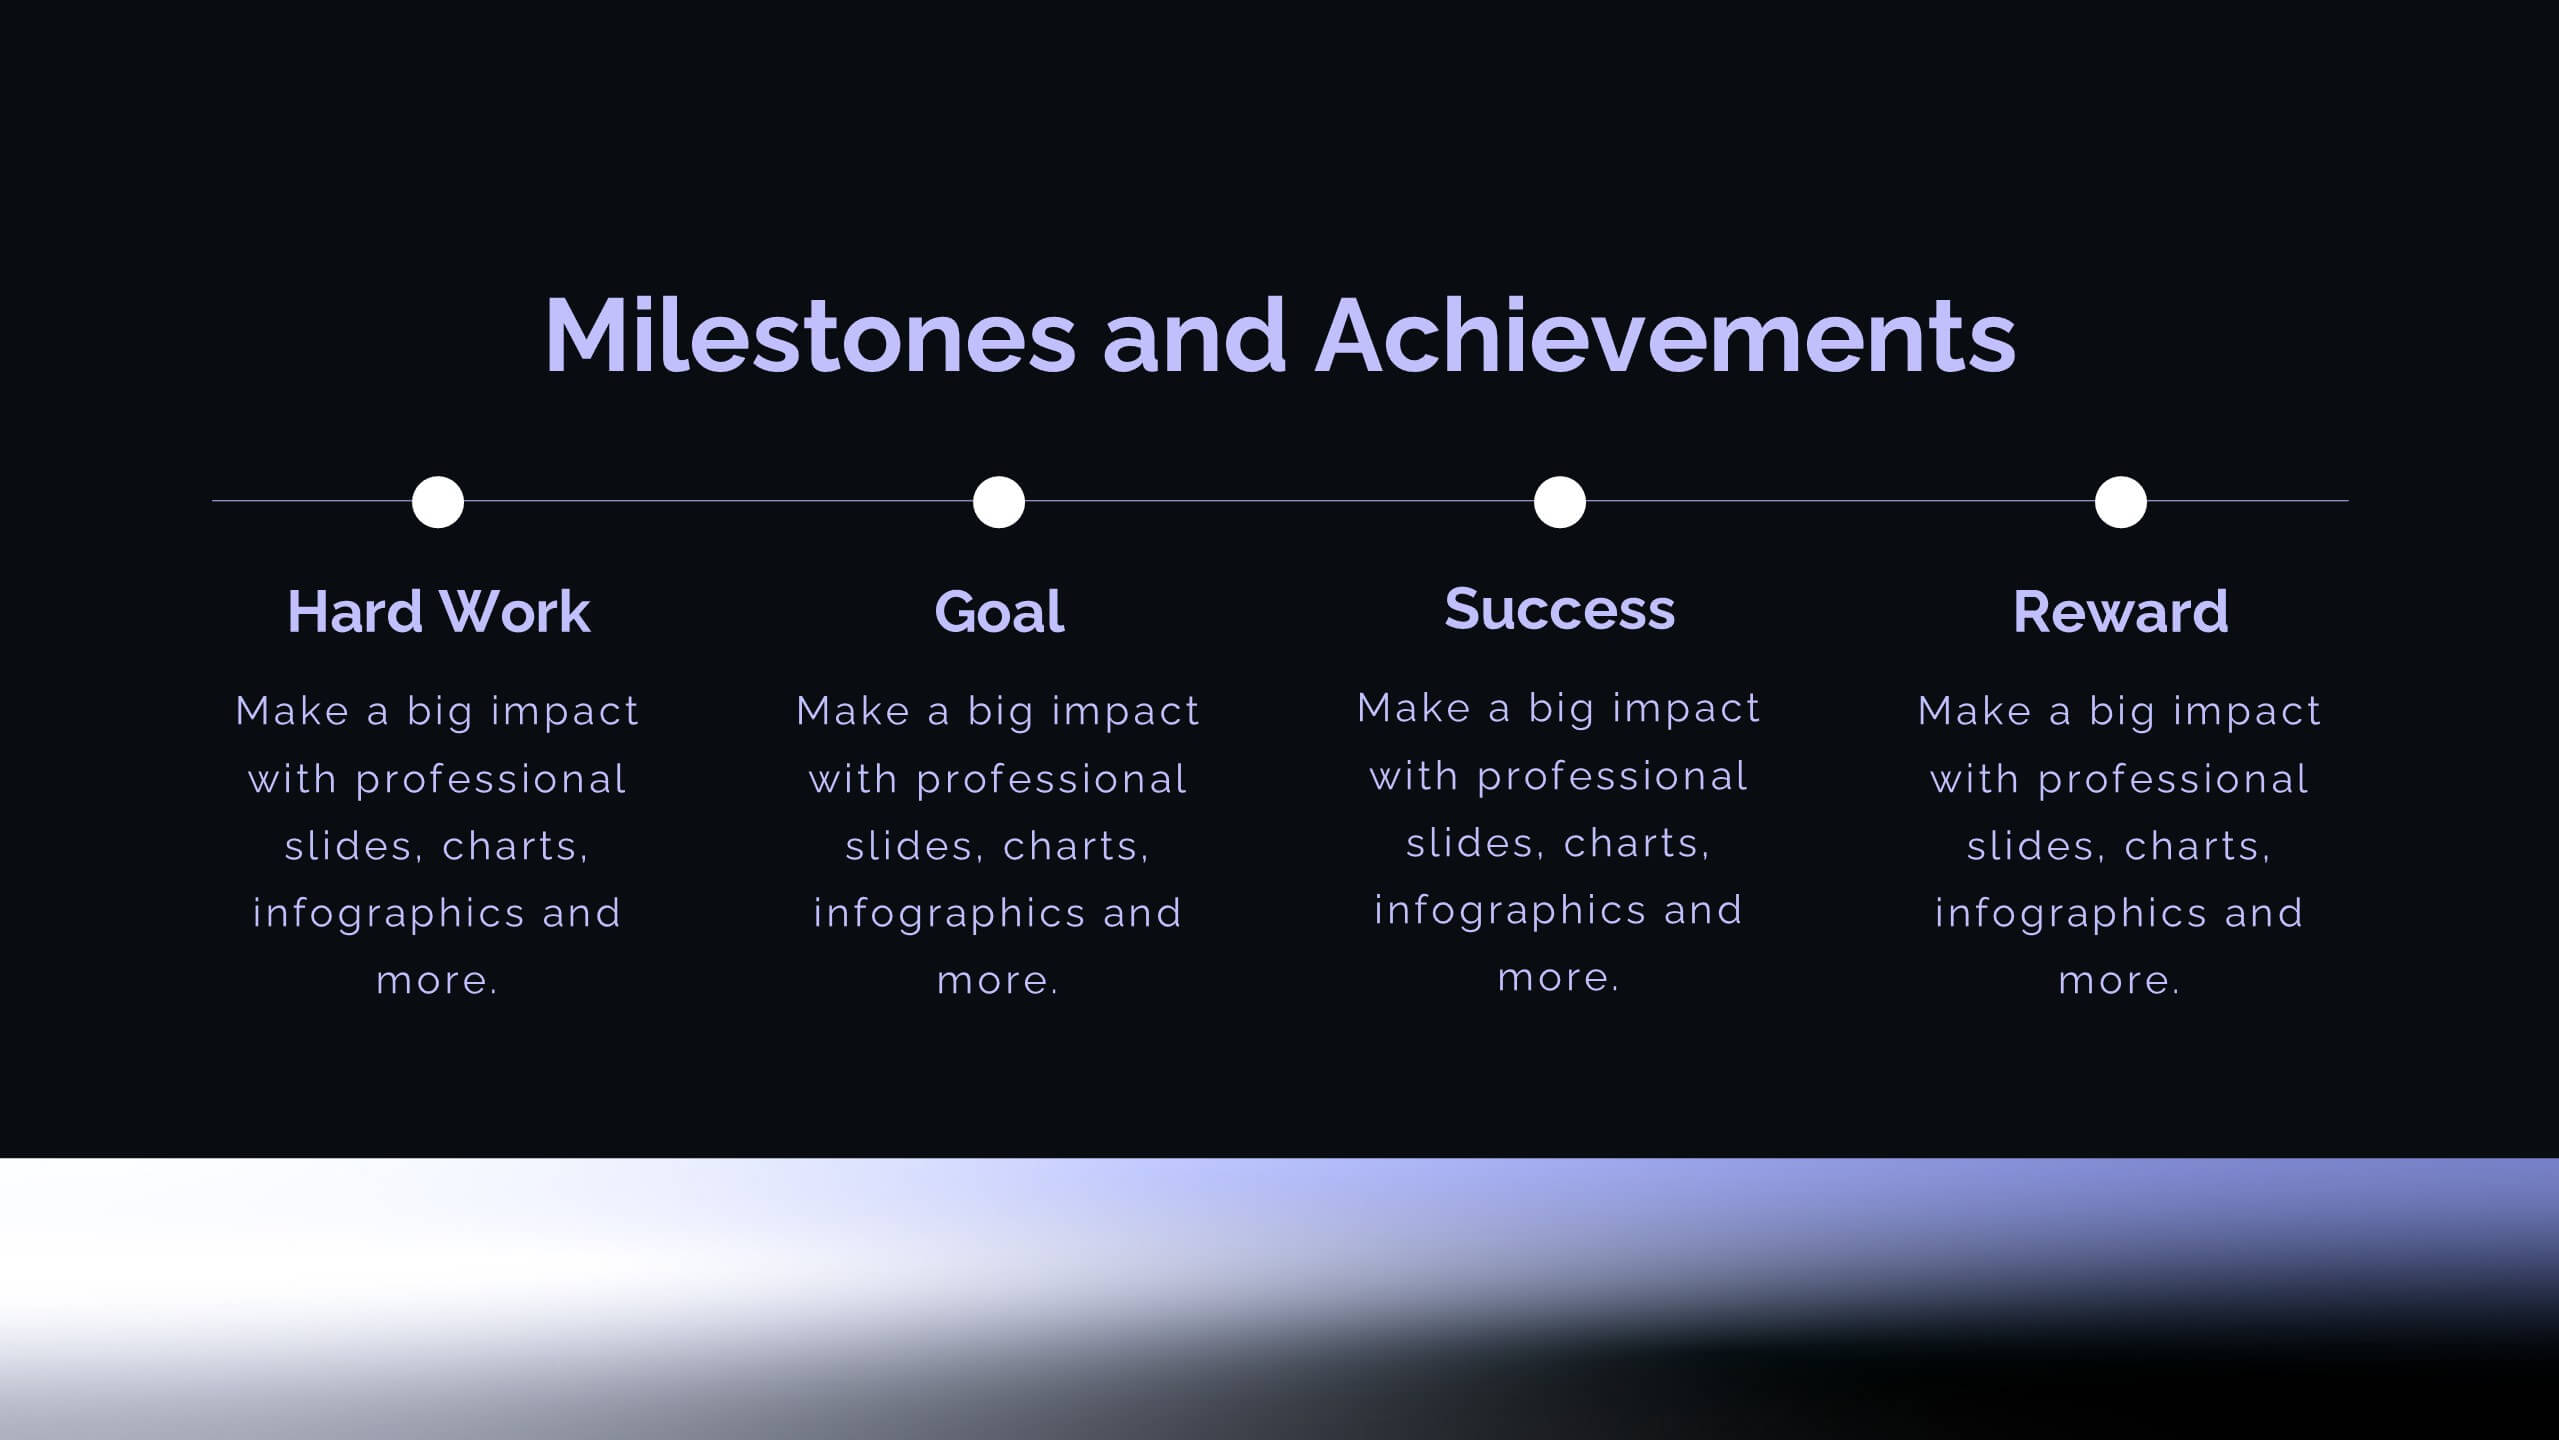
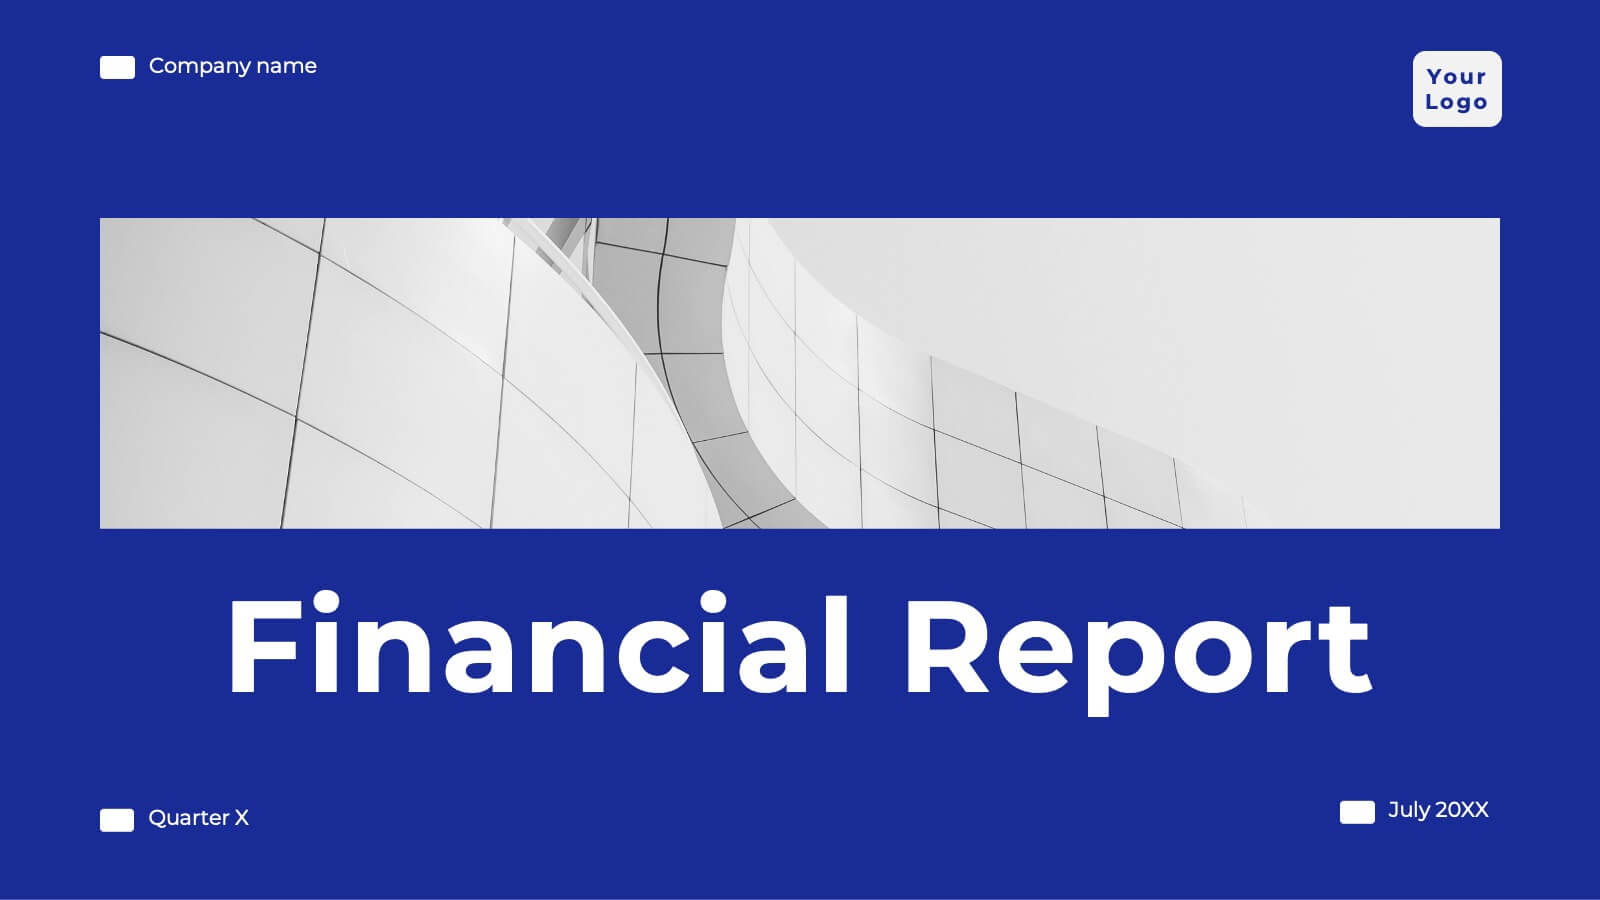
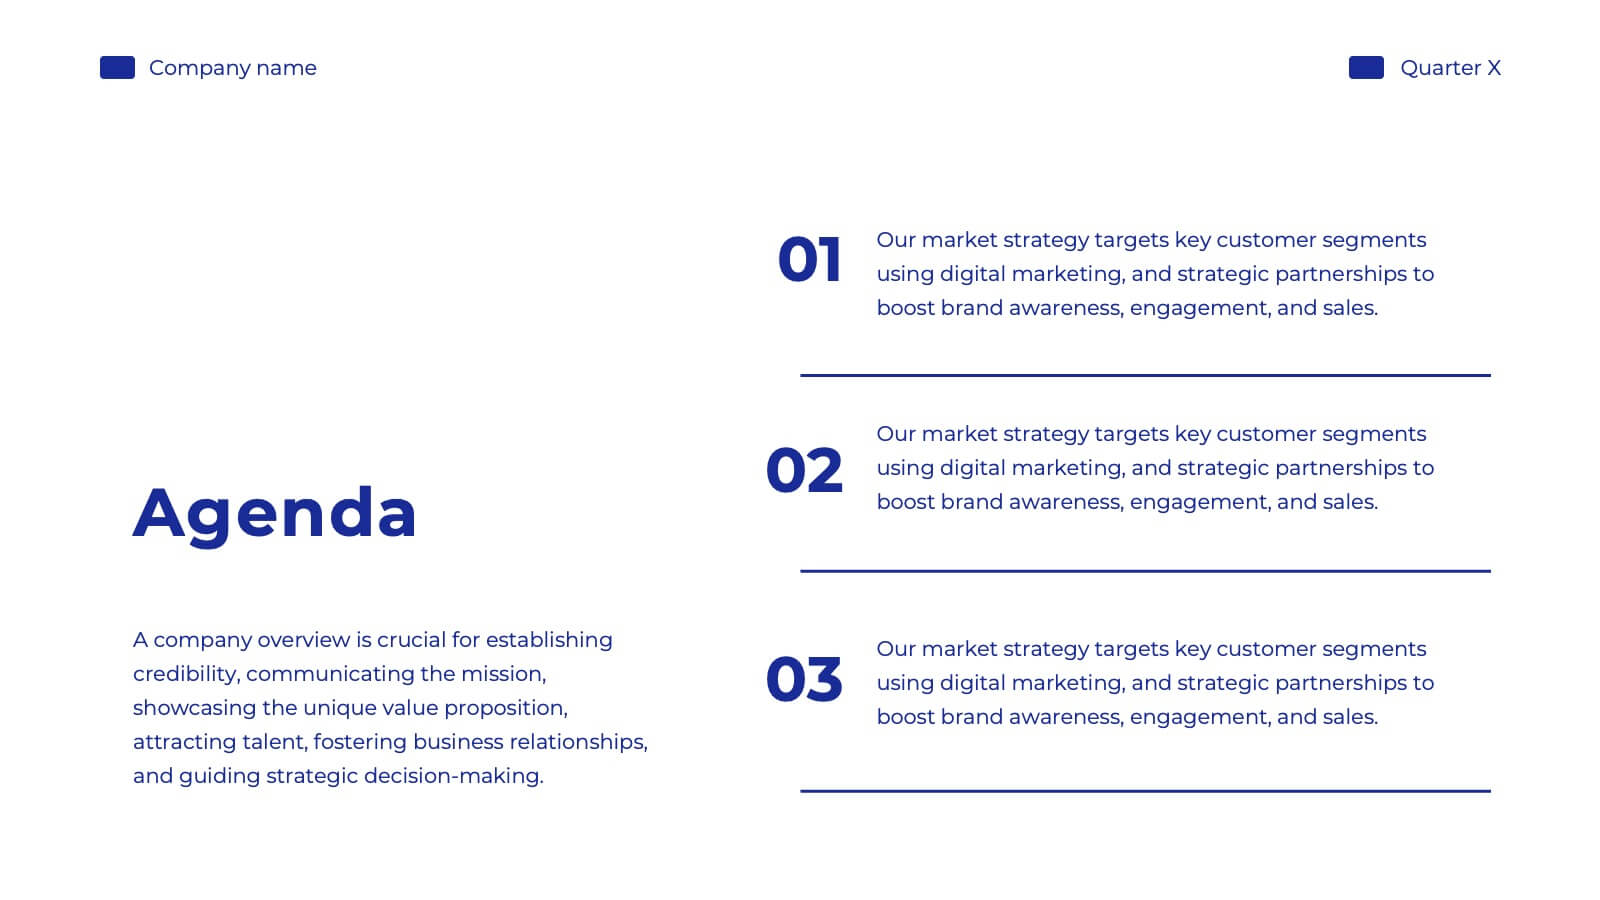
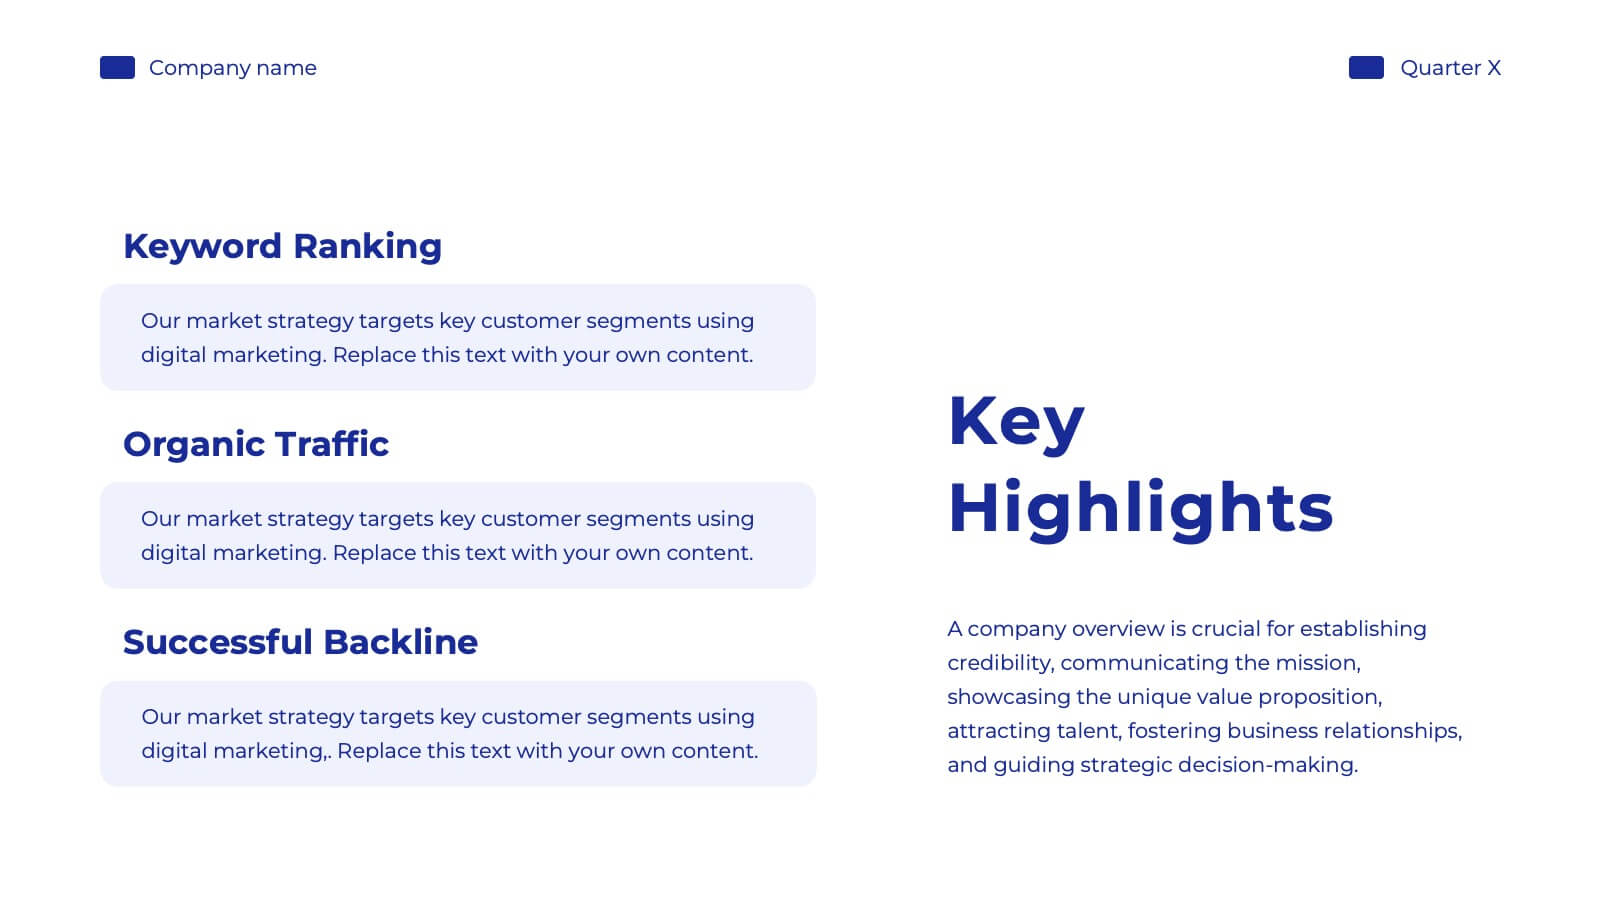
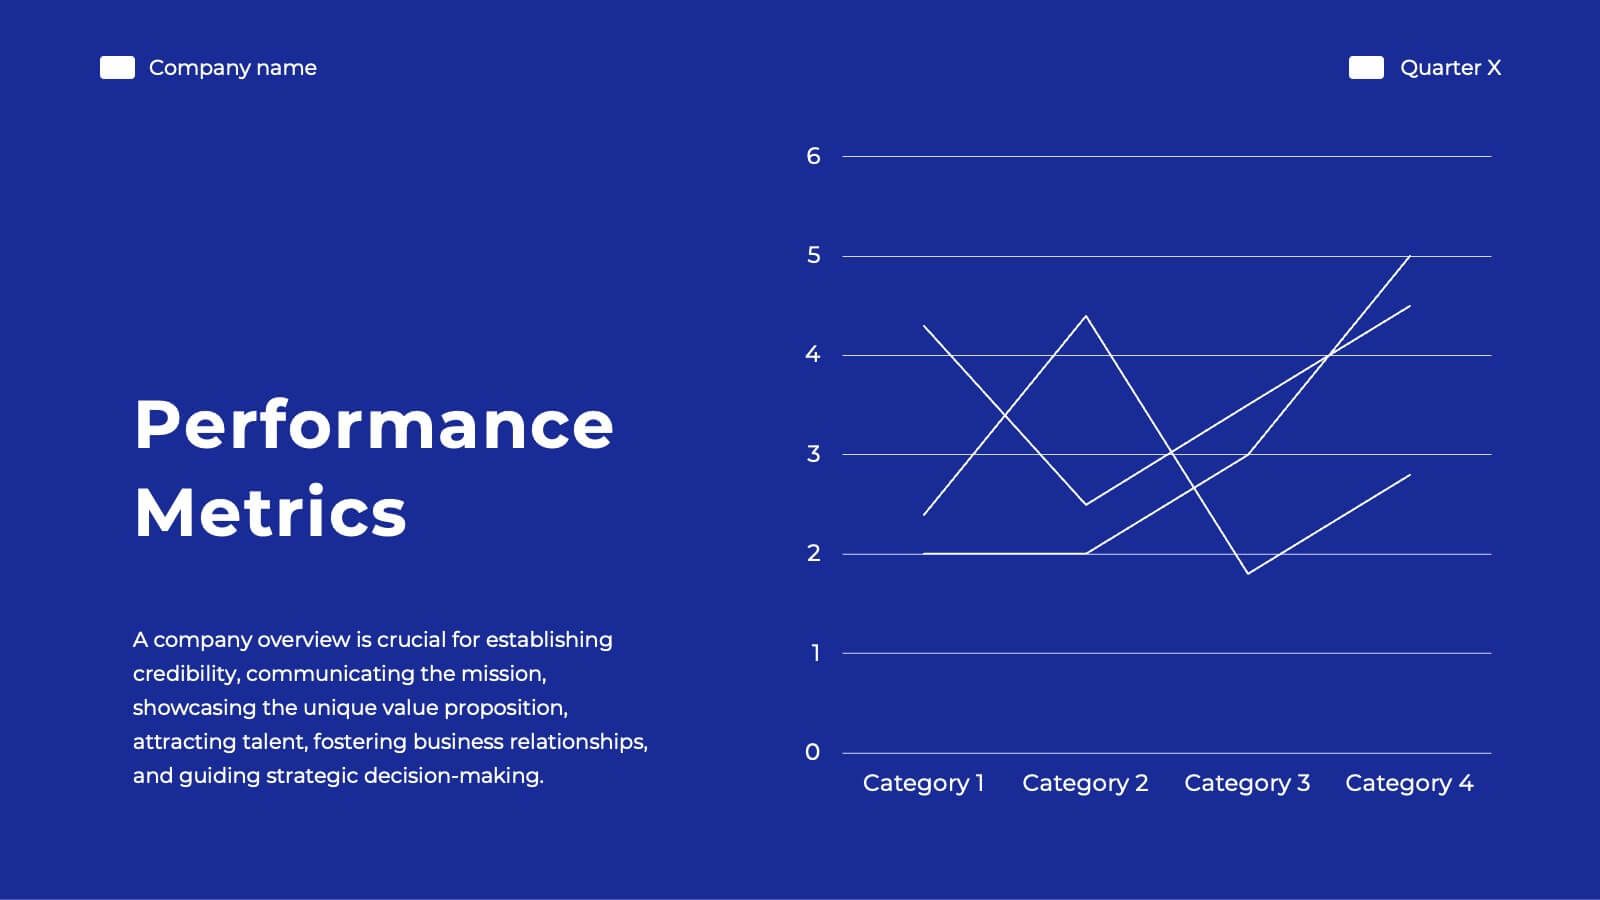
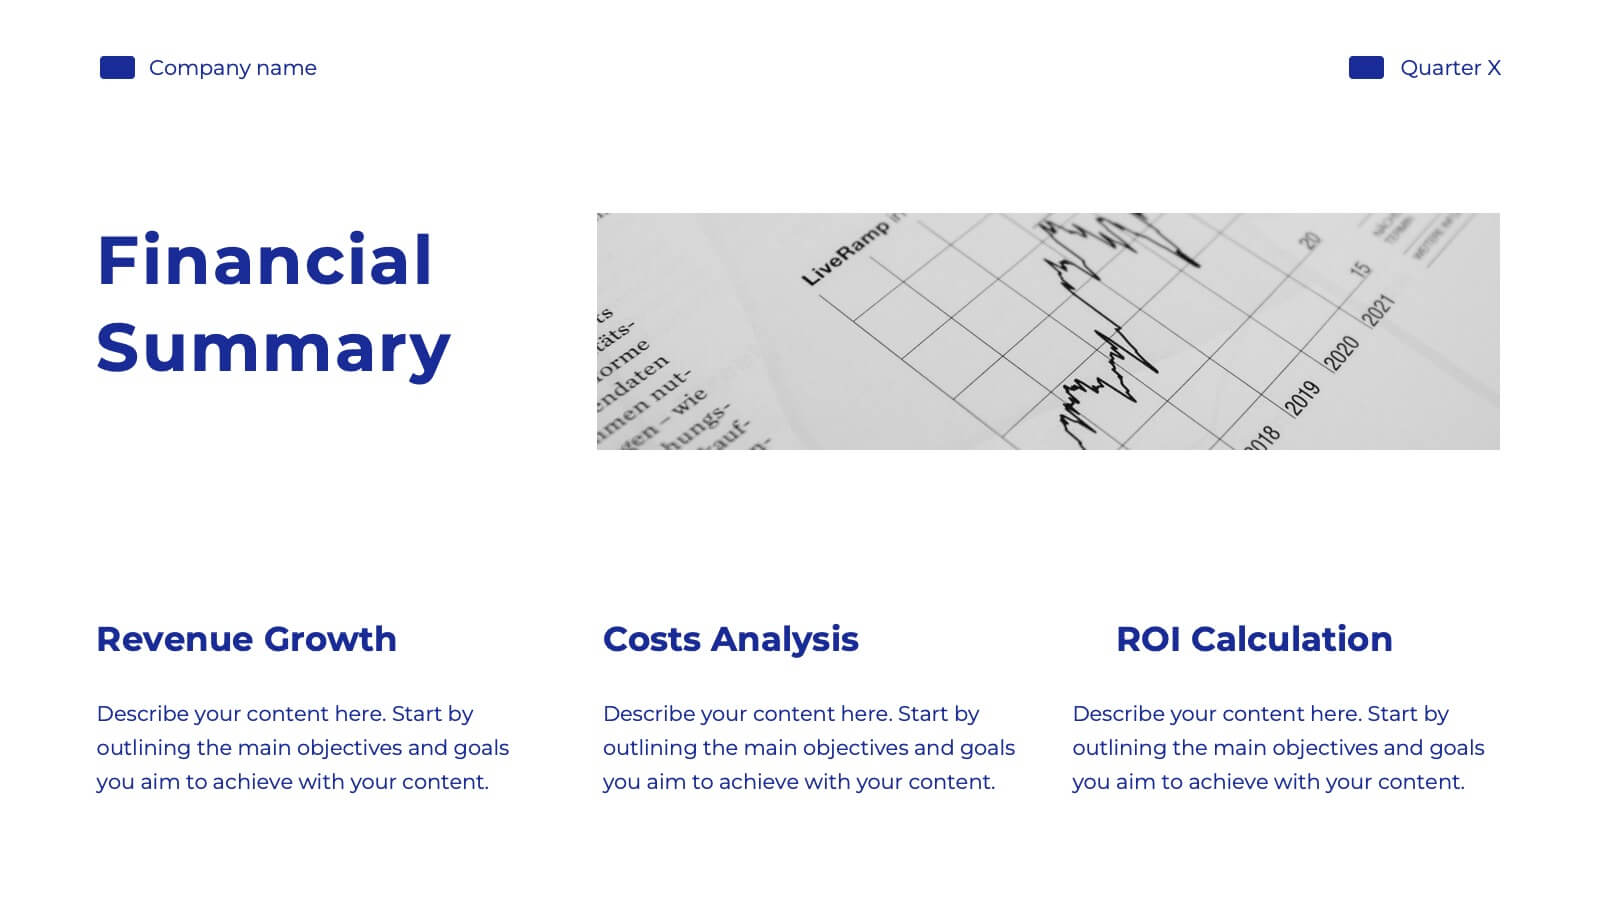
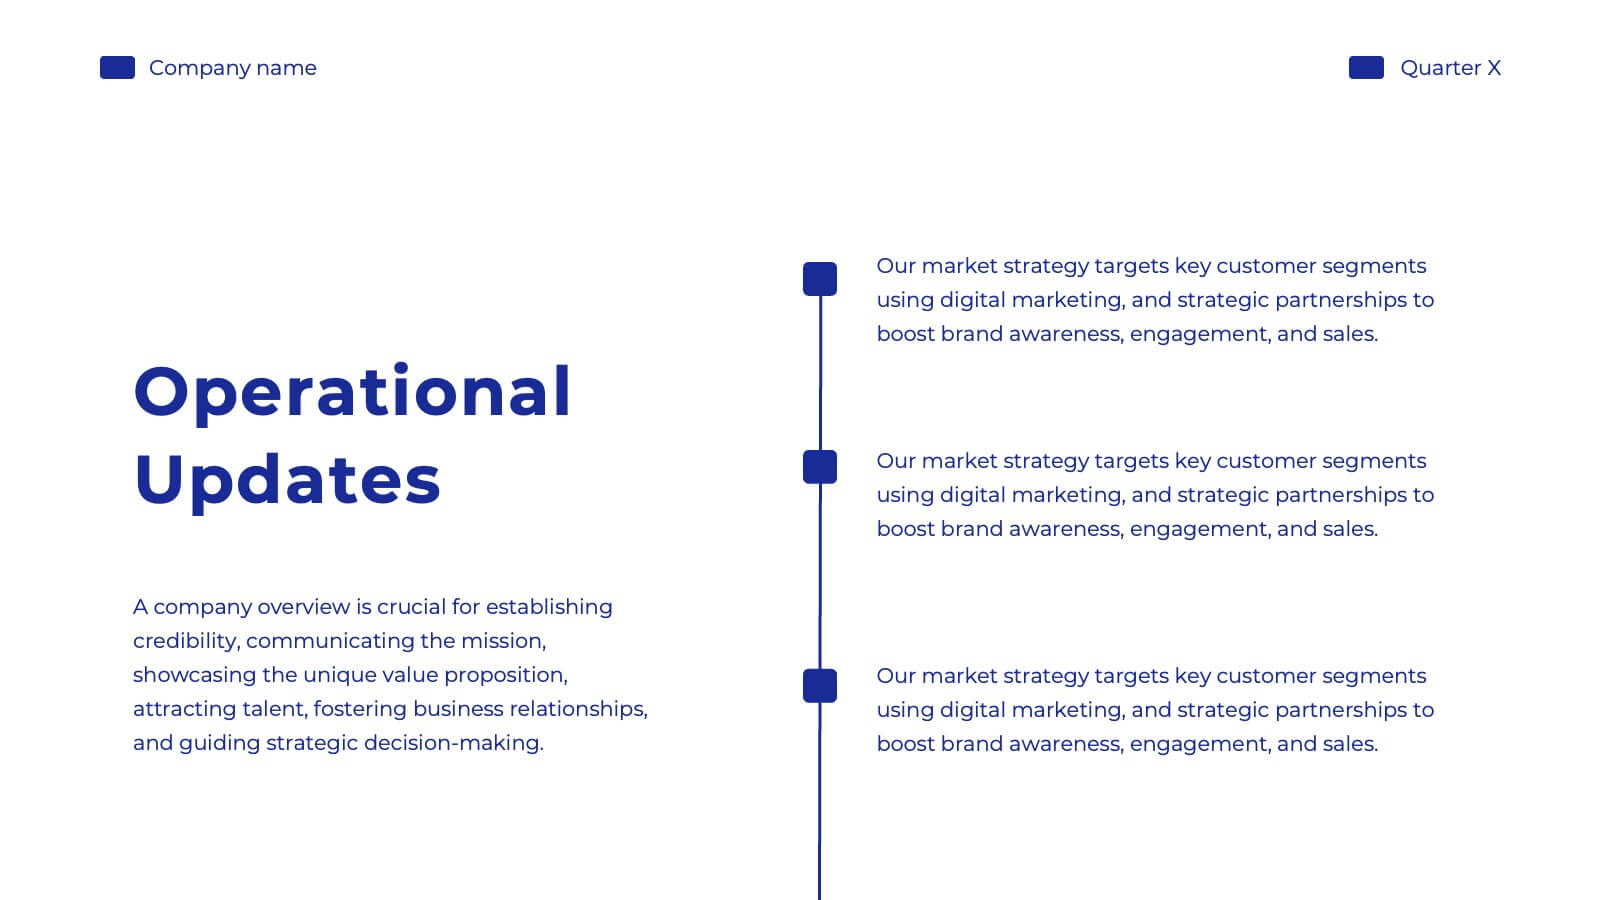
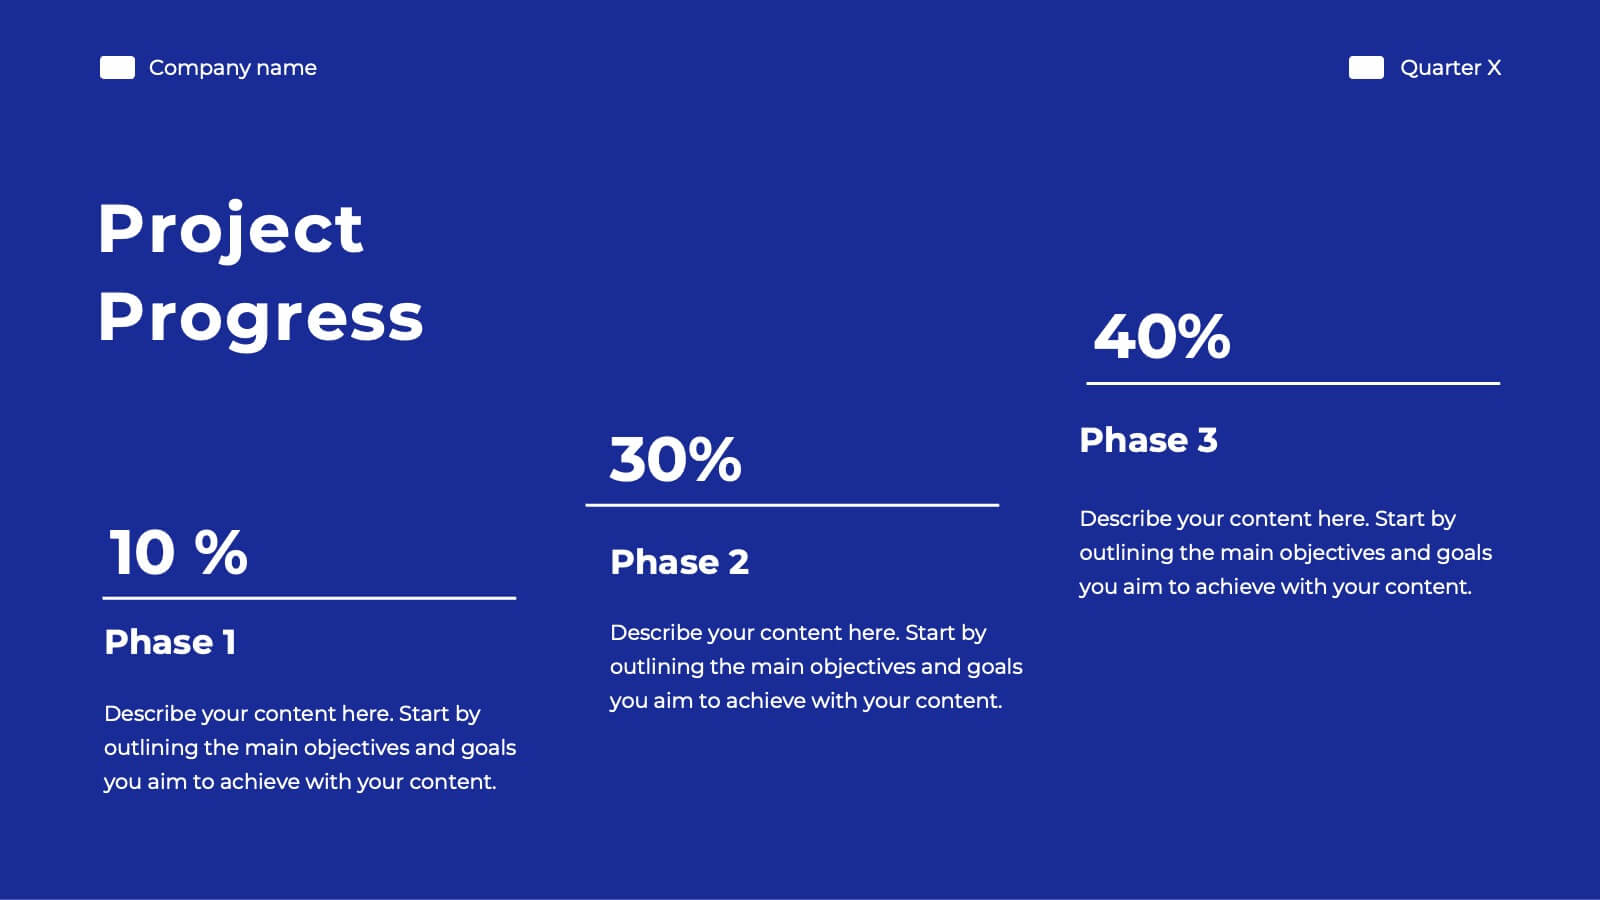
Frost Financial Report Presentation
Transform your brand with this comprehensive rebranding project template! Perfect for presenting brand identity, market analysis, and strategic positioning, it includes slides for logos, color palettes, and brand guidelines. Engage your audience with visually striking designs and detailed content. Compatible with PowerPoint, Keynote, and Google Slides for easy, professional presentations on any platform.


5 diapositivas
IT Security and Data Protection Presentation
Communicate your cybersecurity objectives with impact using this clean, shield-based visual layout. This presentation slide features five distinct steps with matching icons, perfect for detailing protocols like data governance, firewall strategies, or access control measures. Ideal for IT professionals, network admins, or compliance teams. Fully customizable and compatible with PowerPoint, Keynote, and Google Slides.


6 diapositivas
Circular Business Wheel Model Presentation
Break down your strategy into dynamic segments with this Circular Business Wheel Model. This layout is ideal for showcasing interconnected business areas like sustainability, innovation, monetization, and market appeal. Perfect for strategy decks, business planning, and growth presentations. Compatible with PowerPoint, Keynote, and Google Slides—fully editable for your needs.