


Características


¿Tienes alguna pregunta?
Recomendar


4 diapositivas
Comparison Tables Slide Presentation
Make your insights instantly comparable with a clean layout designed to highlight differences and advantages with ease. This presentation helps you break down options, features, or plans in a clear visual table your audience can understand at a glance. Fully compatible with PowerPoint, Keynote, and Google Slides.


4 diapositivas
UX Empathy Map Design Presentation
Spark deeper user understanding with a layout that turns thoughts, feelings, and behaviors into clear visual insights. This presentation helps teams explore customer motivation and improve product decisions through a simple, structured empathy-mapping framework. Fully compatible with PowerPoint, Keynote, and Google Slides.


23 diapositivas
Twilora Business Plan Presentation
Present your business strategy with a comprehensive and visually engaging template designed to impress stakeholders and investors. This template covers key elements of a business plan, including company background, market opportunities, business objectives, and key milestones. Showcase your product offerings, target audience, and competitive advantages through clear, professional visuals and data-driven charts. Highlight your financial performance, investment opportunities, and operational plans with precision and clarity. Tailor the design to reflect your brand's identity and goals. Fully compatible with PowerPoint, Google Slides, and Keynote, this versatile template is perfect for startups, established businesses, and entrepreneurs aiming to present a strong and compelling business case.


5 diapositivas
Internal Communication Flow Chart Presentation
Visualize key communication channels within your organization using this internal communication flow chart. With a clean radial layout, this template helps you illustrate how information travels between departments or roles. Ideal for HR teams, managers, or consultants. Fully editable in Canva, PowerPoint, and Google Slides for seamless customization.


3 diapositivas
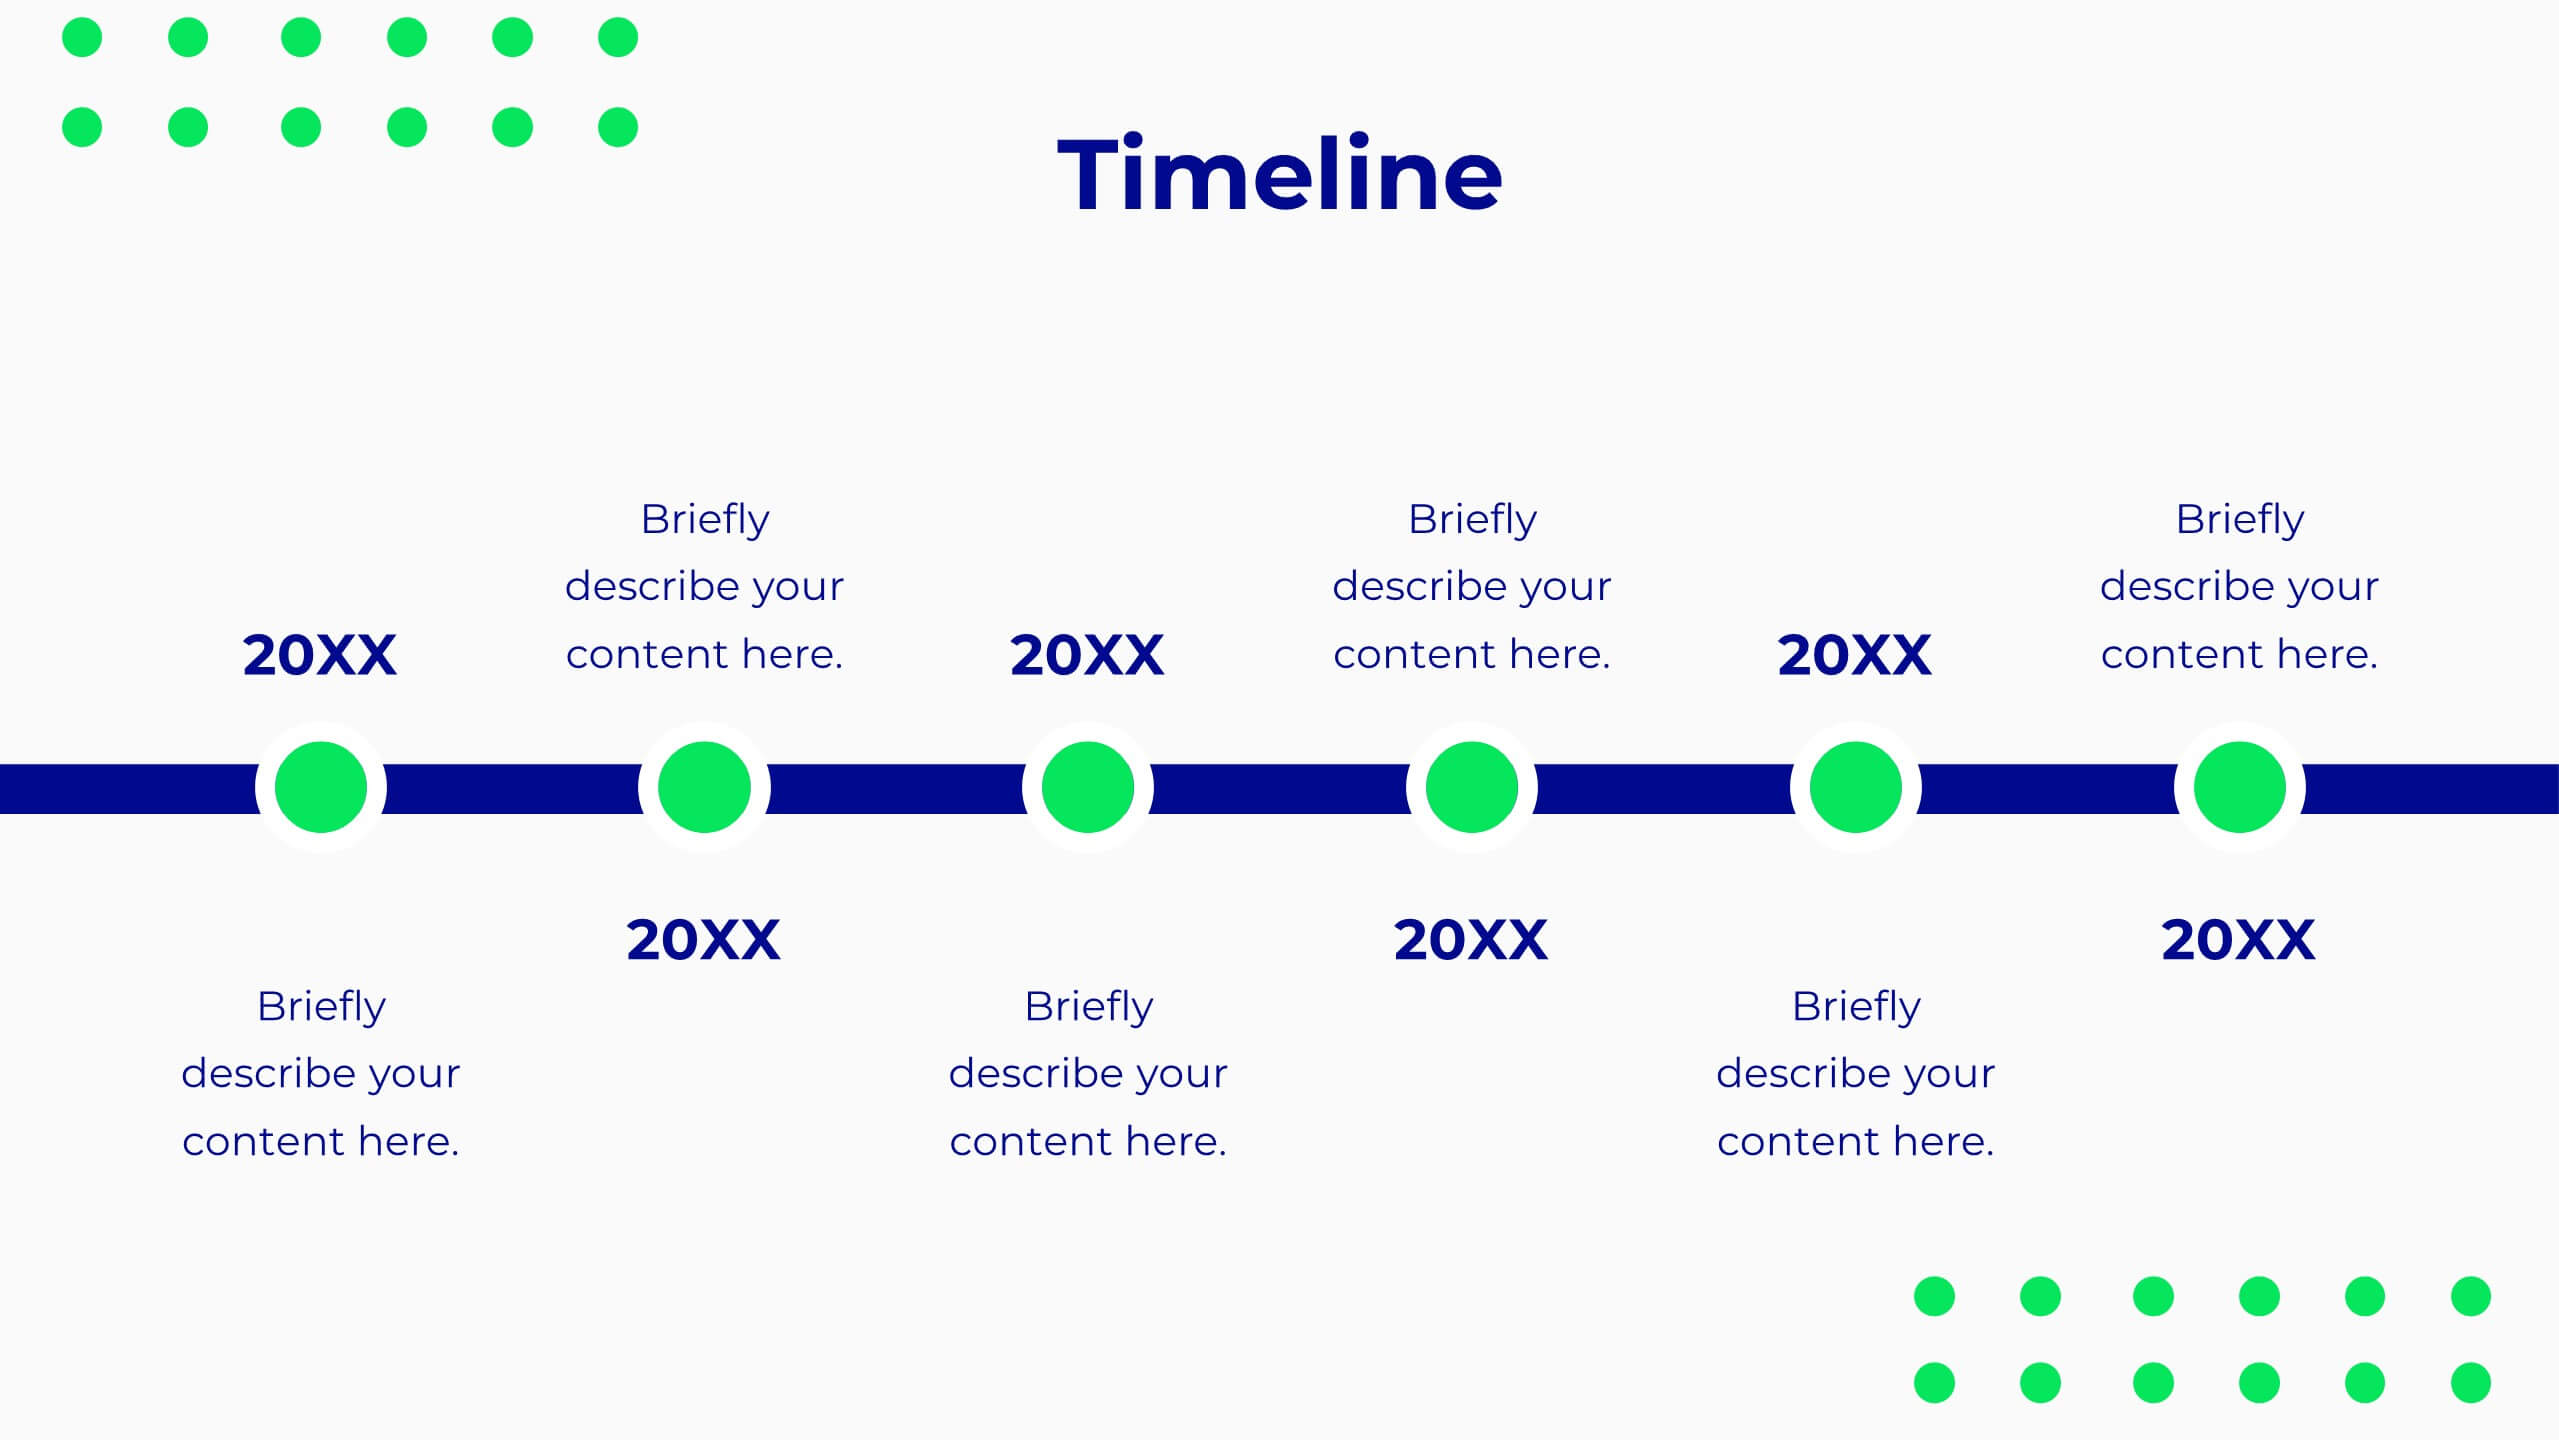
Comprehensive Business Roadmap Strategy Presentation
Plan ahead with confidence using the Comprehensive Business Roadmap Strategy Presentation. This timeline-based slide is perfect for mapping out multi-quarter goals, initiatives, or project phases. Use the horizontal arrows to show overlapping tasks and strategic priorities by quarter. Ideal for project managers, team leads, and business strategists. Fully editable in PowerPoint, Keynote, Google Slides, and Canva.


5 diapositivas
Artificial Intelligence Tools Infographics
Artificial Intelligence has advanced rapidly in recent years, leading to the development of various tools and technologies that leverage AI algorithms and techniques. These vertical infographics highlight various tools and technologies used in the field of AI. This template provides an engaging way to showcase different AI tools and their functionalities. This features a sleek and contemporary design that captures attention. The combination of vibrant colors, high-quality icons, and visuals adds a modern touch to the infographics. The template offers multiple slides that provide an overview of AI and its technologies.


5 diapositivas
Employee Training Roadmap Presentation
Take your team on a visual journey that maps out success, one milestone at a time. This roadmap presentation is perfect for outlining employee training stages in a clear, engaging way. Each point leads naturally to the next. Fully editable and compatible with PowerPoint, Keynote, and Google Slides for seamless use.


21 diapositivas
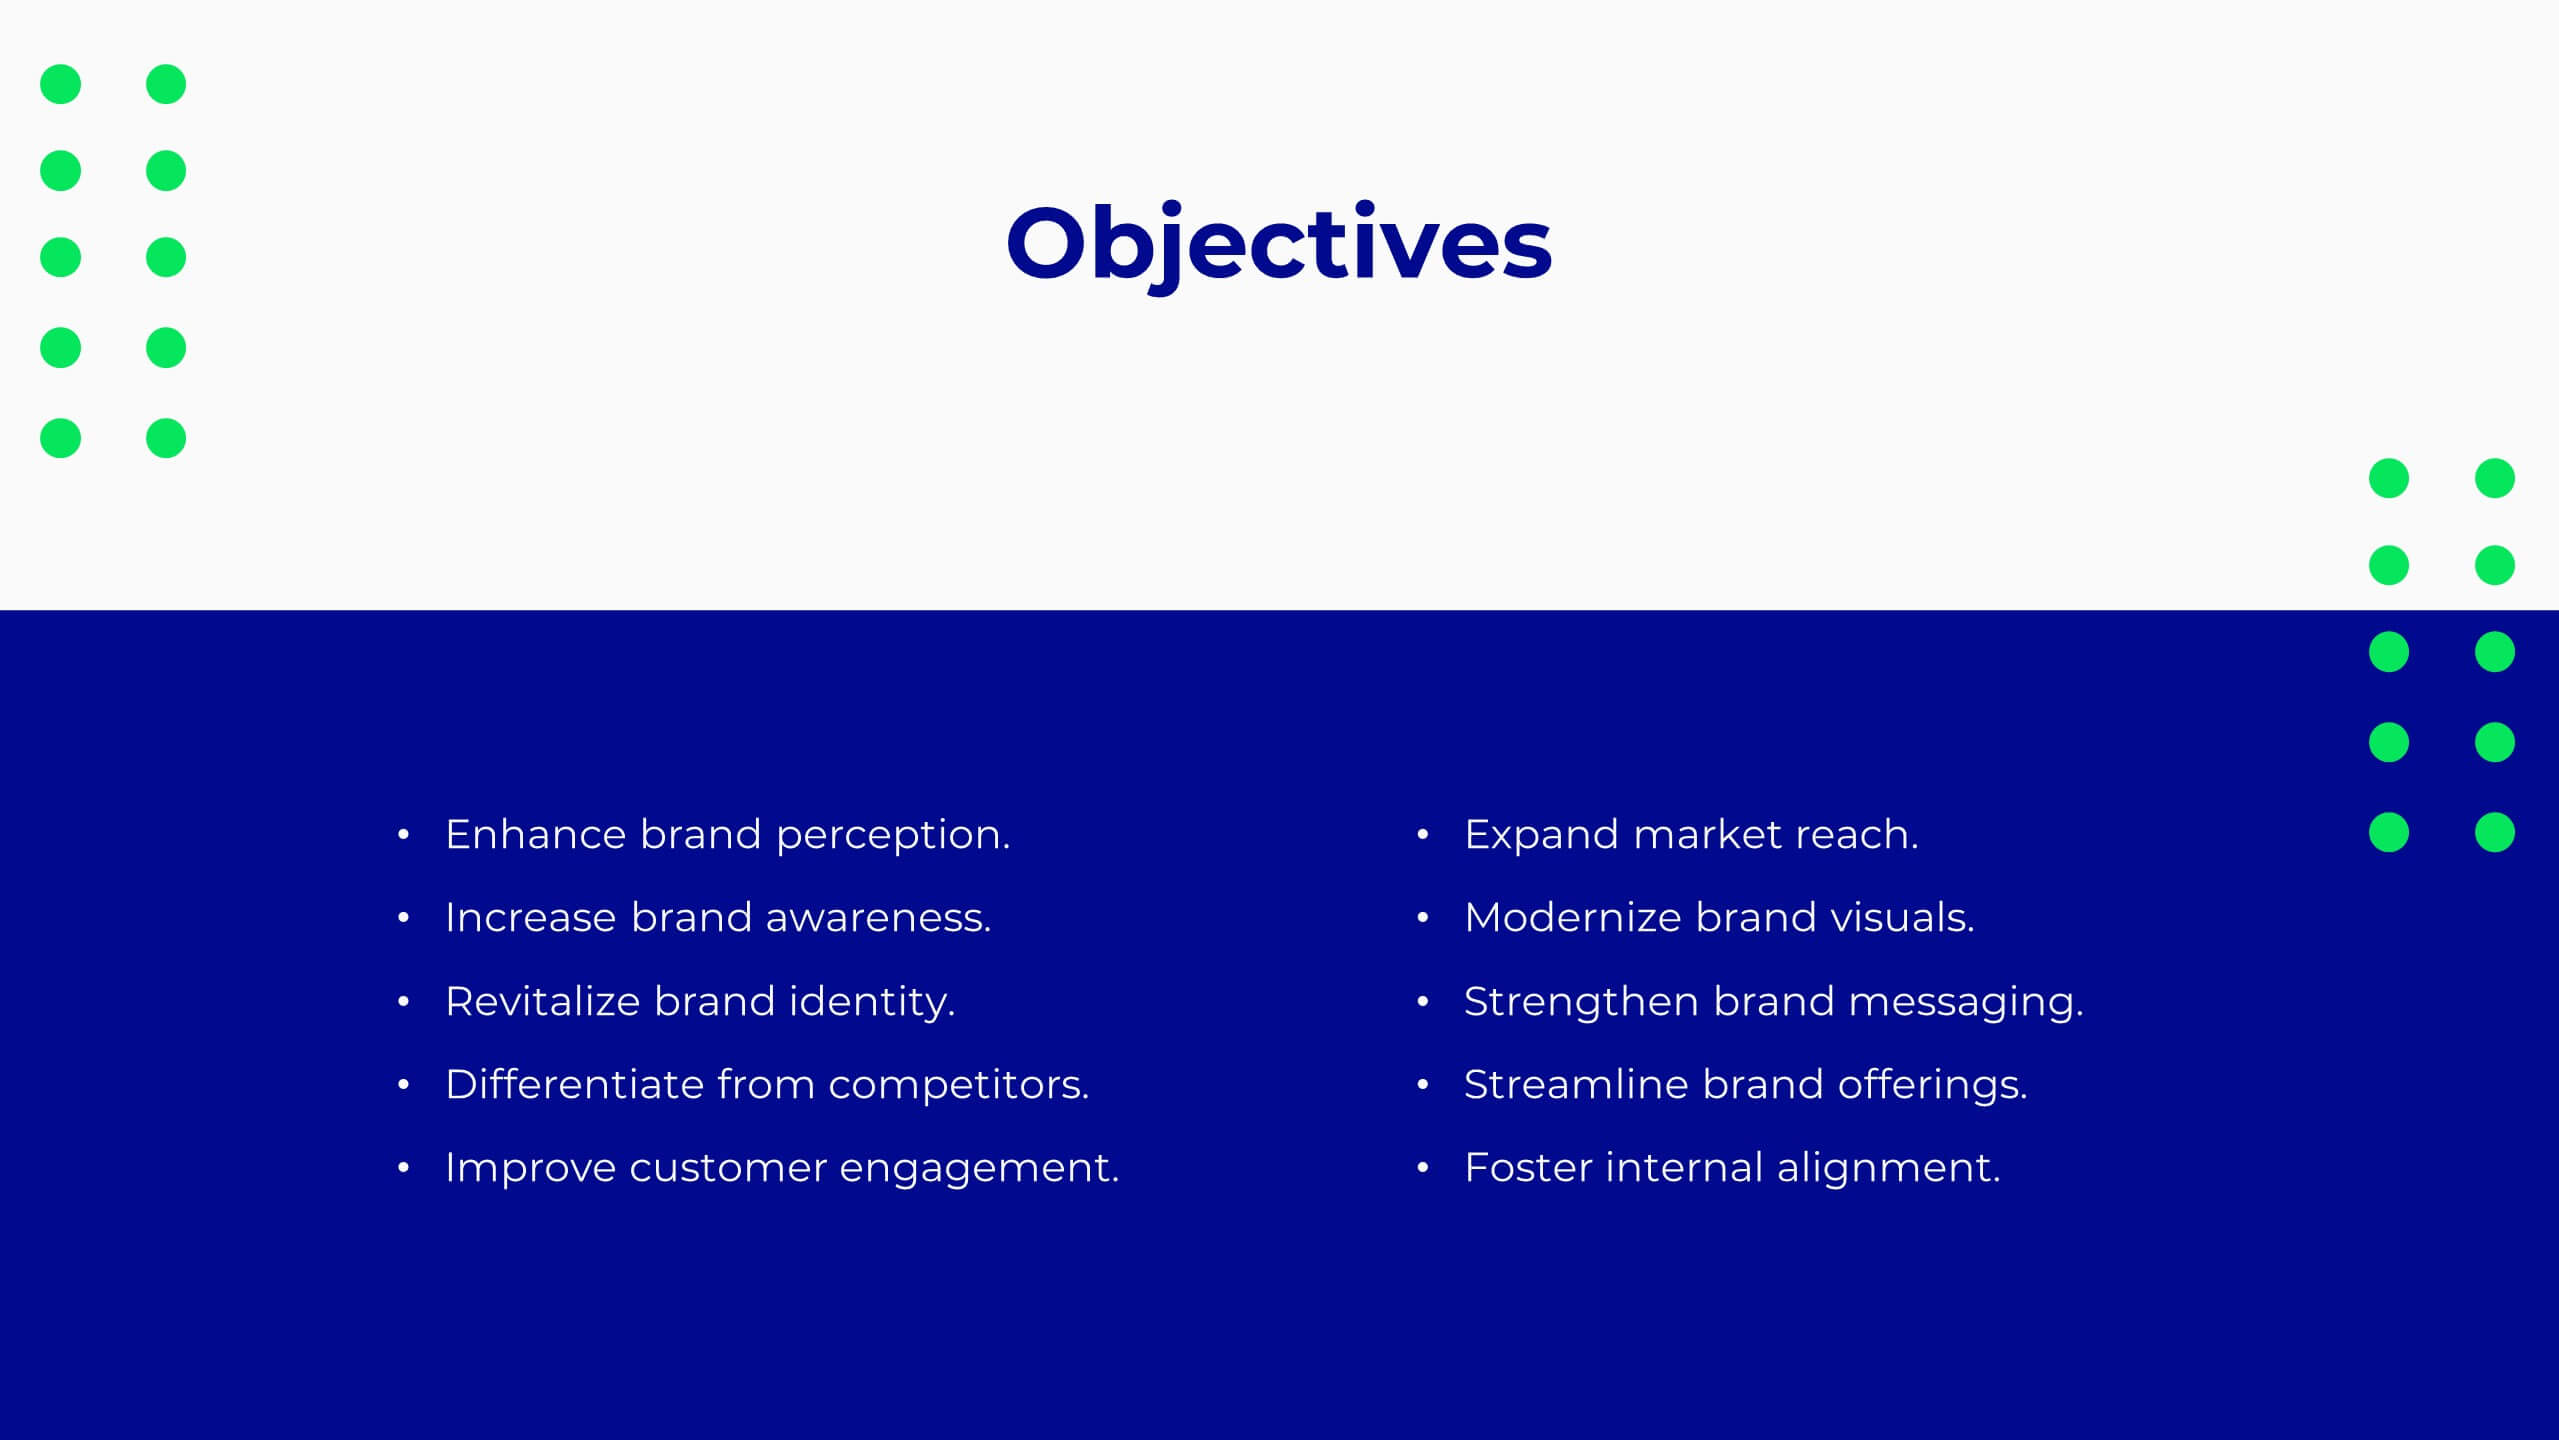
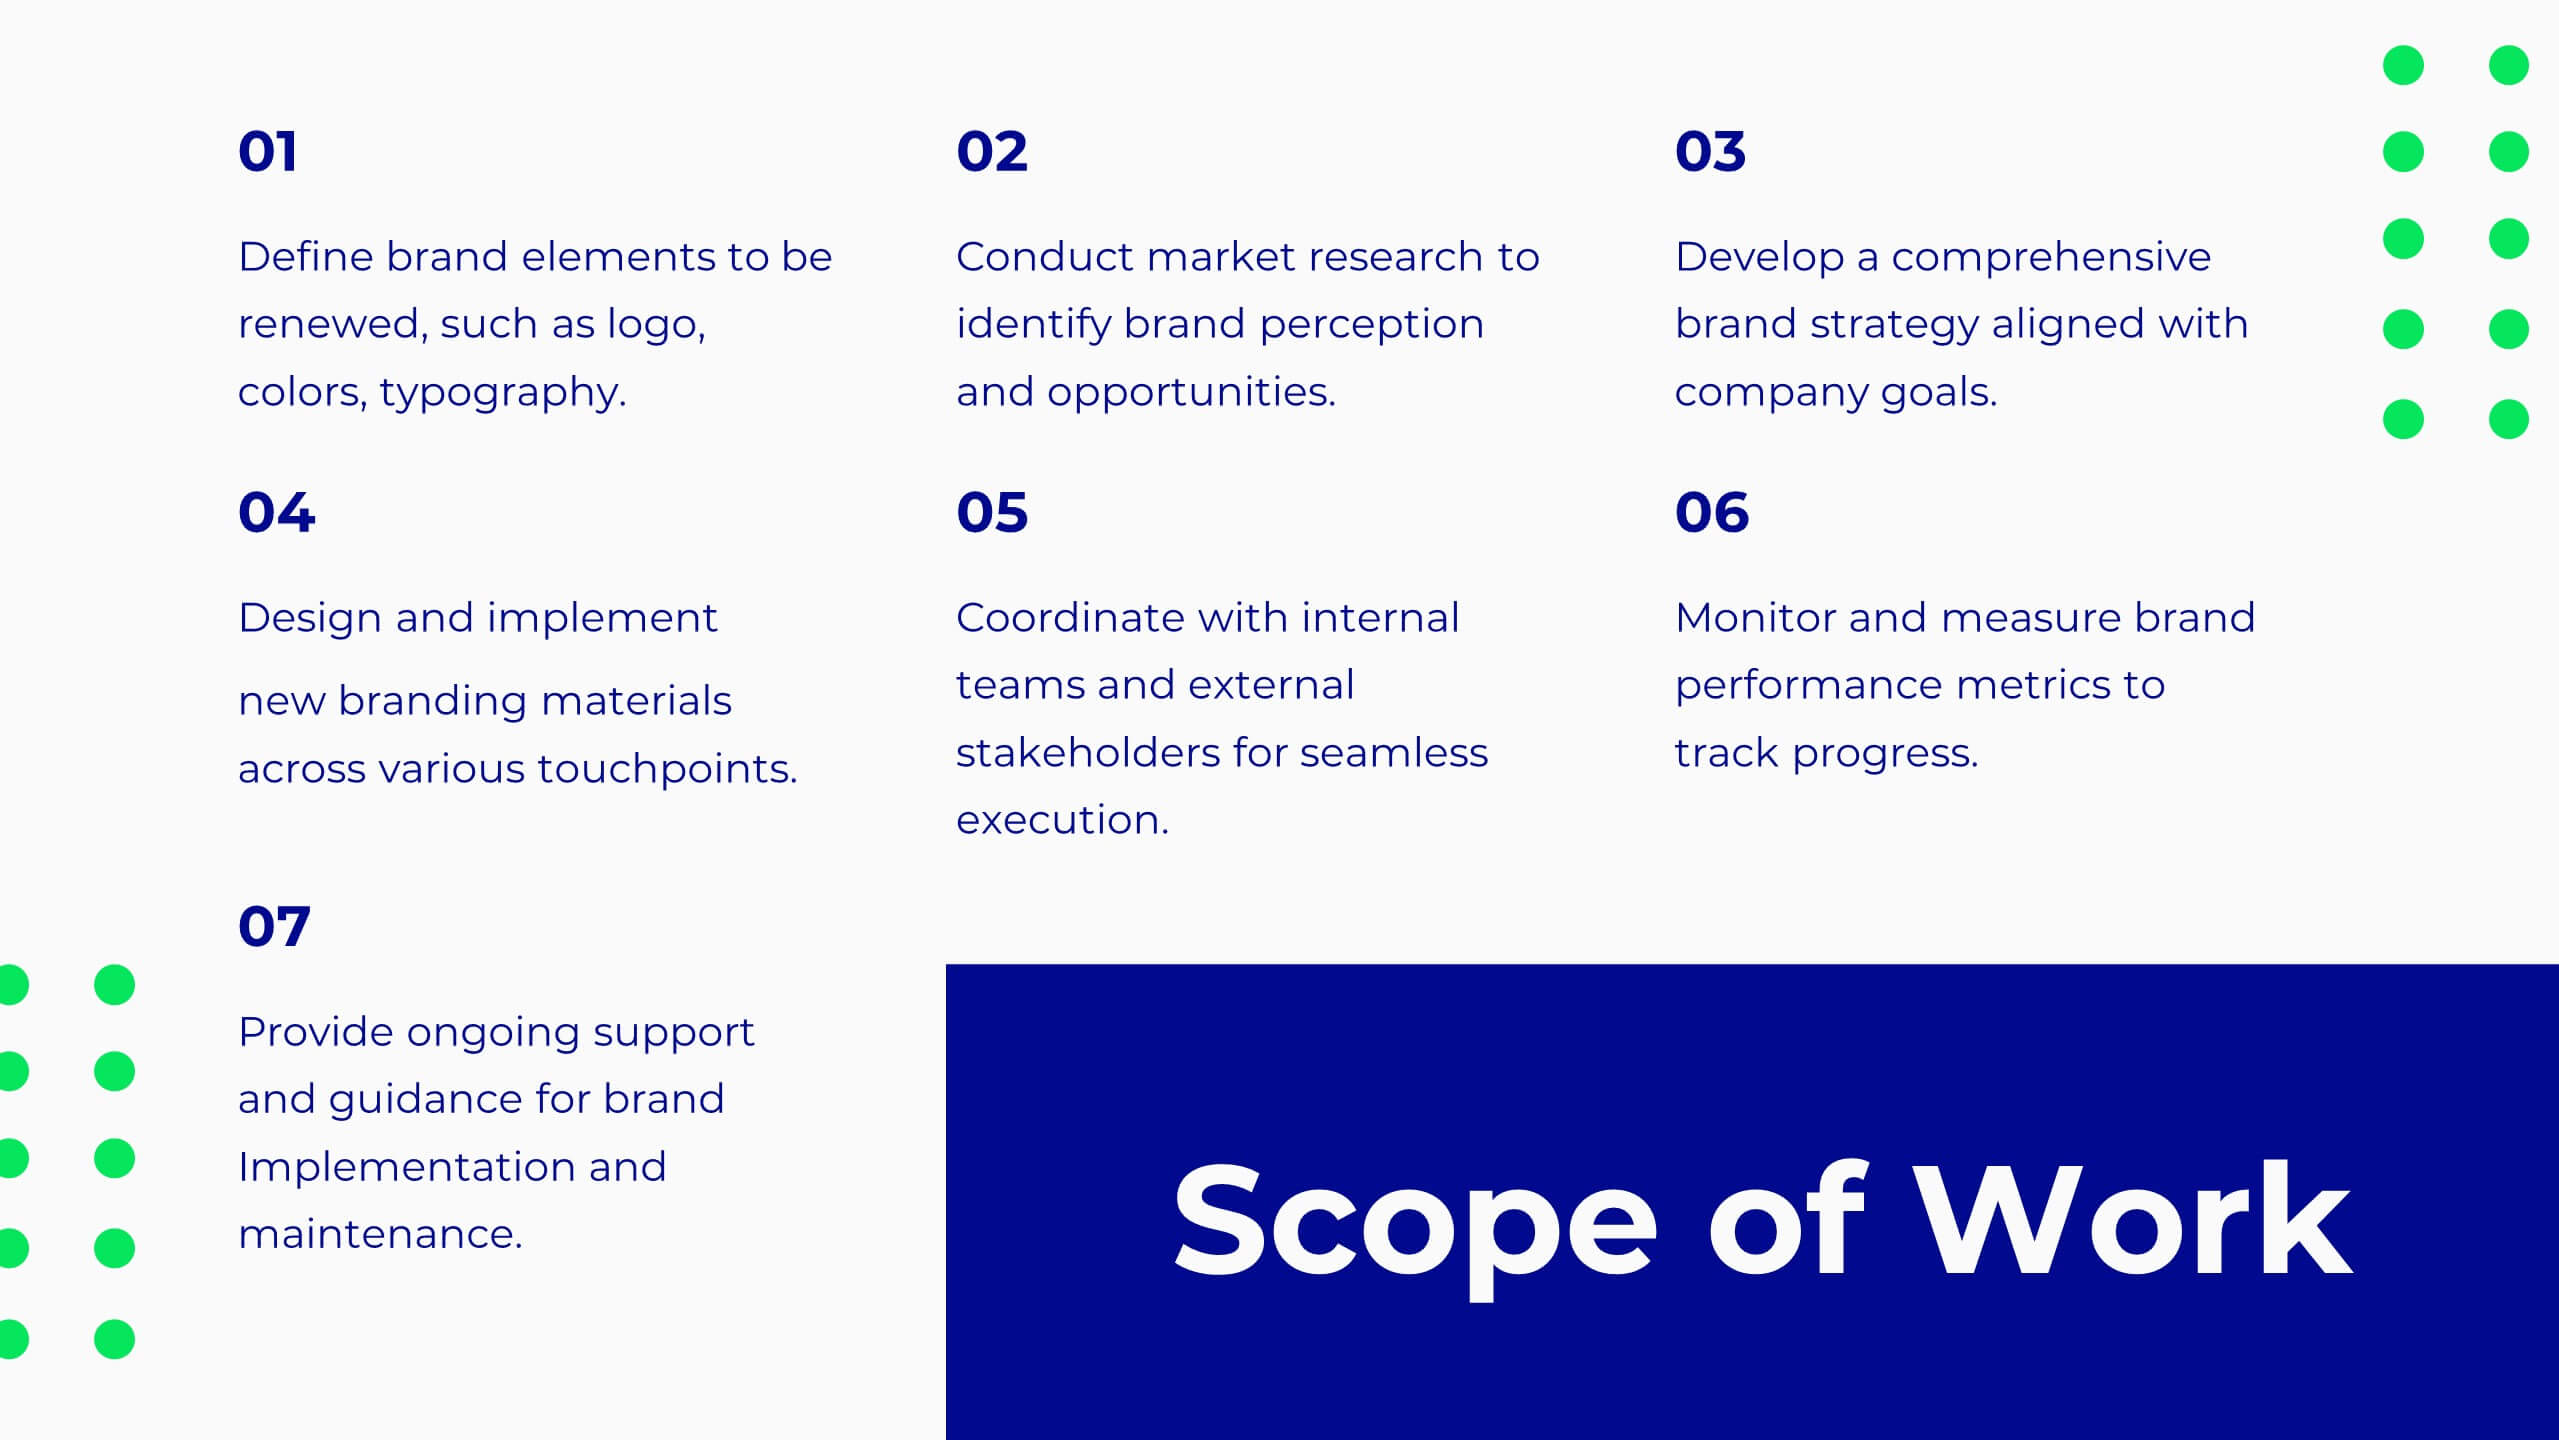
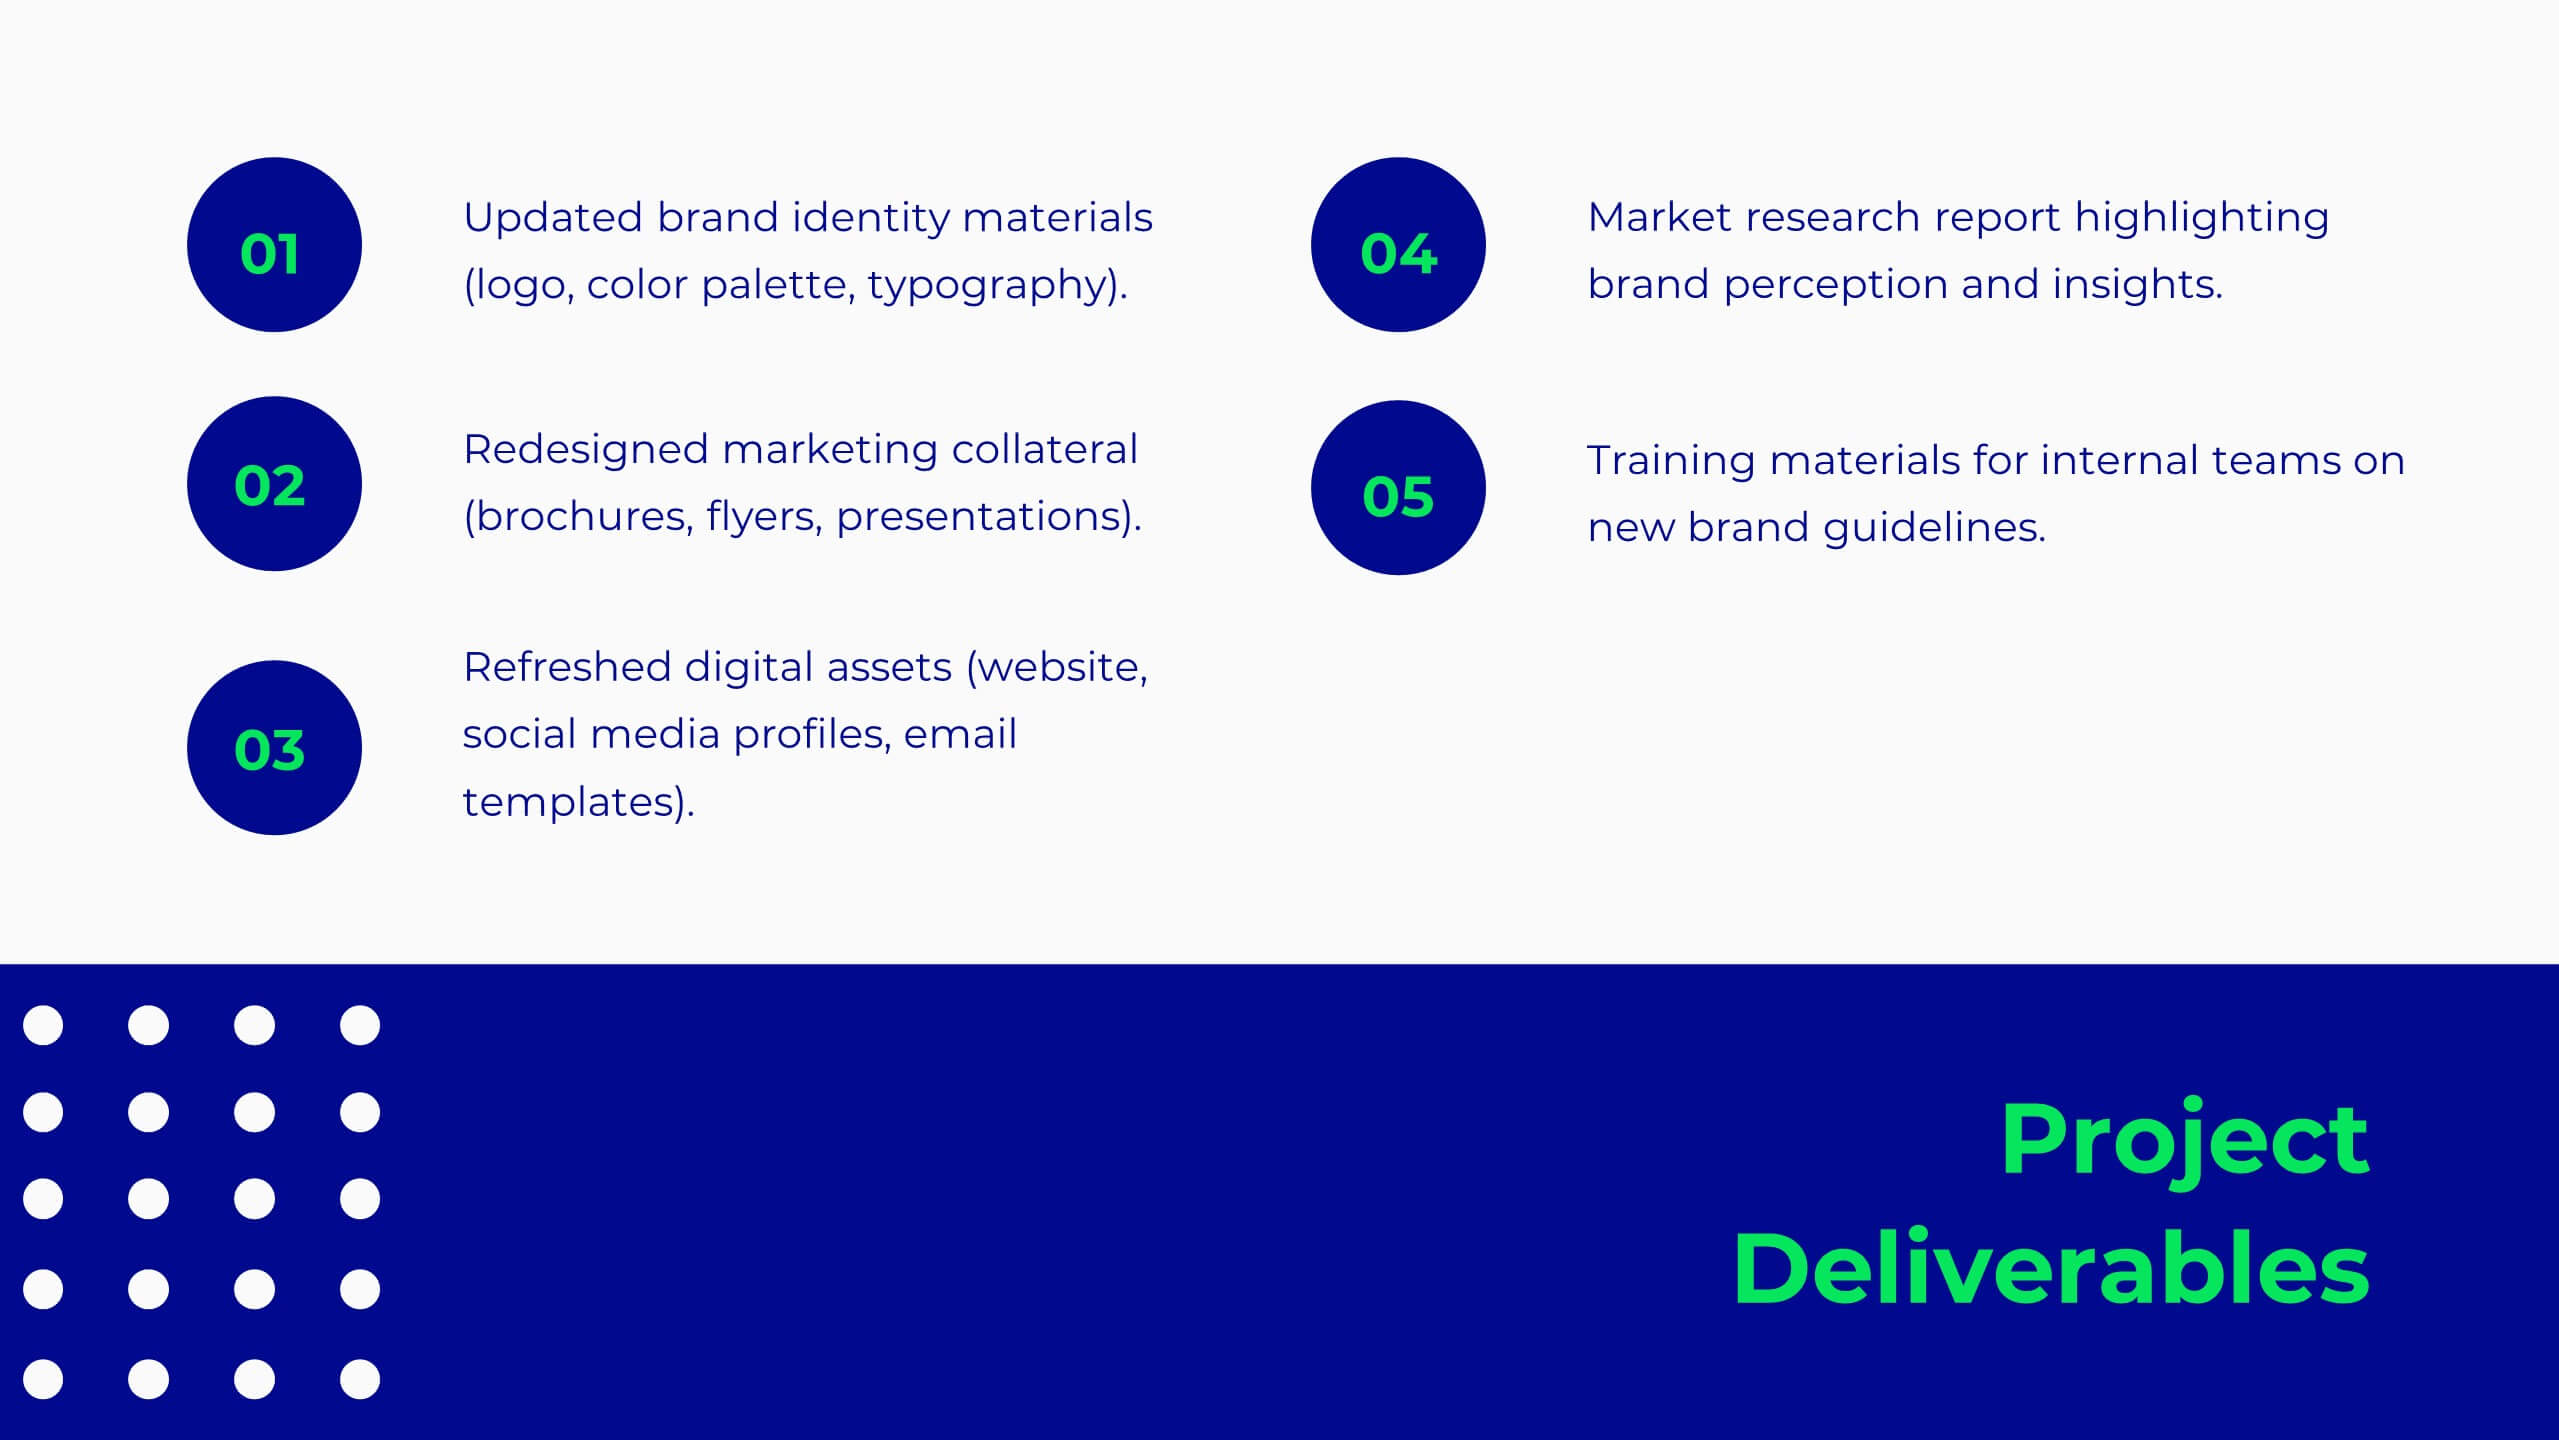
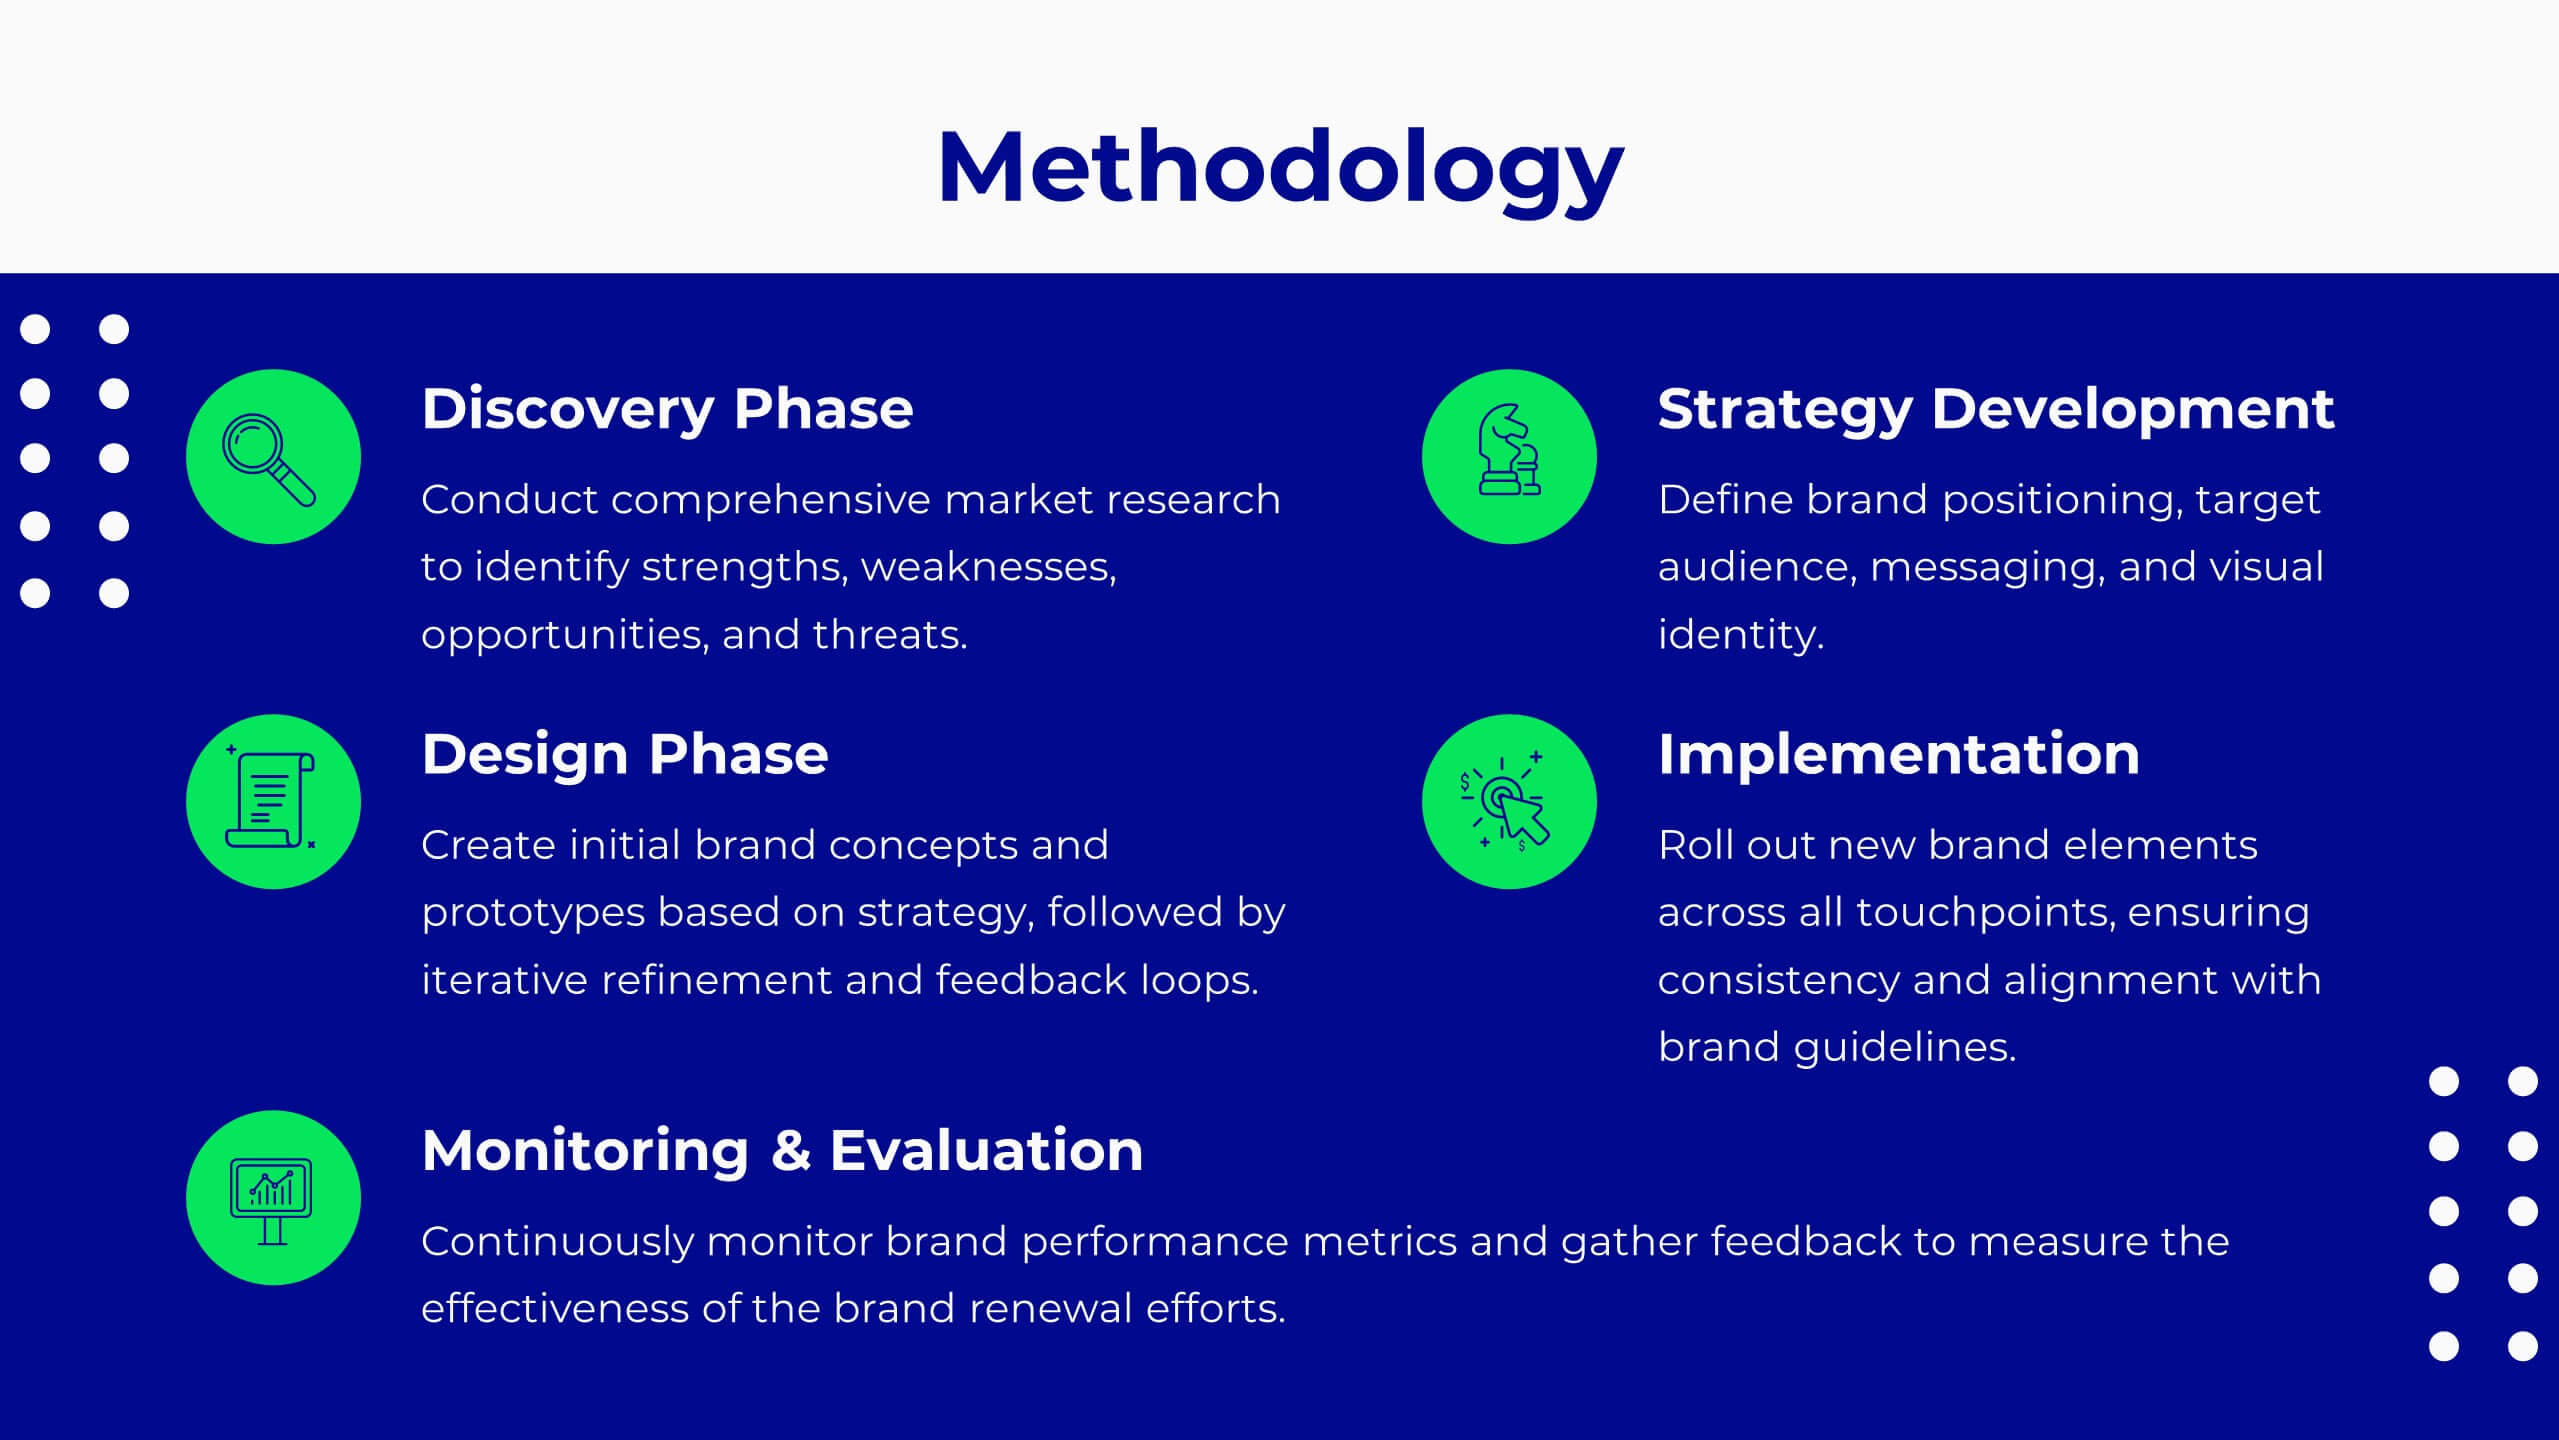
Flamelore Agile Project Plan Presentation
Organize and deliver your Agile Project Plan seamlessly with this dynamic presentation template. Designed to align with Agile principles, it features a comprehensive structure covering objectives, scope of work, and key deliverables. The template helps you outline a detailed project timeline and budget breakdown to keep stakeholders informed. Illustrate complex information with visual aids such as pyramids, charts, and process diagrams, making data interpretation effortless. Highlight team members, their roles, and responsibilities to foster transparency and accountability. With slides dedicated to risk assessment and evaluation criteria, you can confidently navigate potential challenges. This fully editable template works across PowerPoint, Google Slides, and Keynote, providing flexibility and a polished design for project managers, teams, and business professionals. Whether you're pitching to stakeholders or aligning your team, this Agile framework ensures clear communication and actionable steps.

21 diapositivas
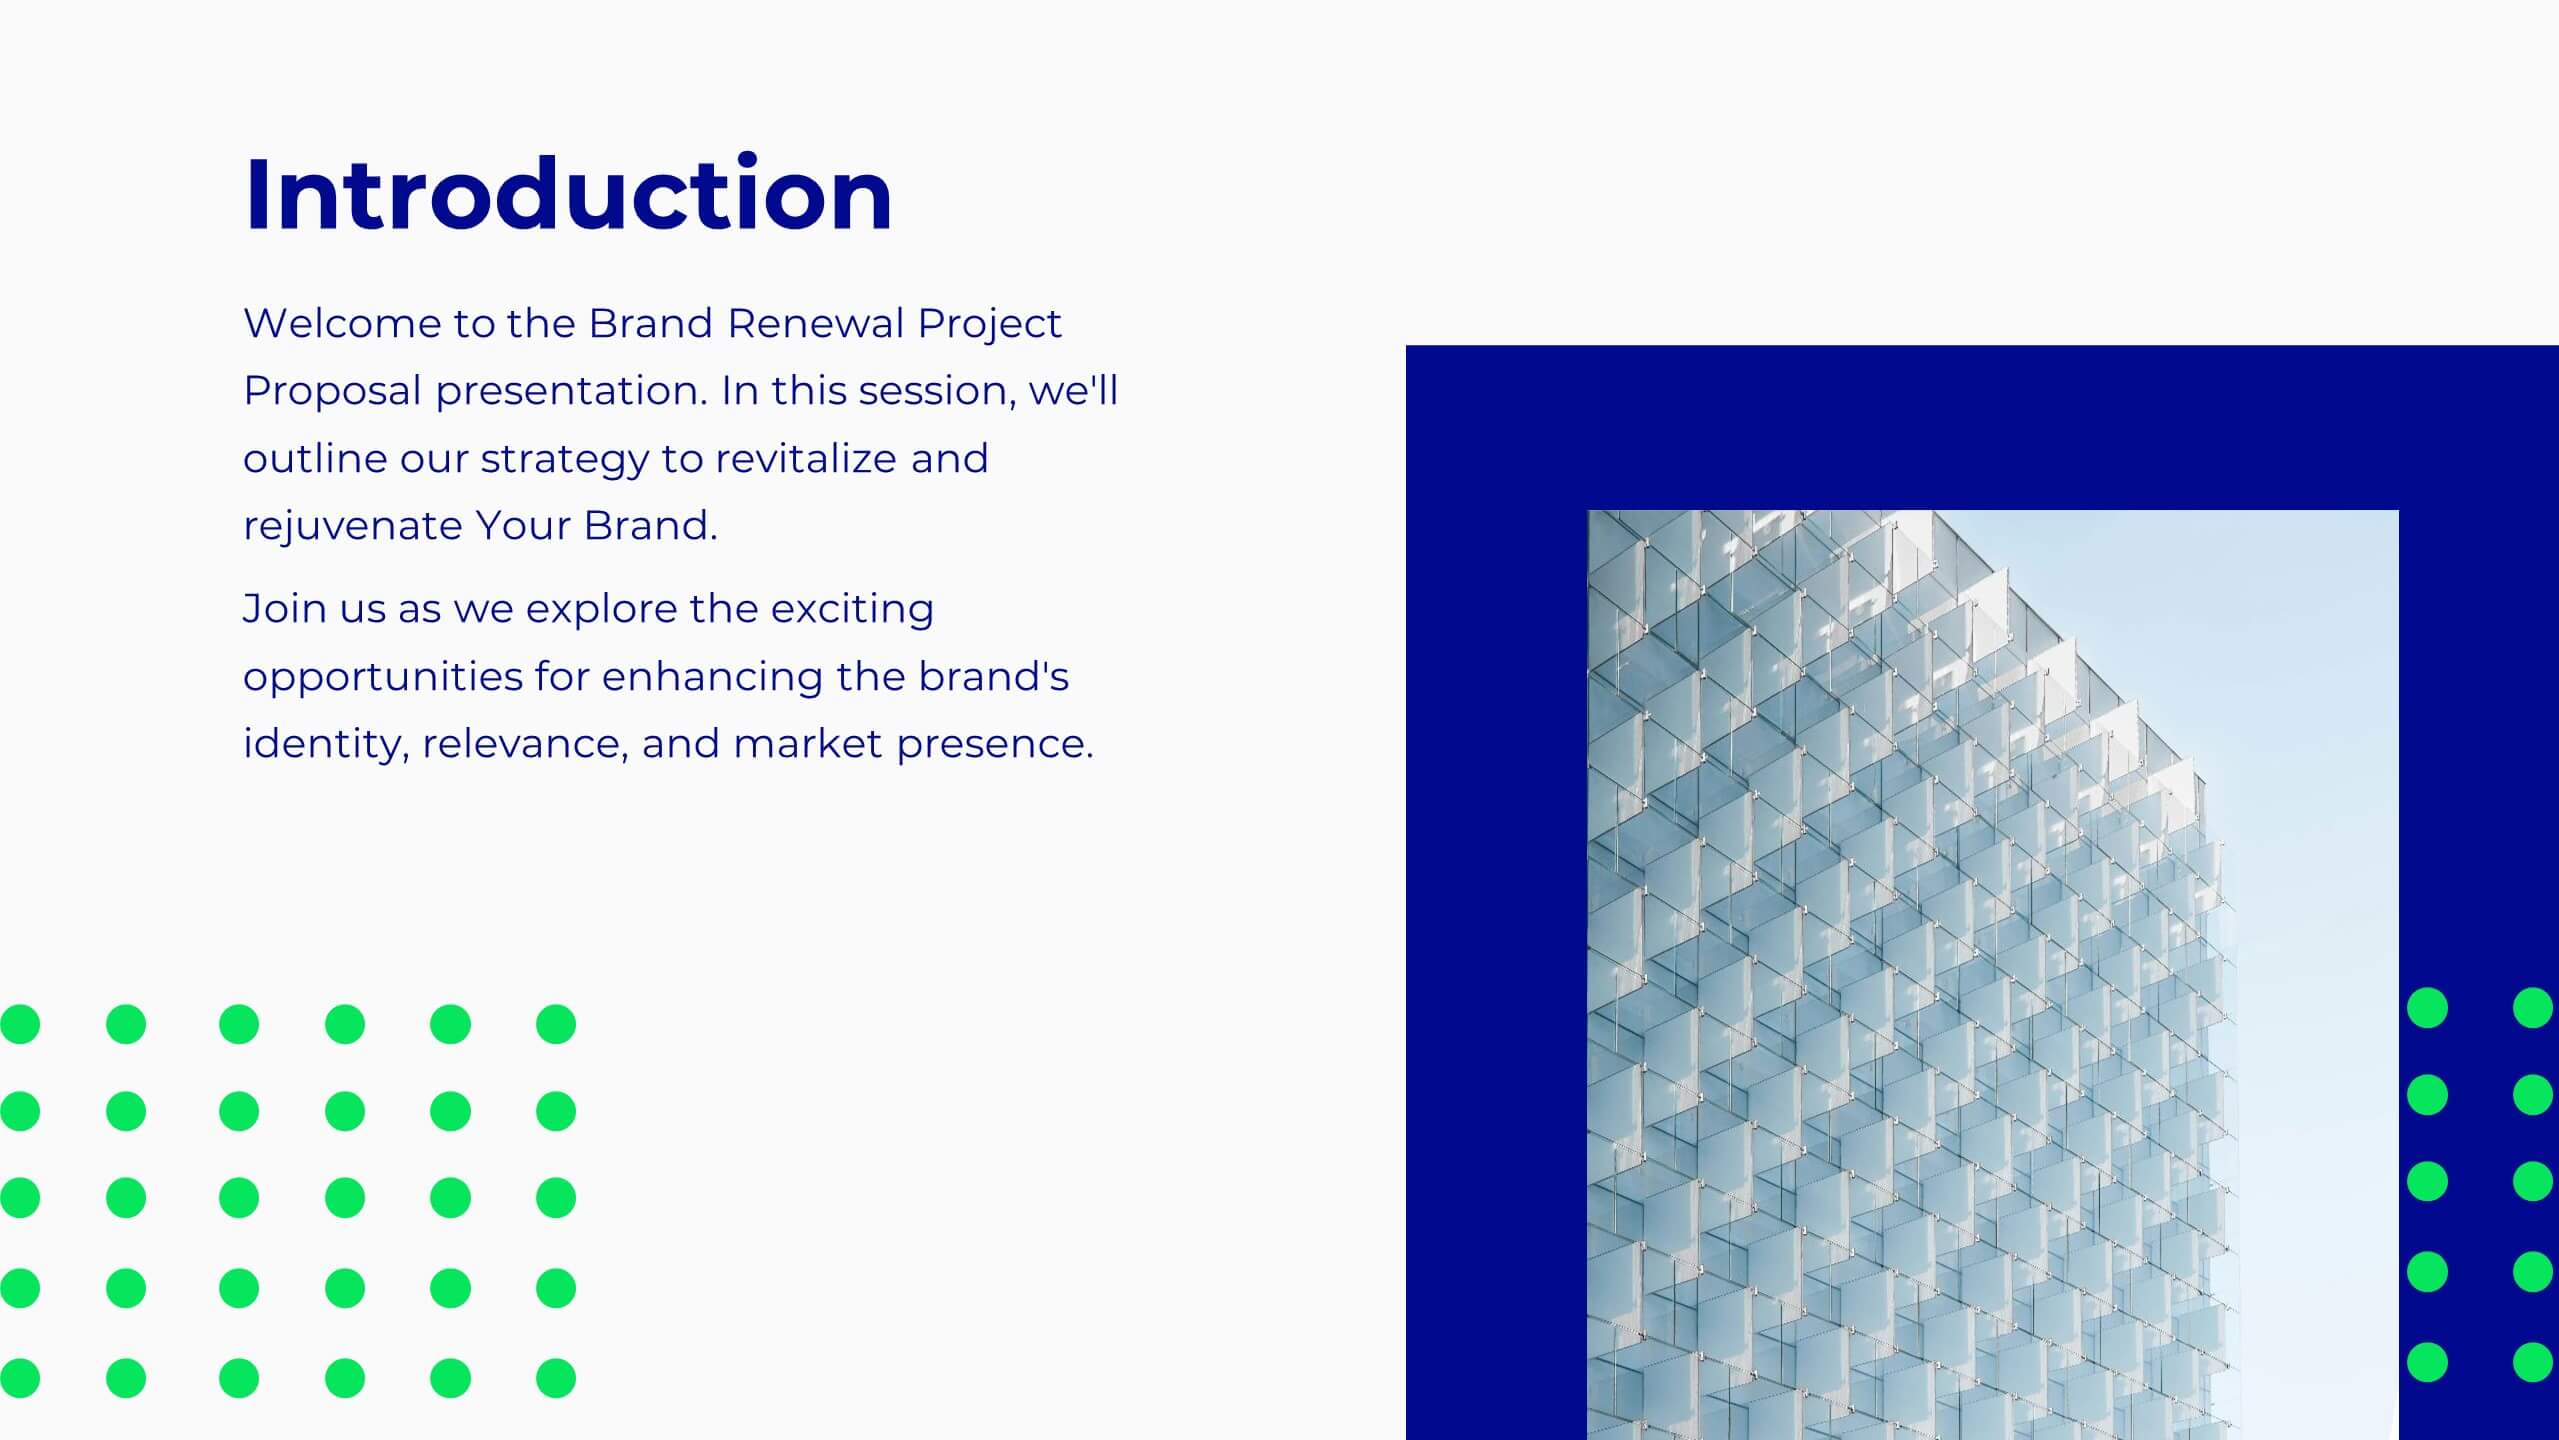
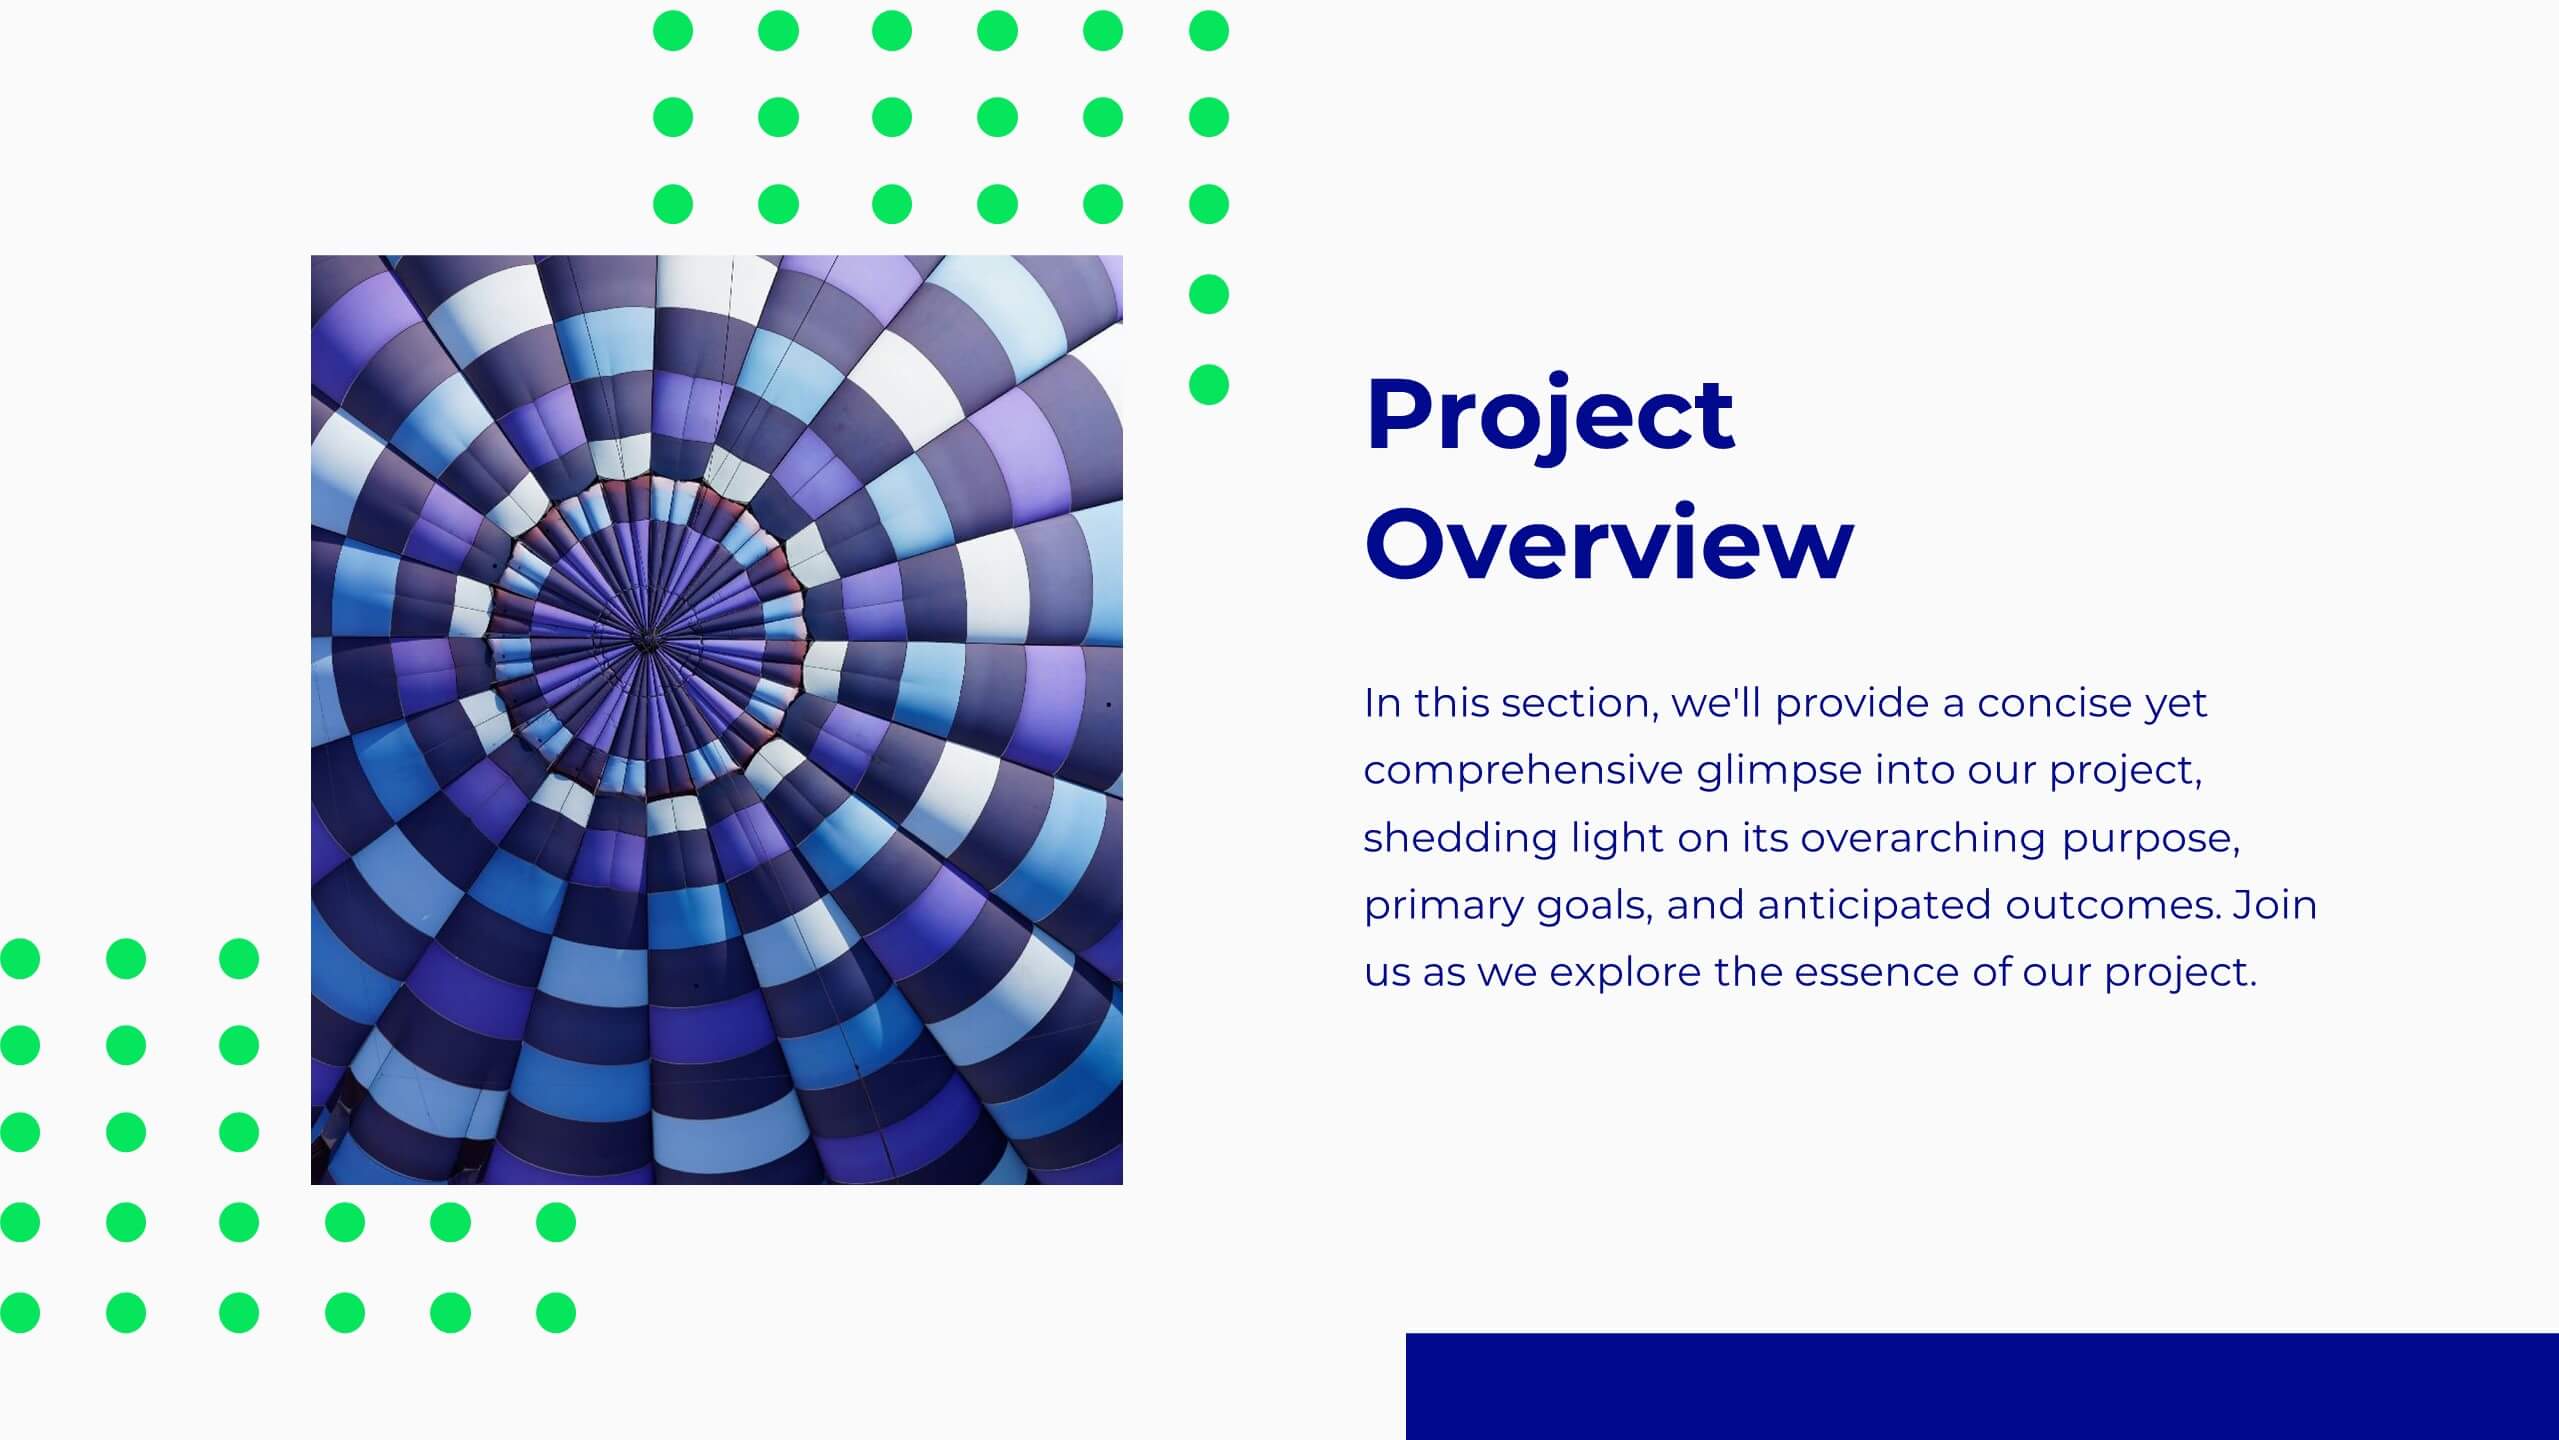
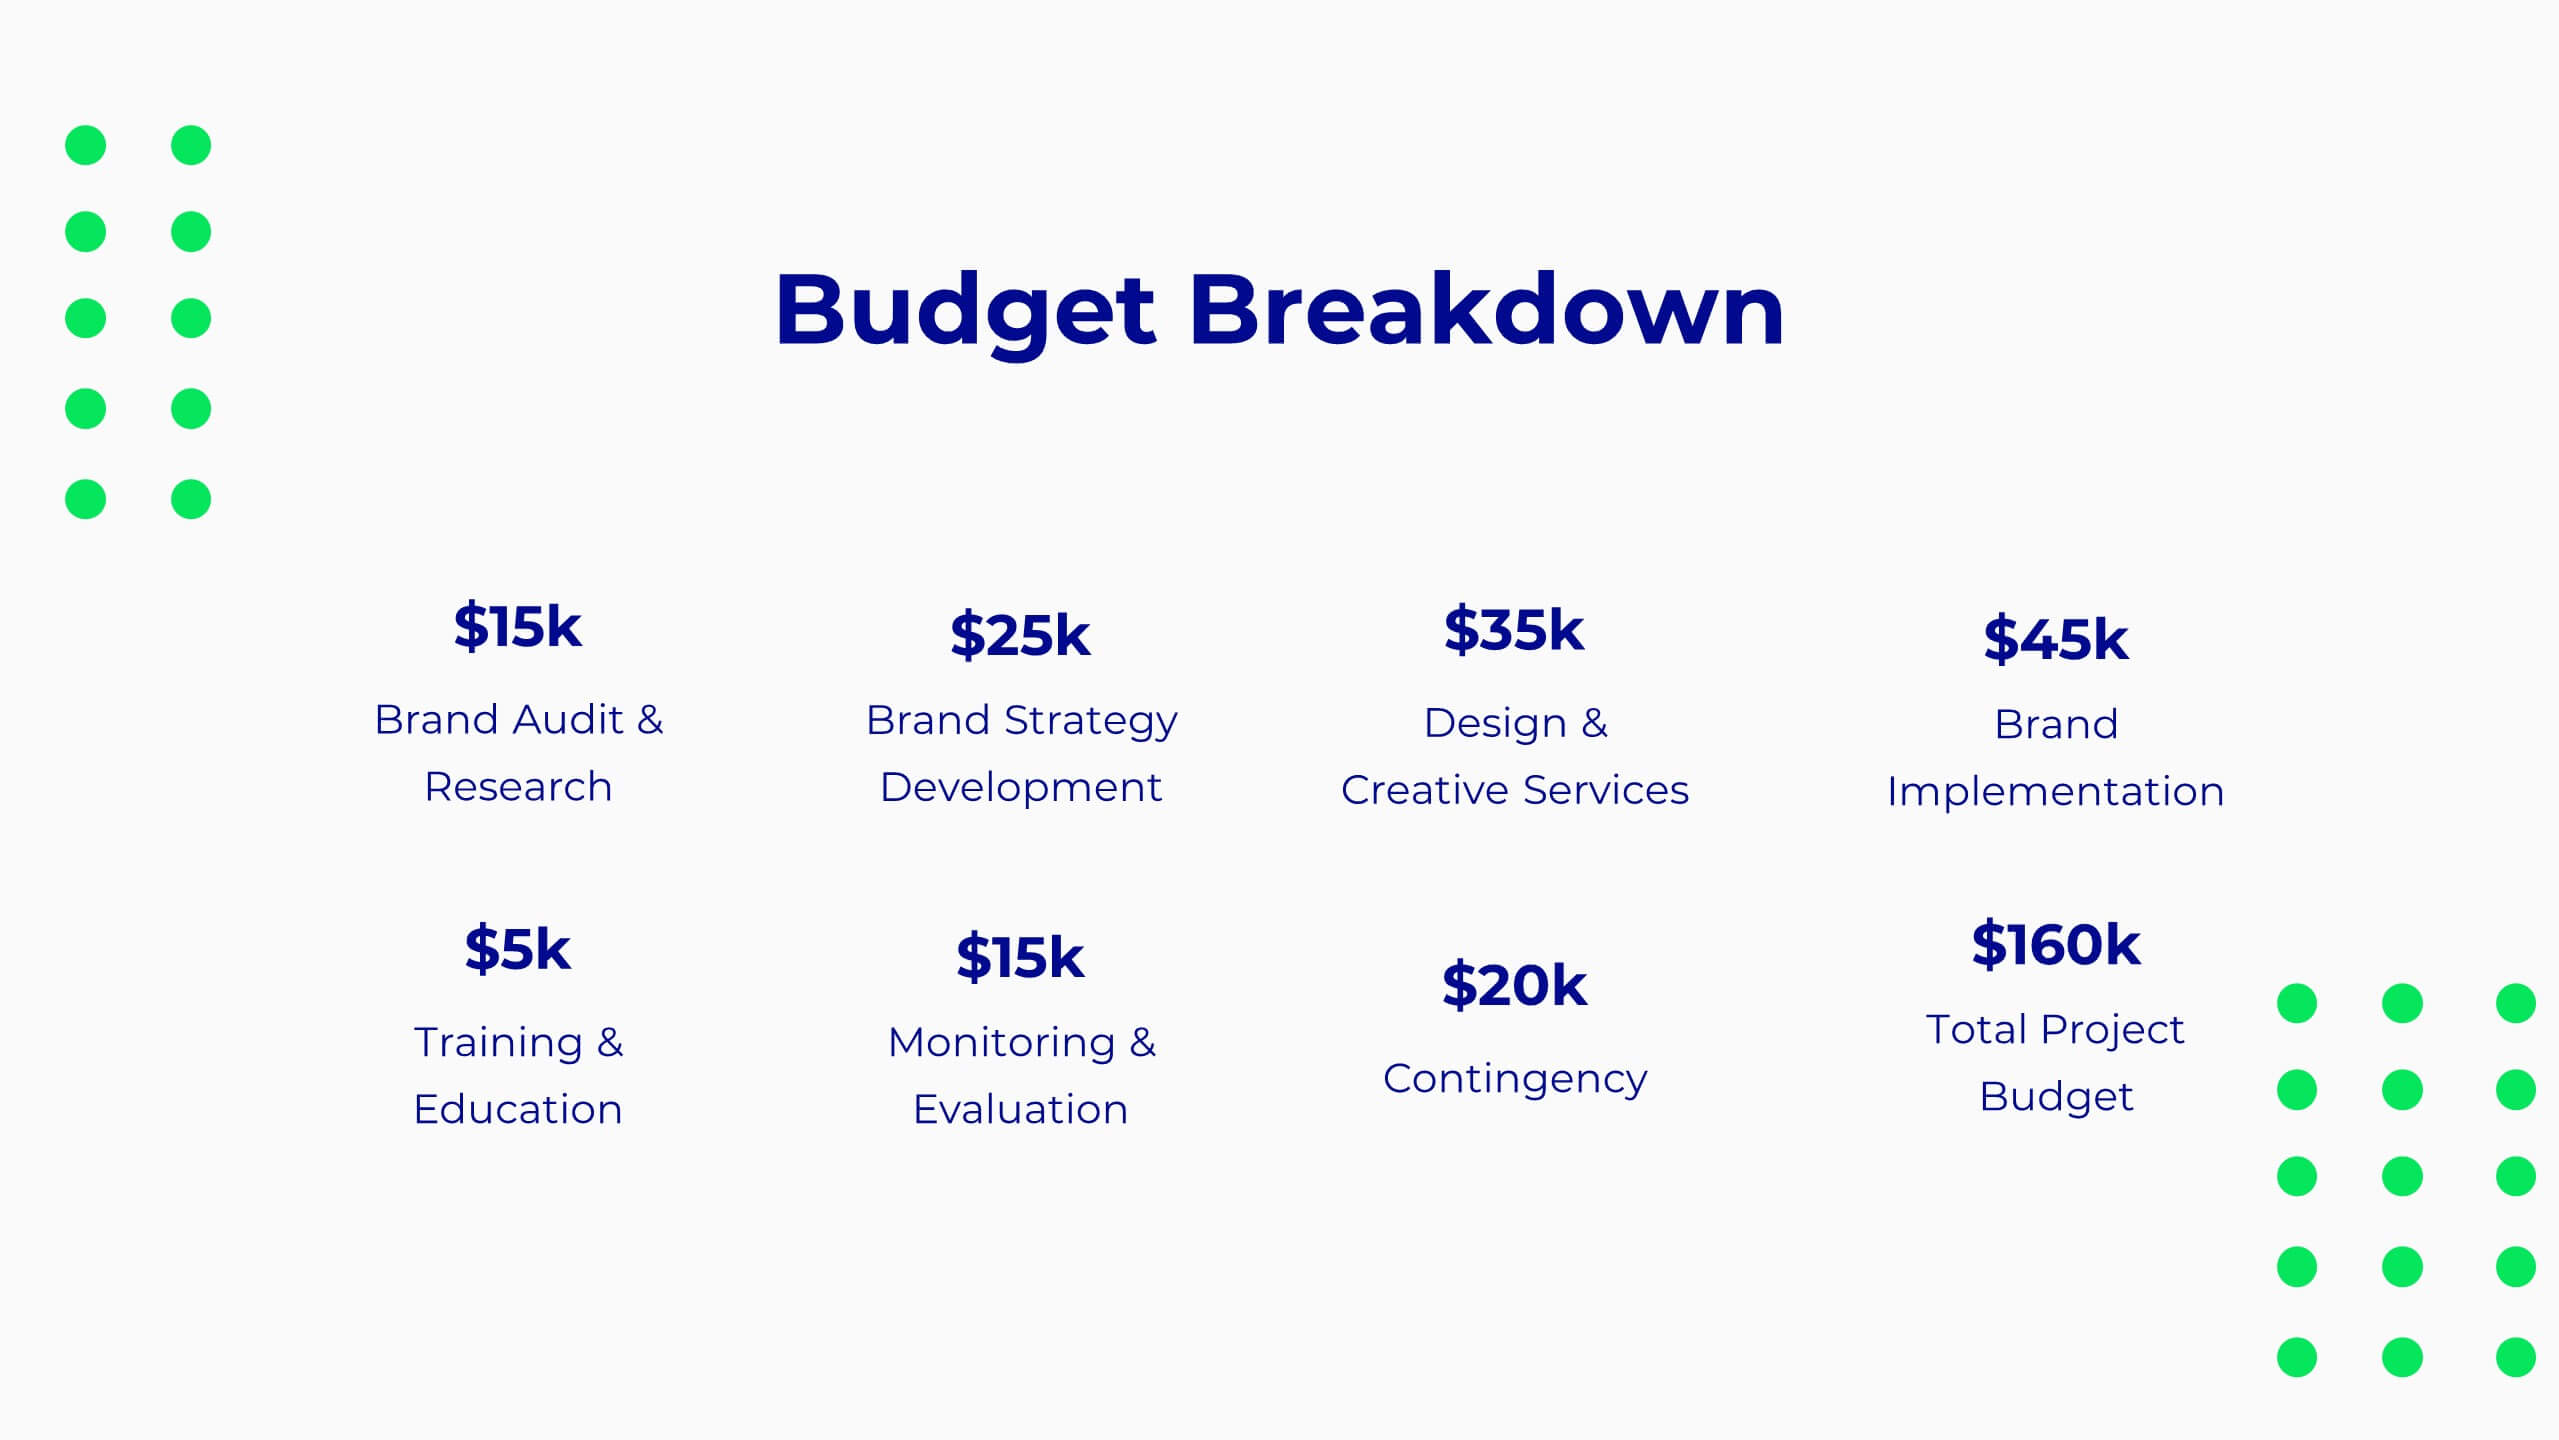
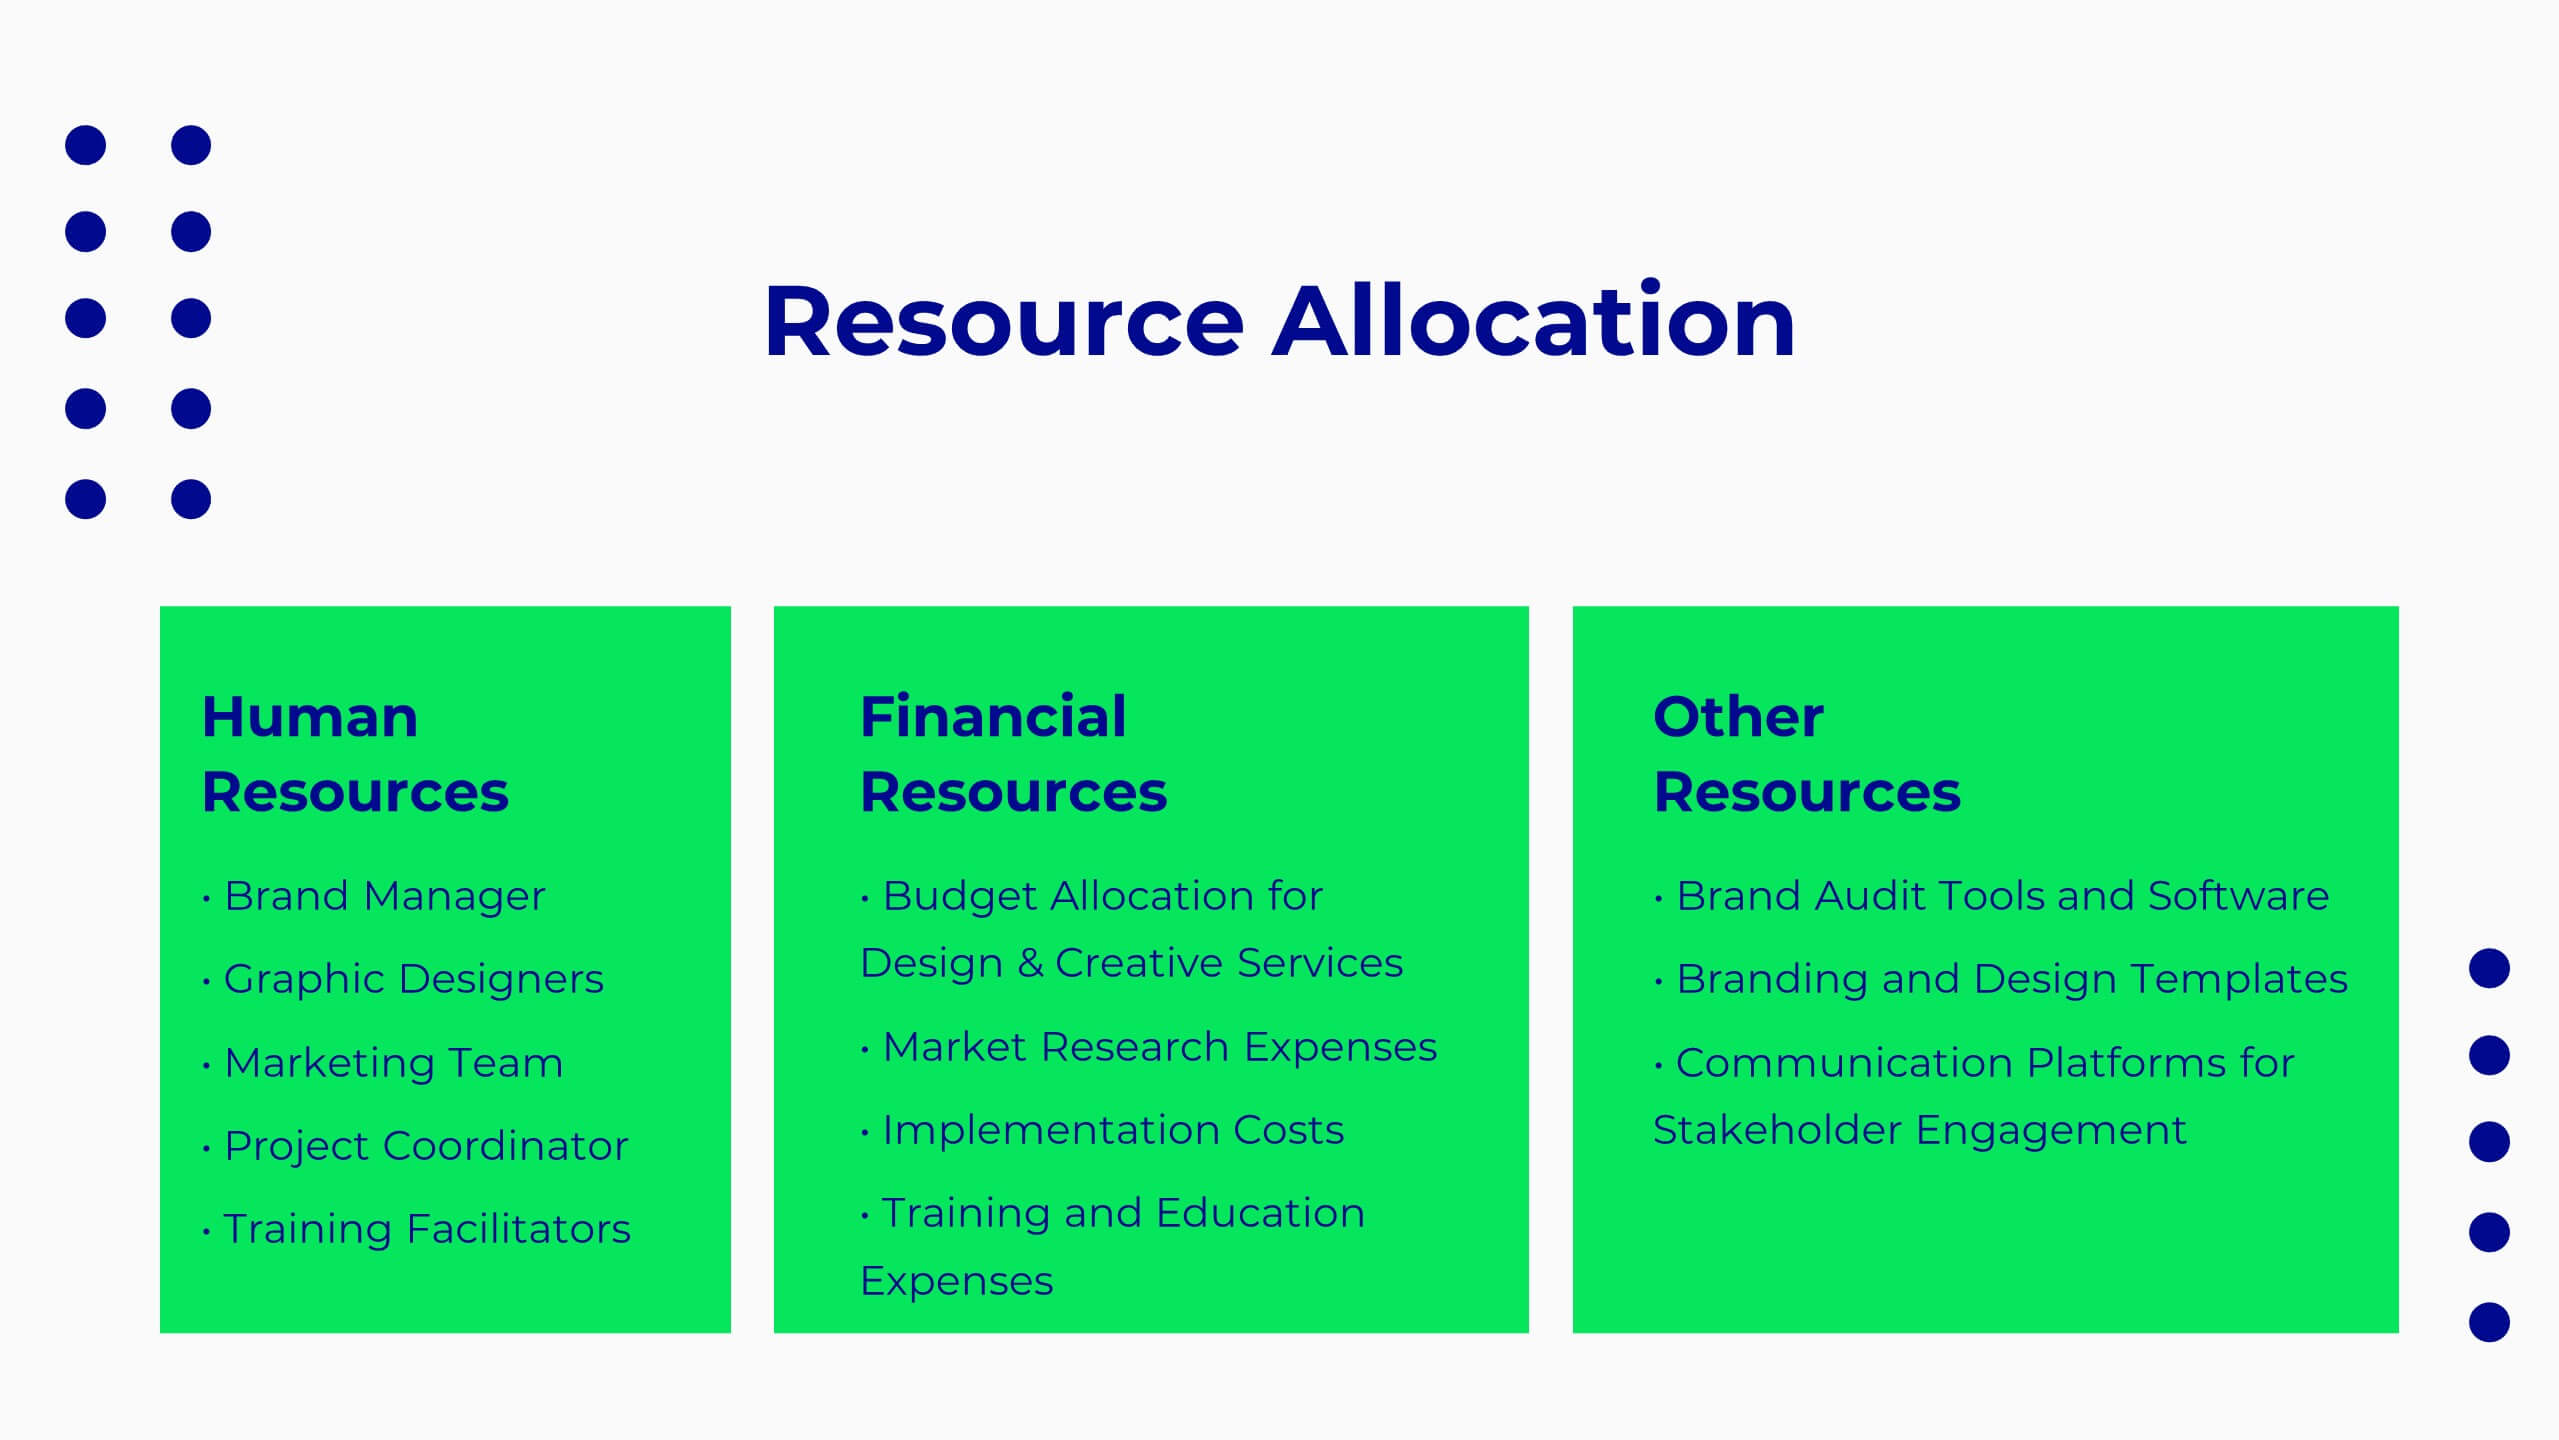
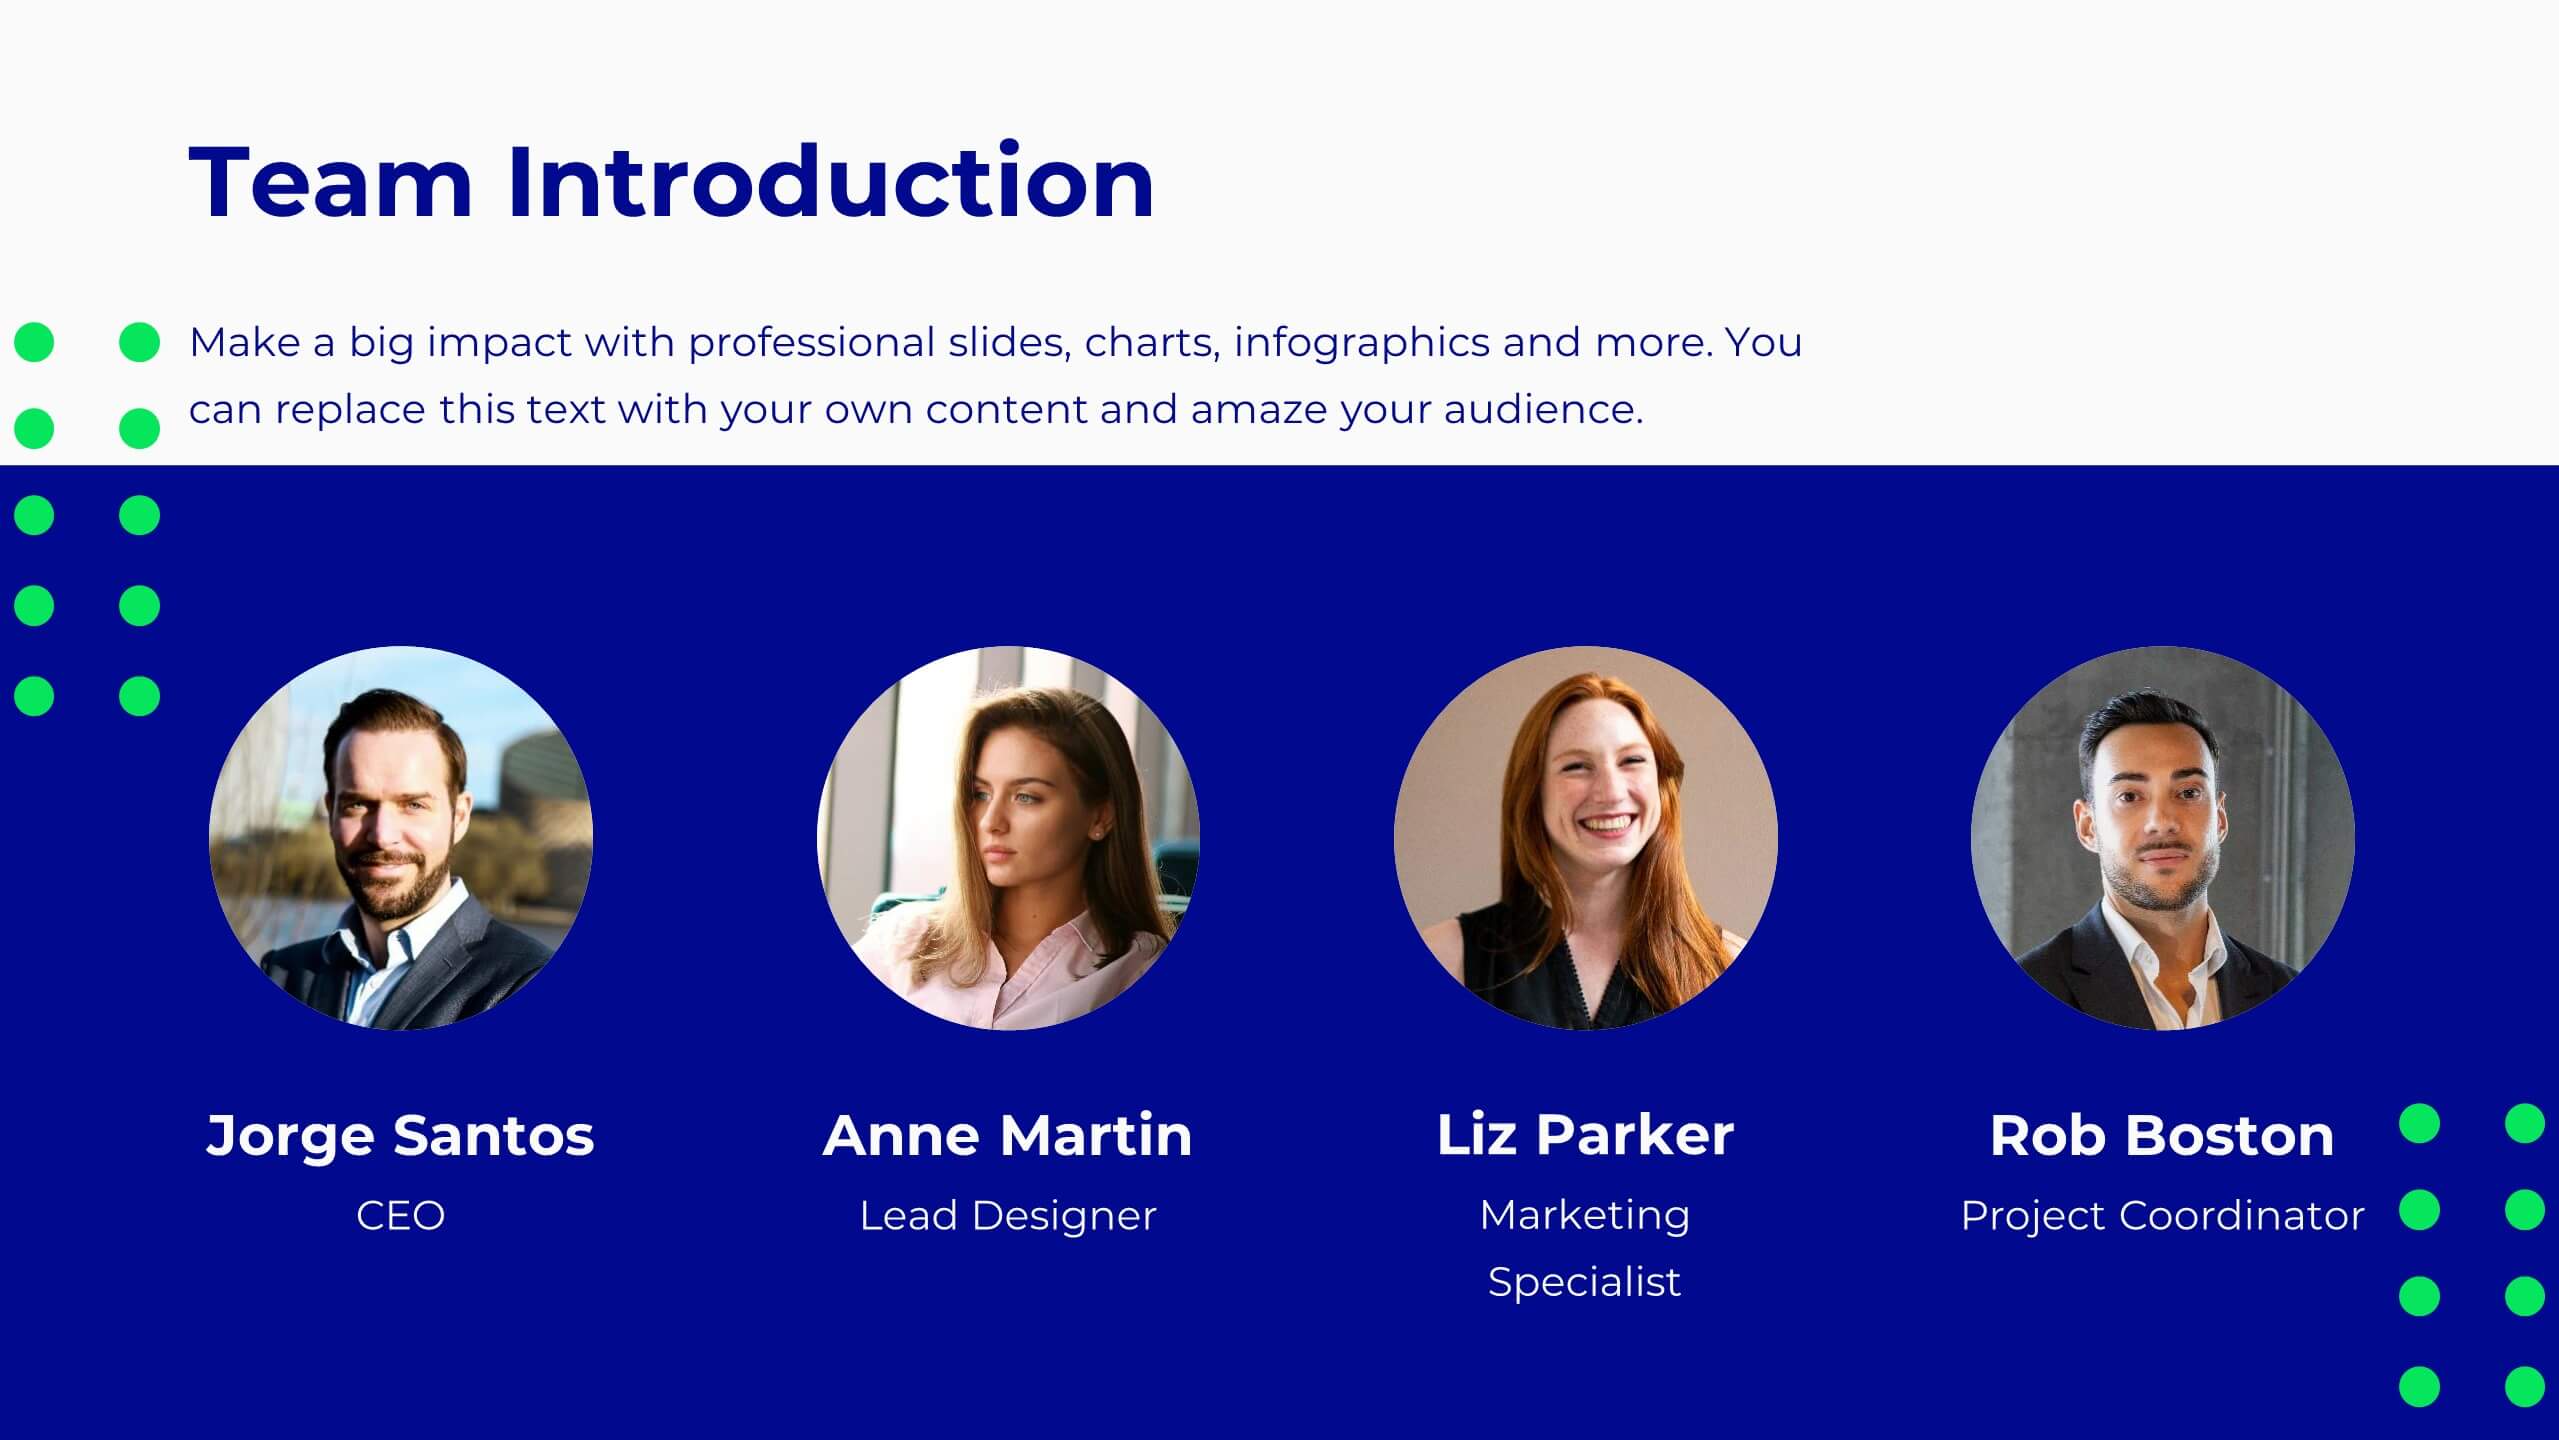
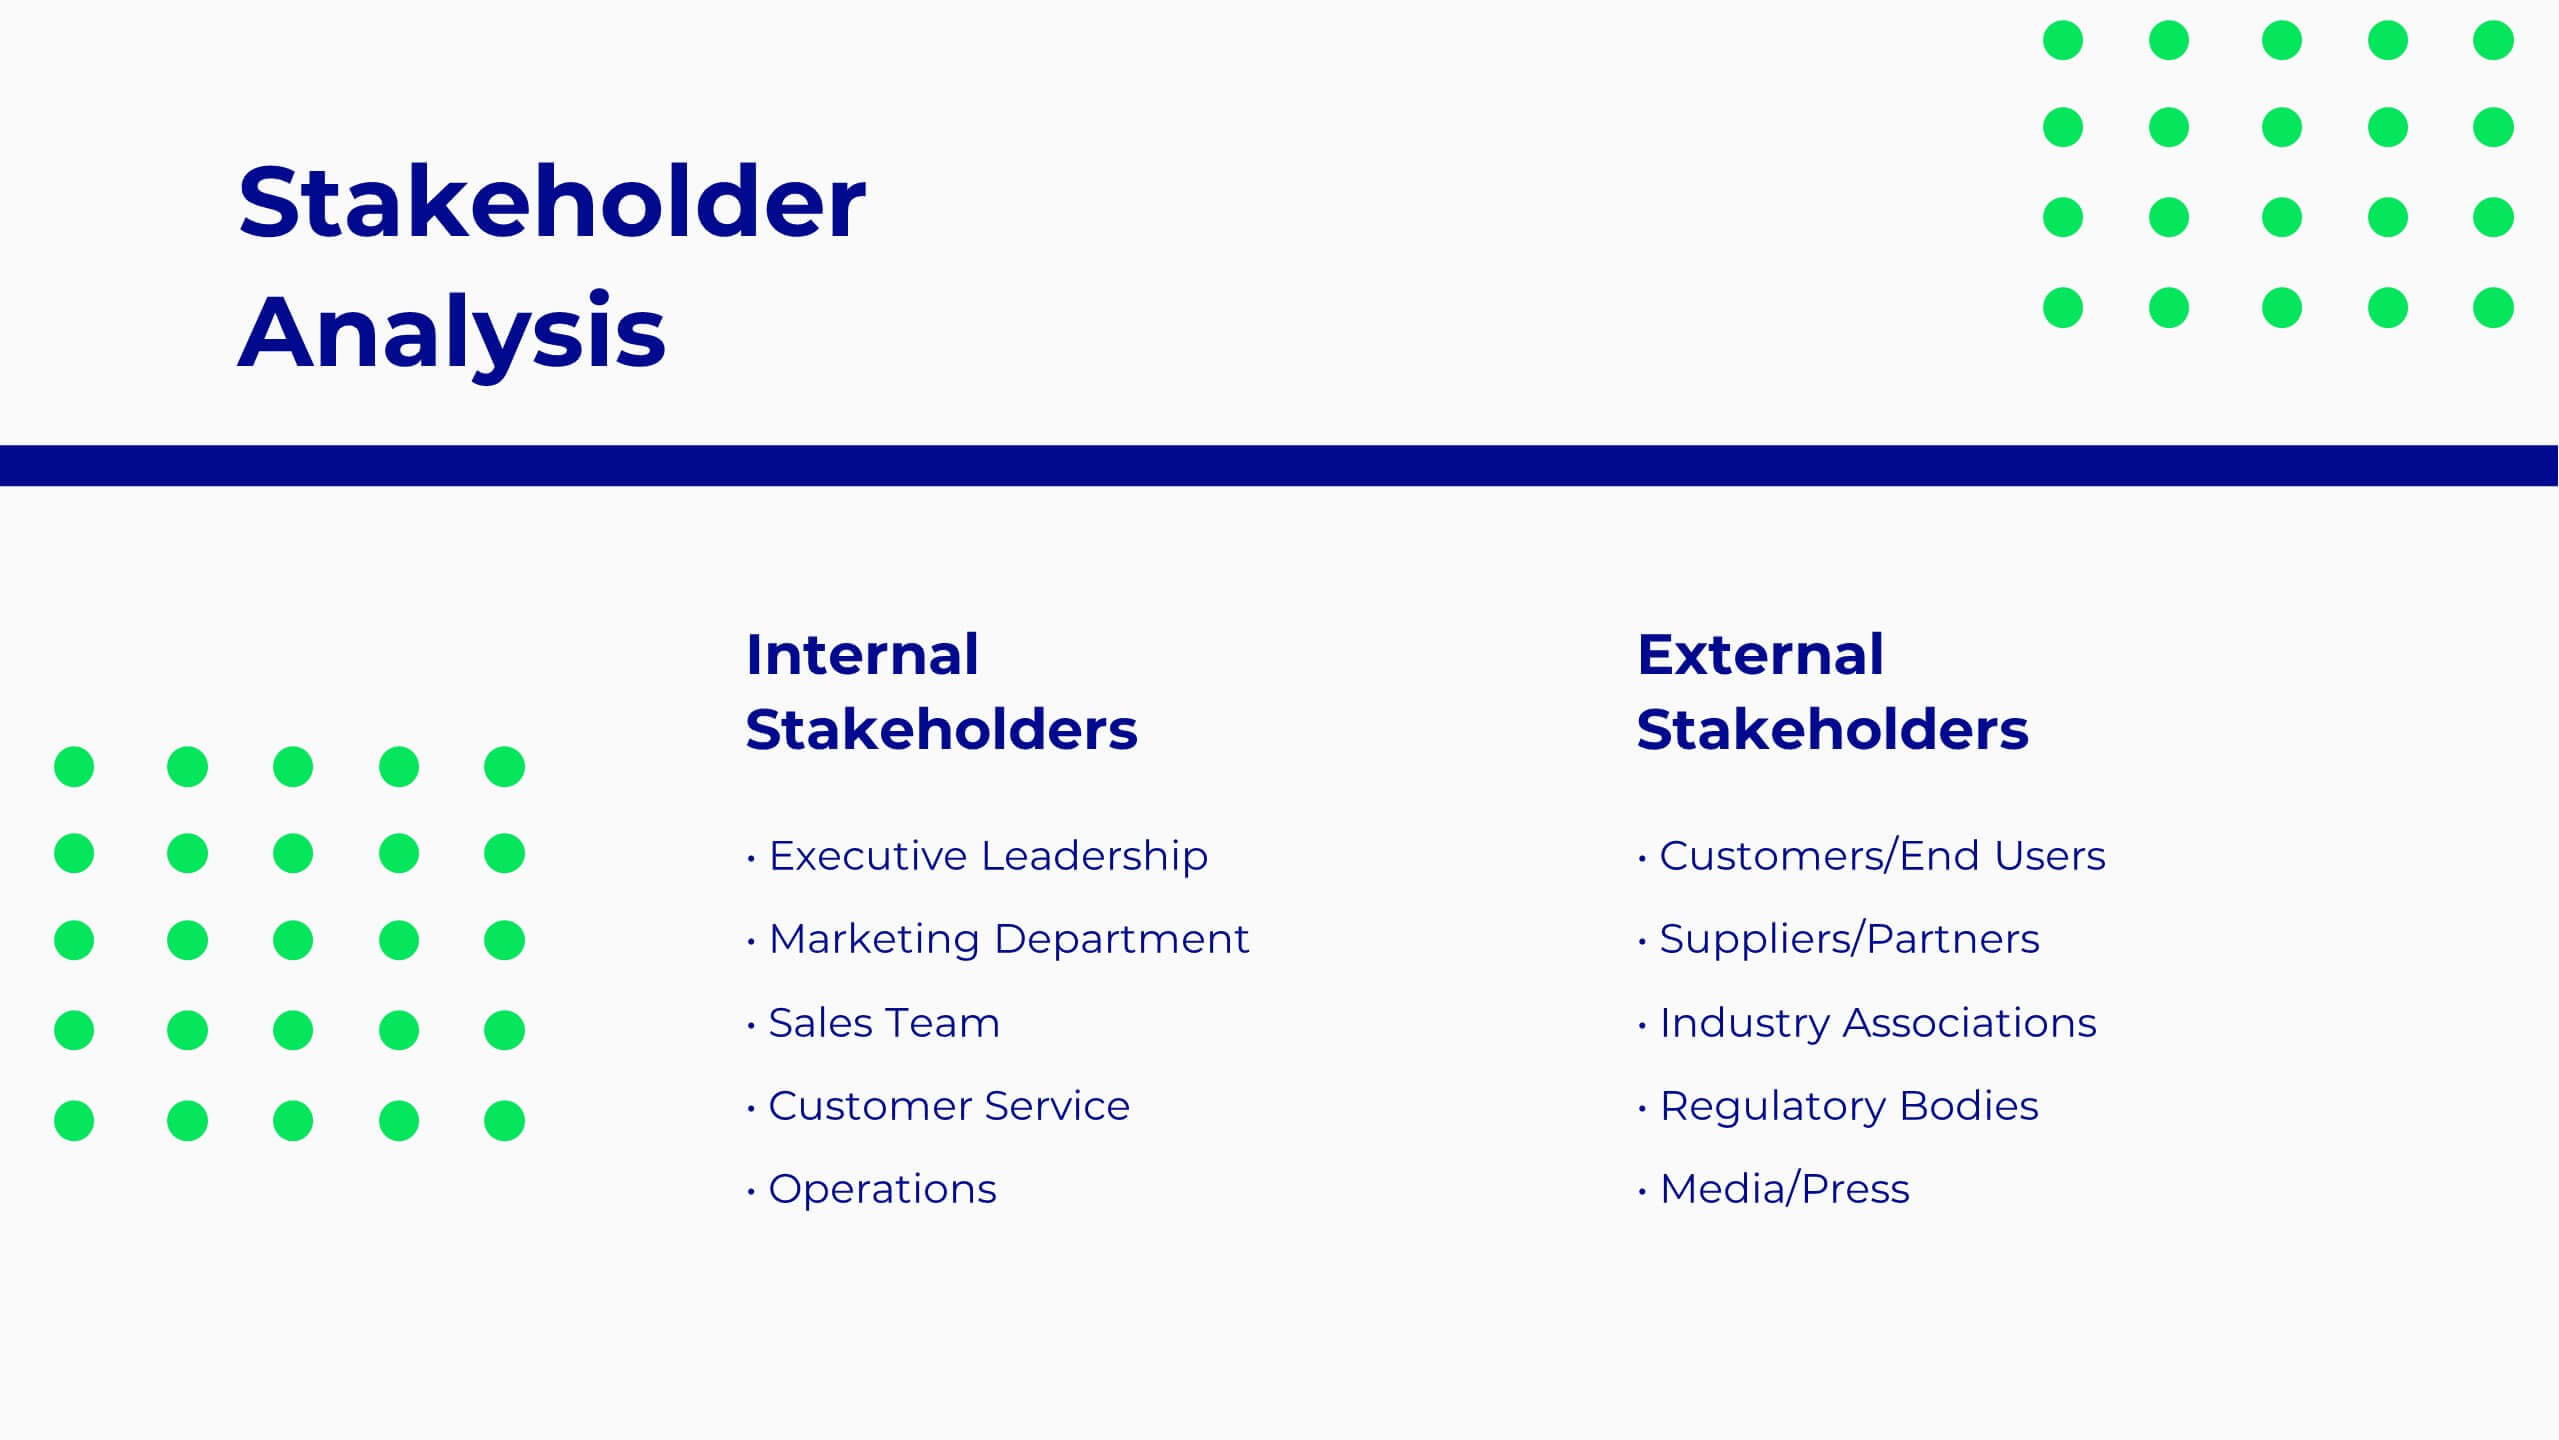
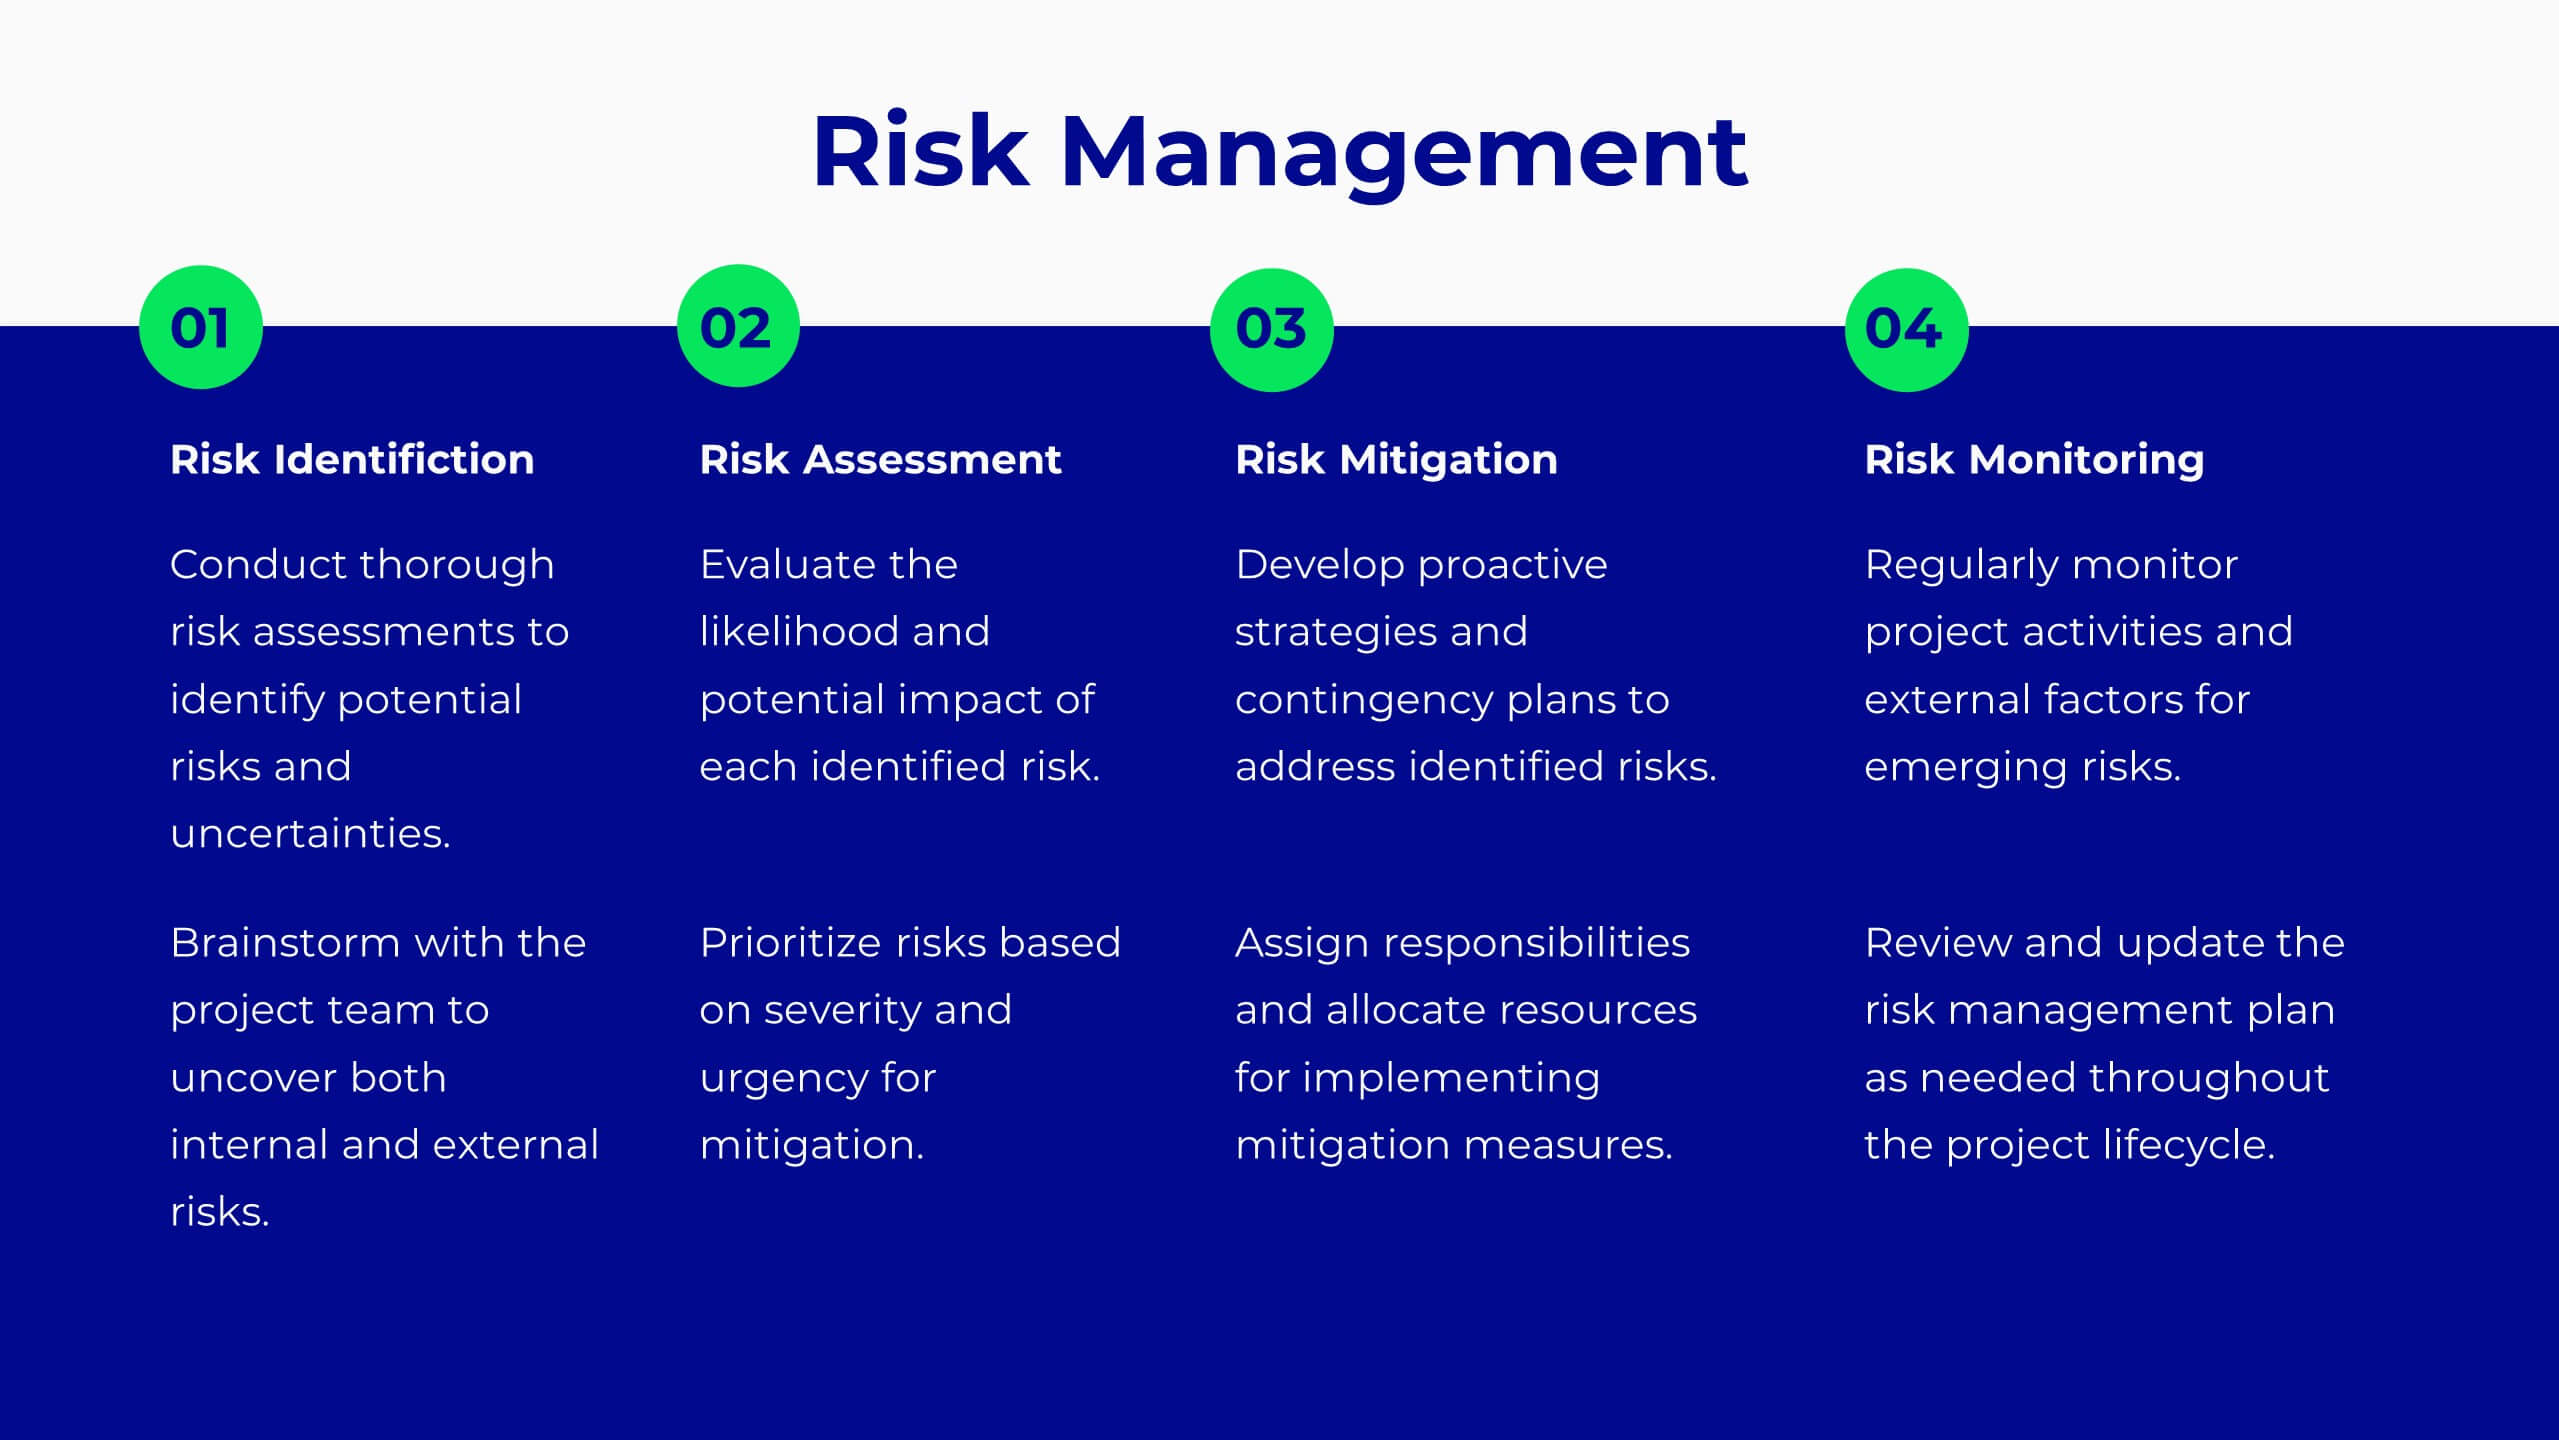
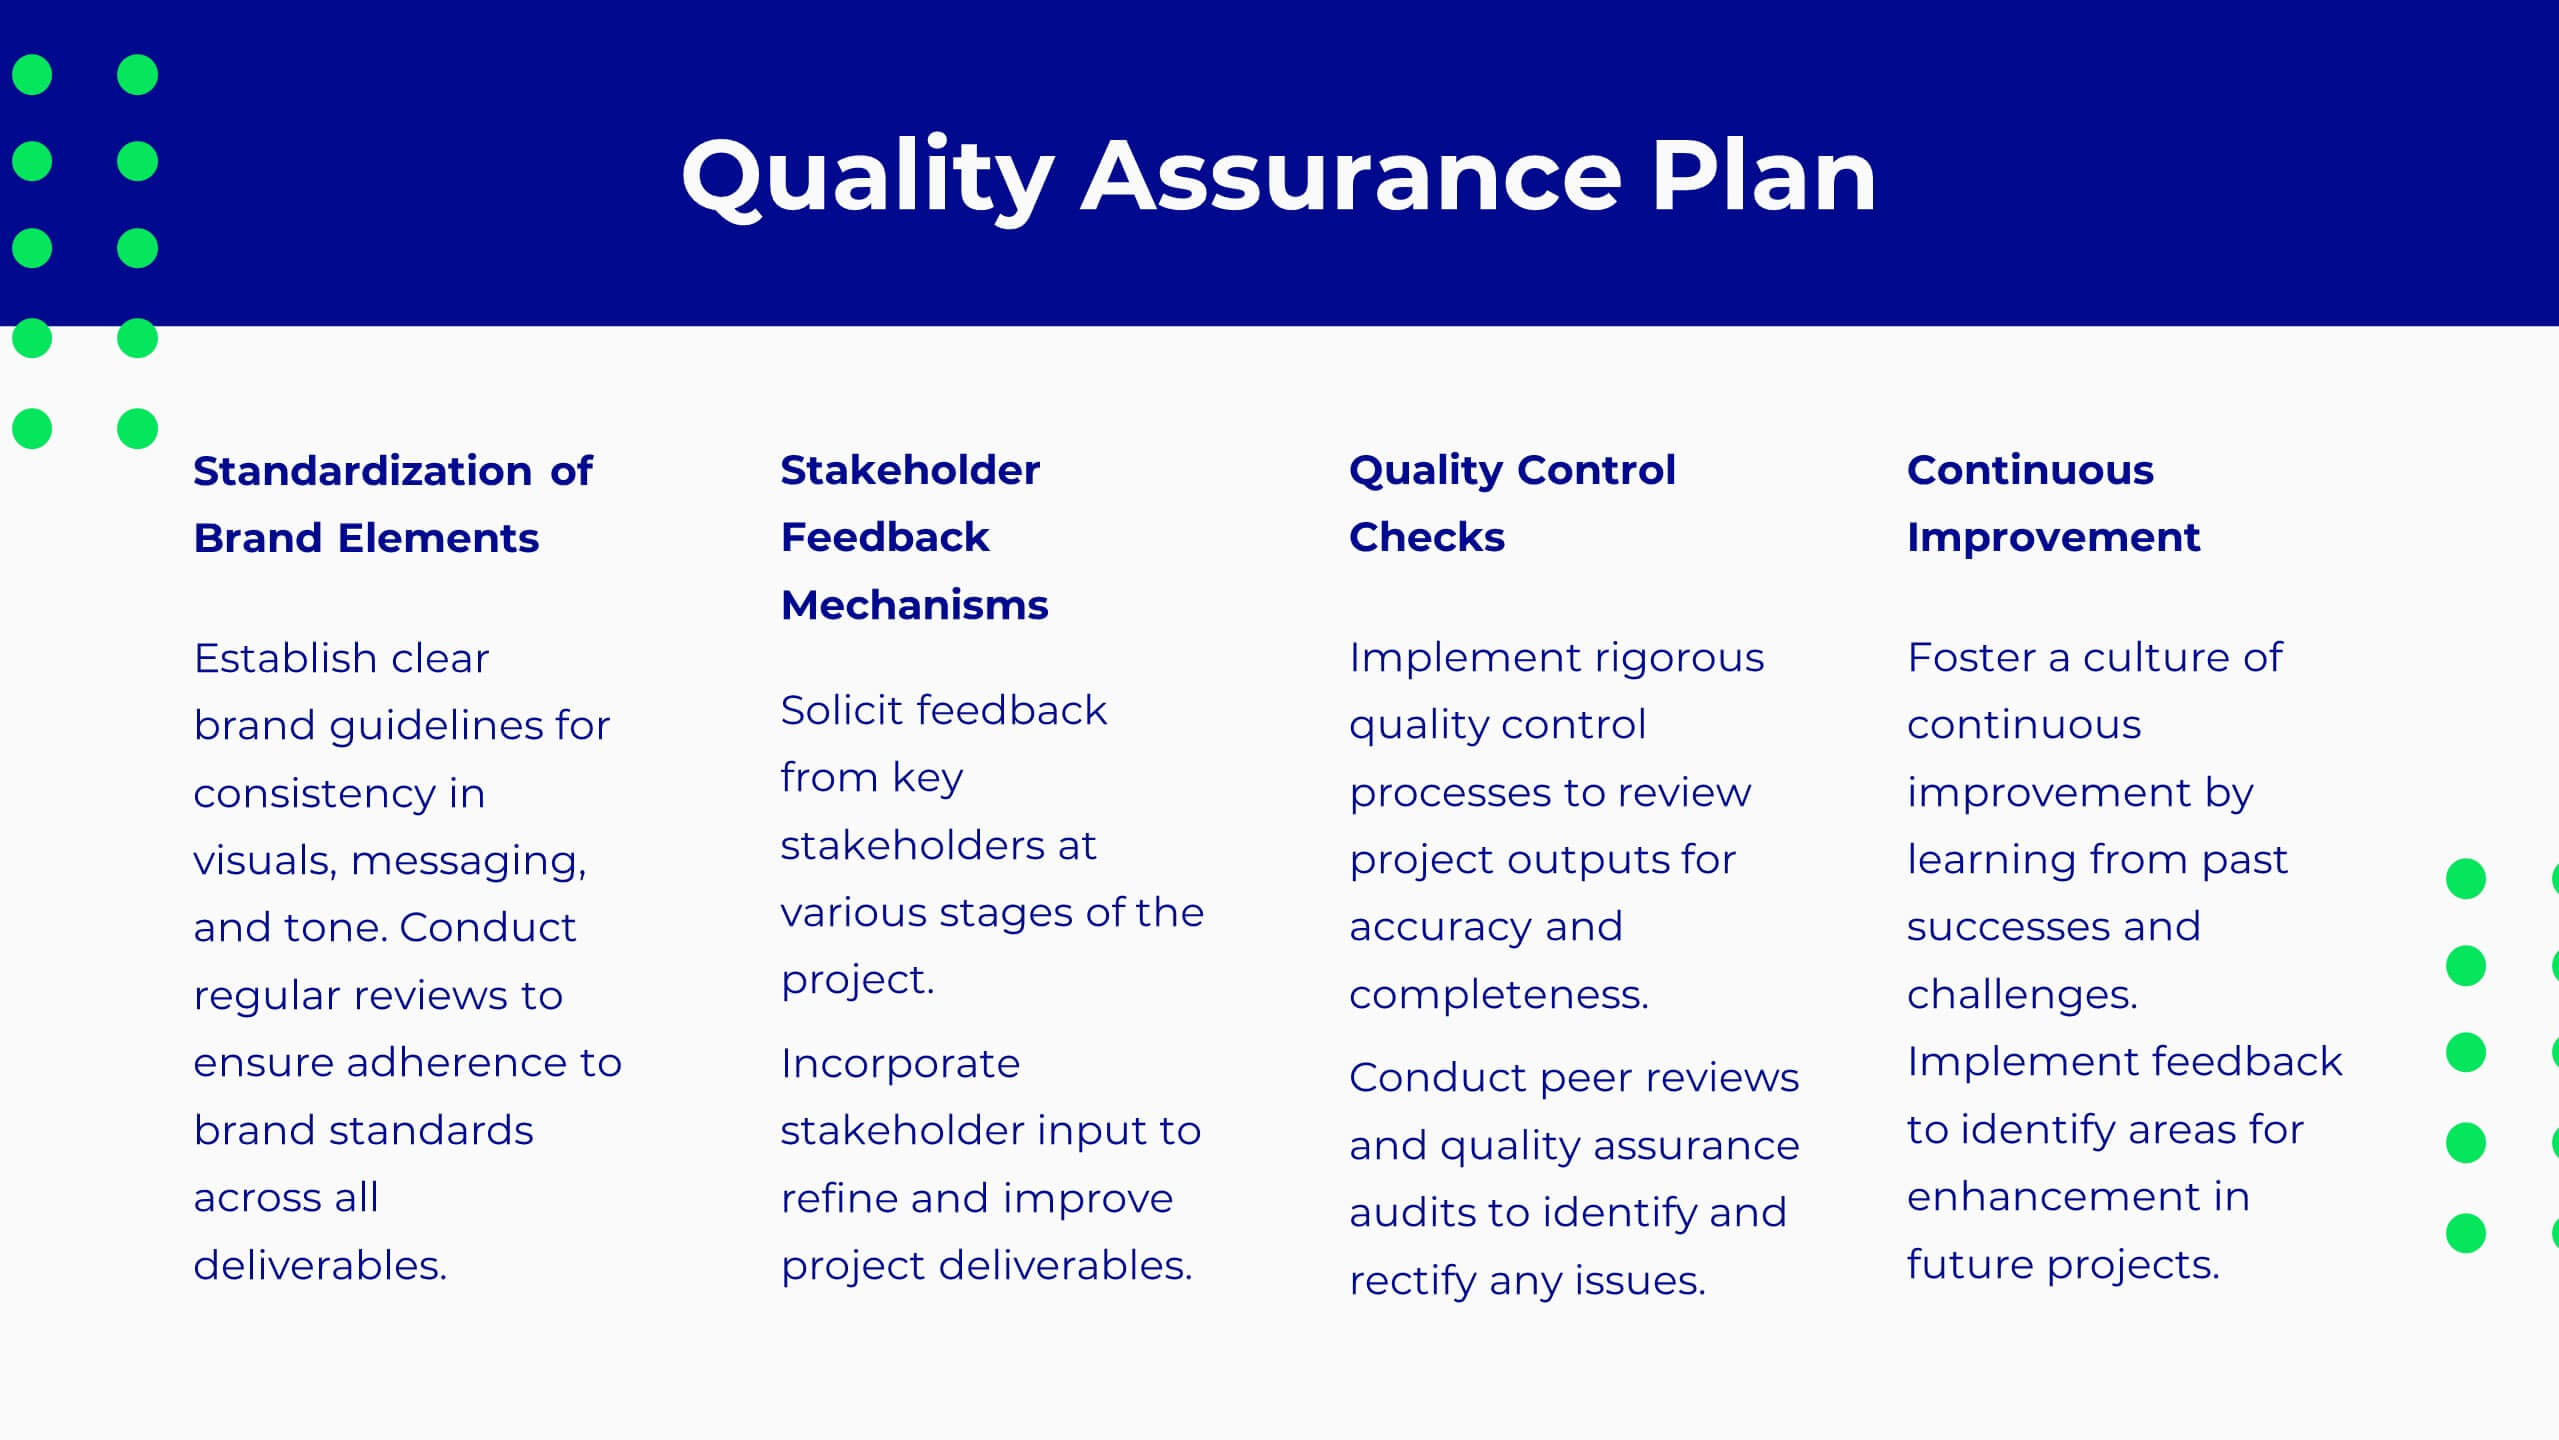
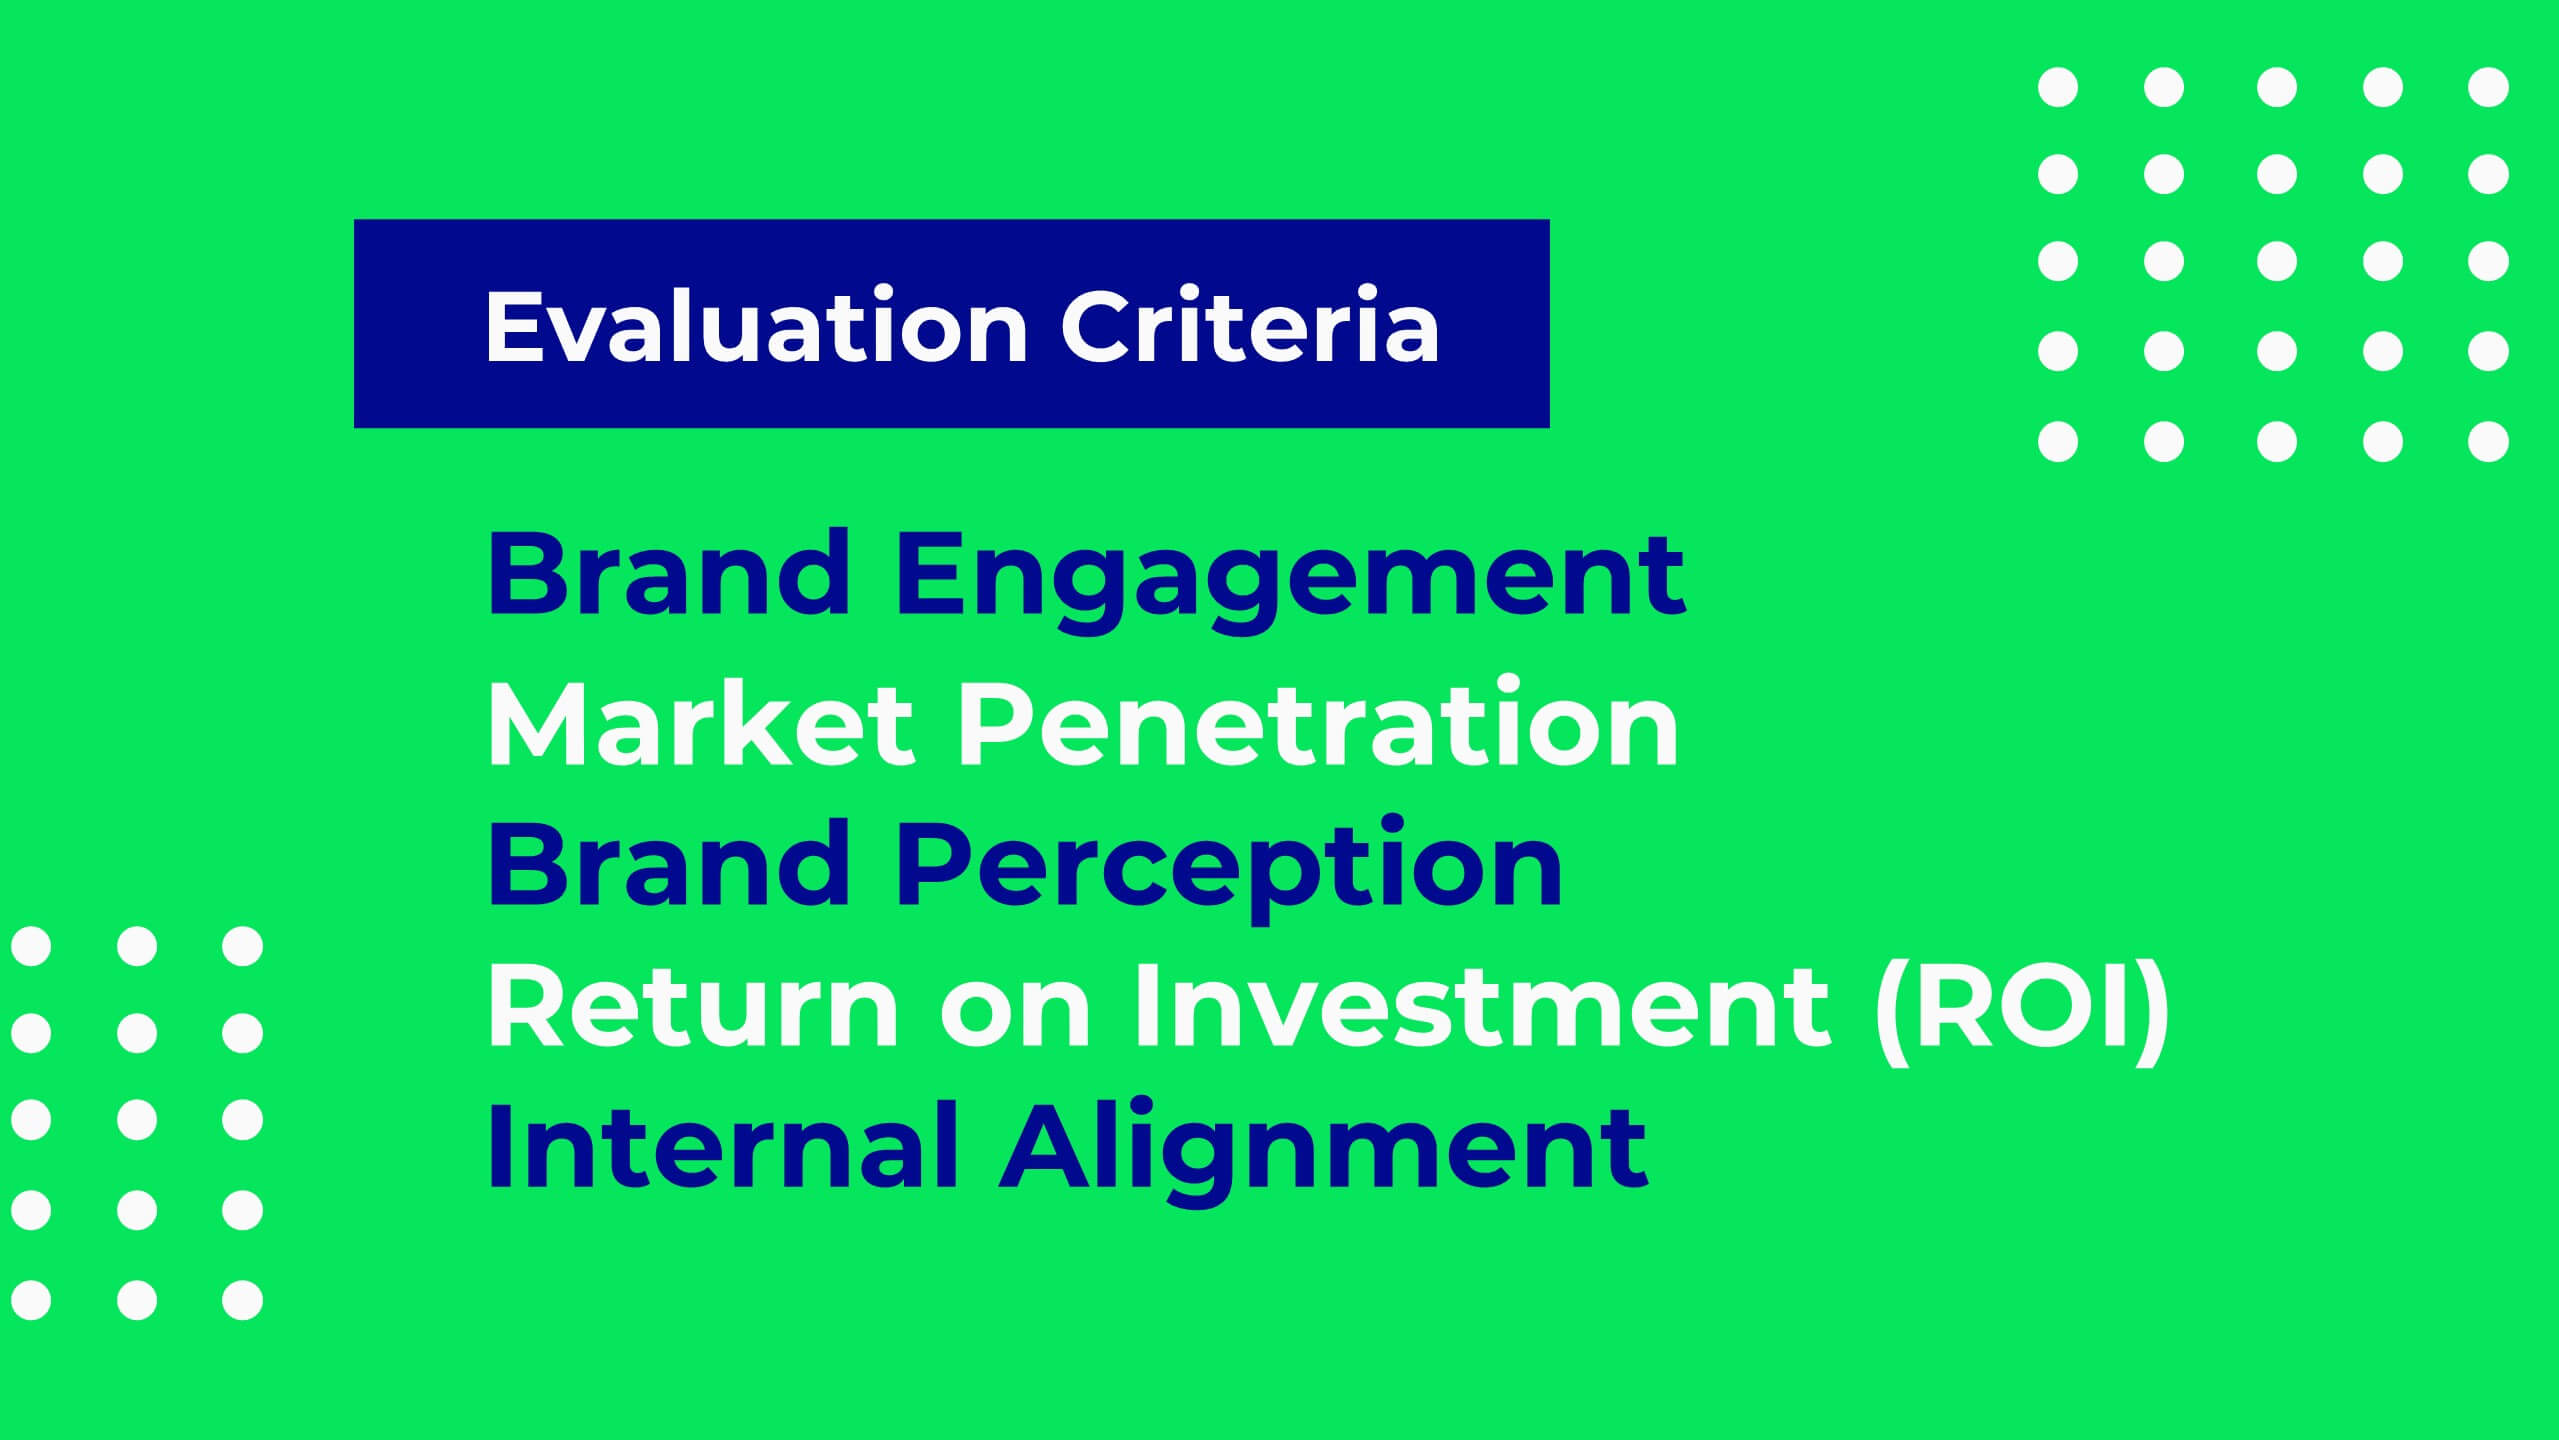
Pulse Project Milestones Report Presentation
Present project milestones effectively with this sleek, professional template. Cover project overview, timeline, and budget. Perfect for defining objectives, scope of work, and resource allocation. Highlight team introductions and stakeholder analysis. Ensure quality with risk management and assurance plans. Compatible with PowerPoint, Keynote, and Google Slides. Elevate your presentations today!


6 diapositivas
Creative Thinking and Innovation Presentation
Unleash Creative Thinking and Innovation with this engaging infographic. Featuring a visually dynamic brain puzzle design, this template is perfect for presenting problem-solving strategies, brainstorming techniques, and creative business solutions. Fully editable and compatible with PowerPoint, Keynote, and Google Slides.


6 diapositivas
Revenue Cycle Infographic
The Revenue Cycle refers to the set of processes and activities involved in generating revenue for a business. This infographic template serves as a comprehensive guide to understanding and optimizing the revenue generation cycle. This presents the key stages, processes, metrics, and strategies involved in managing revenue in a colorful visually engaging and easy-to-understand format. With this template, you can effectively communicate the revenue cycle concepts and promote revenue optimization within your organization. Fully customizable and compatible with Powerpoint, Keynote, and Google Slides.


10 diapositivas
Professional Table of Content Slide Presentation
Give your presentation a polished and organized introduction with this Professional Table of Content slide. Designed for clarity and navigation, it features four sleek, color-coded content banners—perfect for outlining major sections or chapters. Each icon and title can be customized to reflect your topic structure. Ideal for business plans, proposals, or reports. Fully editable in PowerPoint, Keynote, and Google Slides.


4 diapositivas
Root Cause Analysis for Problem Solving
Tackle problems from the inside out with this structured and easy-to-follow layout. This root cause analysis template helps you clearly map out underlying issues and visualize their impact in one slide. Ideal for team discussions, audits, and presentations—fully editable in PowerPoint, Keynote, and Google Slides for maximum flexibility.


21 diapositivas
Planetar Startup Strategy Presentation
This Startup Strategy Presentation offers a modern and structured layout to showcase your startup’s mission, vision, market analysis, and financial projections. Designed for entrepreneurs and investors, it includes sections on customer needs, growth plans, and milestones. Fully customizable and compatible with PowerPoint, Keynote, and Google Slides.


8 diapositivas
End-to-End Project Lifecycle Management Presentation
Visualize each phase of your project lifecycle with this clean, circular flow layout. Ideal for showcasing planning, execution, and delivery stages in a structured loop. Each segment is fully editable to match your content. Compatible with PowerPoint, Google Slides, and Keynote for effortless customization and professional results.


6 diapositivas
Porter’s Value Chain Analysis Presentation
Give your strategy story a powerful lift with a clean visual layout that makes every activity in your organization feel connected and purposeful. This presentation explains primary and support processes in a way that helps teams identify strengths, gaps, and opportunities for improvement. Fully compatible with PowerPoint, Keynote, and Google Slides.


5 diapositivas
Buyer Journey Infographic Presentation
Understanding how buyers move from awareness to action becomes effortless with this clean, visual presentation. It guides you through each stage, helping you explain behaviors, insights, and touchpoints with clarity. Easy to customize and fully compatible with PowerPoint, Keynote, and Google Slides.