


Características


¿Tienes alguna pregunta?
Recomendar


7 diapositivas
Progress Infographic Presentation Template
Our Progress template is designed with a simple layout for presenting your infographic with flow charts and progress bars. This layout is made to be used as a presentation layer so that you can easily change text and images from one slide to the next. It comes with useful icons and illustrations to help you create a more informative presentation. This is a well-organized template for PowerPoint presentations. It allows you to present important information with clear and concise structure. With its useful design and features, you can create an engaging presentation in just minutes.


6 diapositivas
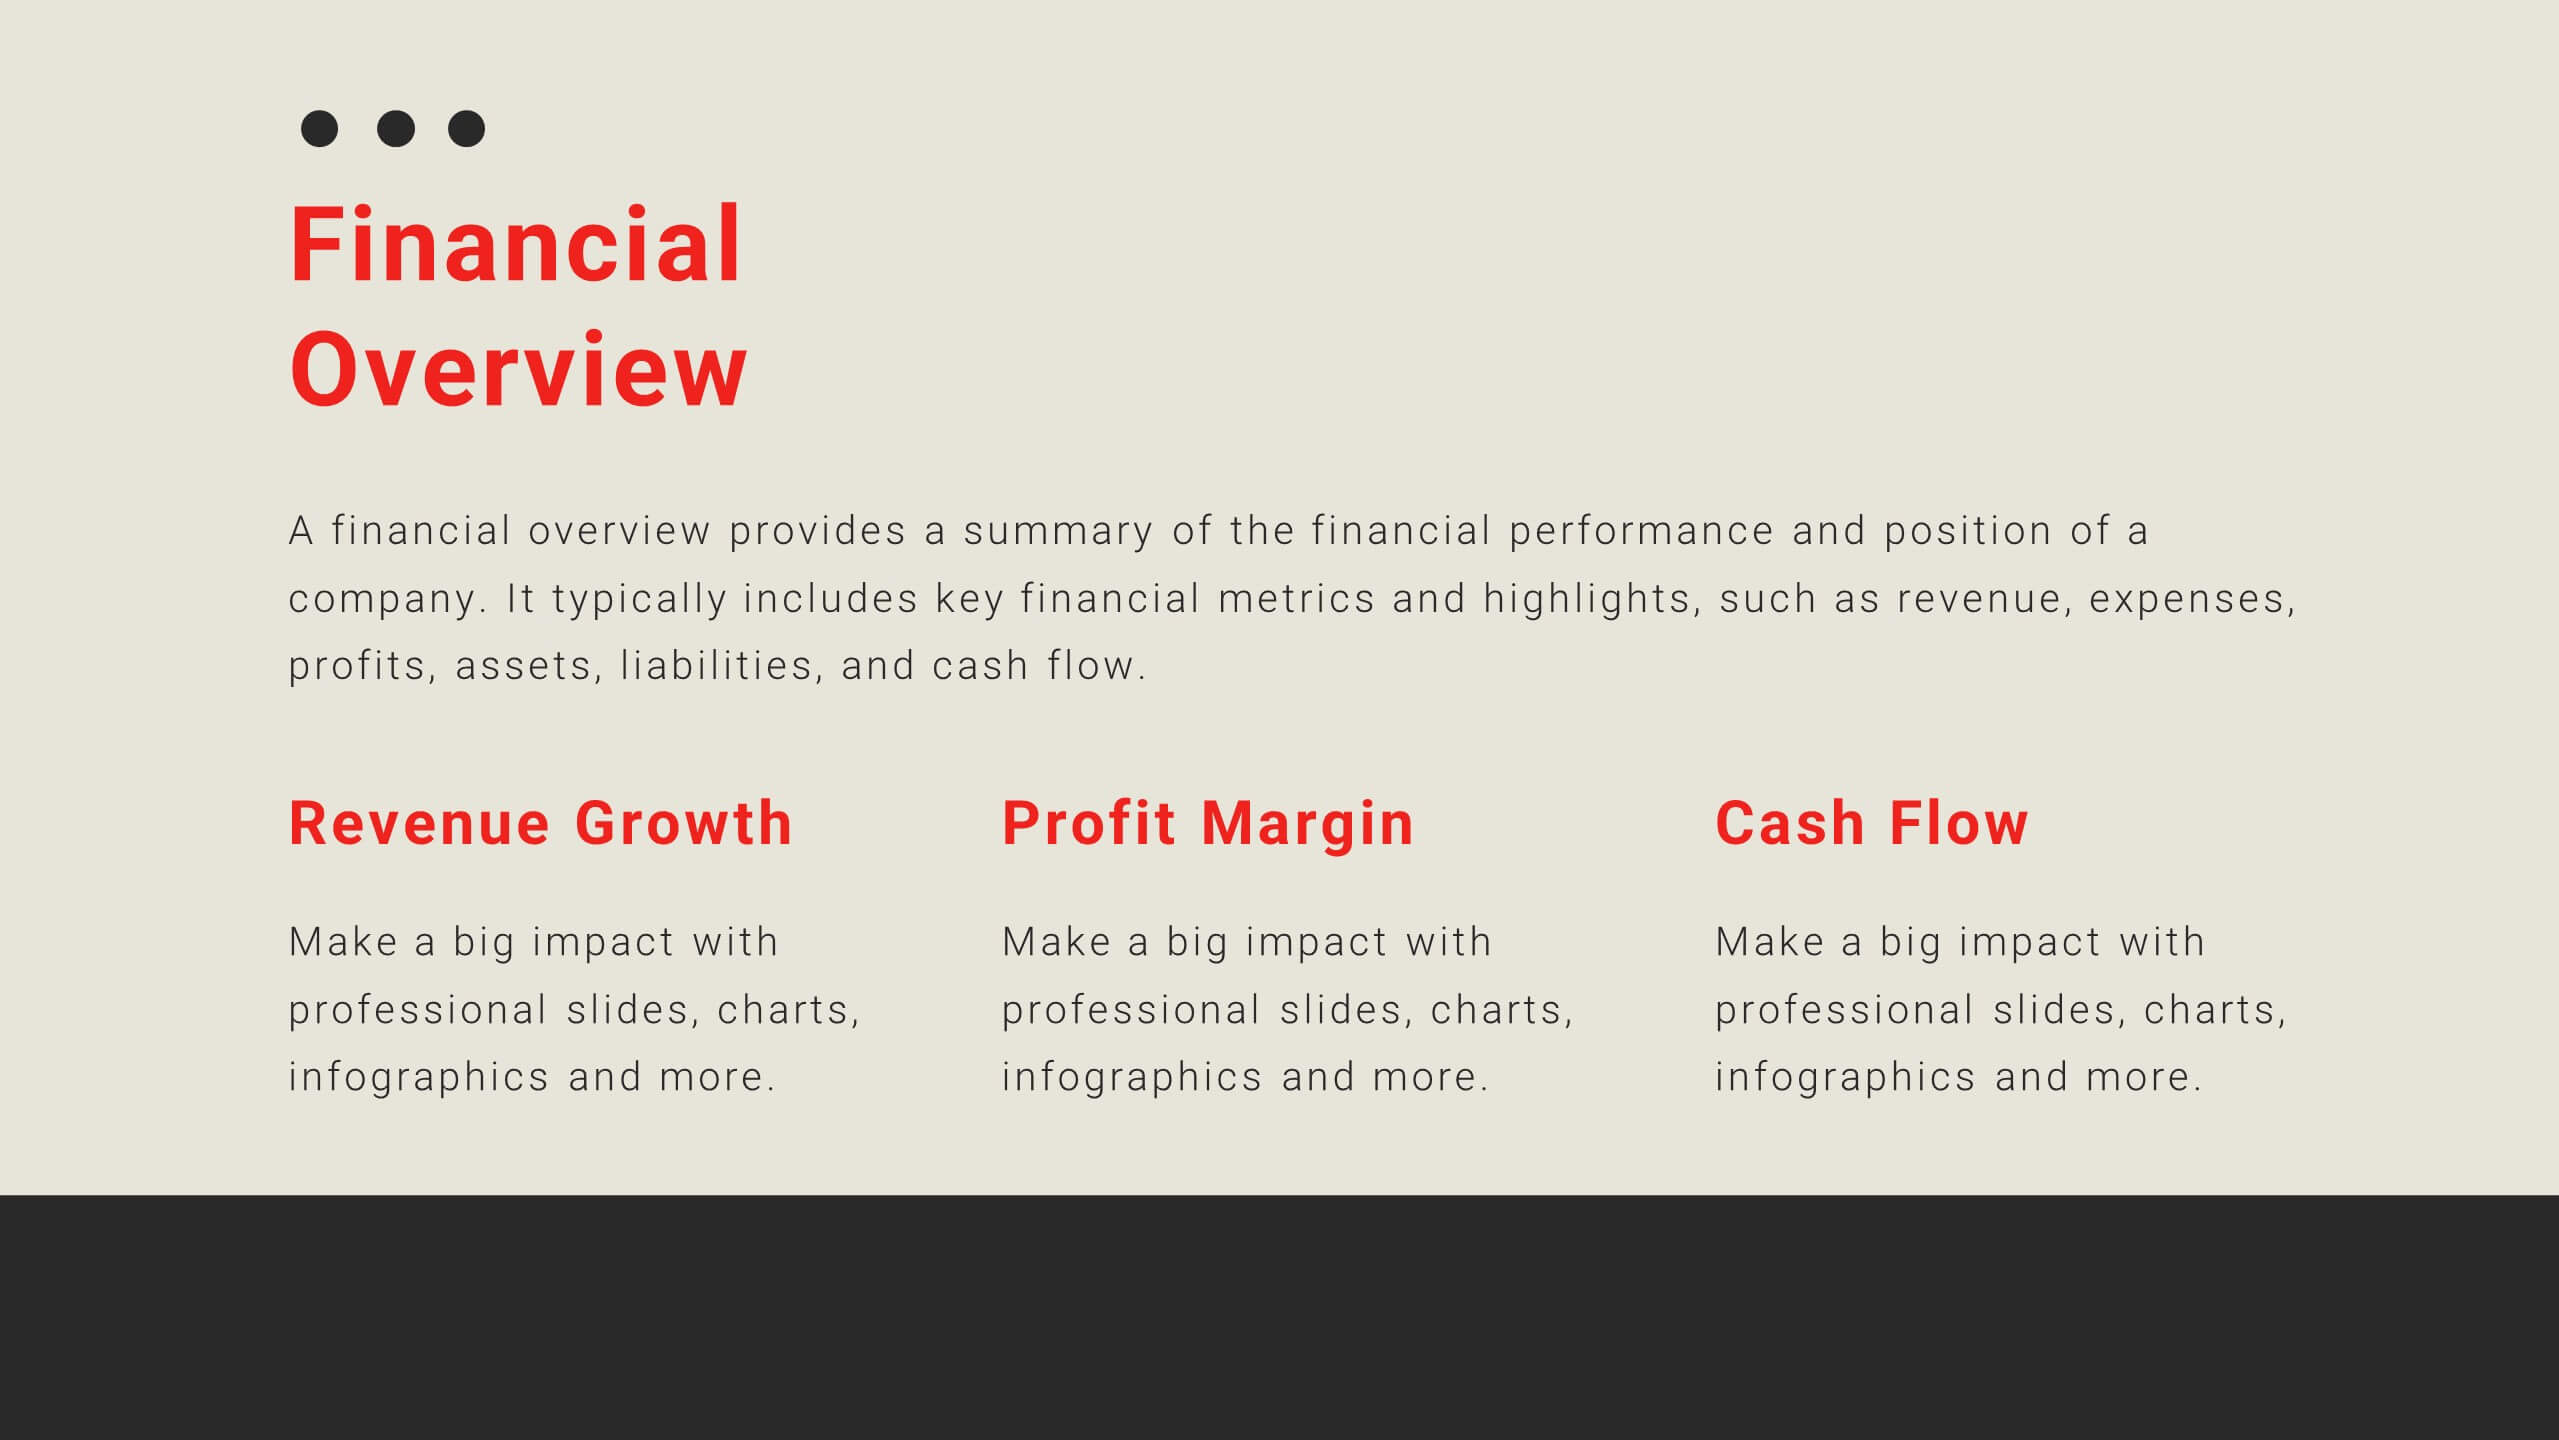
Business Case Study and ROI Breakdown Presentation
Communicate your business impact clearly with the Business Case Study and ROI Breakdown Presentation. Featuring layered building-block visuals, this template is ideal for illustrating return on investment, strategic value, or project outcomes. Perfect for executive briefings and stakeholder presentations. Fully editable in PowerPoint, Keynote, and Google Slides.


5 diapositivas
Historical Event Timeline Overview Presentation
Bring history to life with the Historical Event Timeline Overview Presentation. This visually engaging slide is perfect for educators, researchers, or historians looking to showcase five key milestones in chronological order. Fully editable in Canva, PowerPoint, Keynote, and Google Slides—making it easy to adapt for any historical topic.


7 diapositivas
Agile Circle Methodology Infographic Presentation
Agile Methodology is a flexible and adaptive approach to project management that values customer satisfaction, teamwork, and continuous improvement. Our Agile Methodology template is perfect for academic or work presentation projects. This template is super easy to use and works with Powerpoint, Keynote, and Google Slides. It has a minimal design with, bright colors that will keep your audience engaged. With this template, you can learn all about Agile Methodology in a way that is visually appealing. Use this template to see how you and your team work more efficiently and effectively.


5 diapositivas
Restaurant Regulations Infographics
Restaurant Regulations are crucial for ensuring food safety and hygiene. This infographic is designed in vertical format, allowing for easy display on digital platforms such as social media or the restaurant's website. This is designed to help restaurants communicate regulations to their staff and customers. The use of visually appealing graphics and colors help make the information more engaging and easier to understand. It can also be customized with the restaurant's branding and logo to create a cohesive look and feel. The infographic is divided into sections, each for covering different areas of your regulations.


6 diapositivas
Bubble Chart Data Visualization Presentation
Make your data pop with visuals that tell a story at a glance. This modern presentation transforms raw numbers into clear, engaging bubble charts that simplify complex insights and comparisons. Fully editable and compatible with PowerPoint, Keynote, and Google Slides for effortless customization and professional results.


26 diapositivas
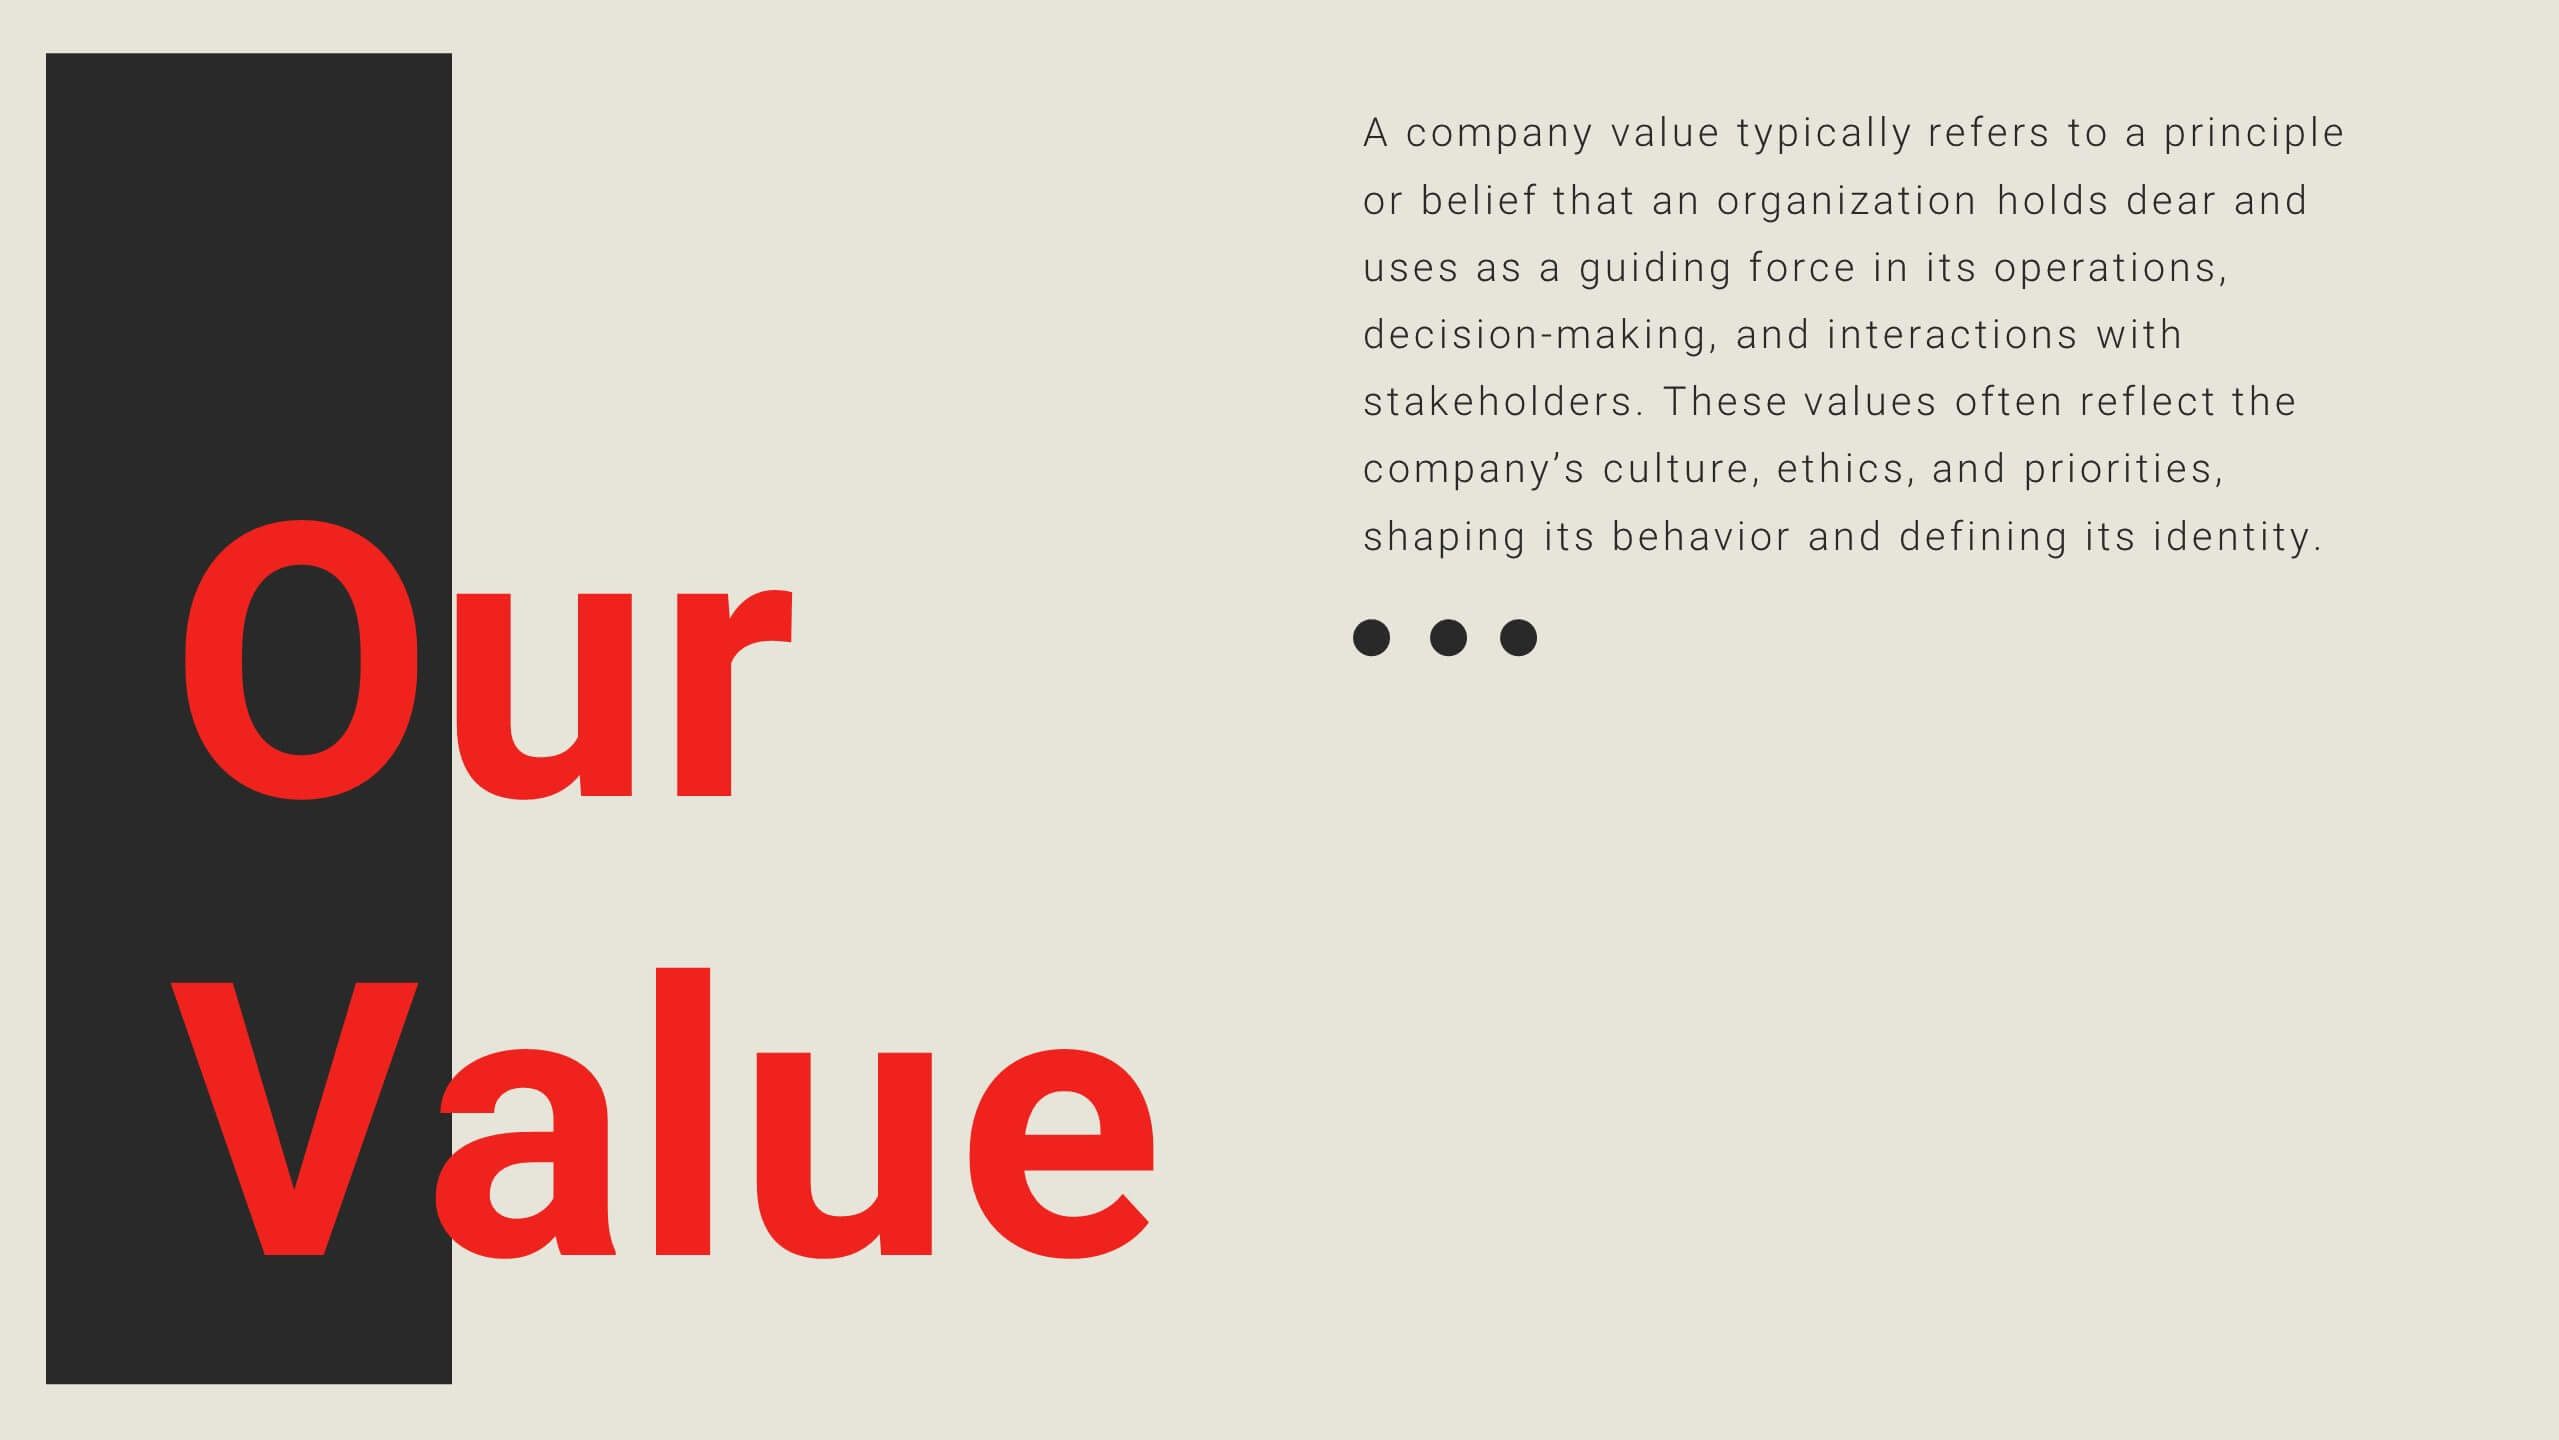
Modern Company Culture Playbook Presentation
A culture playbook is a document or guide that outlines the values, beliefs, behaviors, and norms that define the organizational culture of a company or team. This presentation template is designed to help businesses create and communicate their unique company culture to employees and potential recruits. With a modern and professional design, this presentation provides a comprehensive overview of your company's values, mission, and beliefs, fostering a positive and inclusive work environment. Illustrate your company's vision for the future and its role in shaping a better world, encouraging employees to be part of a meaningful journey.


5 diapositivas
Dual Axis Butterfly Diagram Presentation
Give your data the spotlight it deserves with a modern layout designed for clarity and balance. This presentation is perfect for comparing two perspectives, processes, or variables side by side in a visually appealing way. Fully customizable and compatible with PowerPoint, Keynote, and Google Slides.


6 diapositivas
Business Performance Metric Presentation
Give your metrics a breath of fresh air with this modern, nature-inspired design. Perfect for presenting business KPIs, performance tracking, or growth data, this infographic layout uses vibrant pinwheel visuals to guide the viewer through key stats and insights. Fully compatible with PowerPoint, Keynote, and Google Slides for easy editing.


6 diapositivas
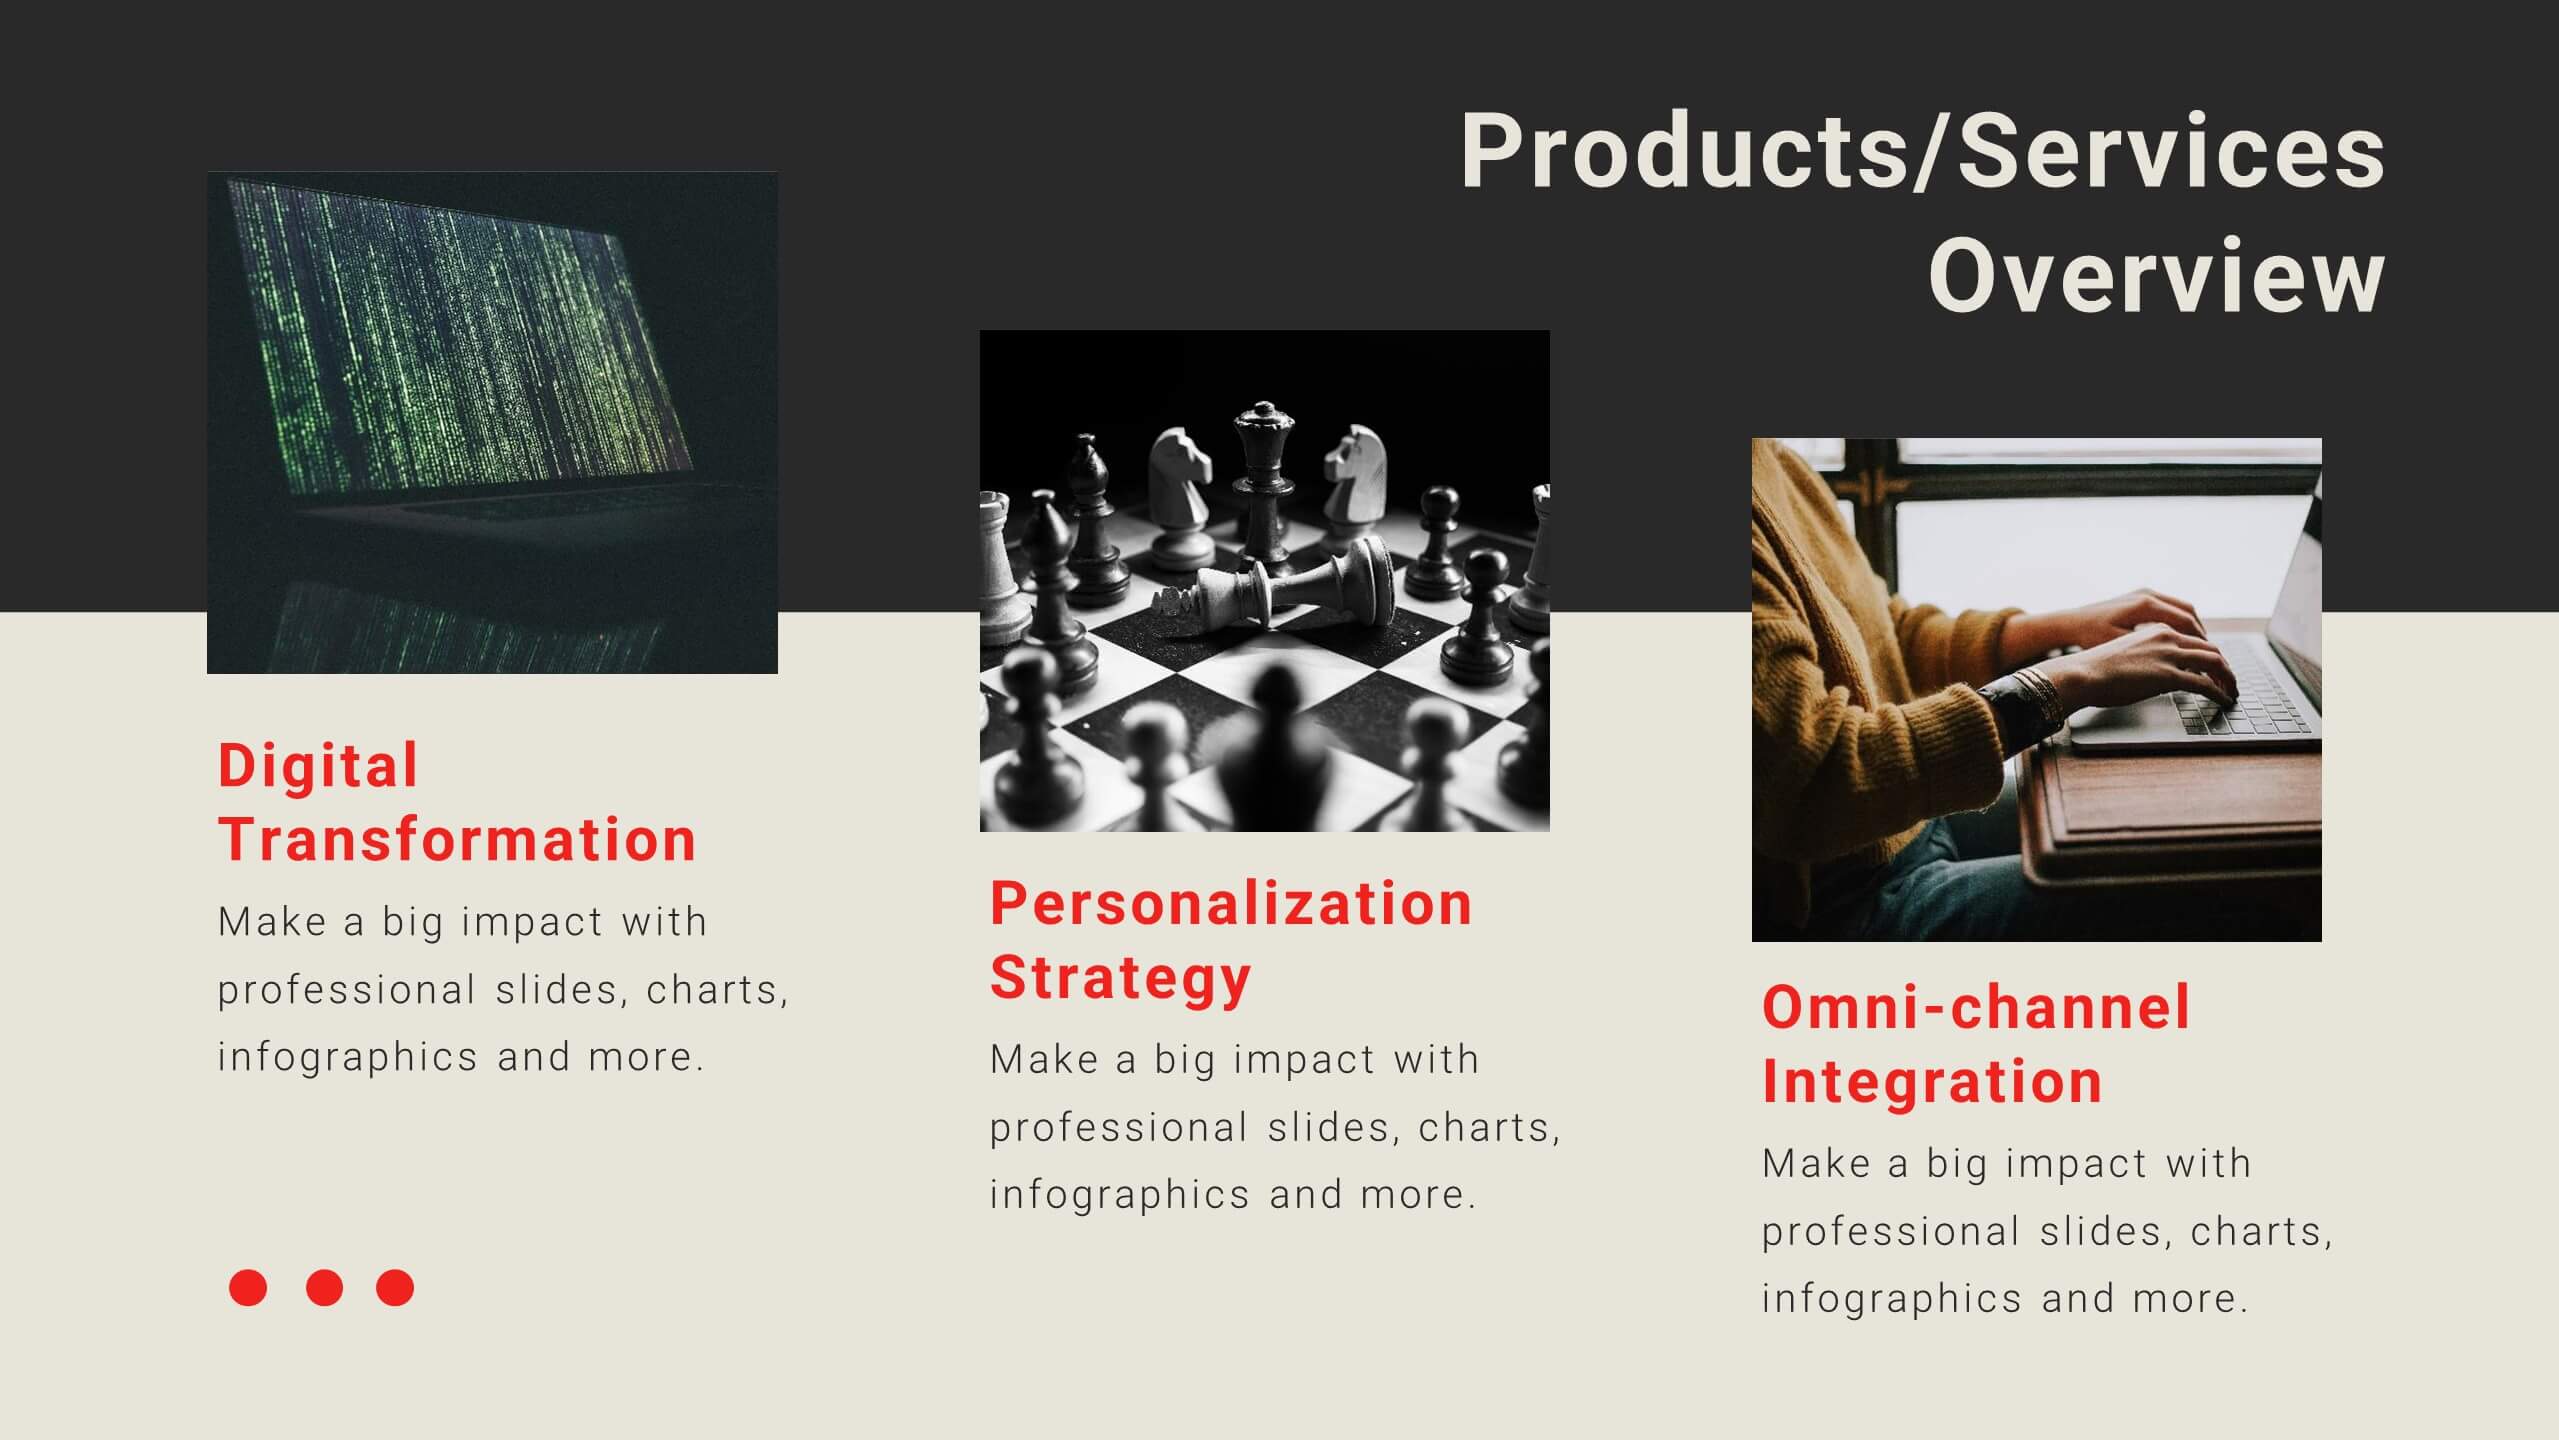
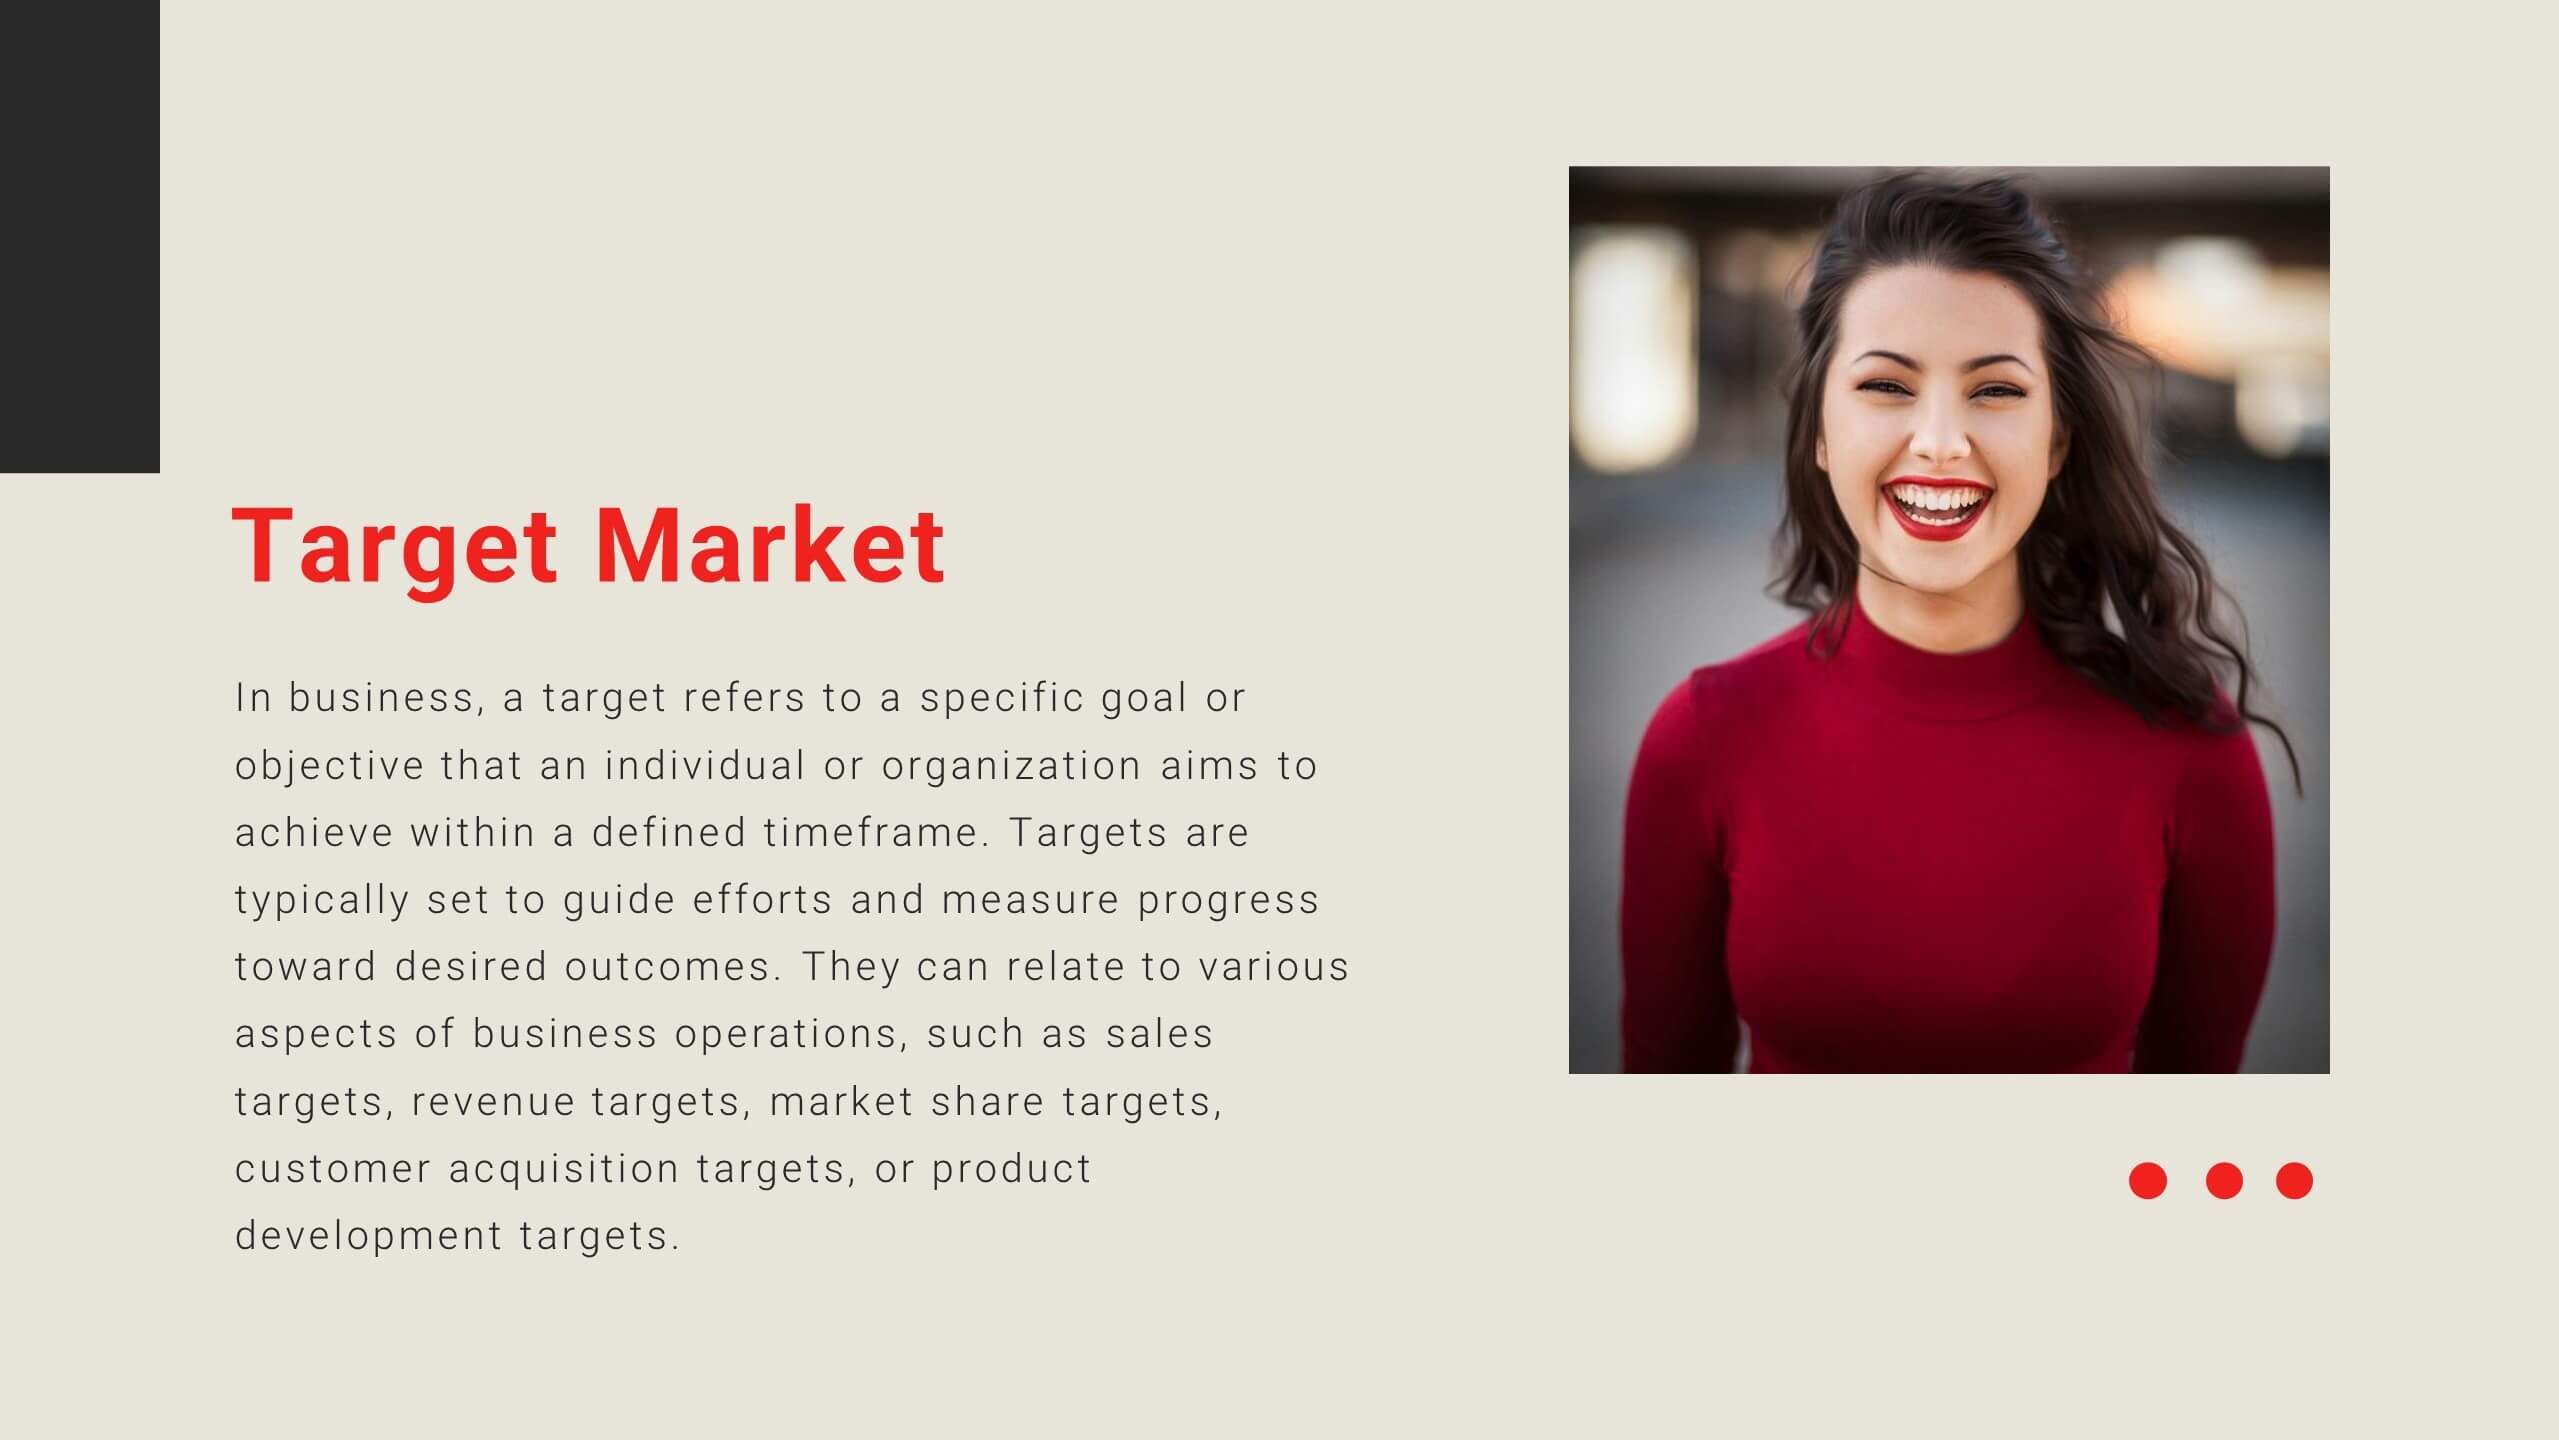
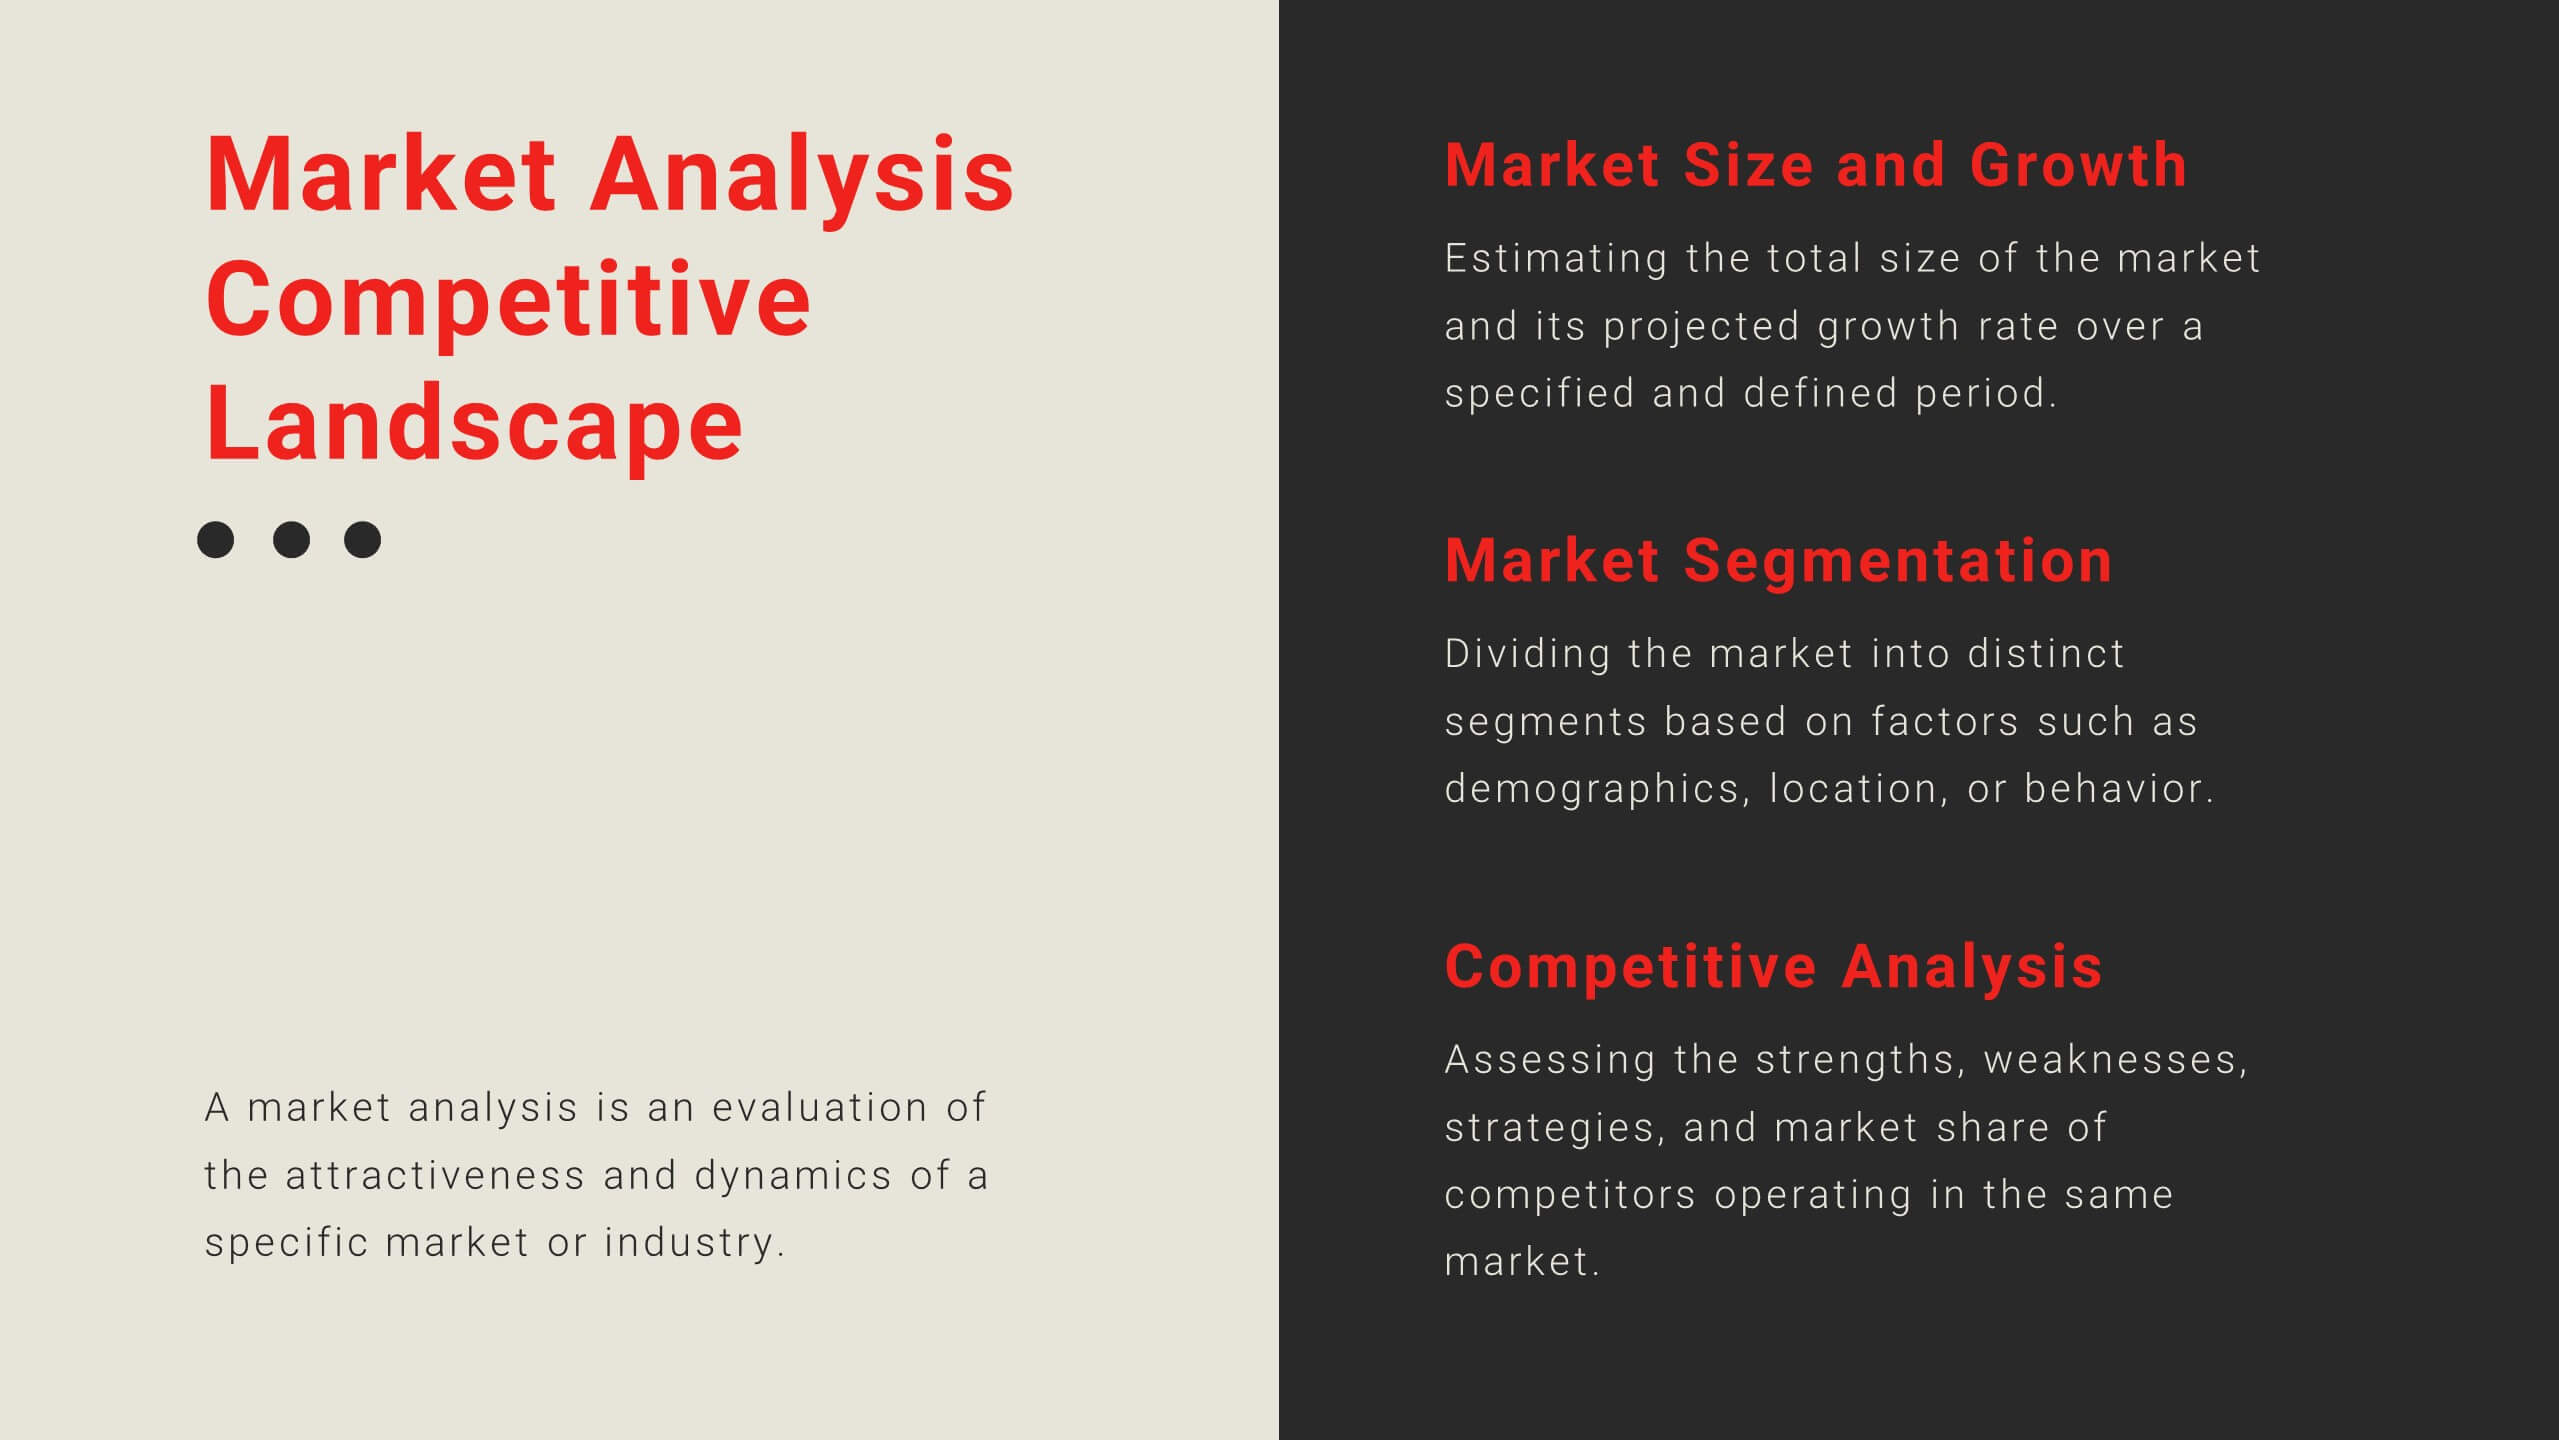
Customers Market Segmentation Strategy Presentation
Unlock the power of understanding your audience with a visually structured layout that turns complex data into clear, actionable insights. This presentation helps businesses define, target, and engage customer groups effectively. Fully editable and compatible with PowerPoint, Keynote, and Google Slides for seamless customization and professional presentation delivery.


7 diapositivas
Customer Journey Infographic Presentation Template
A Customer Journey Infographic is an illustration of the different stages a customer goes through when interacting with a business or organization. It is a way to show the customer's experience with the business or organization, from the initial contact to the post-purchase follow-up. This template is perfect for showing how people interact with your business, the emotions and feedback of your customer at each stage. This template includes lots of photo layouts, charts, and timelines that you can customize to show the different stages a customer goes through on their journey with your business.


7 diapositivas
Europe Population Infographic Presentation
A Europe Map infographic is a visual representation of the European continent, highlighting its geographic features, population, culture, history, and other relevant information. This template is a perfect graphic representation of Europe that combines text, data, and images in a fun and engaging way. This pre-designed template allows users to modify or customize the map to suit their specific needs. This includes a map of Europe with its countries, major cities, and geographic features, along with additional information and visuals related to the topic or purpose of the infographic.


5 diapositivas
Future of 5G Technology Infographics
Embrace the telecommunications revolution with the future of 5G technology infographics template. This vibrant, creatively styled vertical layout is designed to captivate and educate, making it an ideal companion for tech enthusiasts and educators alike. The template, adorned in a dynamic spectrum of purple, orange, blue, and green, simplifies the complex narrative of 5G evolution. Compatible with Powerpoint, Keynote, and Google Slides. It features intuitive graphics, engaging icons, and image placeholders, all to highlight 5G's possibilities and its impact on global connectivity. It's the perfect medium for illustrating the sophisticated architecture.

21 diapositivas
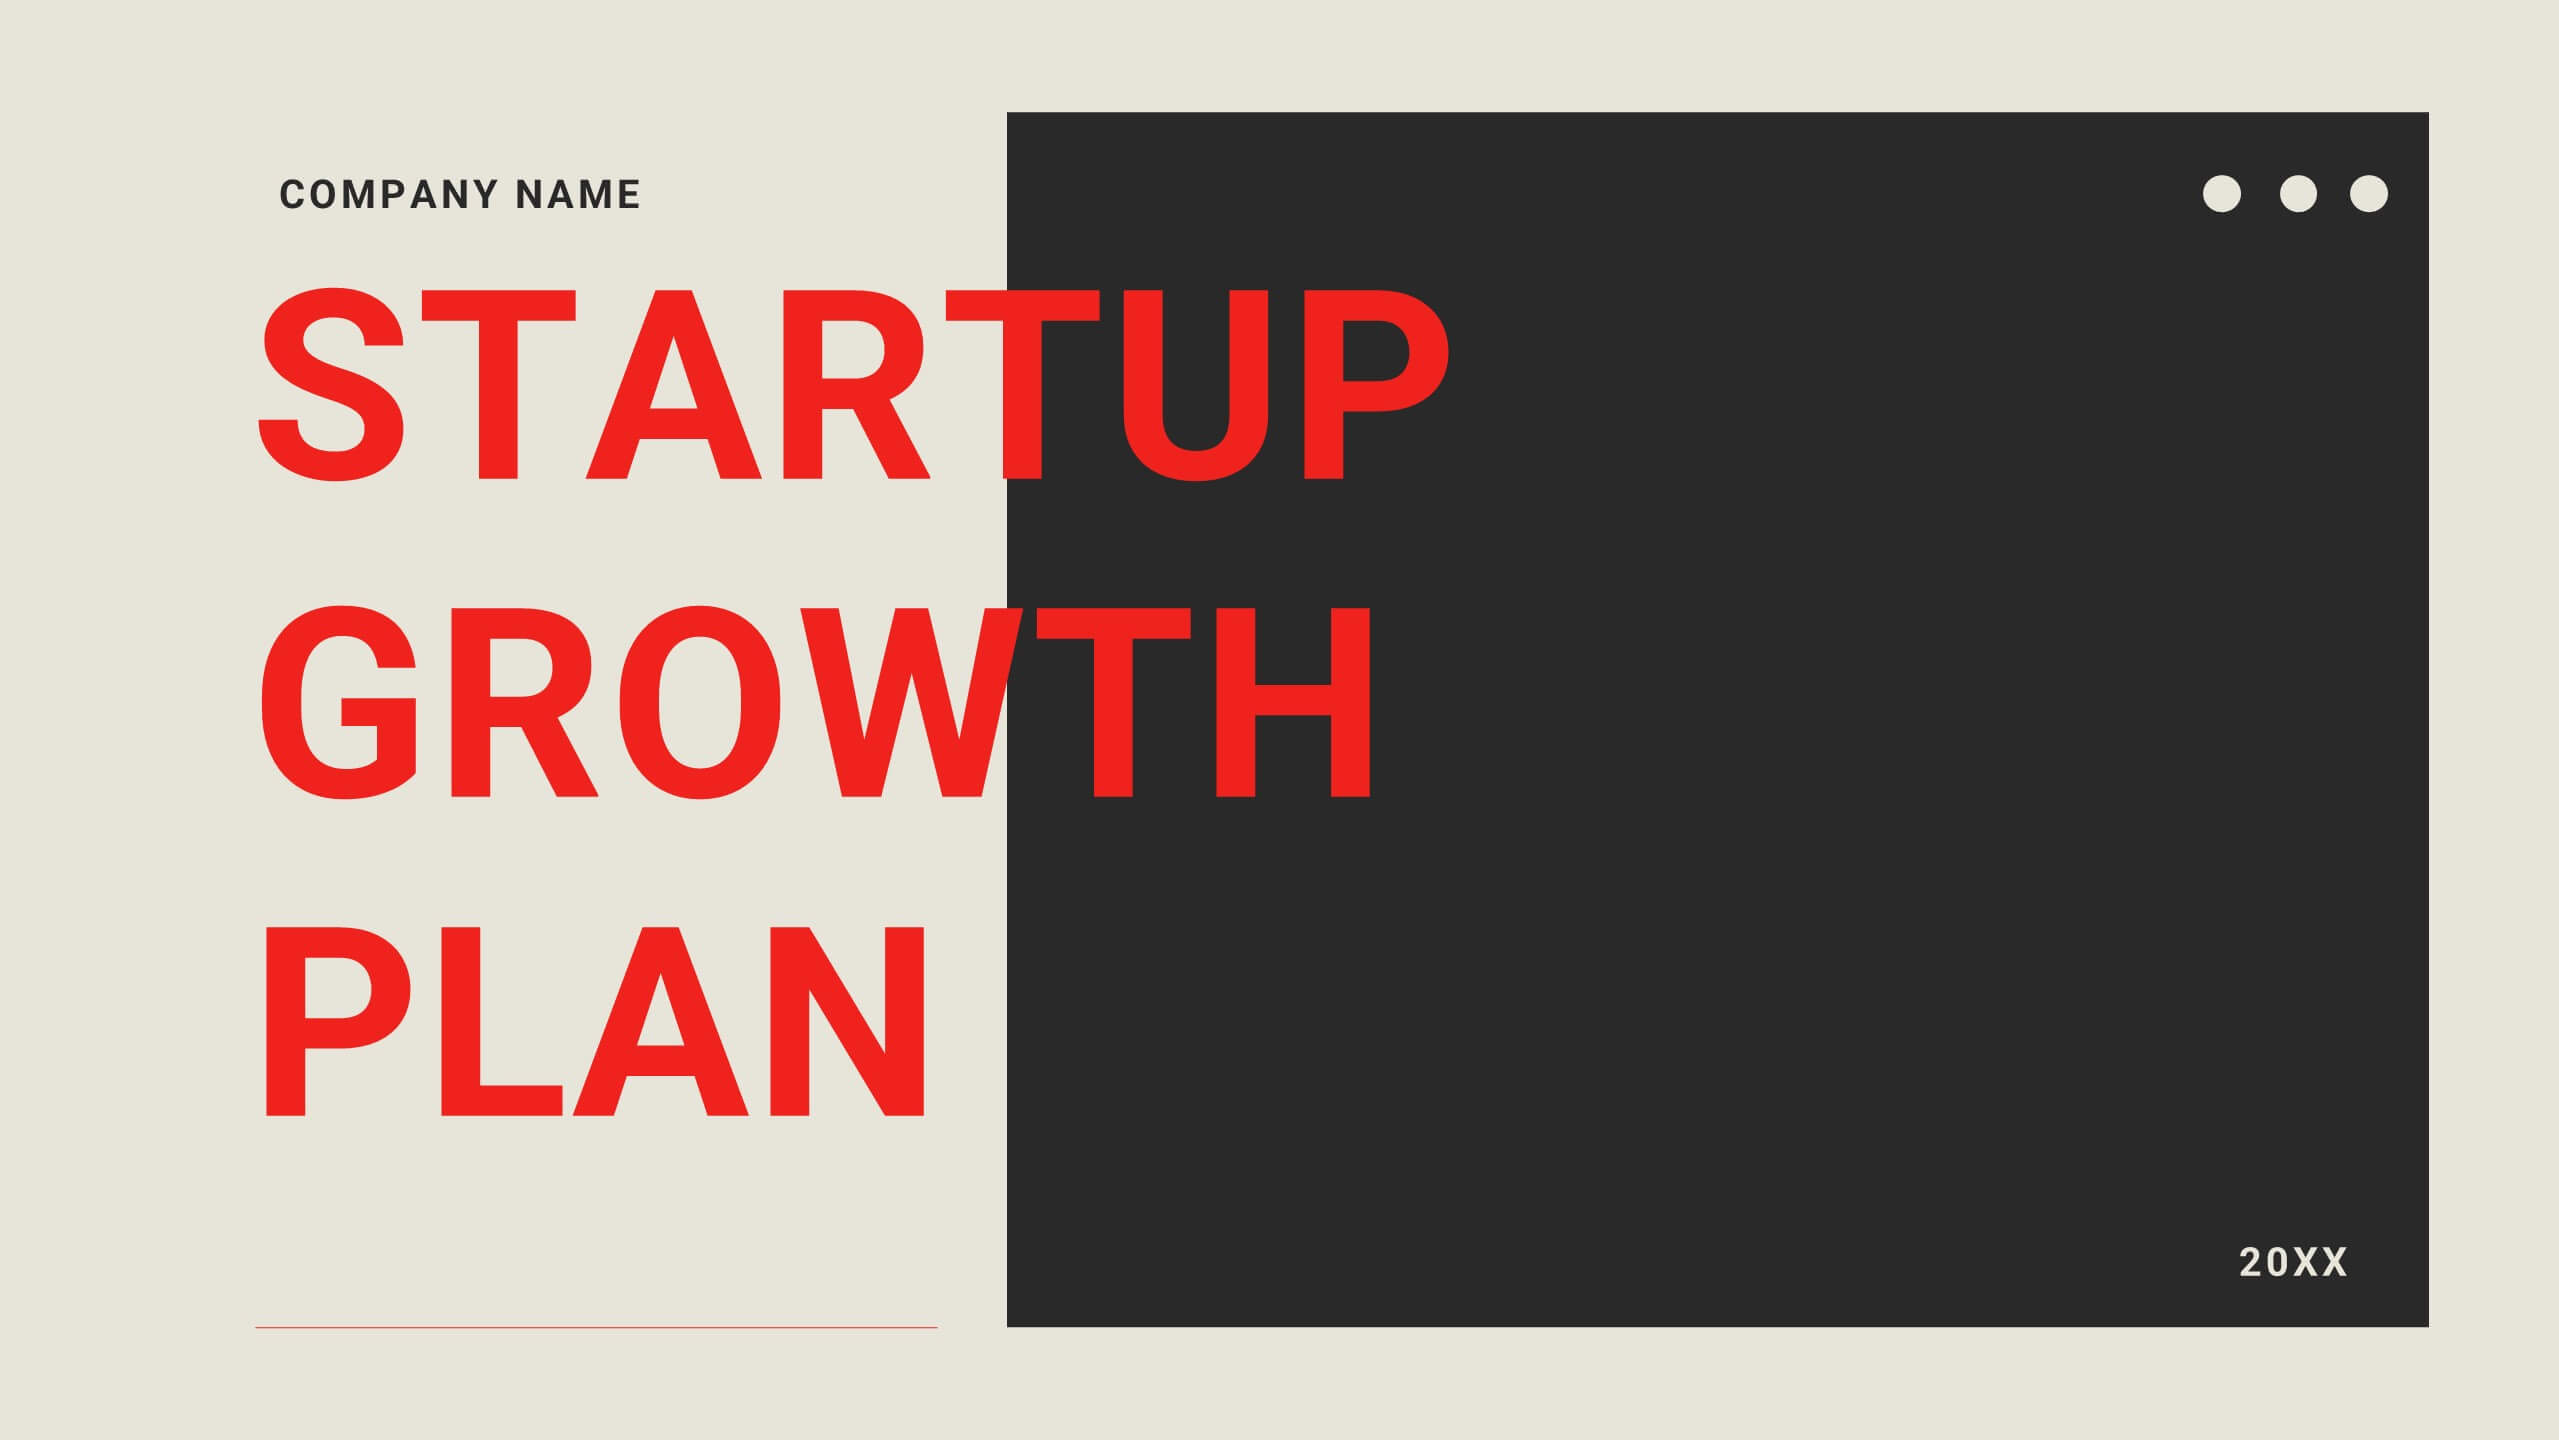
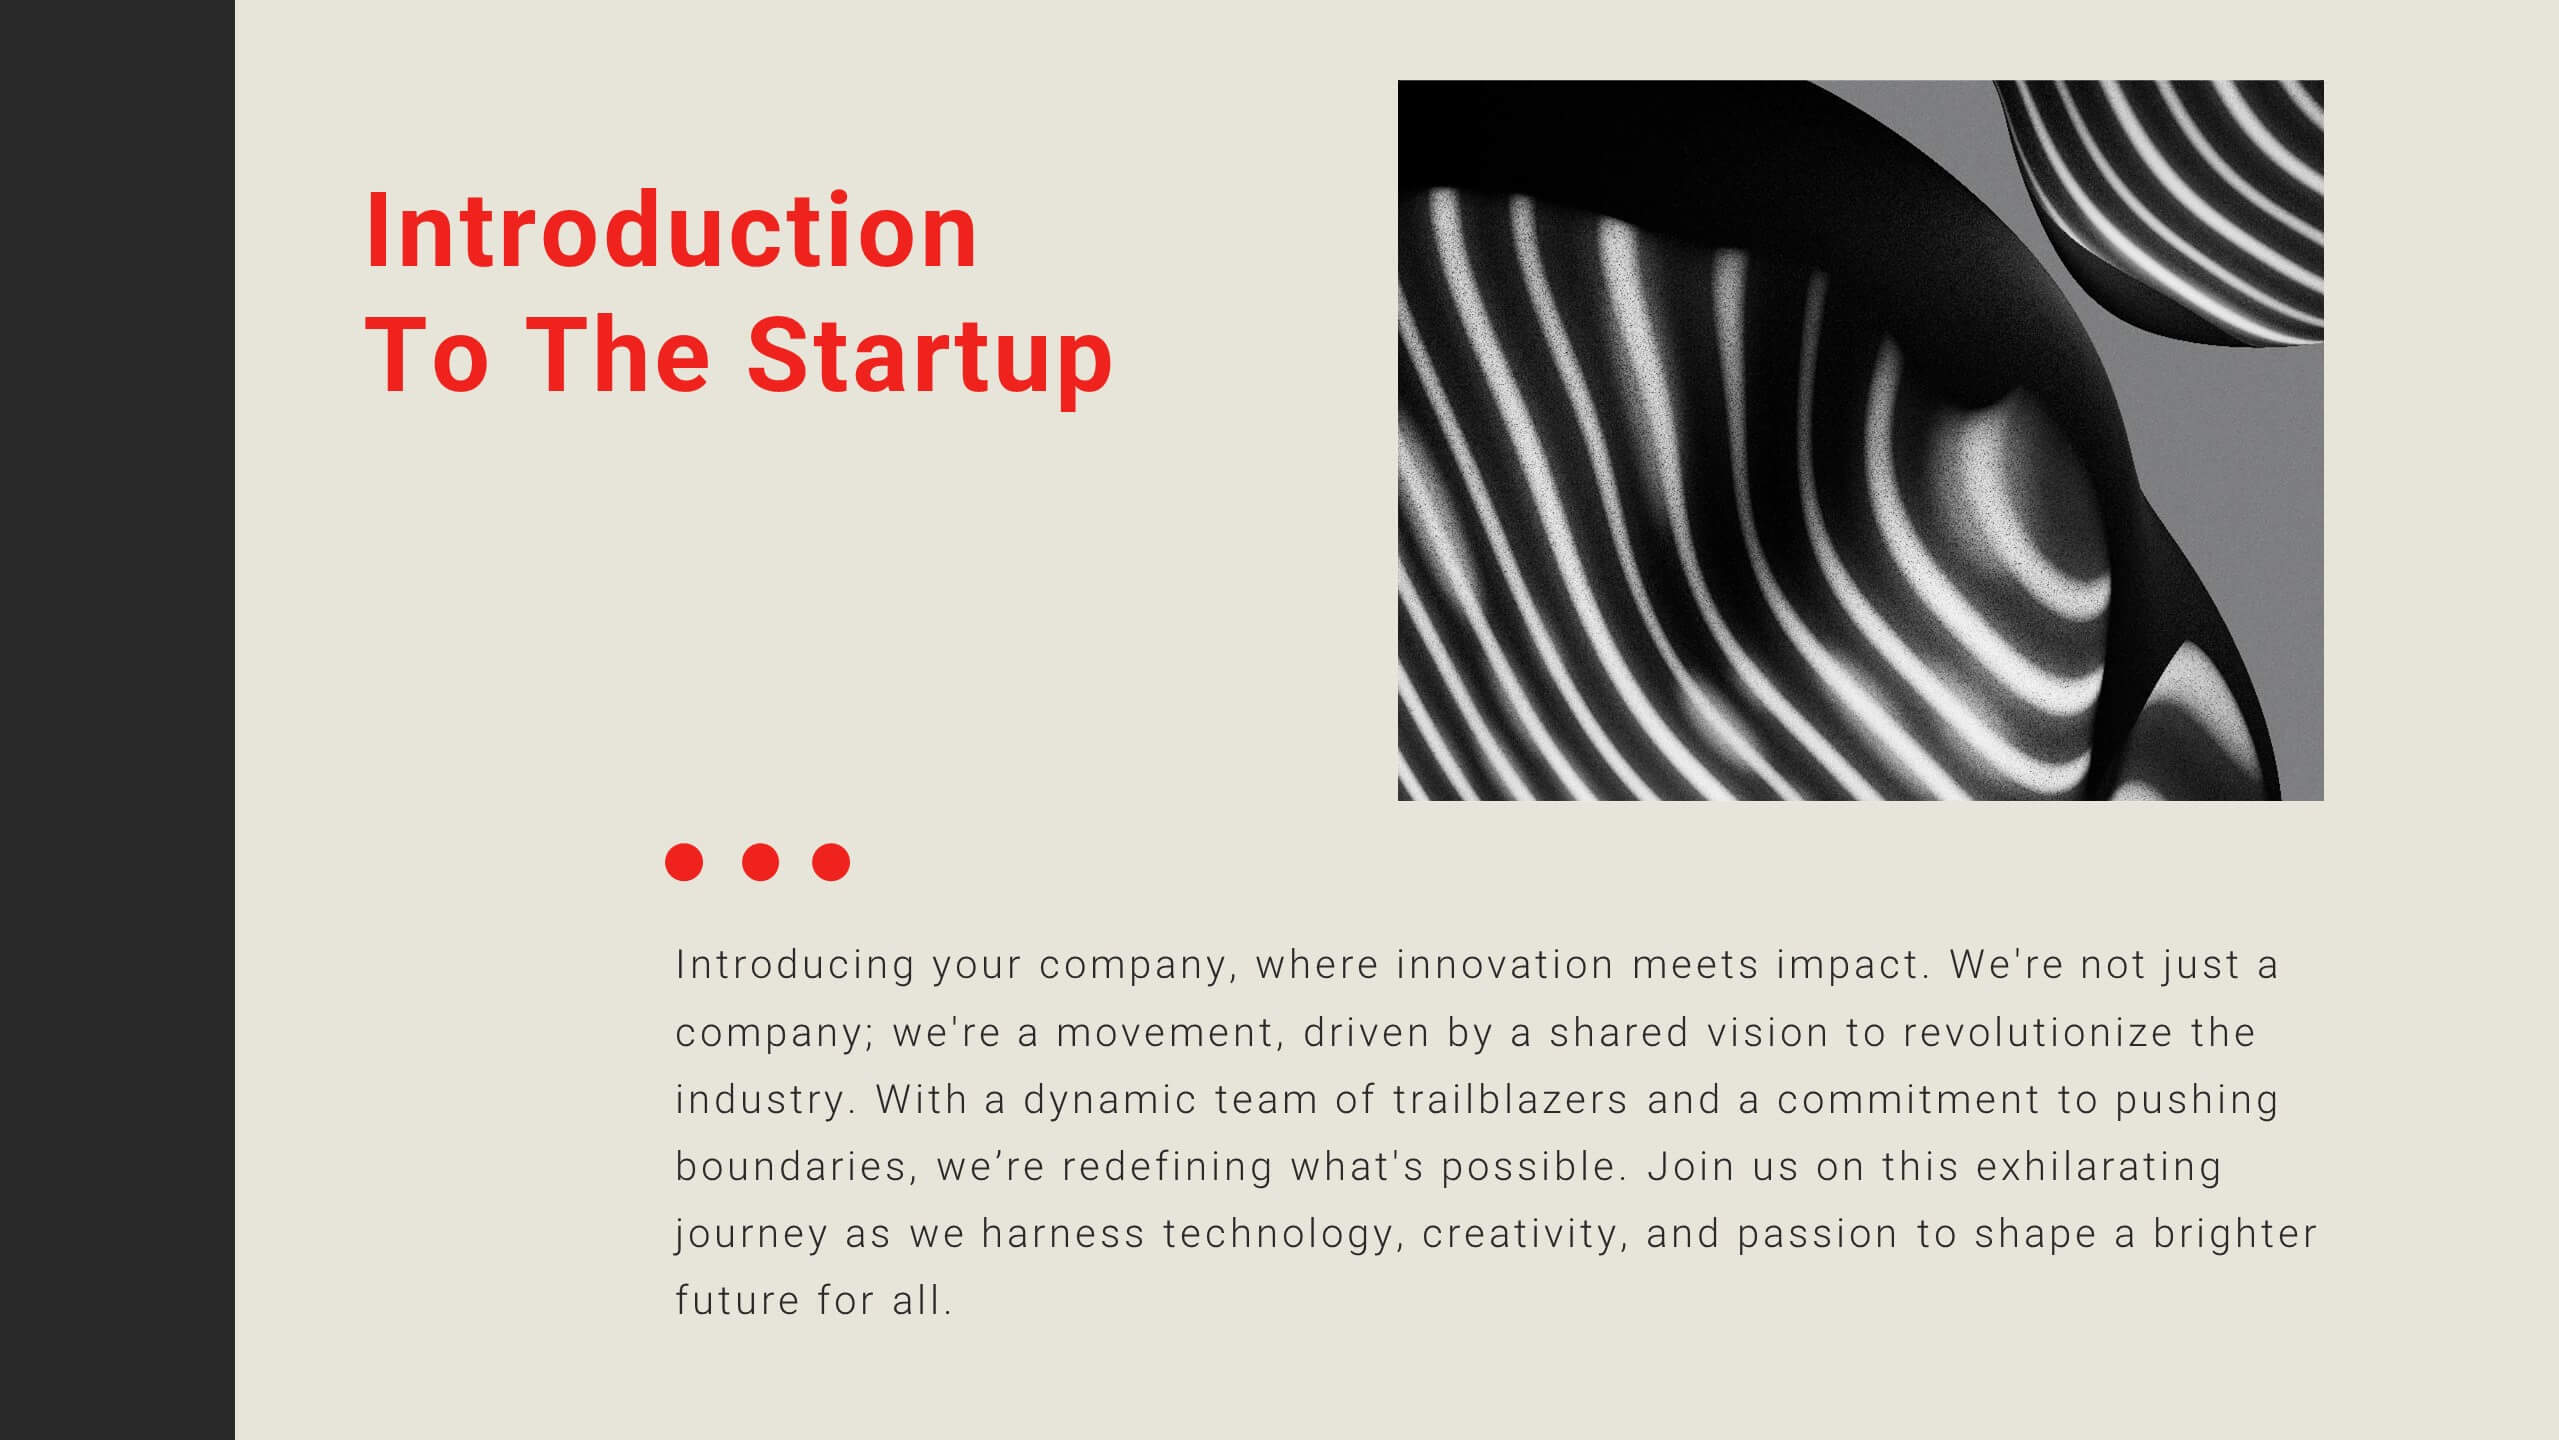
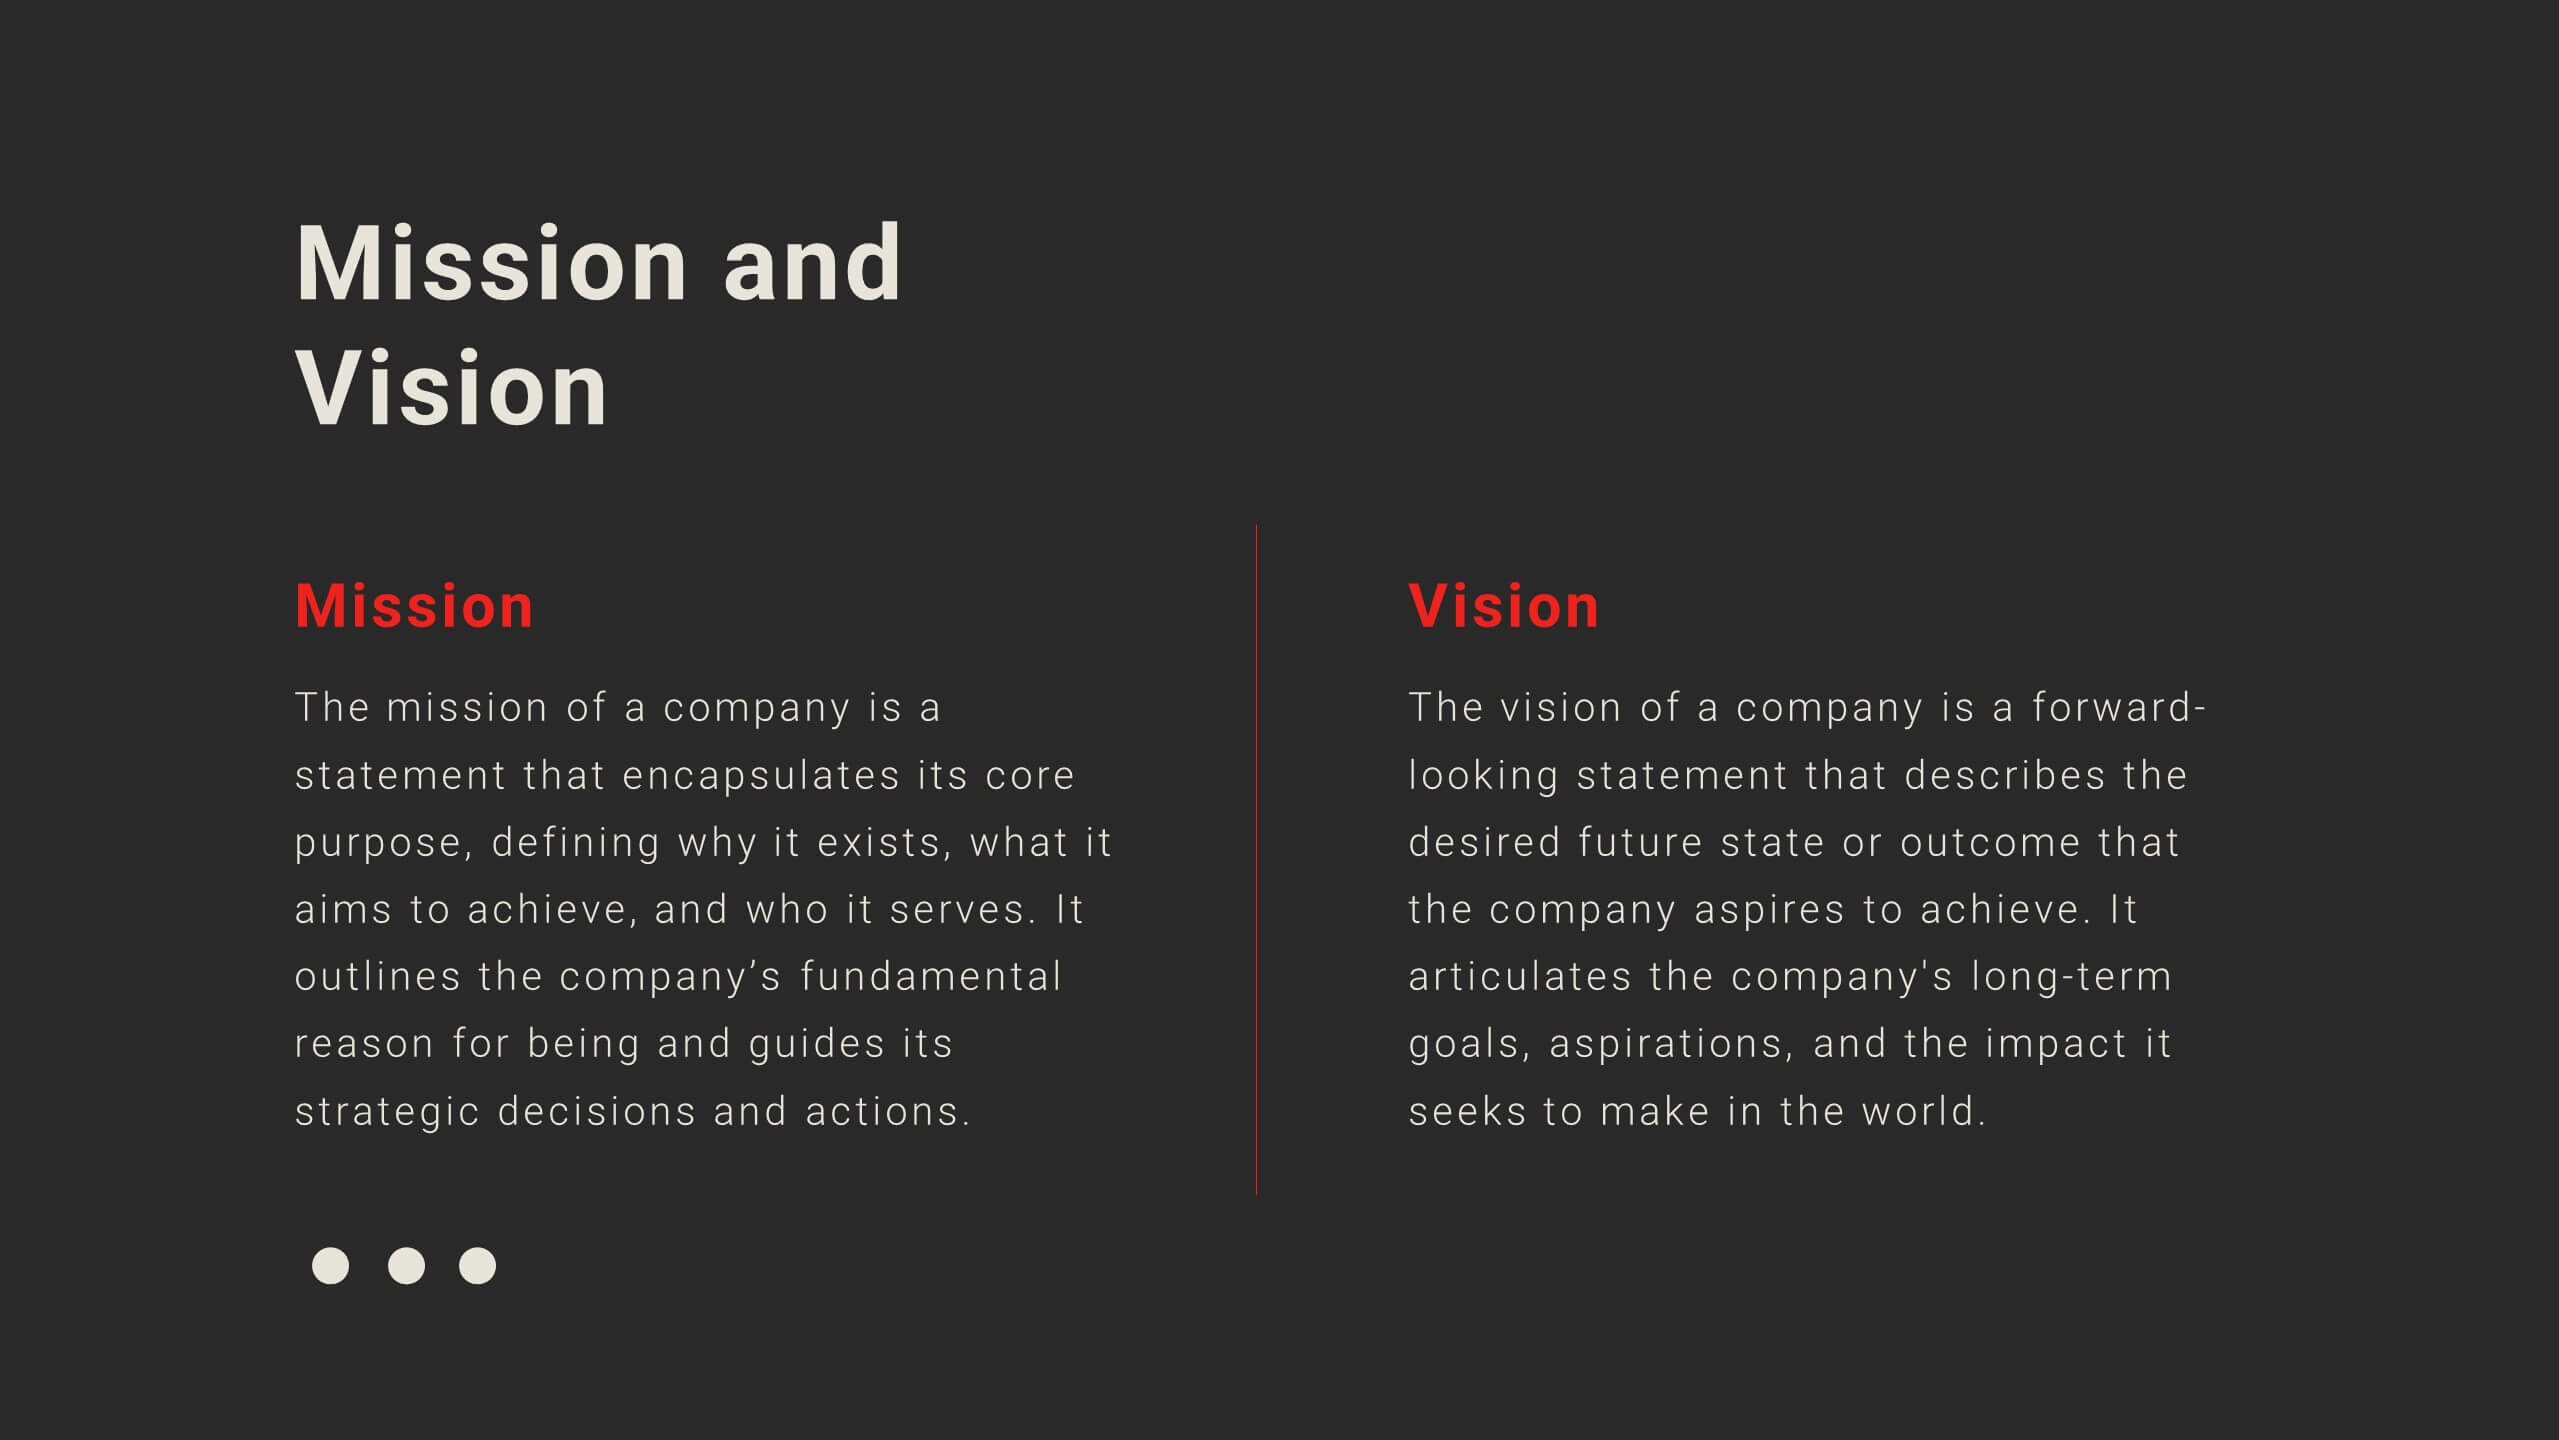
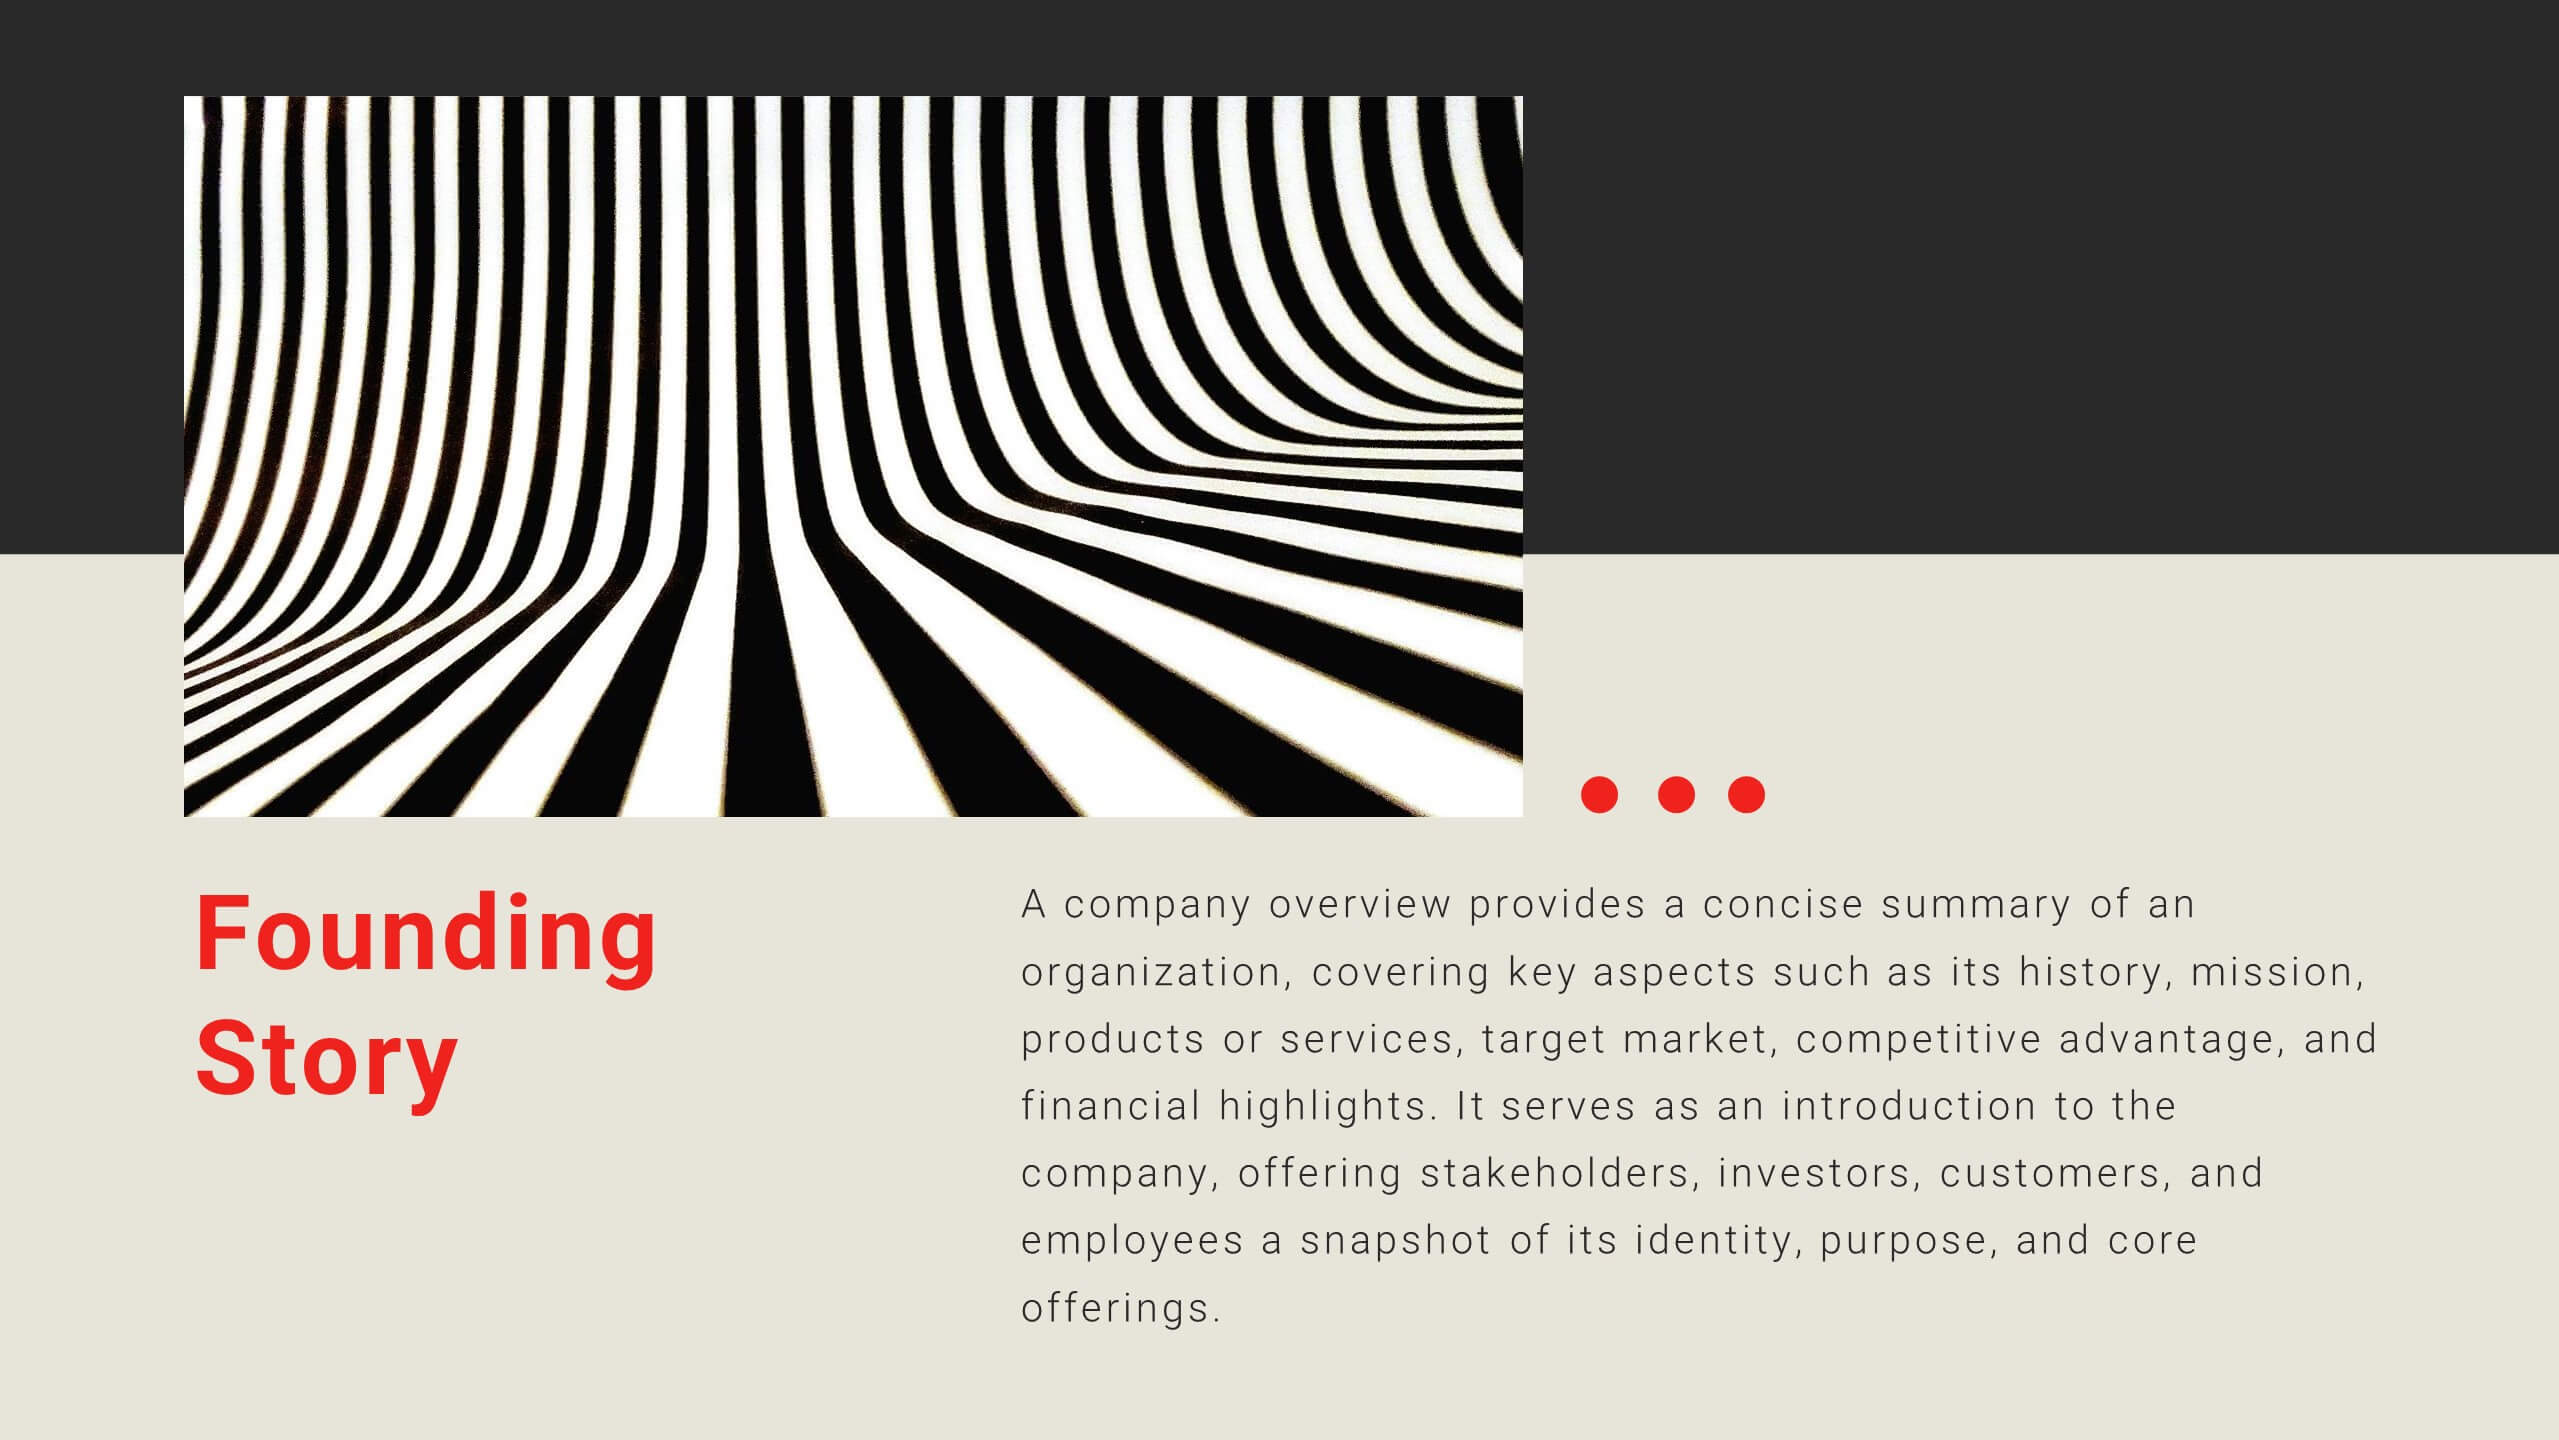
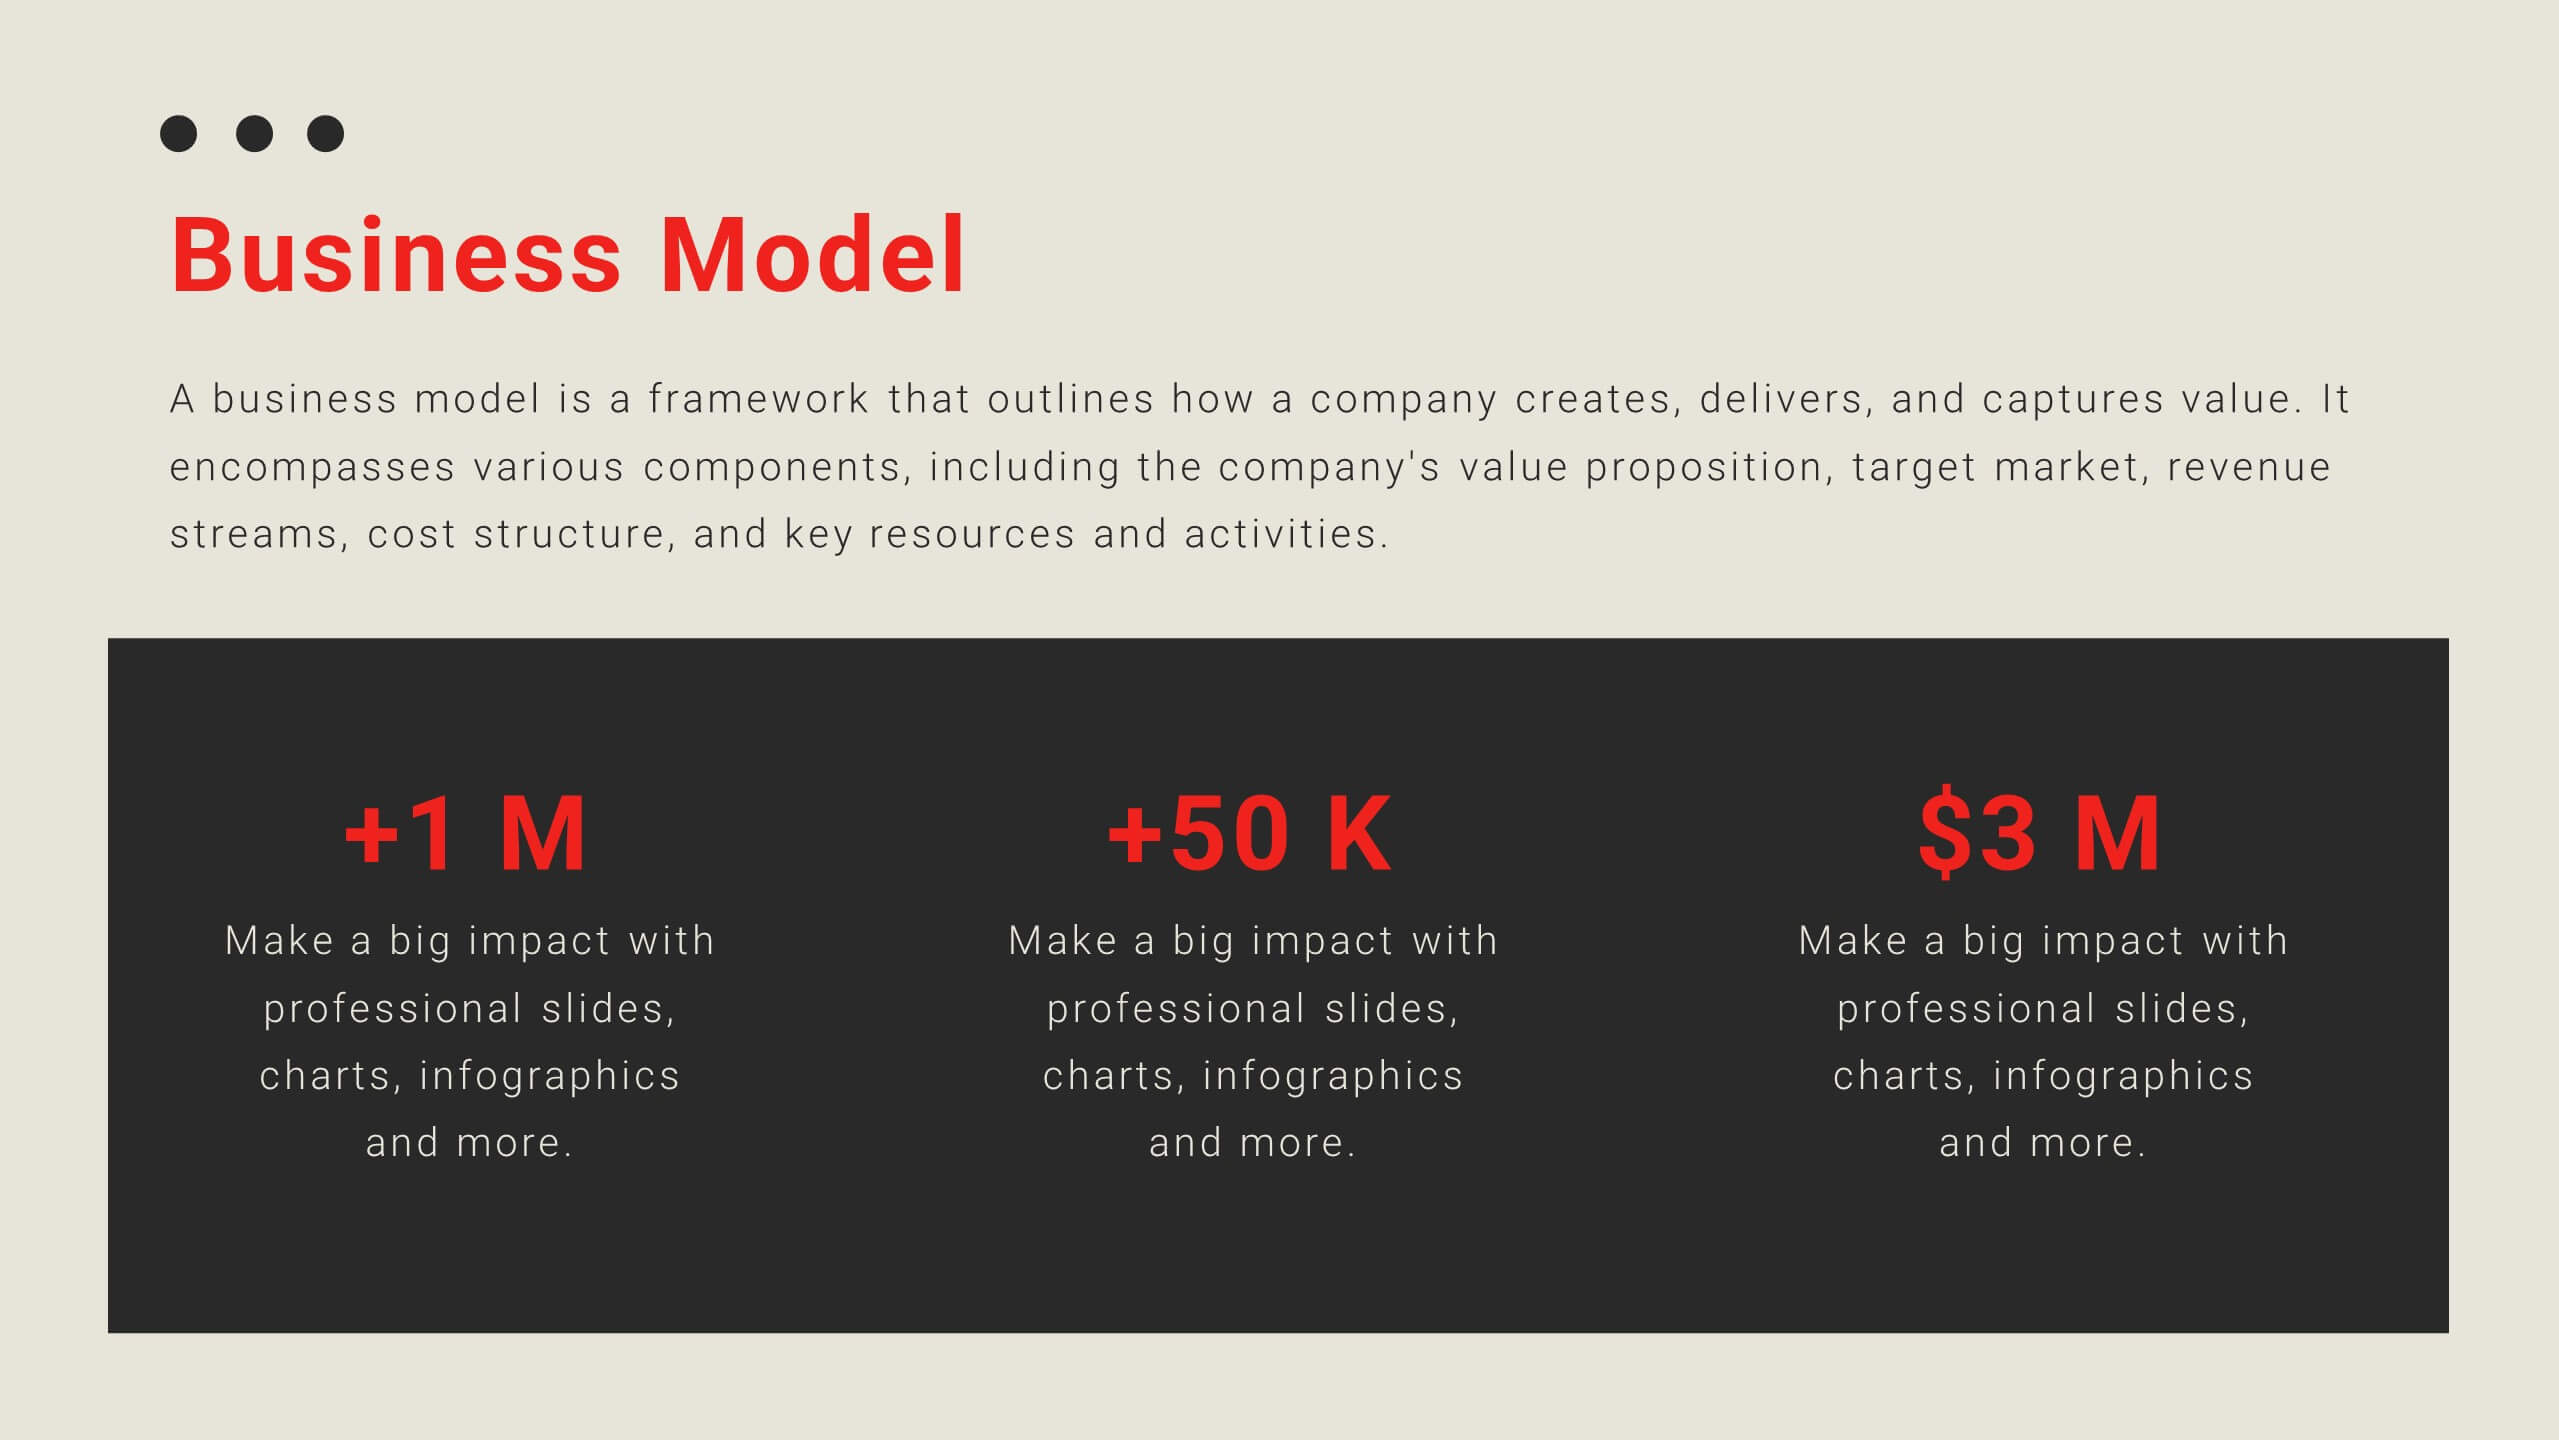
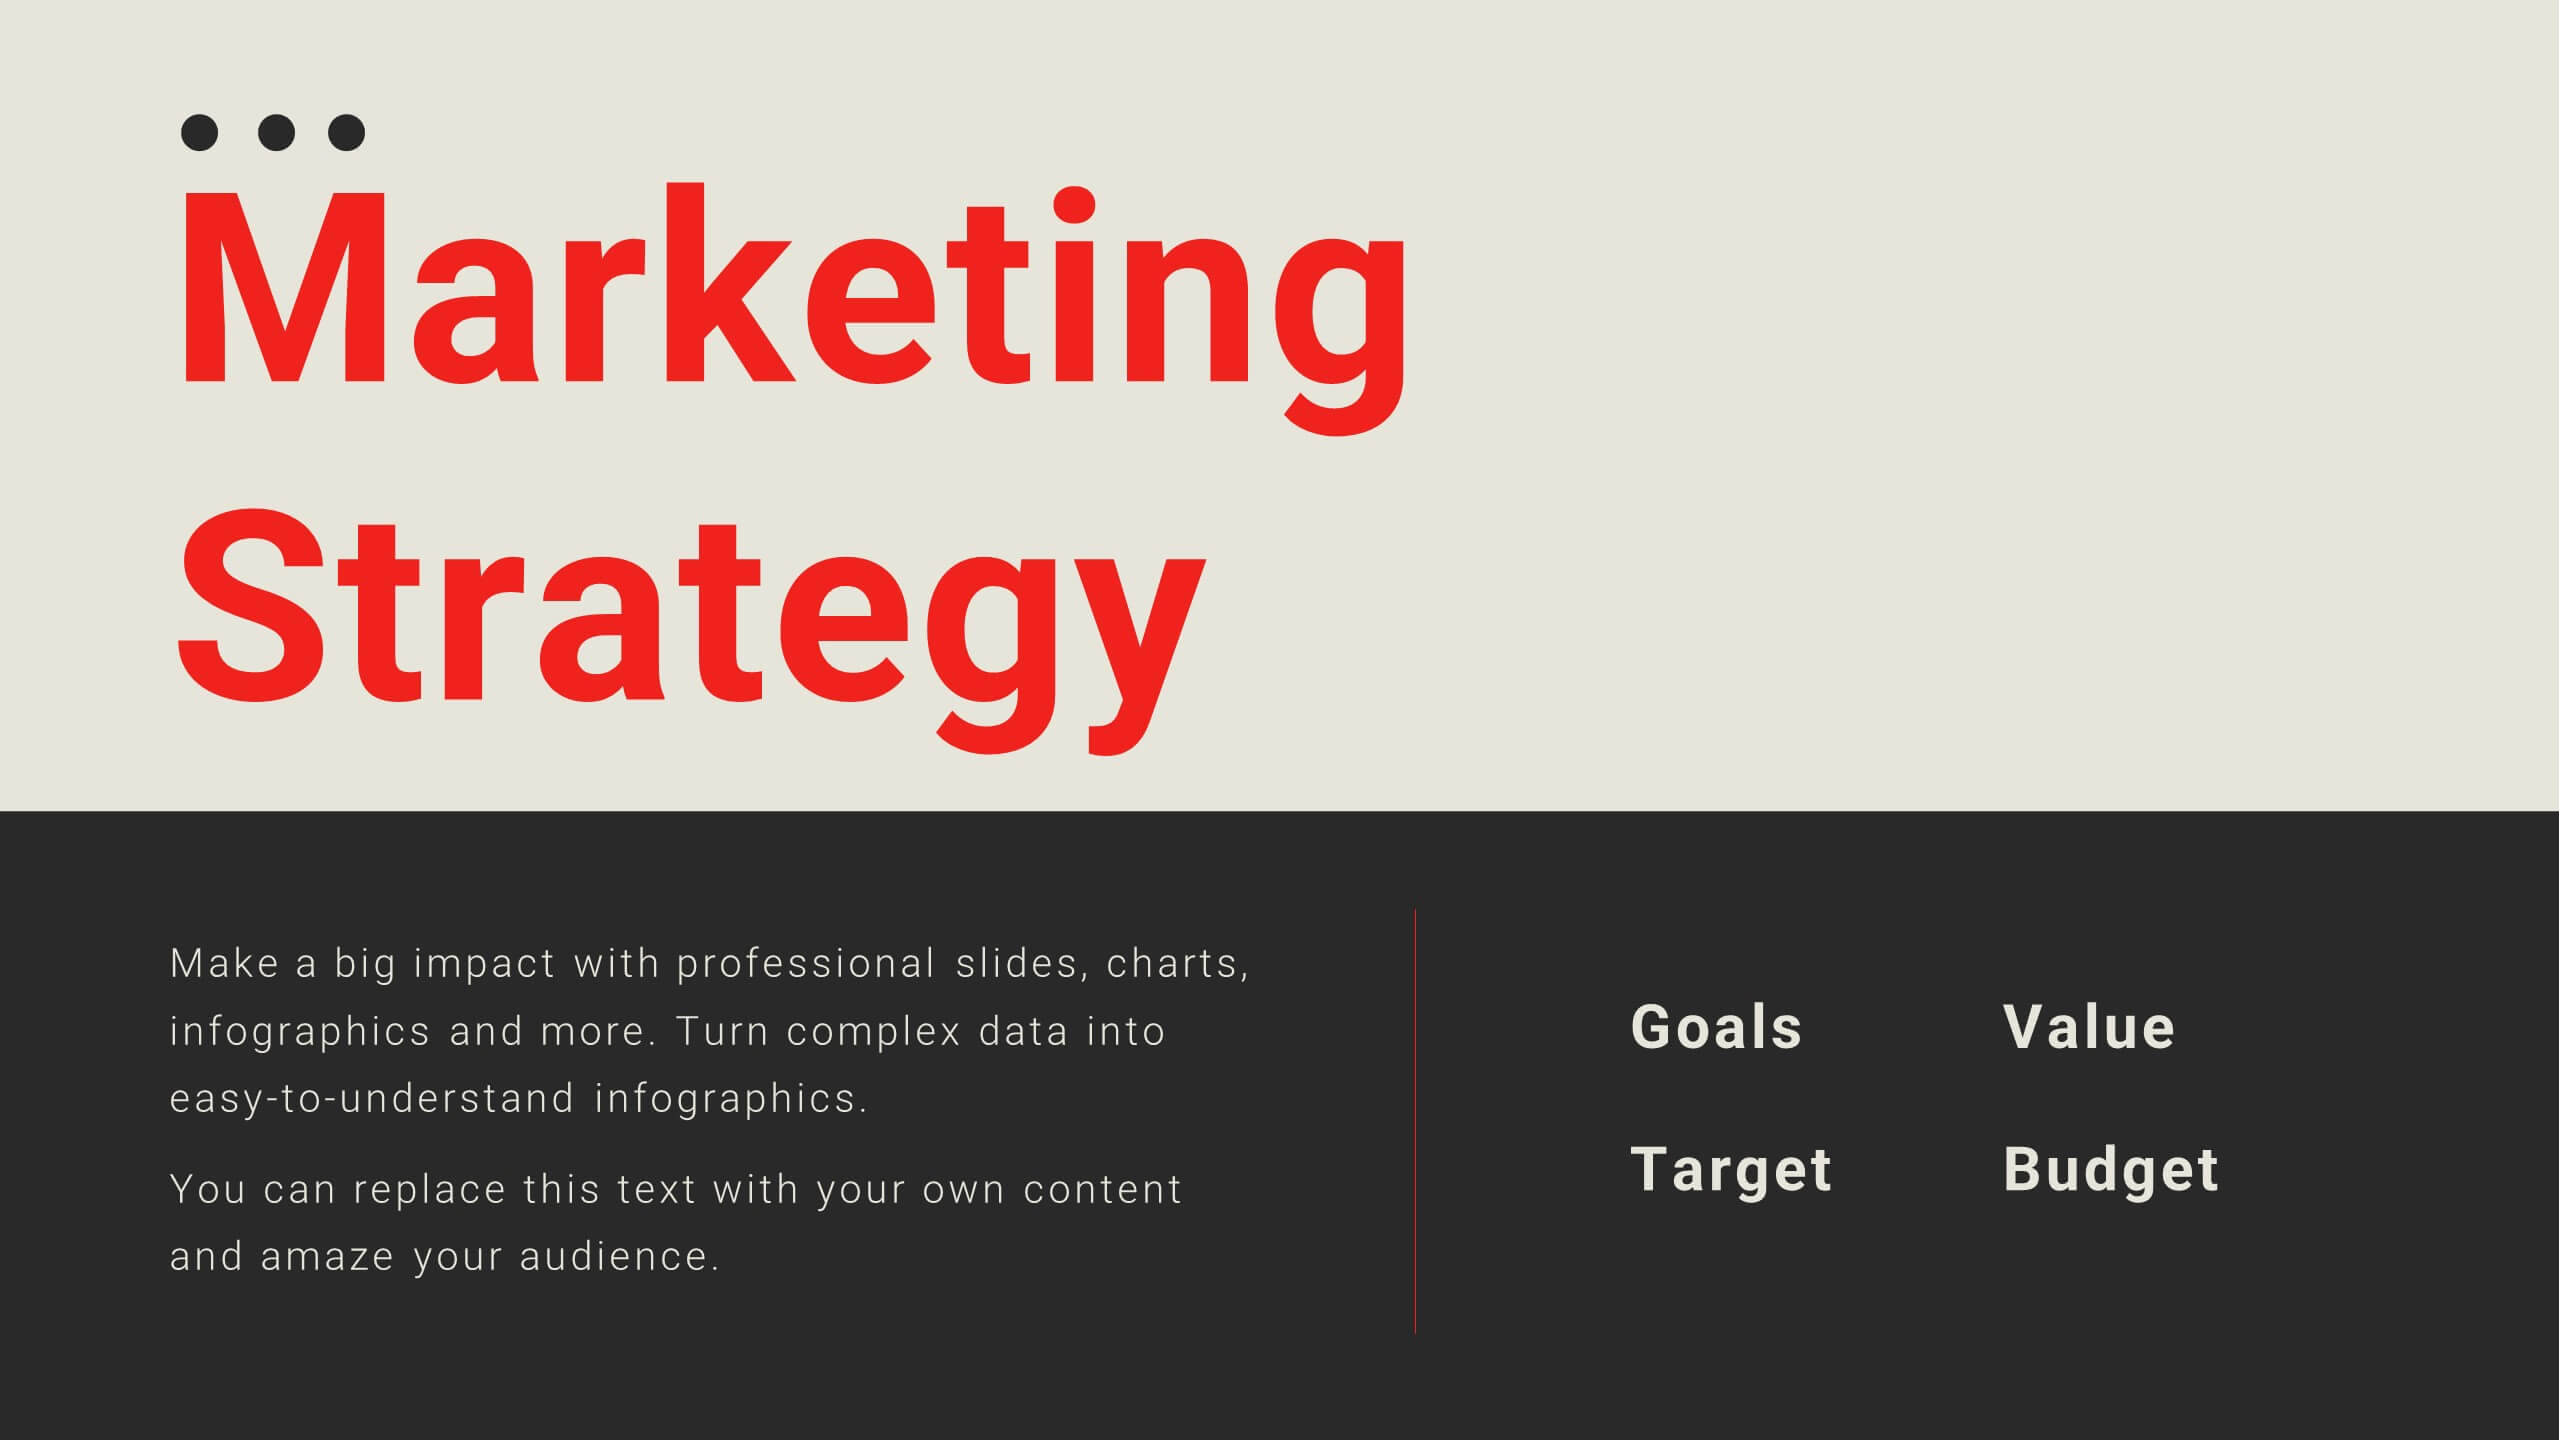
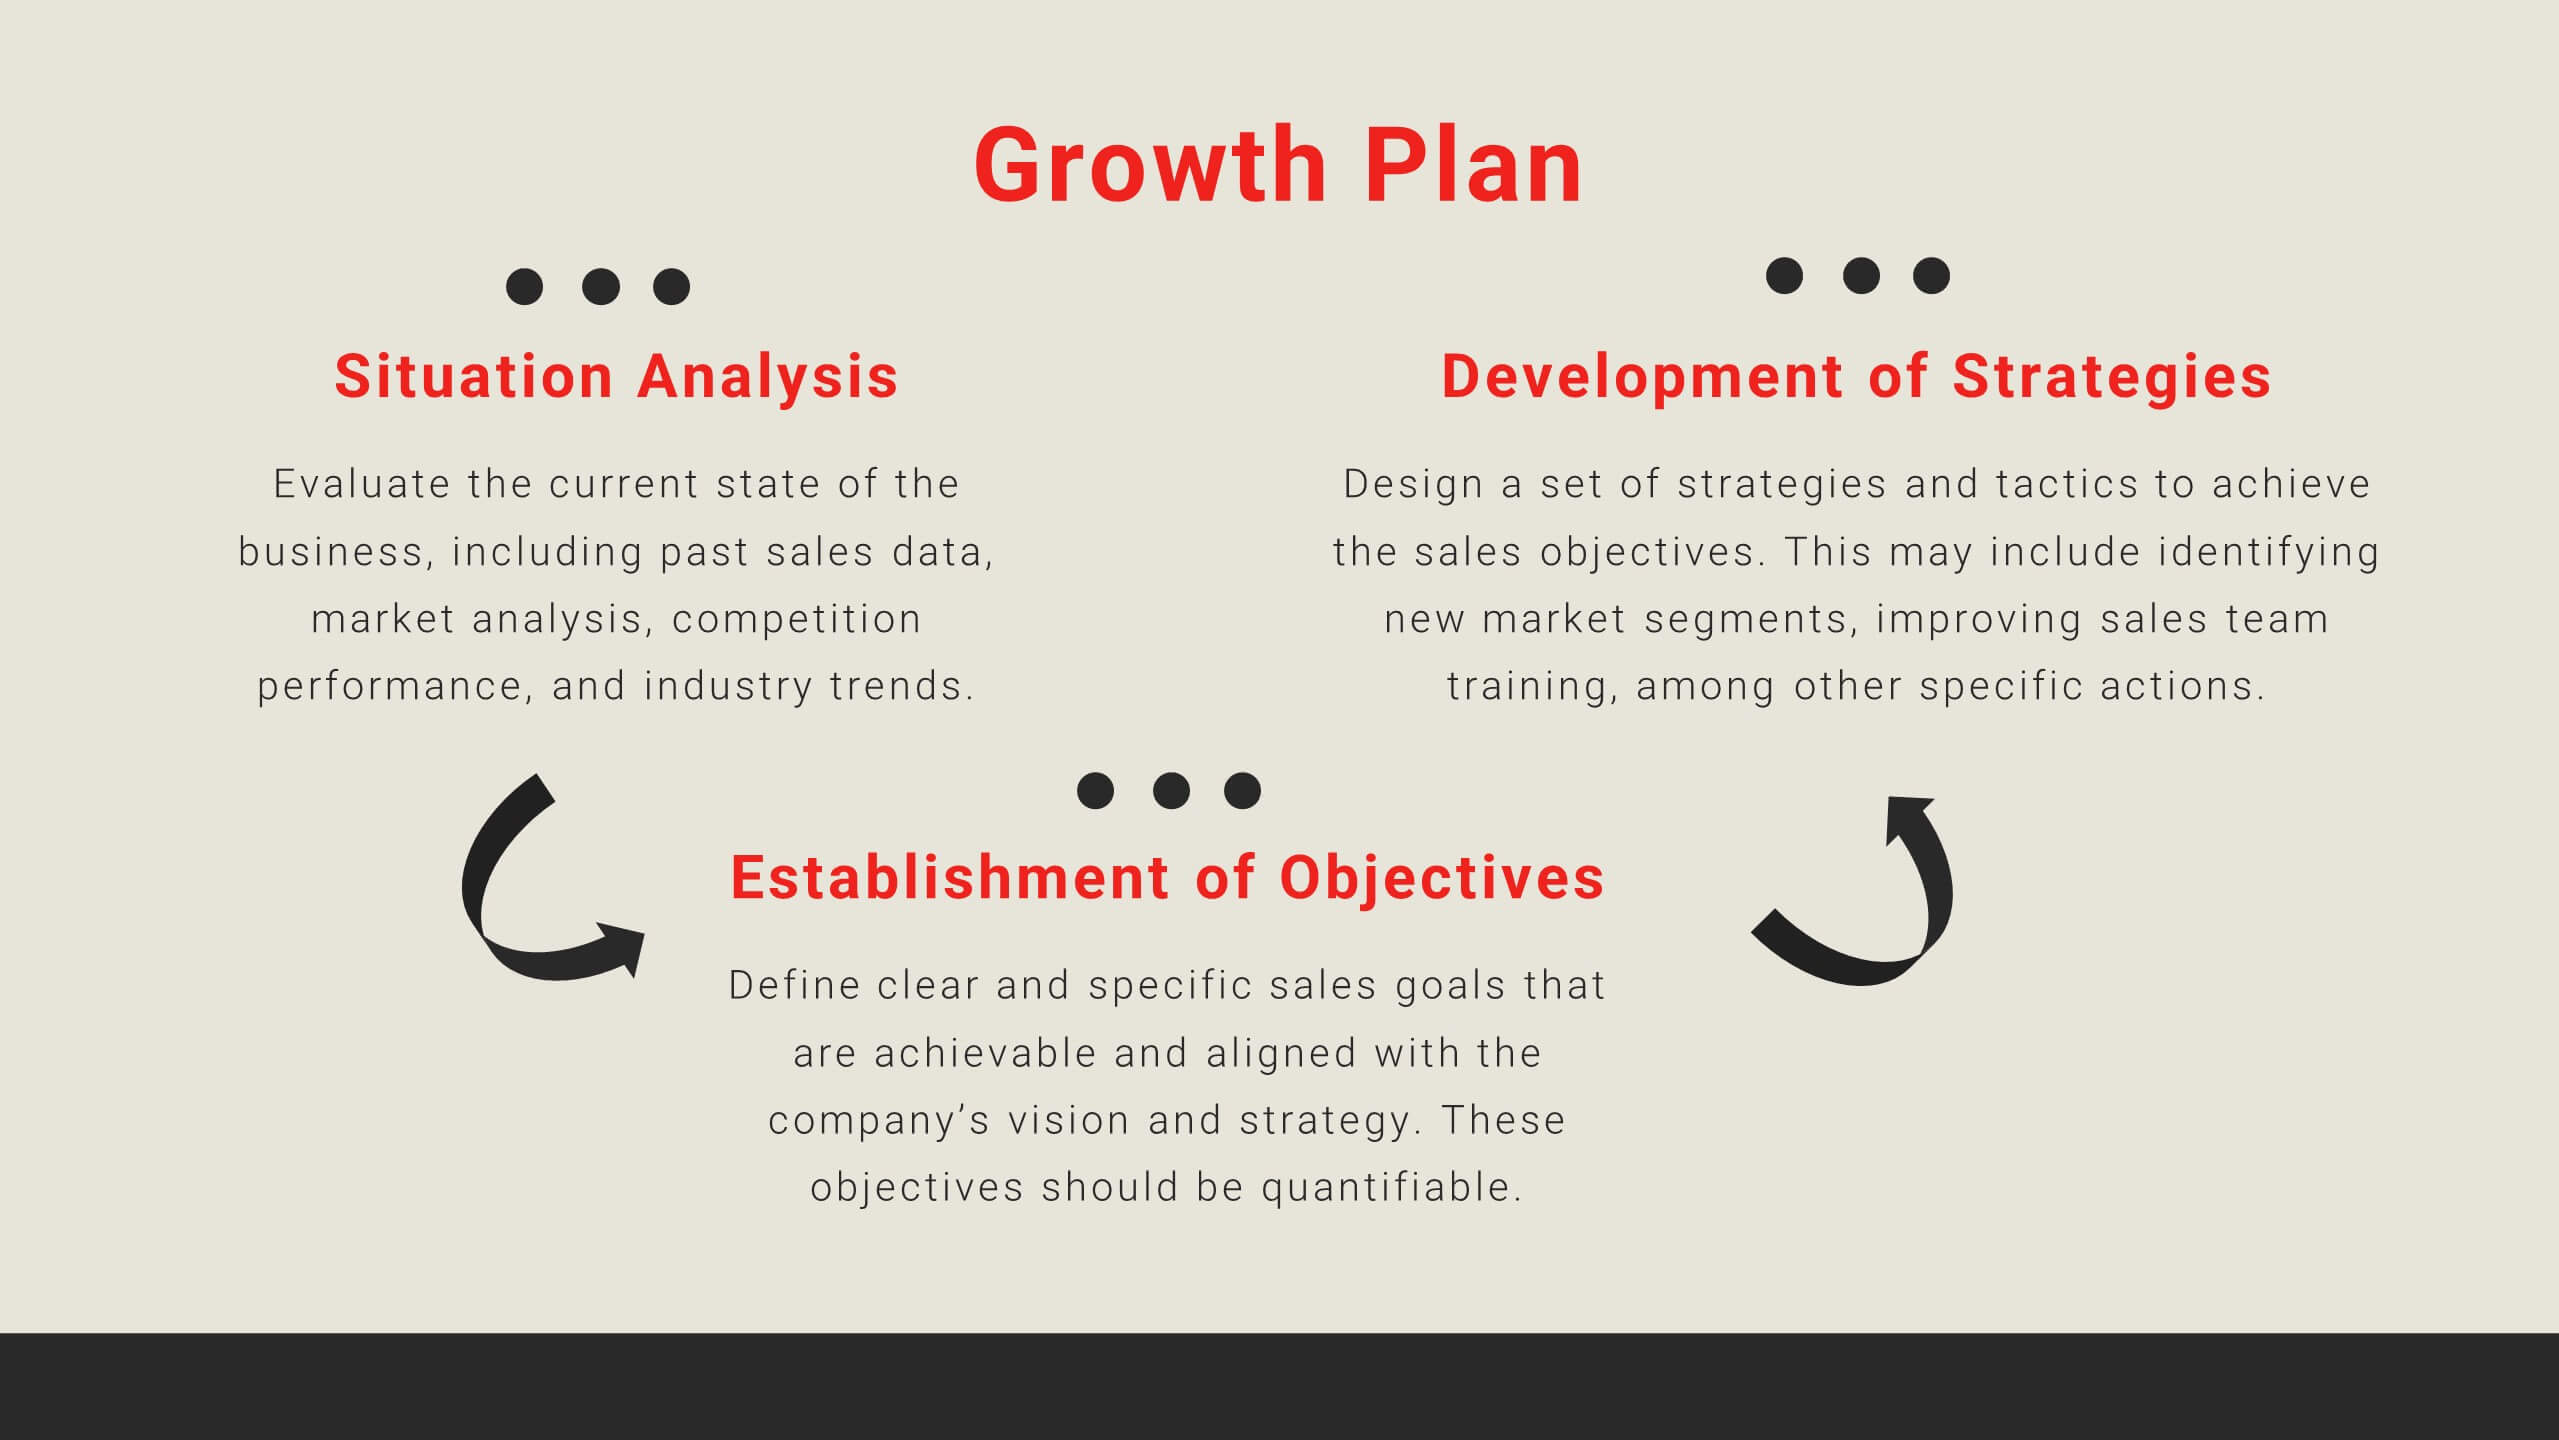
Velocity Startup Growth Plan Presentation
Accelerate your startup's growth with this dynamic plan template! Perfect for outlining your mission, vision, business model, and marketing strategy. Ideal for entrepreneurs aiming to secure funding and drive success. Compatible with PowerPoint, Keynote, and Google Slides, this template ensures your growth plan is clear, professional, and compelling. Achieve your startup goals today!


5 diapositivas
Business Insights Through Dashboard Visualization Presentation
Visualize key metrics with this Business Insights Through Dashboard Visualization presentation. The funnel chart layout is ideal for showcasing conversion rates, customer journeys, or sales processes. Each section includes clear labels and percentage indicators. Fully editable in Canva, PowerPoint, and Google Slides to suit your business reporting needs.


7 diapositivas
Website Mockup Infographic
Enhance your digital presence with this curated collection of website mockup templates, meticulously designed to showcase your online projects with clarity and professional flair. Each template features vibrant layouts that display your website designs on various digital devices, providing a comprehensive view of how your site will look across different platforms. These mockups are crafted with precision, emphasizing the responsive nature of web design and ensuring that your visuals translate beautifully from desktops to mobile devices. The use of bright colors and clear, concise text areas within the mockups makes them both attention-grabbing and informative. Perfect for web designers, developers, or digital marketers, these mockups are essential tools for client presentations, portfolio displays, or marketing pitches. They allow you to demonstrate the functionality and aesthetics of your website effectively, ensuring your digital projects resonate with your target audience.


4 diapositivas
Team Planning and Event Calendar
Turn chaos into coordination with this visual-first layout that simplifies how your team plans, tracks, and communicates project milestones. Each calendar block highlights key players, deadlines, and status updates—perfect for keeping everyone aligned and informed at a glance. Fully compatible with PowerPoint, Keynote, and Google Slides.