


Características


¿Tienes alguna pregunta?
Recomendar


20 diapositivas
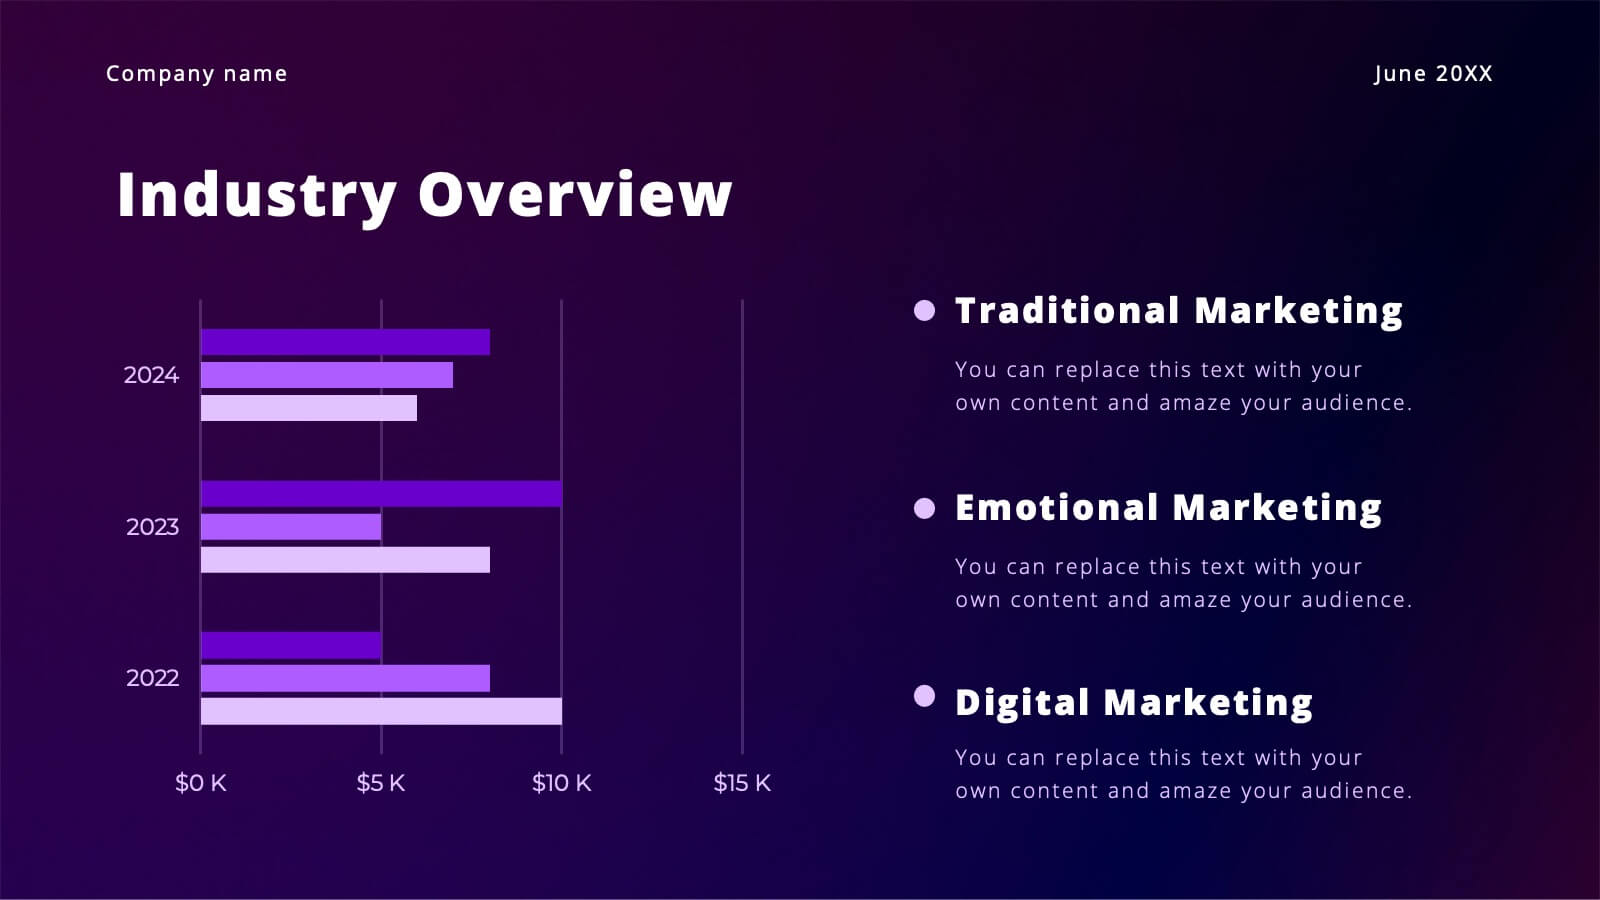
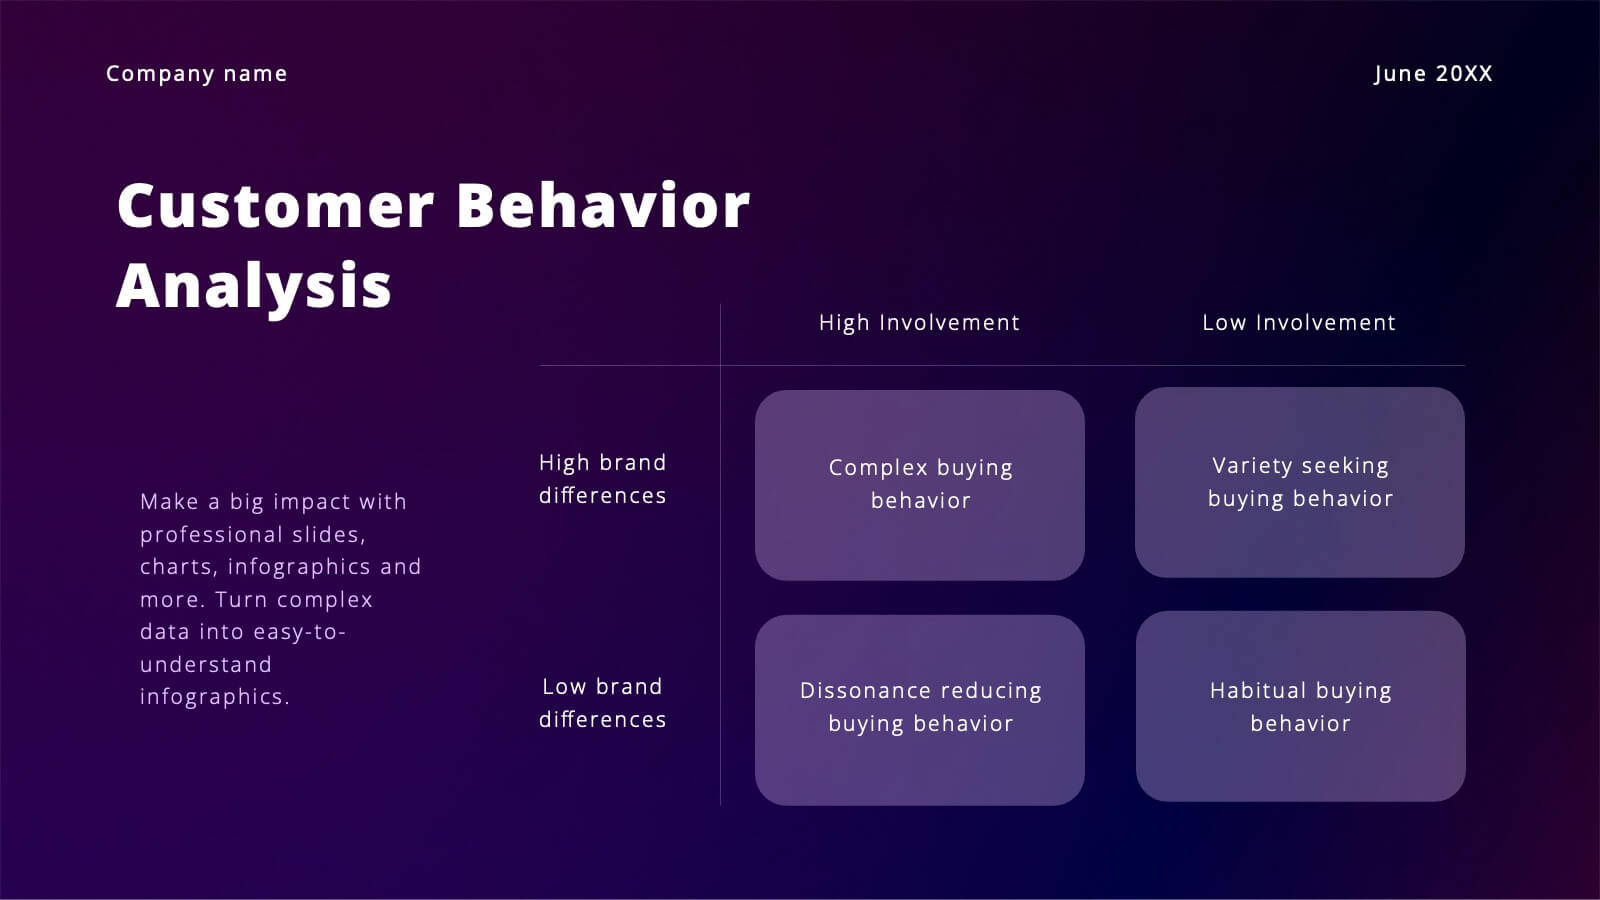
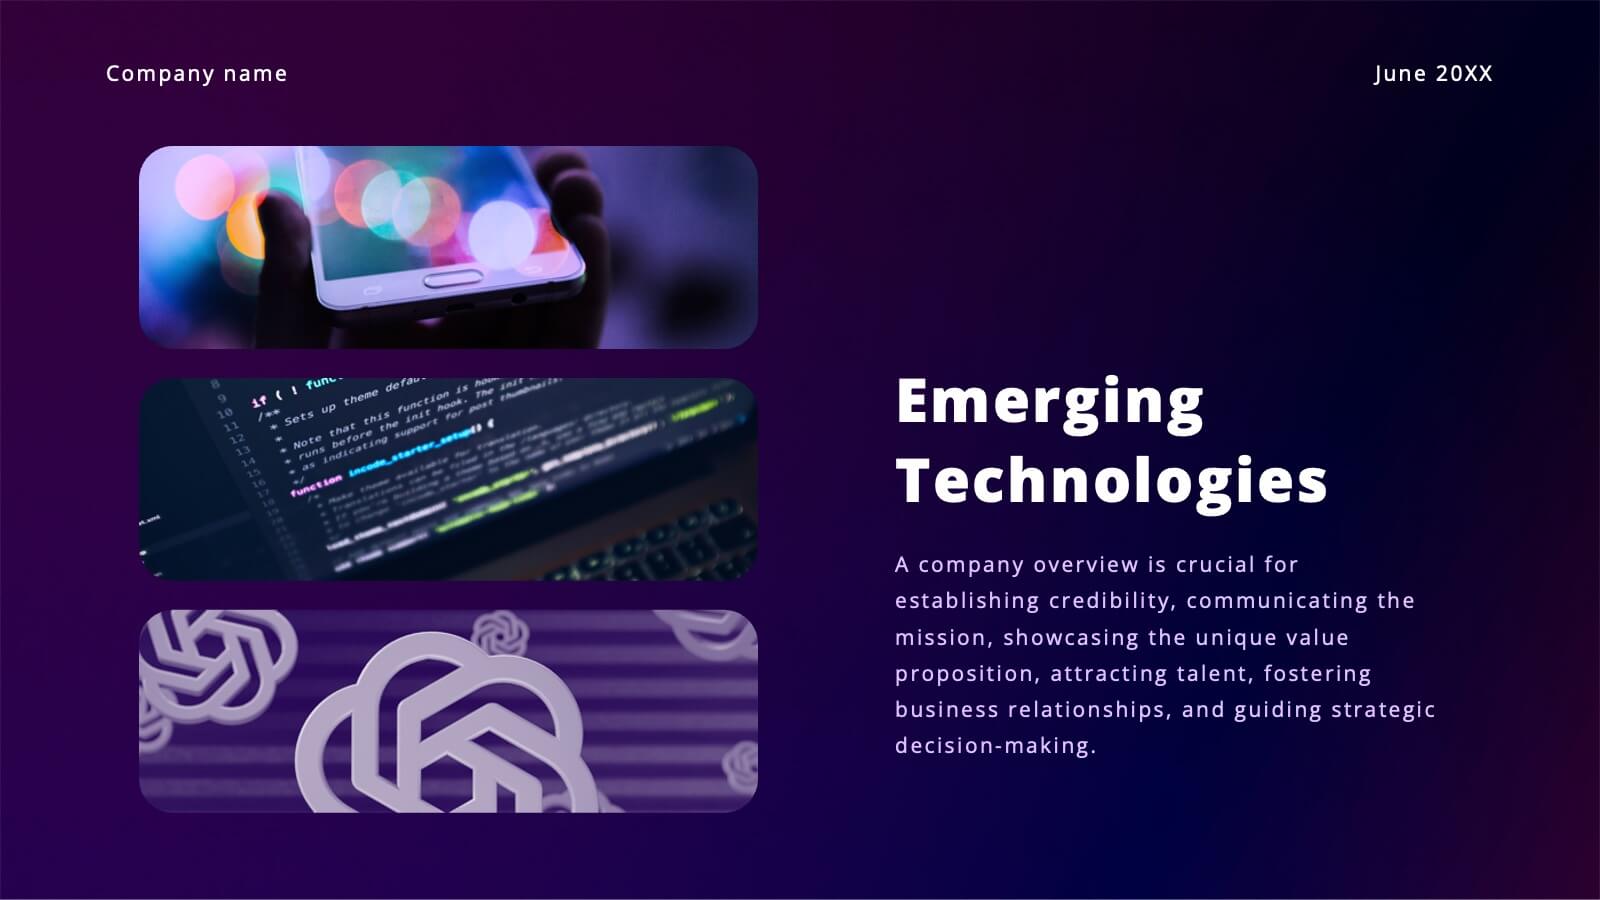
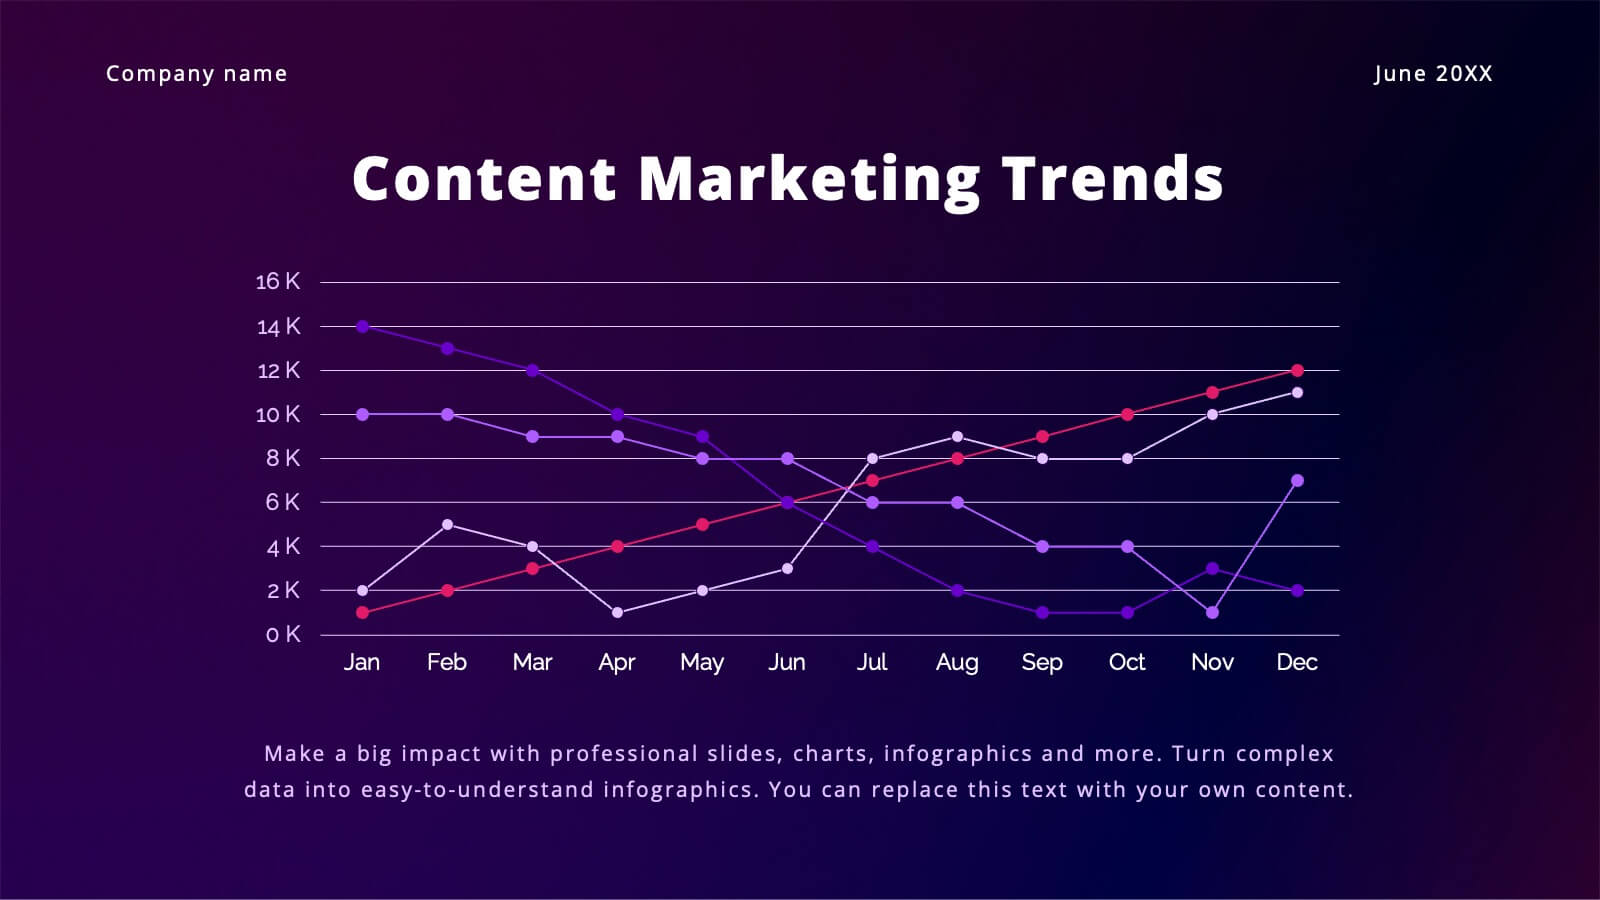
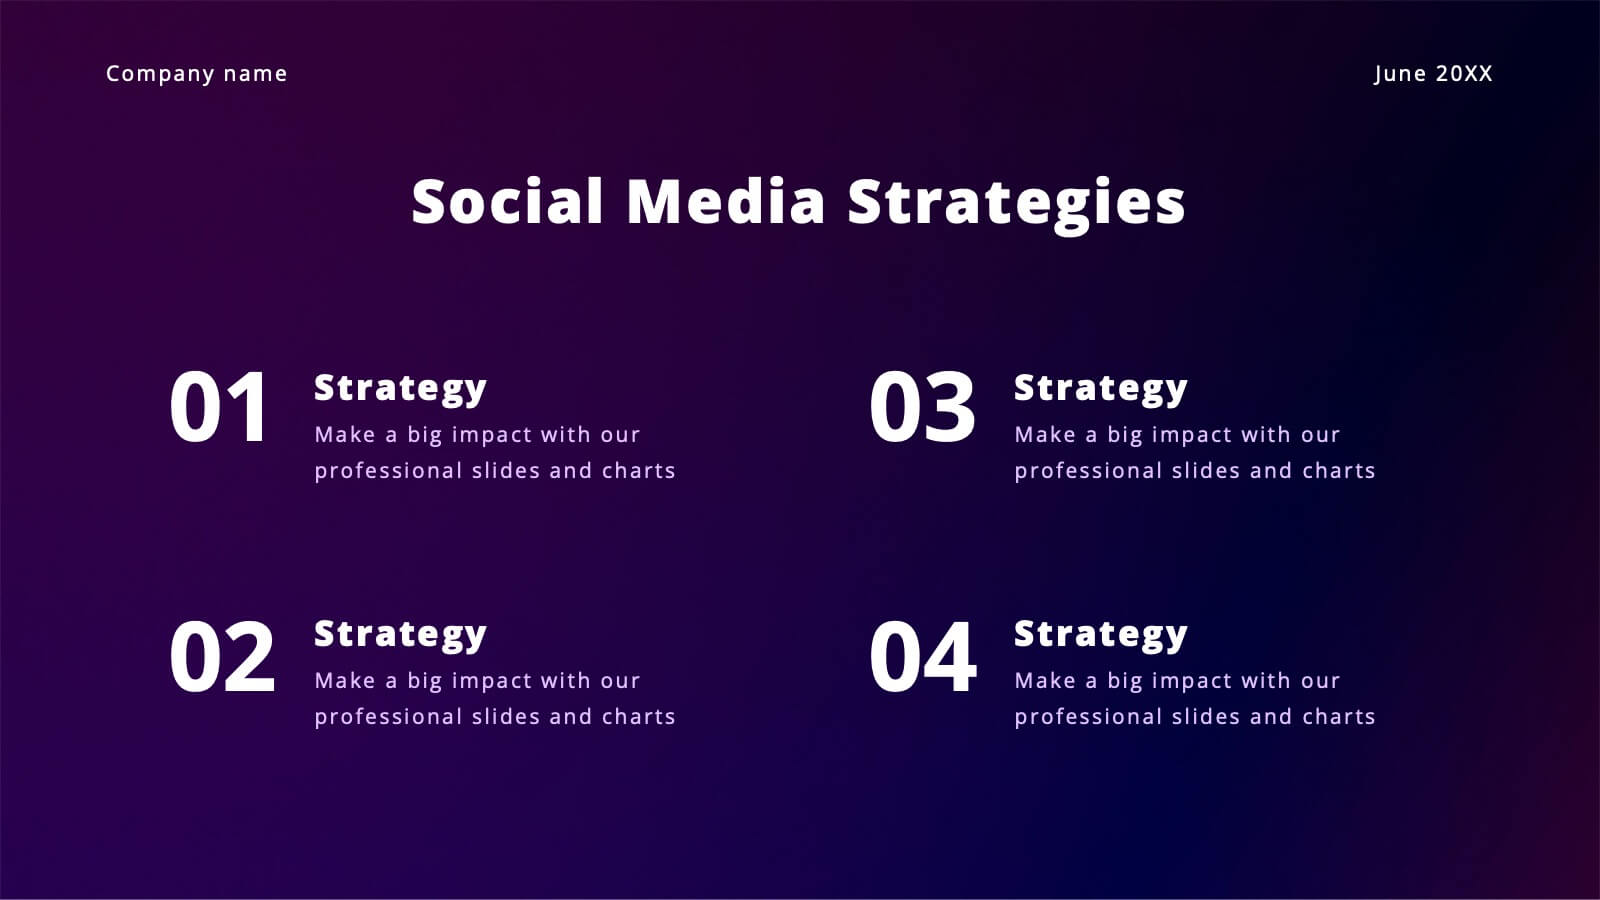
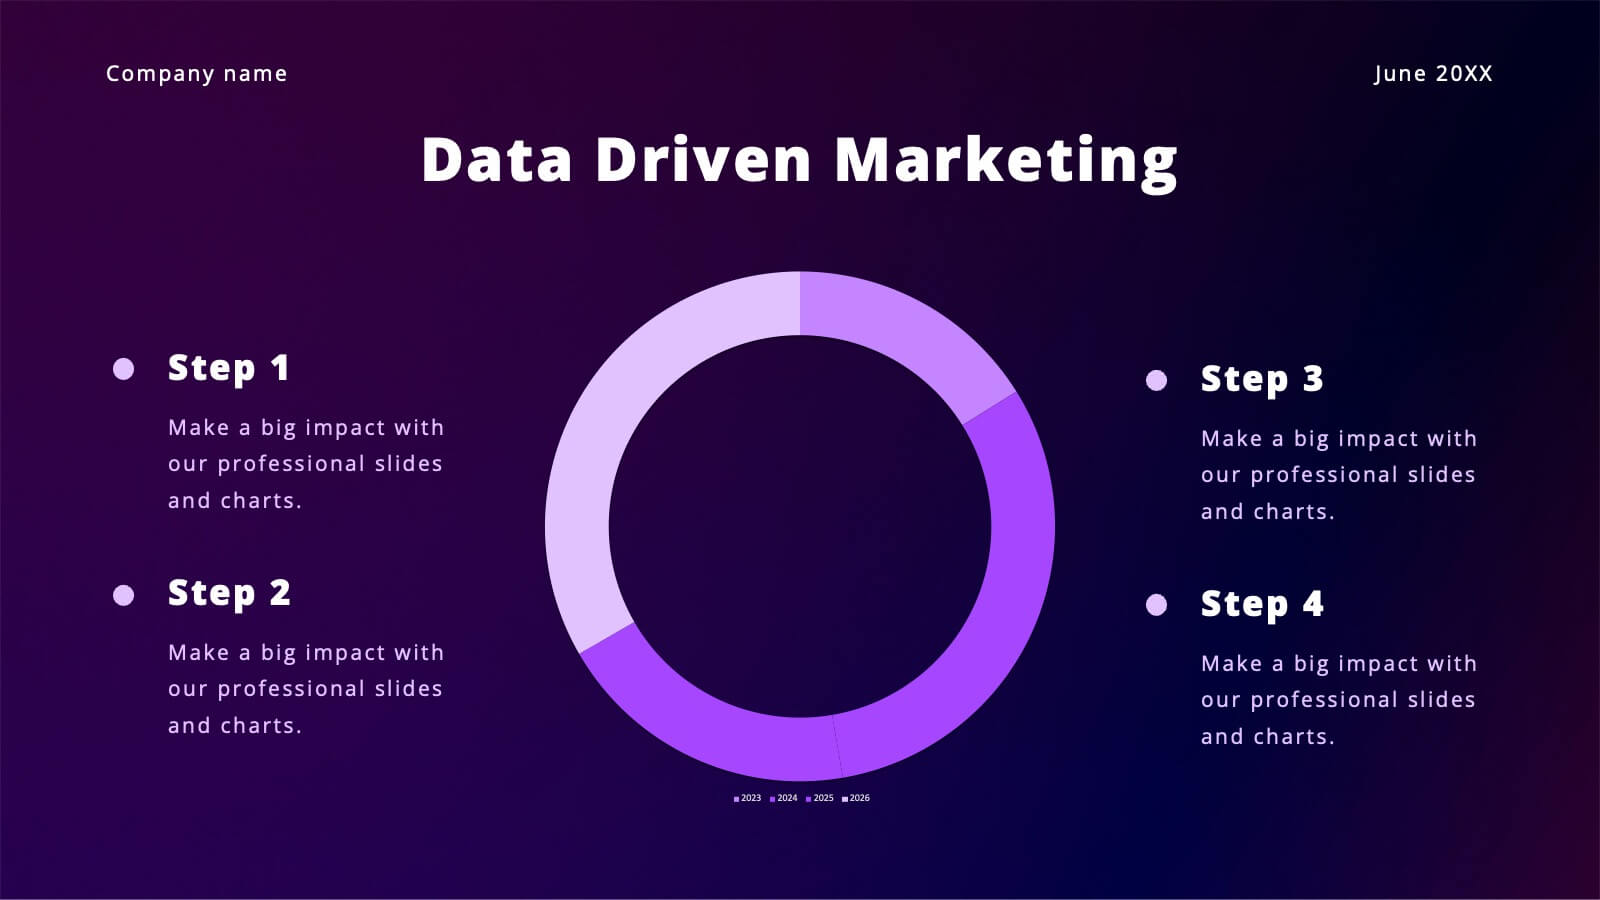
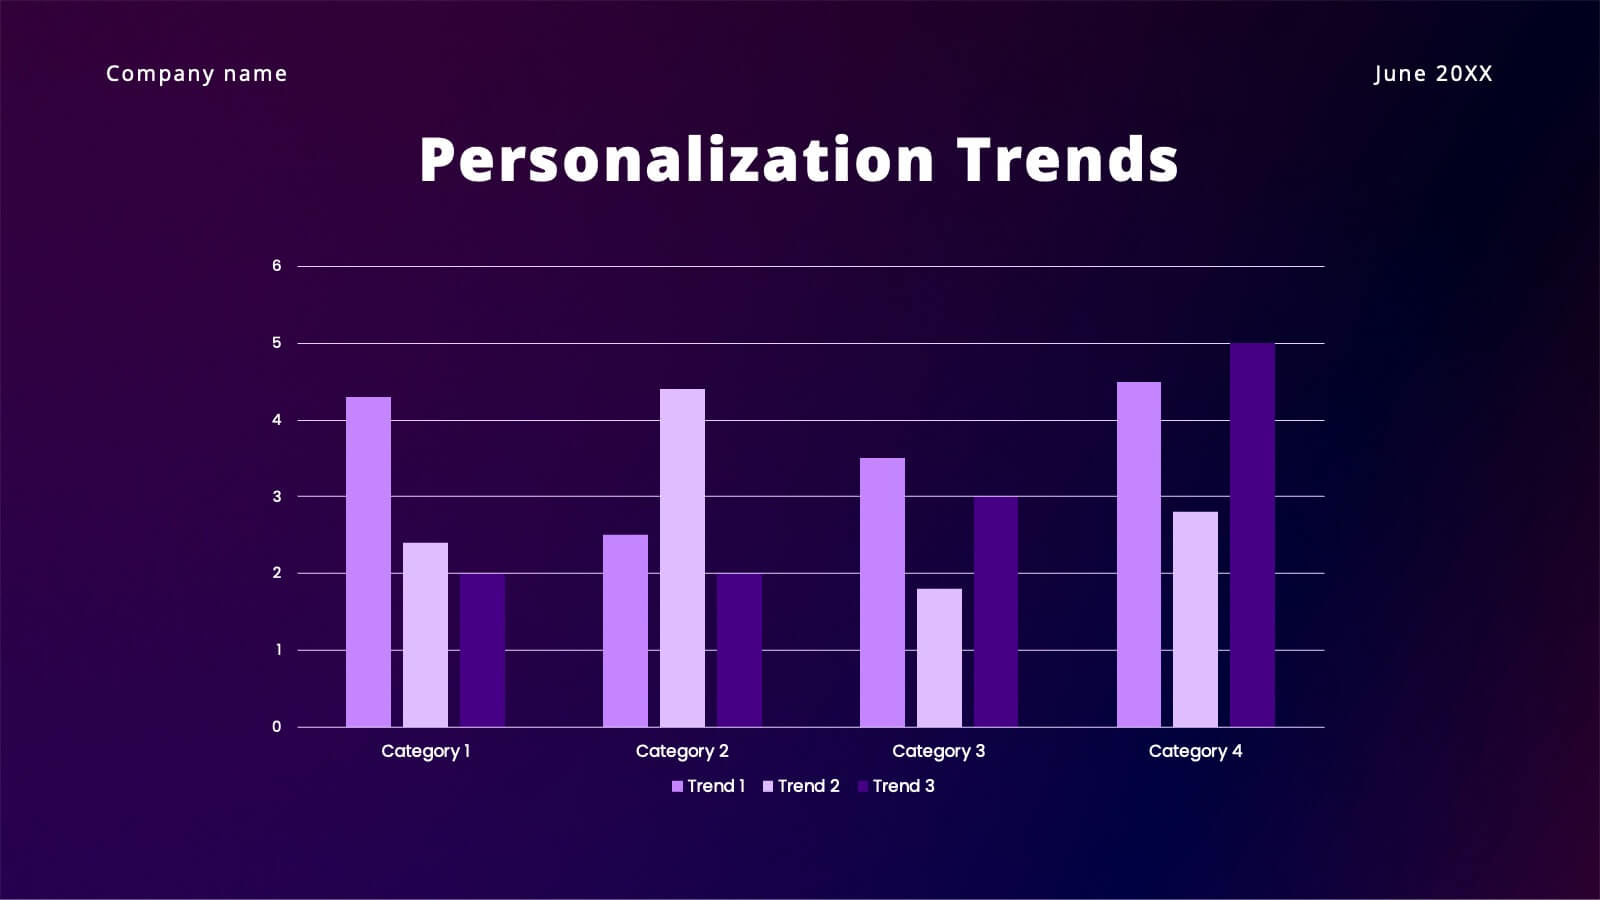
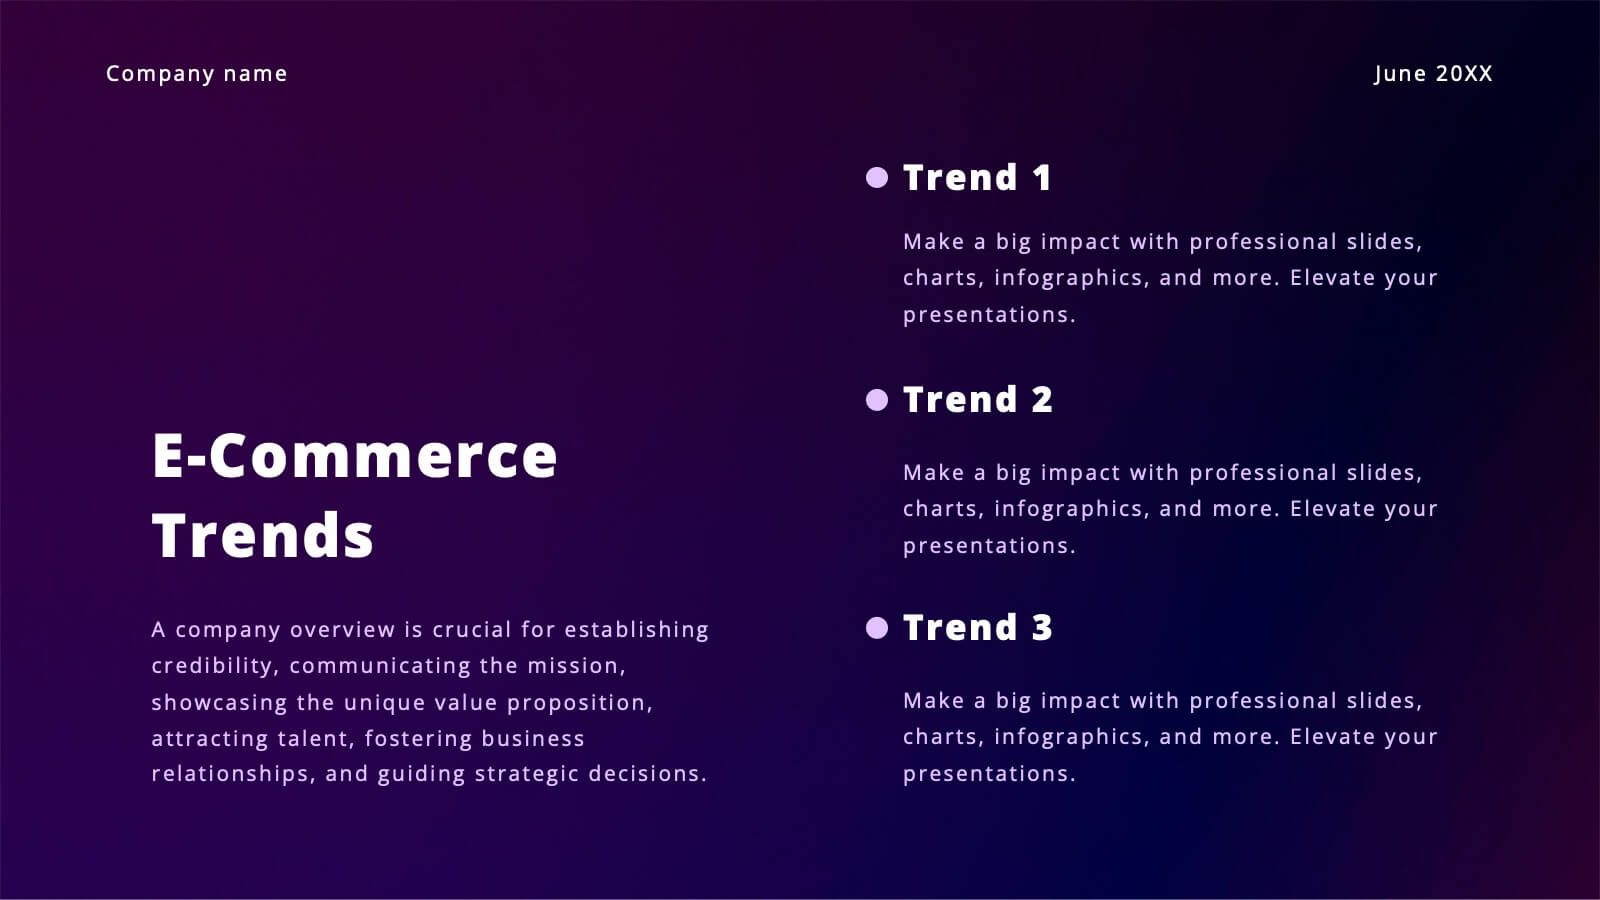
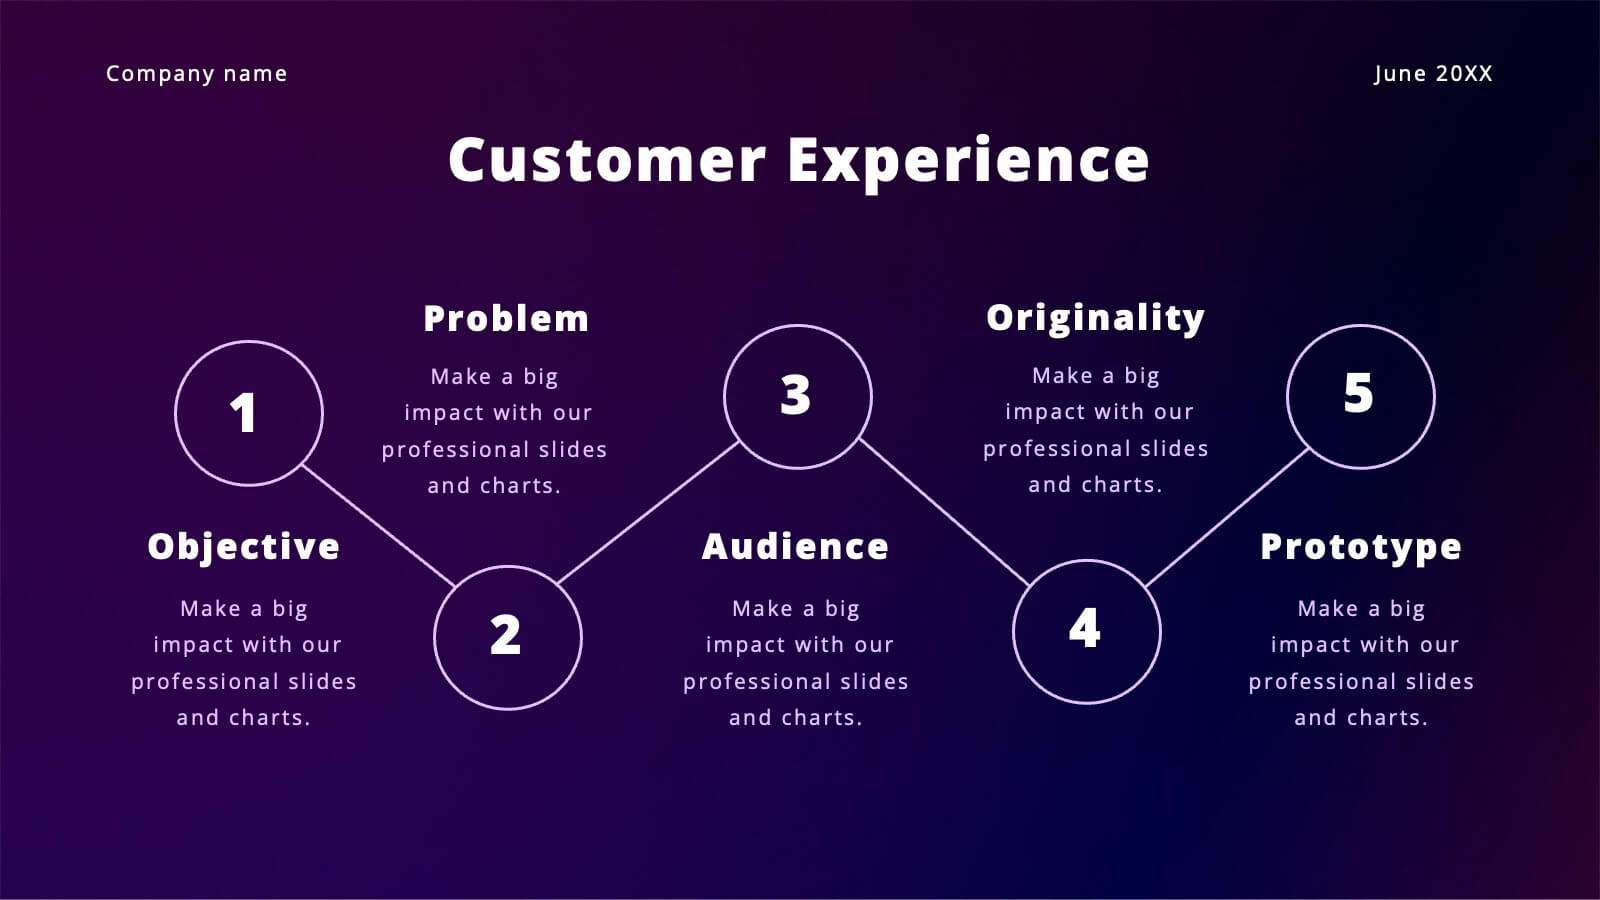
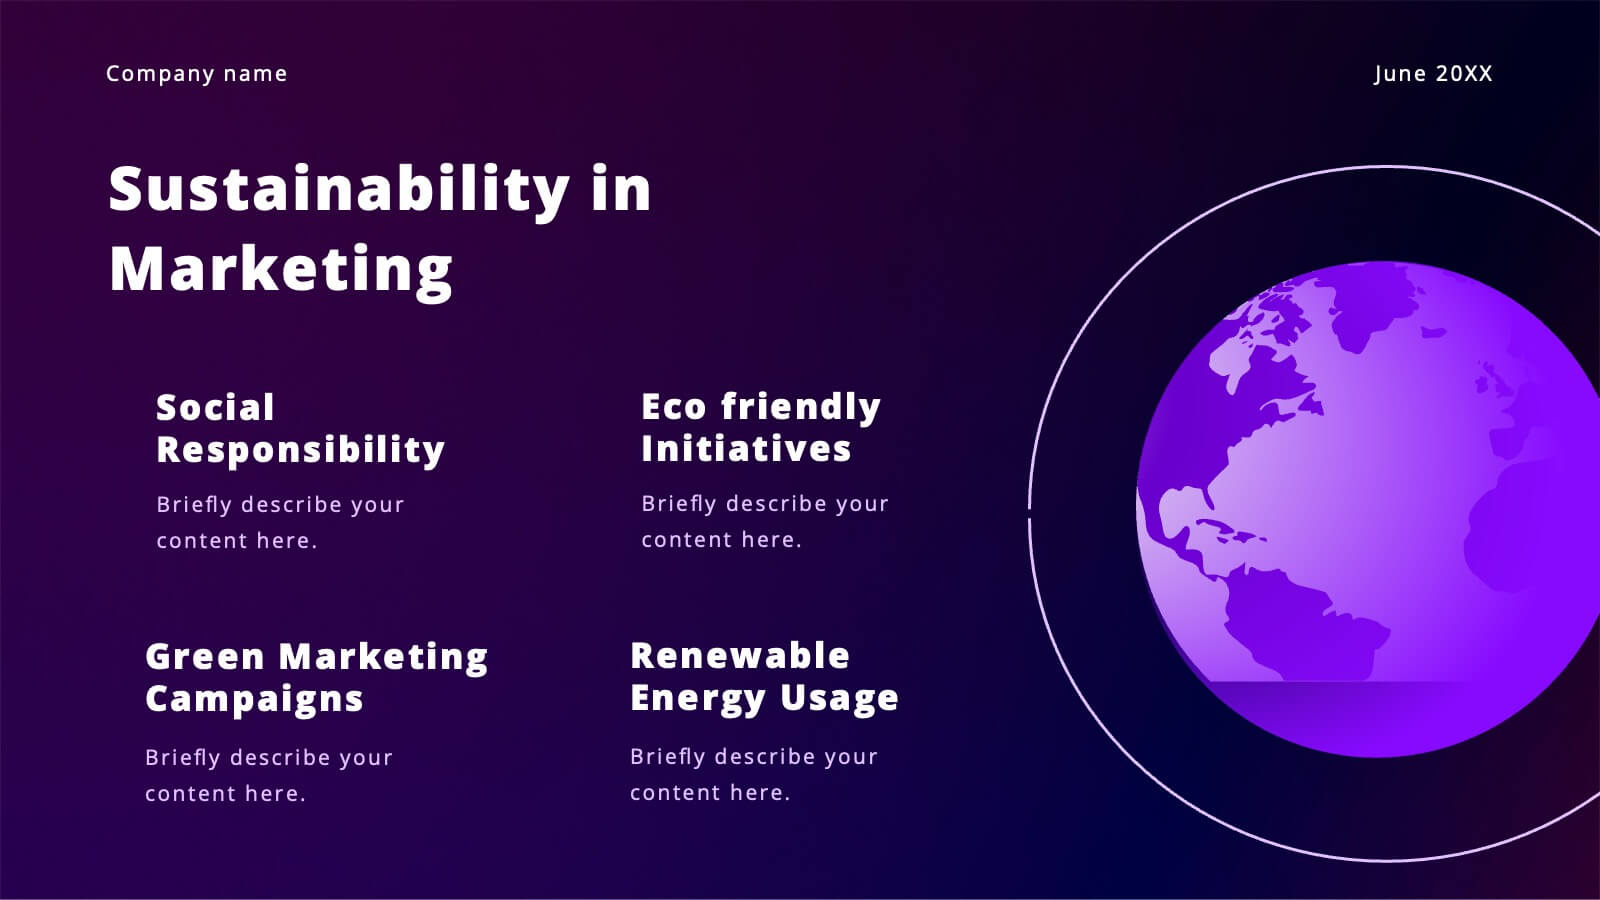
Vibrant Content Marketing Pitch Deck Presentation
Boost your marketing pitch with this vibrant deck! Covering industry overviews, customer behavior analysis, and emerging technologies, it’s designed to captivate your audience. Highlight social media strategies, data-driven marketing, and e-commerce trends effortlessly. Perfect for presenting a comprehensive marketing plan. Compatible with PowerPoint, Keynote, and Google Slides. Make your next pitch stand out!


4 diapositivas
Scrum Team Retrospective Overview Deck Presentation
Reflect on past sprints with this structured Scrum Team Retrospective Deck. Featuring four quadrants for clear team feedback—what worked, what didn’t, ideas for improvement, and action items. Ideal for agile coaches and team leads. Fully editable in PowerPoint, Keynote, and Google Slides to match your team's review process.


6 diapositivas
Digital Marketing Consultancy Infographics
Our Digital Marketing Consultancy infographic is an essential visual tool for Powerpoint, Keynote, and Google Slides presentations, tailor-made for digital marketing consultants, strategists, and educators. This infographic is designed to visually articulate the impact and results of digital marketing strategies and campaigns. The Digital Marketing Consultancy infographic presents key marketing metrics in an easily digestible format, from social media engagement rates to website traffic and conversion statistics. It's perfect for showcasing the success of digital marketing efforts and for explaining the return on investment (ROI) to stakeholders. The visual design is crafted to be both informative and attention-grabbing, ensuring your audience fully grasps the significance of the data presented. By using this infographic in your presentations, you can effectively communicate complex digital marketing concepts and analytics to your audience. Whether you’re reporting to clients, training a team, or teaching students, this infographic will enhance your ability to convey essential marketing insights in a clear and engaging manner. Incorporate it into your presentation materials to highlight the benefits and effectiveness of strategic digital marketing initiatives.


2 diapositivas
Small Business Success Illustrations
Get your business on the right track with our small business success illustrations pack! These illustrations will help you with your next business presentation and make it more engaging and catchy. Fully compatible with Powerpoint, Keynote, and Google Slides. You can use these in your website, blog or social media posts. Turn your vision into a reality—download the small business success illustrations pack today!


3 diapositivas
Training & Development Modules Presentation
Present your program structure with the Training & Development Modules Presentation. This slide design features a 3D cube layout that clearly illustrates three learning modules, each with space for a title, icon, and description. Ideal for onboarding, employee growth, or educational programs. Fully editable in Canva, PowerPoint, Keynote, and Google Slides.


5 diapositivas
Leadership and Workforce Culture
Inspire growth from the ground up with this bold, step-by-step visual that captures the journey of leadership and team development. From culture-building to individual progress, this layout helps you illustrate each stage clearly and confidently. Fully compatible with PowerPoint, Keynote, and Google Slides.


5 diapositivas
Five-Step Process Improvement Presentation
Streamline operations with the Five-Step Process Improvement presentation. This template visually maps out key phases of business optimization, using a structured timeline to highlight each step's purpose and impact. Perfect for project managers, consultants, and corporate strategists, this design helps teams track progress and refine workflows effectively. Fully editable and compatible with PowerPoint, Keynote, and Google Slides for effortless customization.


7 diapositivas
Security Jobs Infographic
Security jobs refer to roles and positions within various industries that primarily focus on safeguarding individuals, properties, data, and assets from potential threats, risks, or unauthorized access. This infographic template is designed to shed light on the diverse and dynamic world of security professions. Fully customizable and compatible with Powerpoint, Keynote, and Google Slides. This infographic is your gateway to understanding the vital roles that contribute to a safer world. Discover your path, protect communities, and embark on a fulfilling career journey in security.


7 diapositivas
Milestones in Project Management Infographic
Showcase the journey of your projects with our Milestones in Project Management Infographic, perfect for project managers, team leaders, and business strategists. This infographic is designed to visually communicate the key achievements and phases of your project timeline. Our infographic allows for a clear depiction of project progress, with markers for each significant milestone achieved. It's an effective tool for reflecting on past successes, current status, and future objectives. With customizable timelines and milestone markers, you can illustrate the path your project has taken, highlight critical deliverables, and forecast upcoming targets. This SEO-friendly infographic is crafted to enhance reports, presentations, and project reviews, making it a valuable asset for stakeholder communication. Employ this infographic to present a cohesive narrative of your project's development, celebrate accomplishments, and maintain momentum towards your project goals.


7 diapositivas
Feedback Infographics Presentation Template
The goal of feedback is to recognize strengths and improve weaknesses. Feedback, both positive and negative, helps us see what we can improve on in order to better our results. This template is perfect for understanding how essential feedback is, and learning how to deliver feedback in a productive way. It provides positive criticism, showing what you can improve to achieve better results and success. Feedback provides the opportunity to learn, and is the most effective way to improve your skills. This template makes it simple to create an informed and well-rounded presentation to share.


21 diapositivas
Riverlyn Artist Portfolio Template Presentation
Showcase your creative journey with this dynamic portfolio template, crafted for artists and creators seeking to captivate their audience. Highlight your philosophy, style, and key projects with a visually engaging design that reflects your artistic identity. Share your creative process and collaborations to provide deeper insights into your work. This template includes sections for client testimonials, services offered, and pricing details, making it an excellent choice for both professional presentations and personal branding. Fully customizable and compatible with PowerPoint, Google Slides, and Keynote, it offers seamless adaptability to meet your unique needs. Ideal for artists aiming to leave a lasting impression!


6 diapositivas
Editable Weekly Calendar Slide Presentation
Bring your week into focus with a vibrant layout that turns daily planning into something you actually look forward to. This presentation helps you outline tasks, deadlines, and priorities in a clear, color-coded structure perfect for productivity. Fully editable and compatible with PowerPoint, Keynote, and Google Slides.


5 diapositivas
Core to Outer Ring Concentric Planning Presentation
Present your strategy from the inside out with the Core to Outer Ring Concentric Planning Presentation. This layered, radial design guides viewers through a central concept outward into supporting elements—ideal for planning, process modeling, or decision frameworks. Fully customizable in PowerPoint, Keynote, and Google Slides.


8 diapositivas
Architectural Design and Smart Home Trends Presentation
Showcase modern architecture insights and tech-savvy innovations with this layered home diagram slide. Ideal for real estate, construction, or smart home professionals, it highlights key features in a visually tiered format. Fully editable in PowerPoint, Keynote, and Google Slides—perfect for clean, tech-forward presentations with a sleek design.


6 diapositivas
Market Share Visualization Pie Chart Presentation
Showcase percentage breakdowns with impact using the Market Share Visualization Pie Chart Presentation. This infographic slide features a bold, segmented pie chart styled with cloud-shaped backdrops and colorful wedges, ideal for presenting market analysis, segment comparisons, or share allocation. Each slice is clearly labeled with percentage values and customizable titles, while matching icons reinforce your data points visually. Whether you're pitching to stakeholders or presenting internal reports, this design ensures clarity and engagement. Fully editable in PowerPoint, Keynote, and Google Slides.


21 diapositivas
Novaedge Professional Portfolio Showcase Presentation
Showcase your expertise with this elegant experience proposal presentation! Featuring sections like portfolio highlights, creative process, client testimonials, and pricing packages, it provides a complete overview of your work. Ideal for freelance professionals or agencies, this template ensures a polished presentation. Fully compatible with PowerPoint, Keynote, and Google Slides.


4 diapositivas
USA, Canada & Mexico Business Reach Presentation
Showcase your regional presence with the USA, Canada & Mexico Business Reach Presentation. This slide helps you pinpoint key business activities or initiatives across North America using colorful map markers and customizable icons. Ideal for market updates or growth plans. Fully editable in Canva, PowerPoint, and Google Slides.