


Características


¿Tienes alguna pregunta?
Recomendar


8 diapositivas
Data-Driven Feedback Analysis
Break down insights with precision using this Data-Driven Feedback Analysis presentation. Designed to showcase key points in a logical flow, this layout uses labeled segments (A–D) to categorize findings, highlight action items, and visualize patterns. Ideal for reports, audits, and feedback reviews. Fully editable in PowerPoint, Keynote, and Google Slides.


20 diapositivas
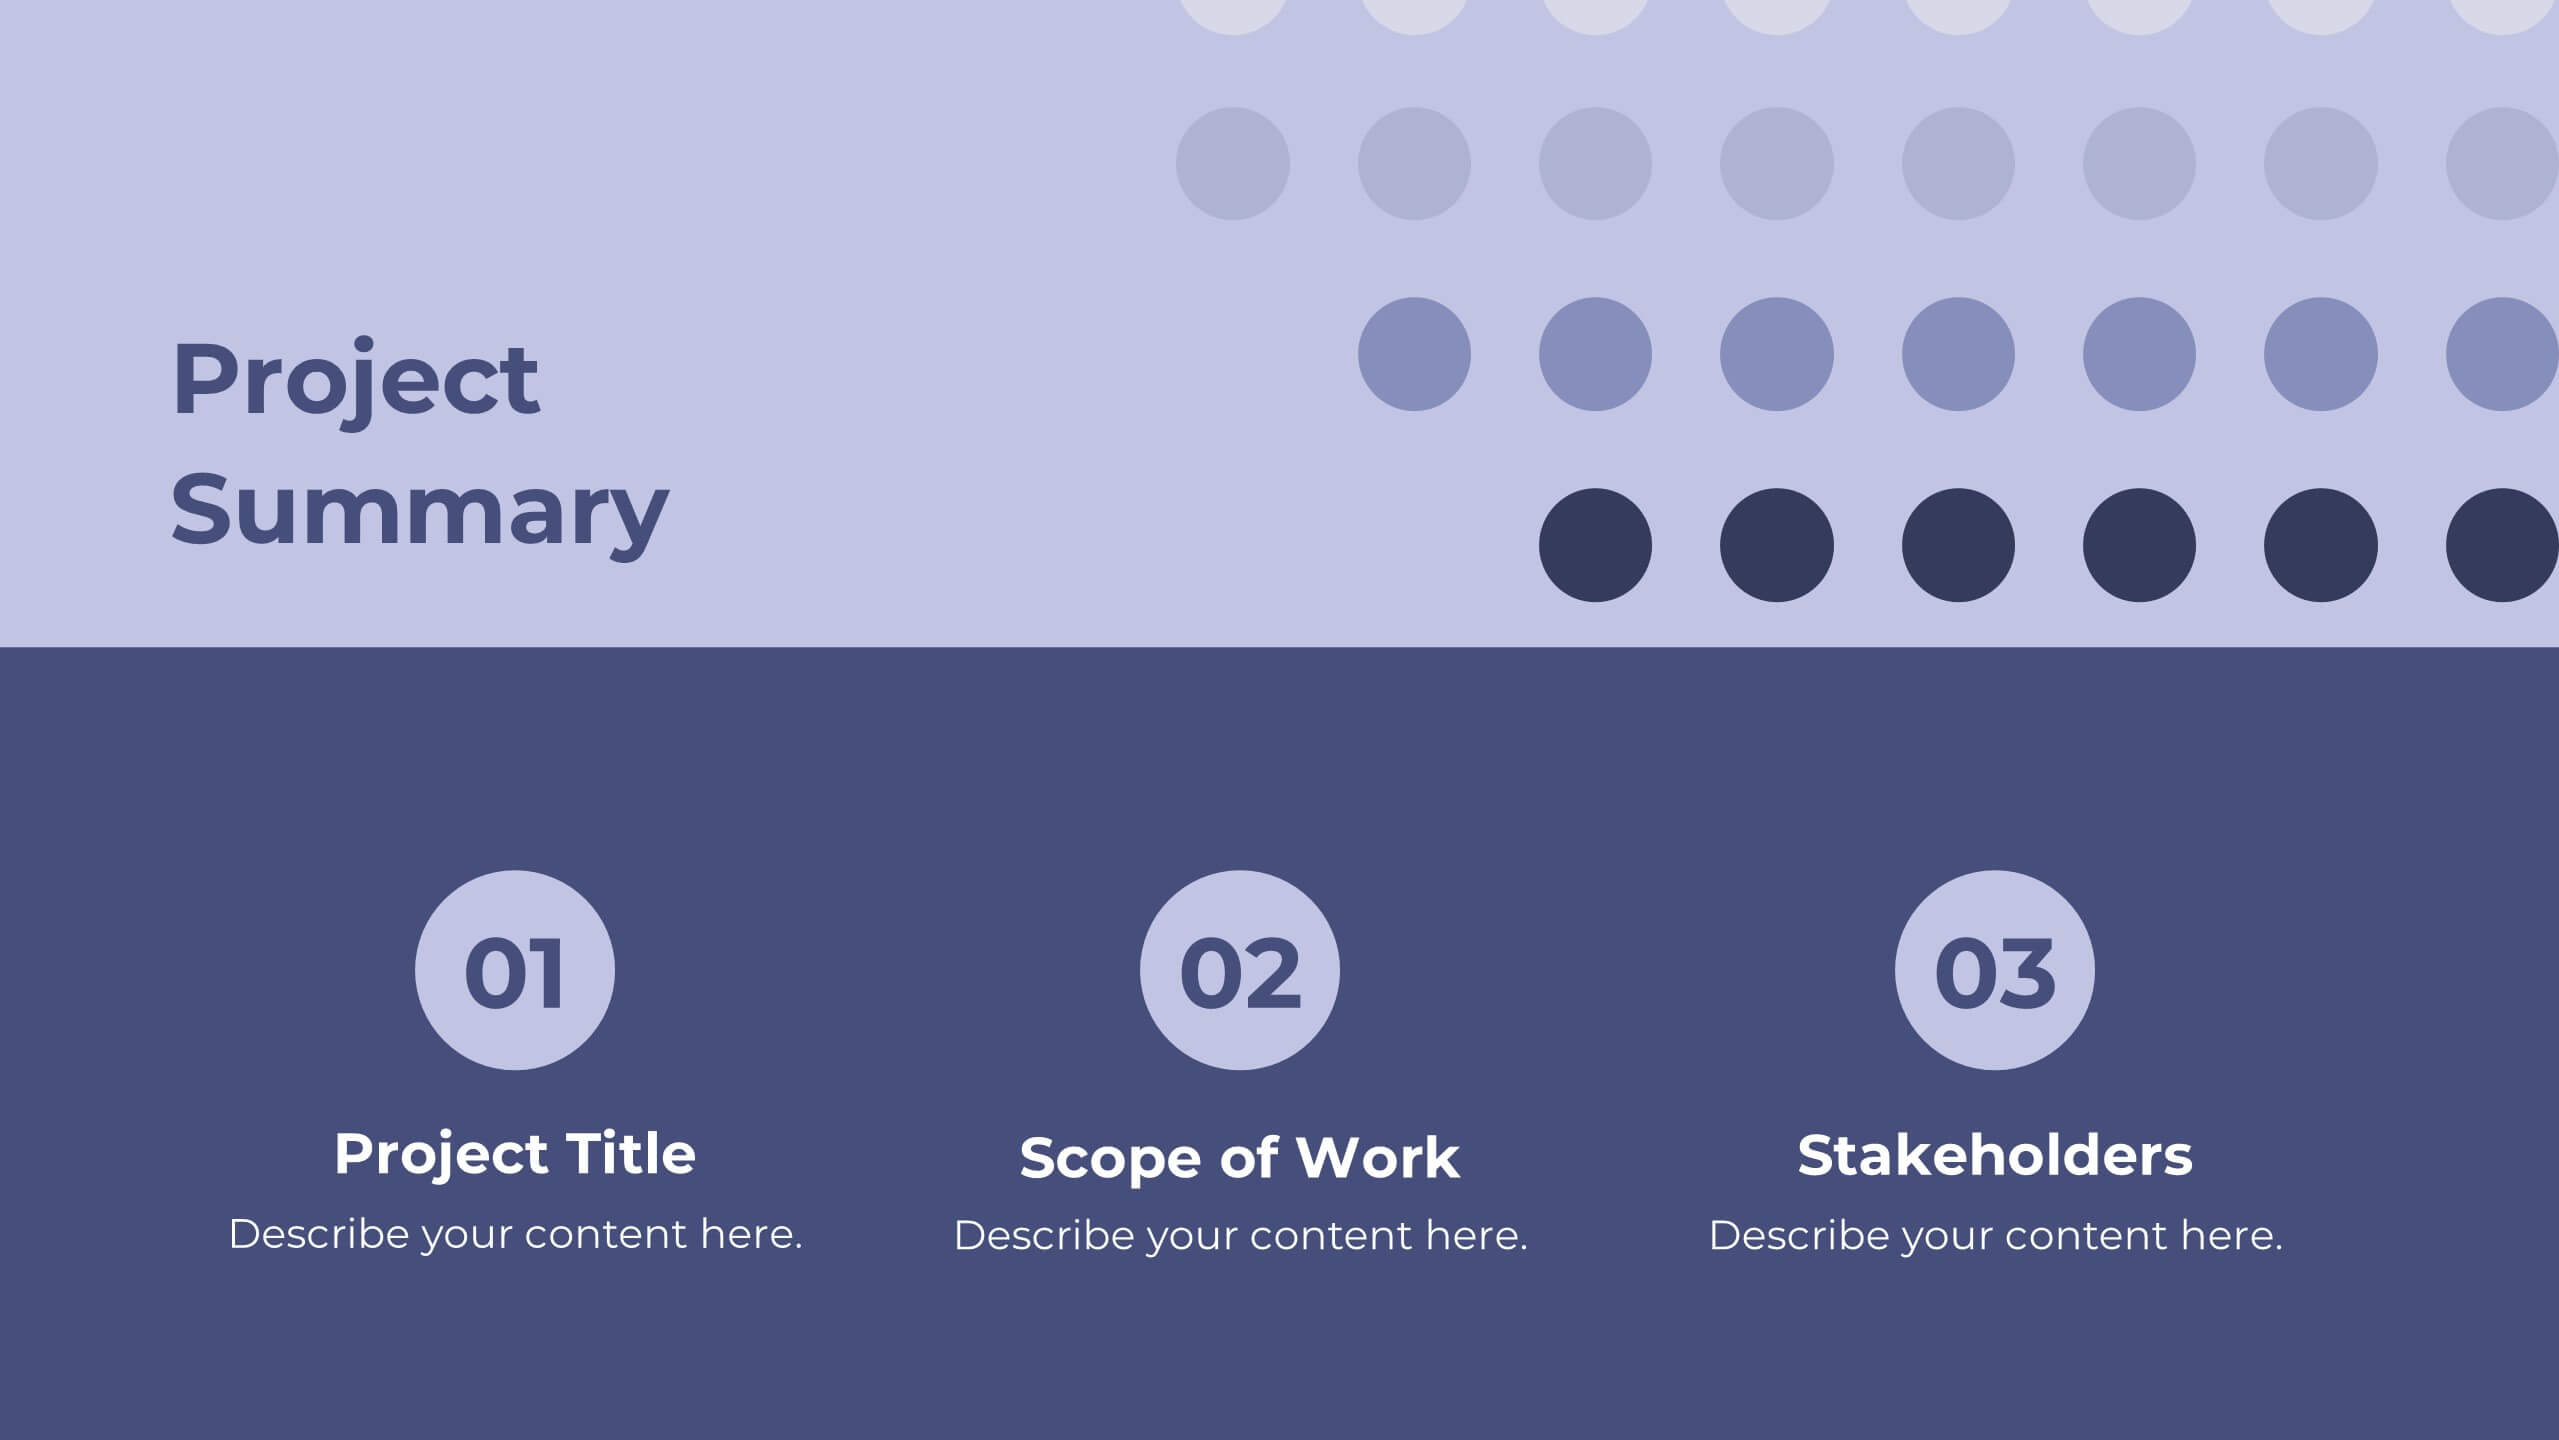
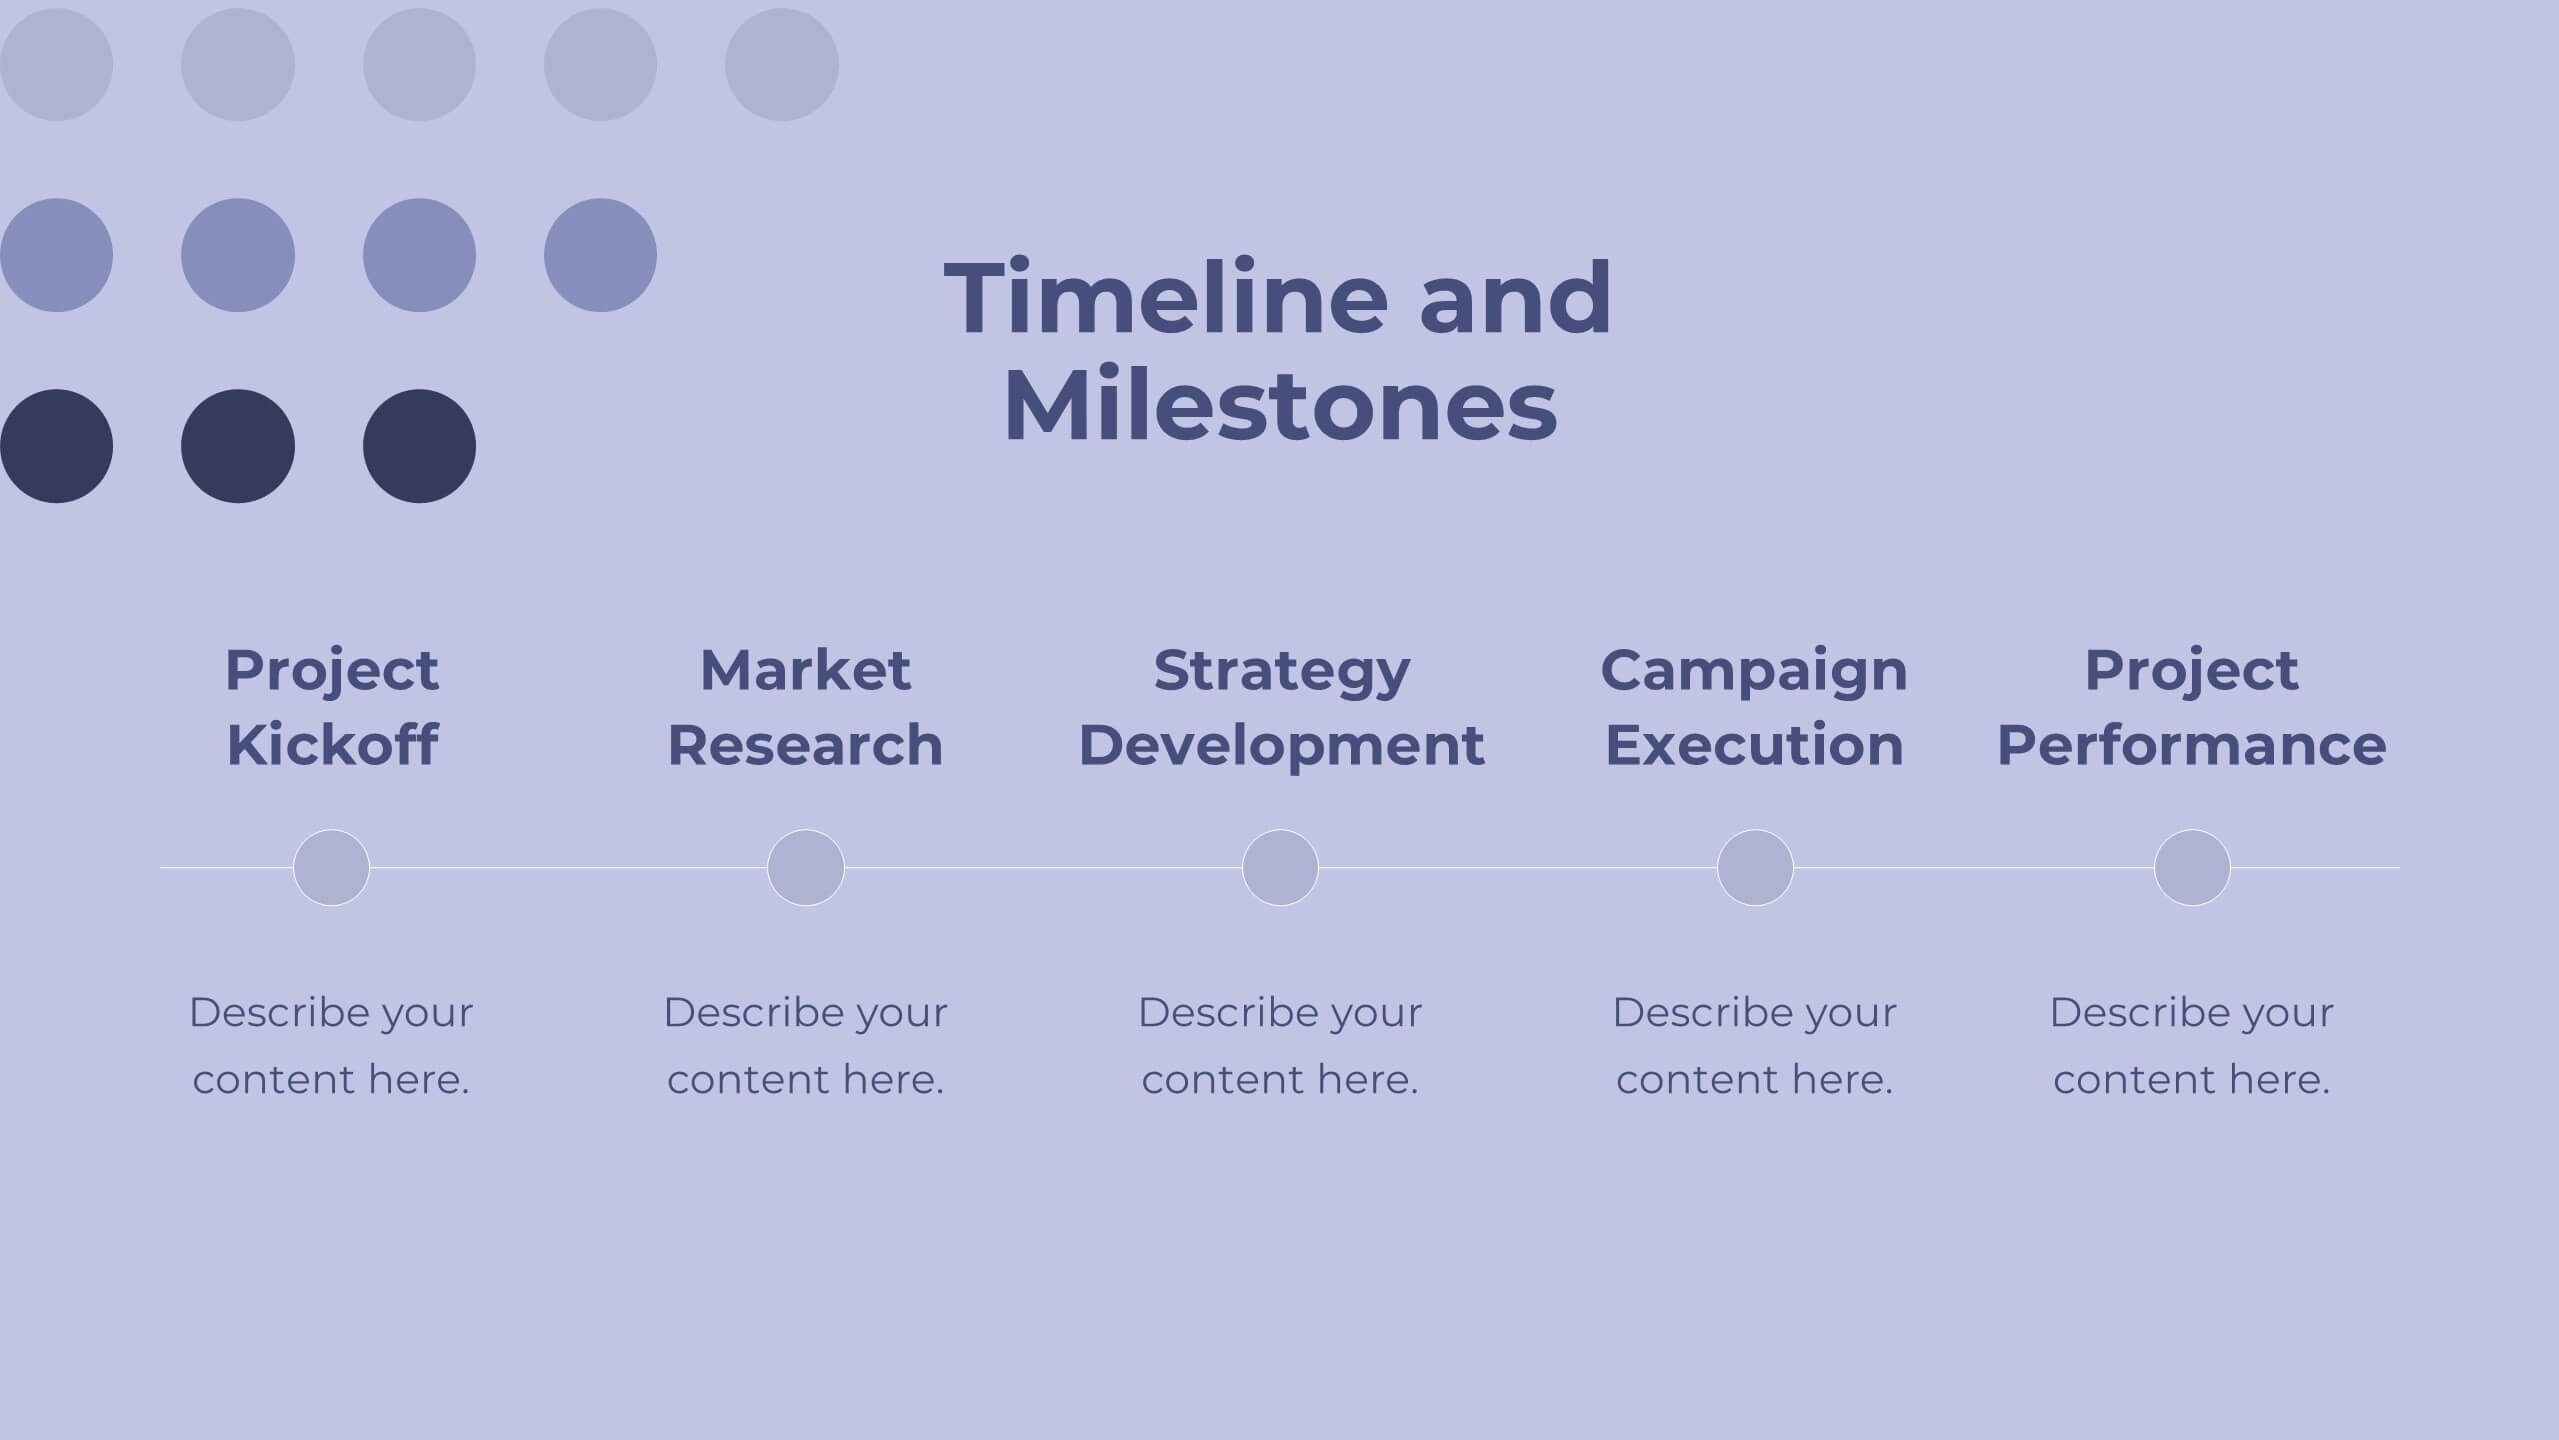
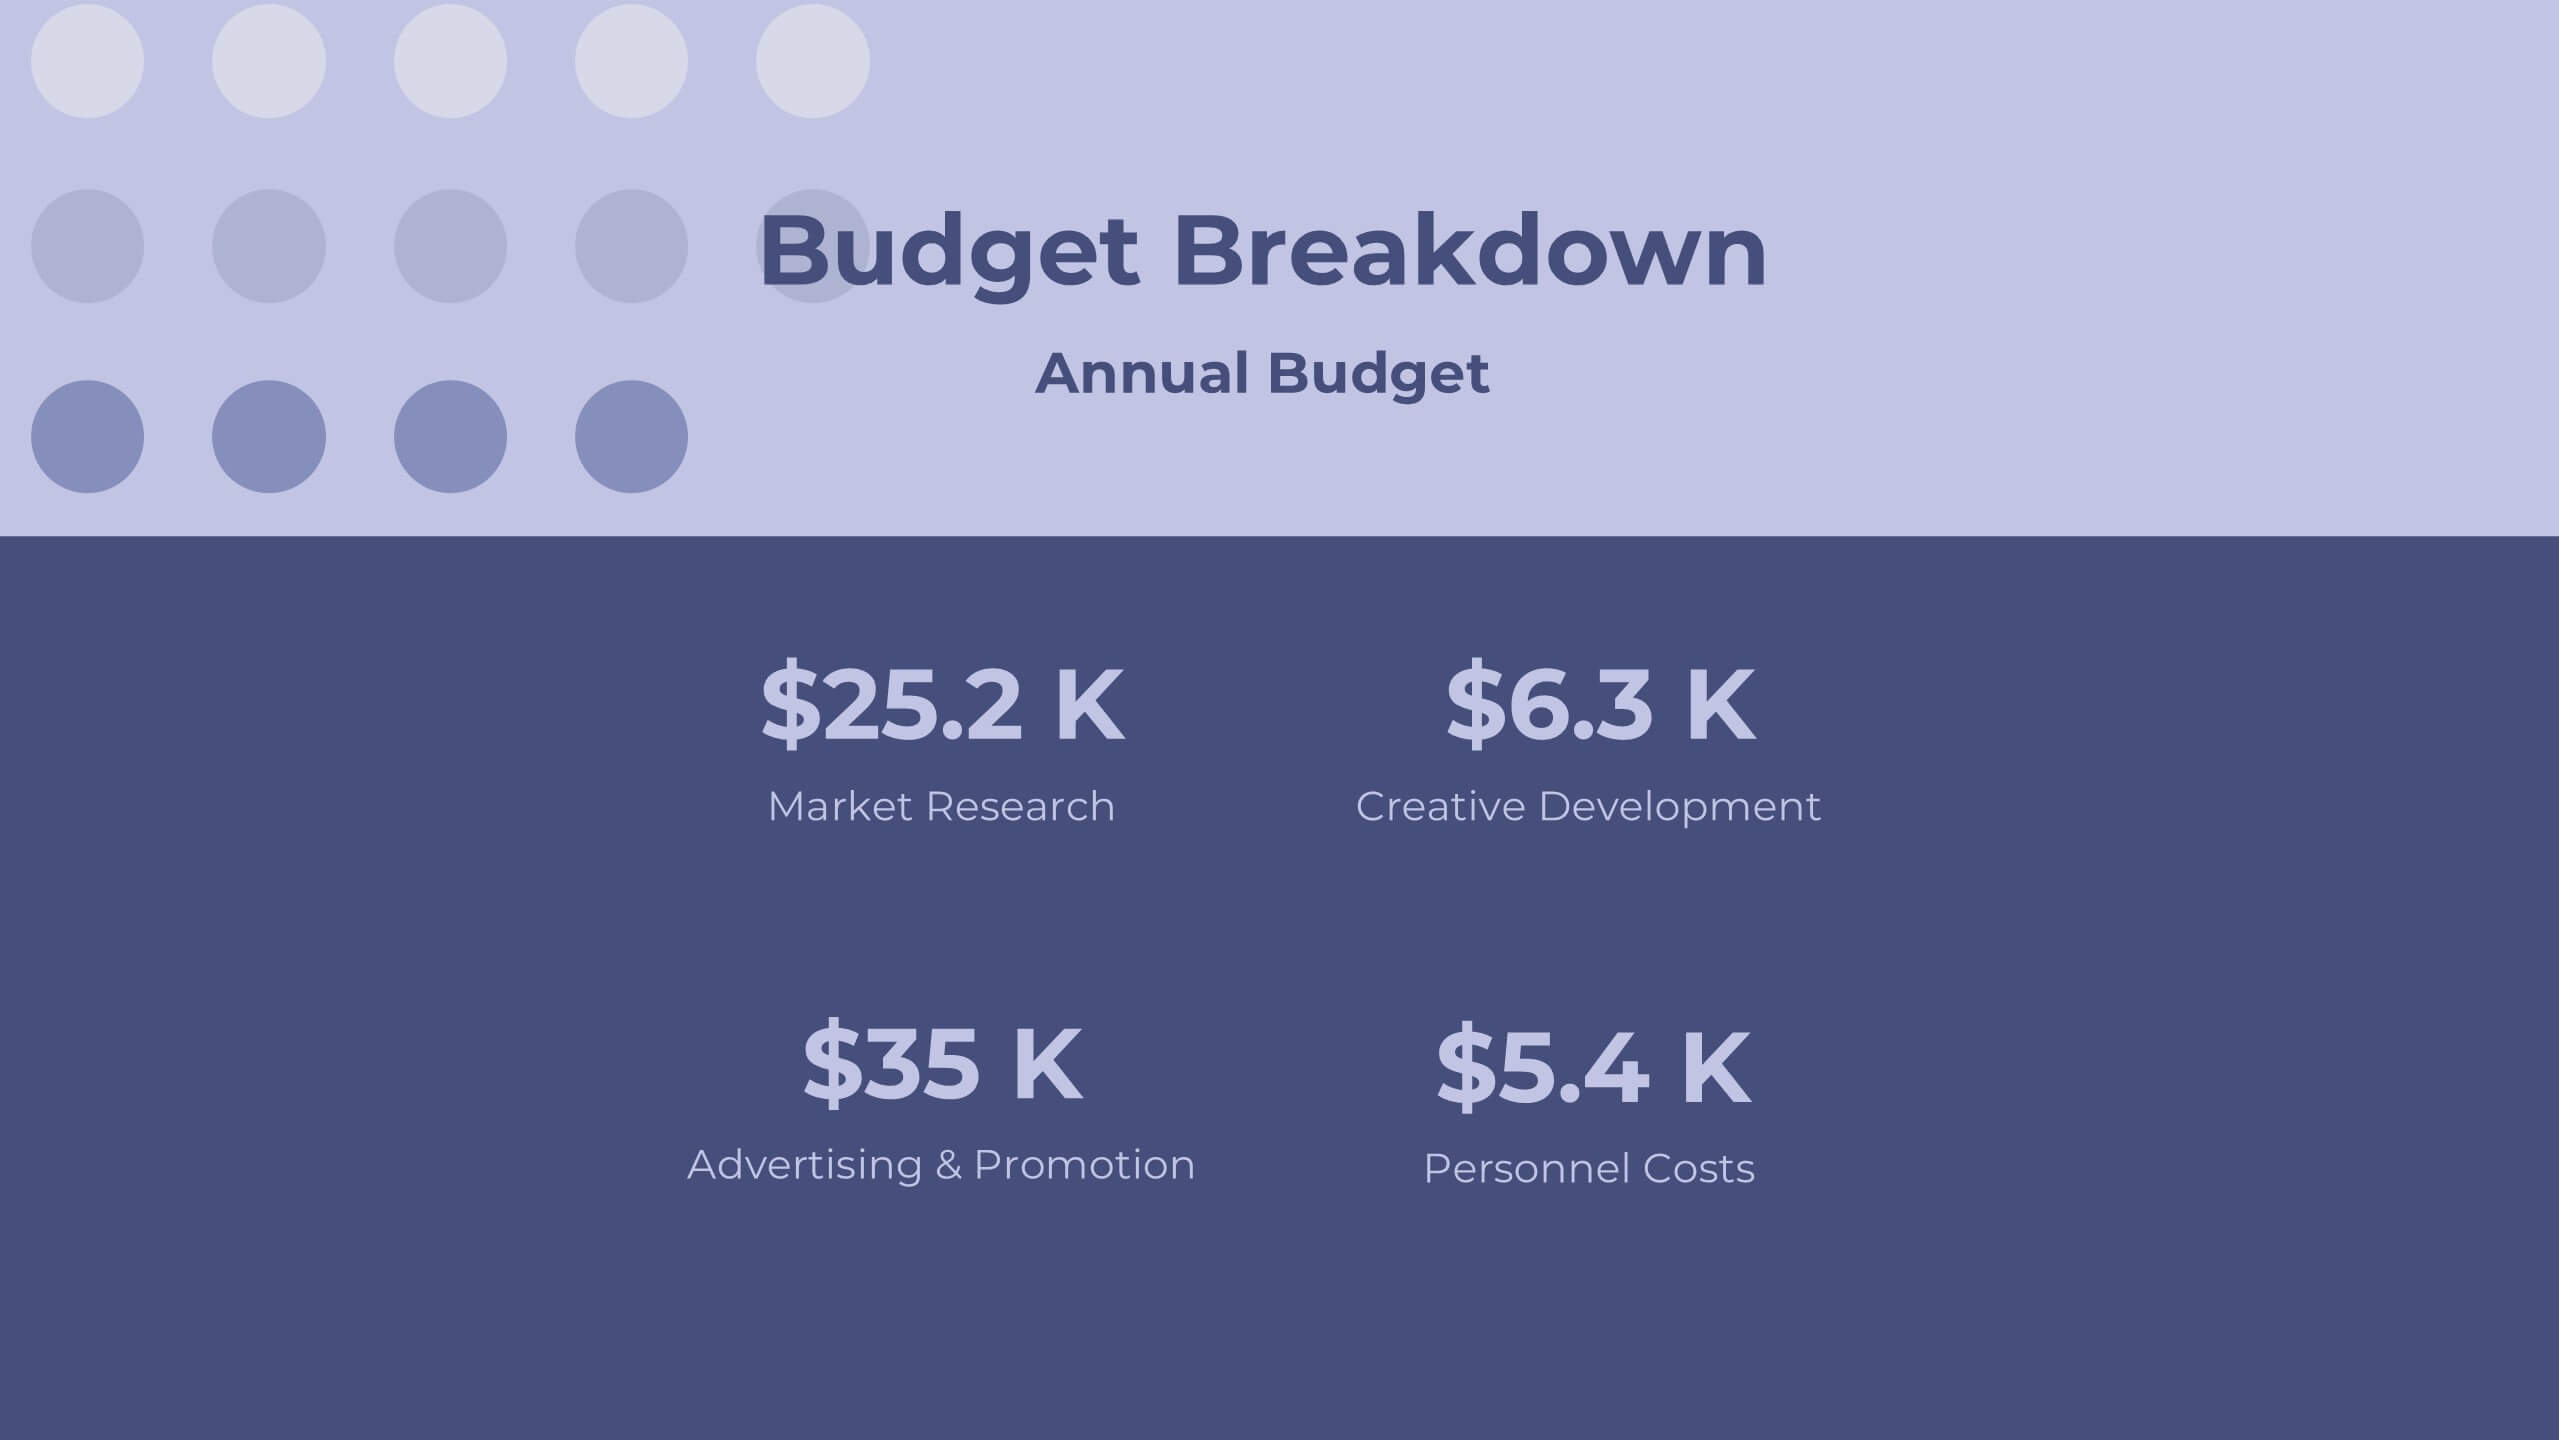
Labyrinth Project Proposal Presentation
Present your project proposal with this clean and professional template! Covering sections such as objectives, scope of work, timeline, and budget breakdown, it helps you convey your plan clearly and effectively. Fully customizable and compatible with PowerPoint, Keynote, and Google Slides, it’s perfect for delivering impactful proposals to clients.


4 diapositivas
Corporate Hierarchy Levels Diagram Presentation
Visualize organizational structures clearly with this Corporate Hierarchy Levels Diagram Presentation. Designed for showcasing leadership flow, team divisions, or reporting relationships, each slide features a simple tiered layout with editable icons and placeholders. Great for business planning, team introductions, or org chart overviews. Fully customizable in PowerPoint, Keynote, Canva, and Google Slides.


6 diapositivas
Modern Agriculture Trends Presentation
Bring innovation to the forefront with this visually engaging presentation design. Perfect for highlighting sustainability practices, agri-tech developments, and market evolution, it helps communicate key insights with clarity and style. Fully customizable and compatible with PowerPoint, Keynote, and Google Slides for a polished, professional presentation experience.


5 diapositivas
Performance Metrics and KPI Review Presentation
Visualize performance at a glance with the Performance Metrics and KPI Review presentation template. Featuring sleek gauge charts in various color schemes, this layout makes it easy to display progress, thresholds, and KPIs across categories. Customize each dial and label to reflect your own business metrics. Compatible with PowerPoint, Keynote, and Google Slides.


4 diapositivas
Strategic Takeaways and Final Points Presentation
Summarize key insights and final thoughts with this clean, icon-based layout. Ideal for wrapping up business reviews, strategy decks, or executive briefings, each section includes room for concise summaries and visuals. Easily customizable in PowerPoint, Keynote, and Google Slides to match your brand and presentation goals.


20 diapositivas
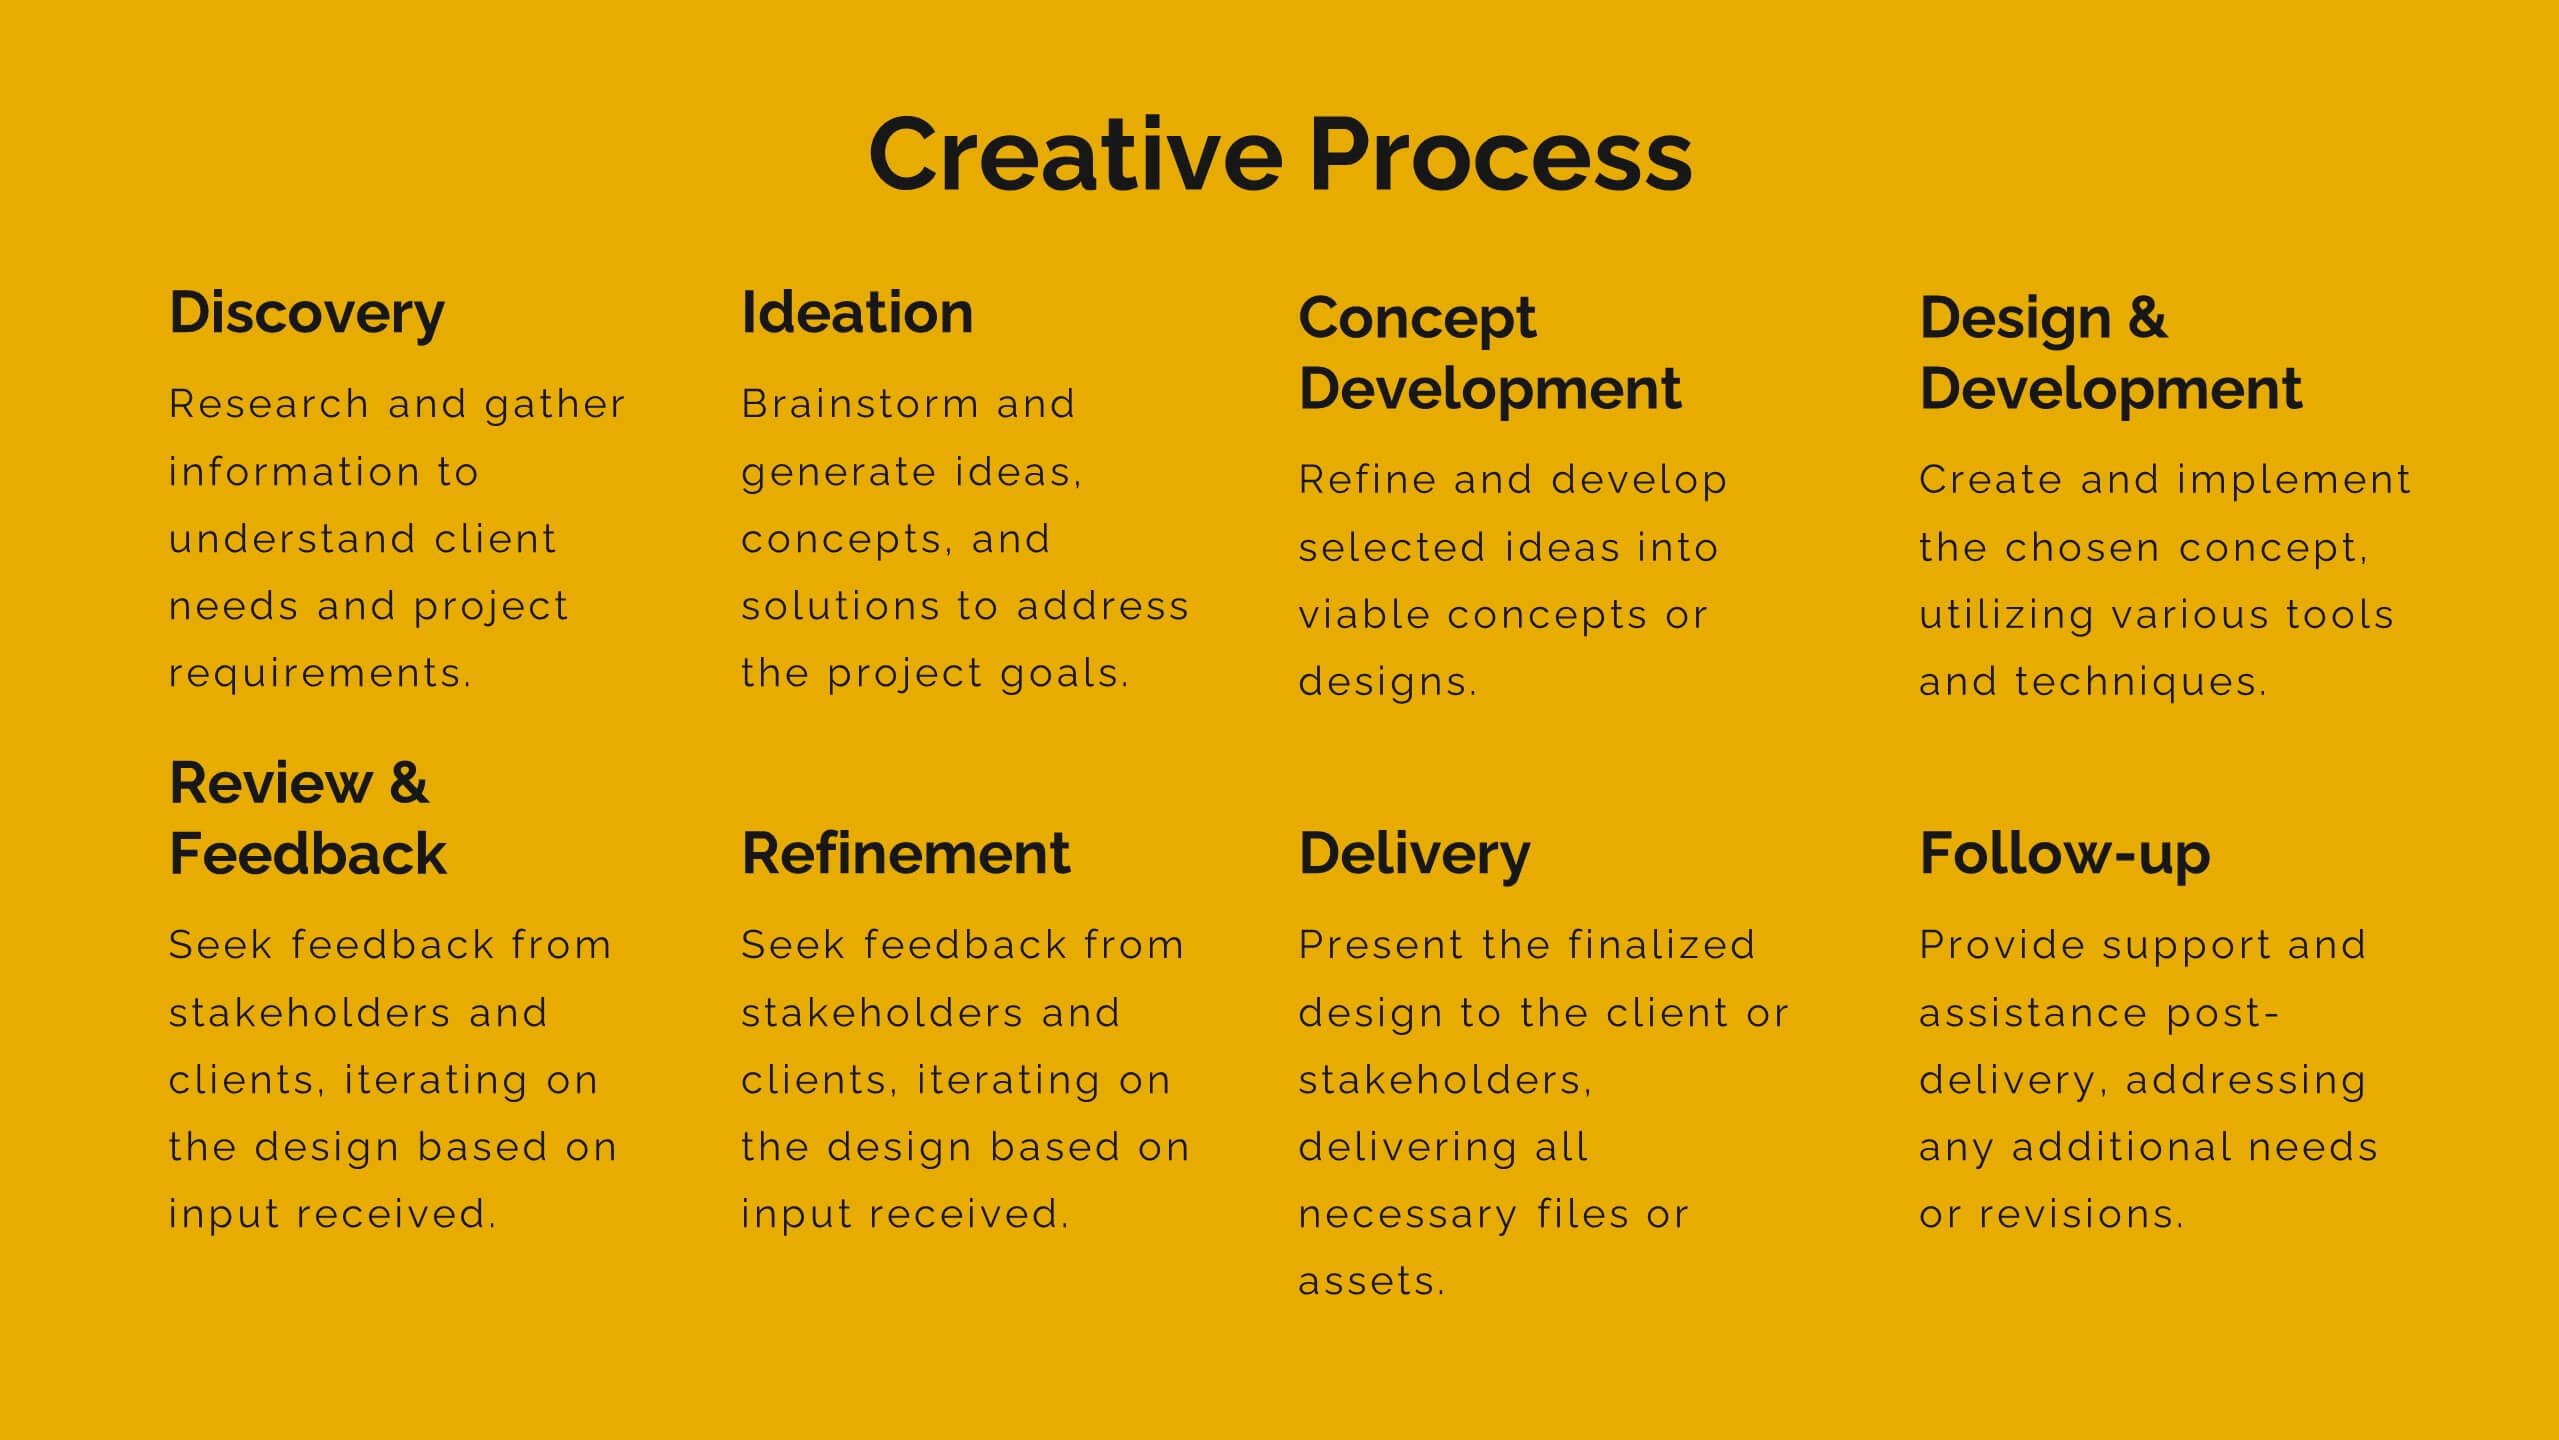
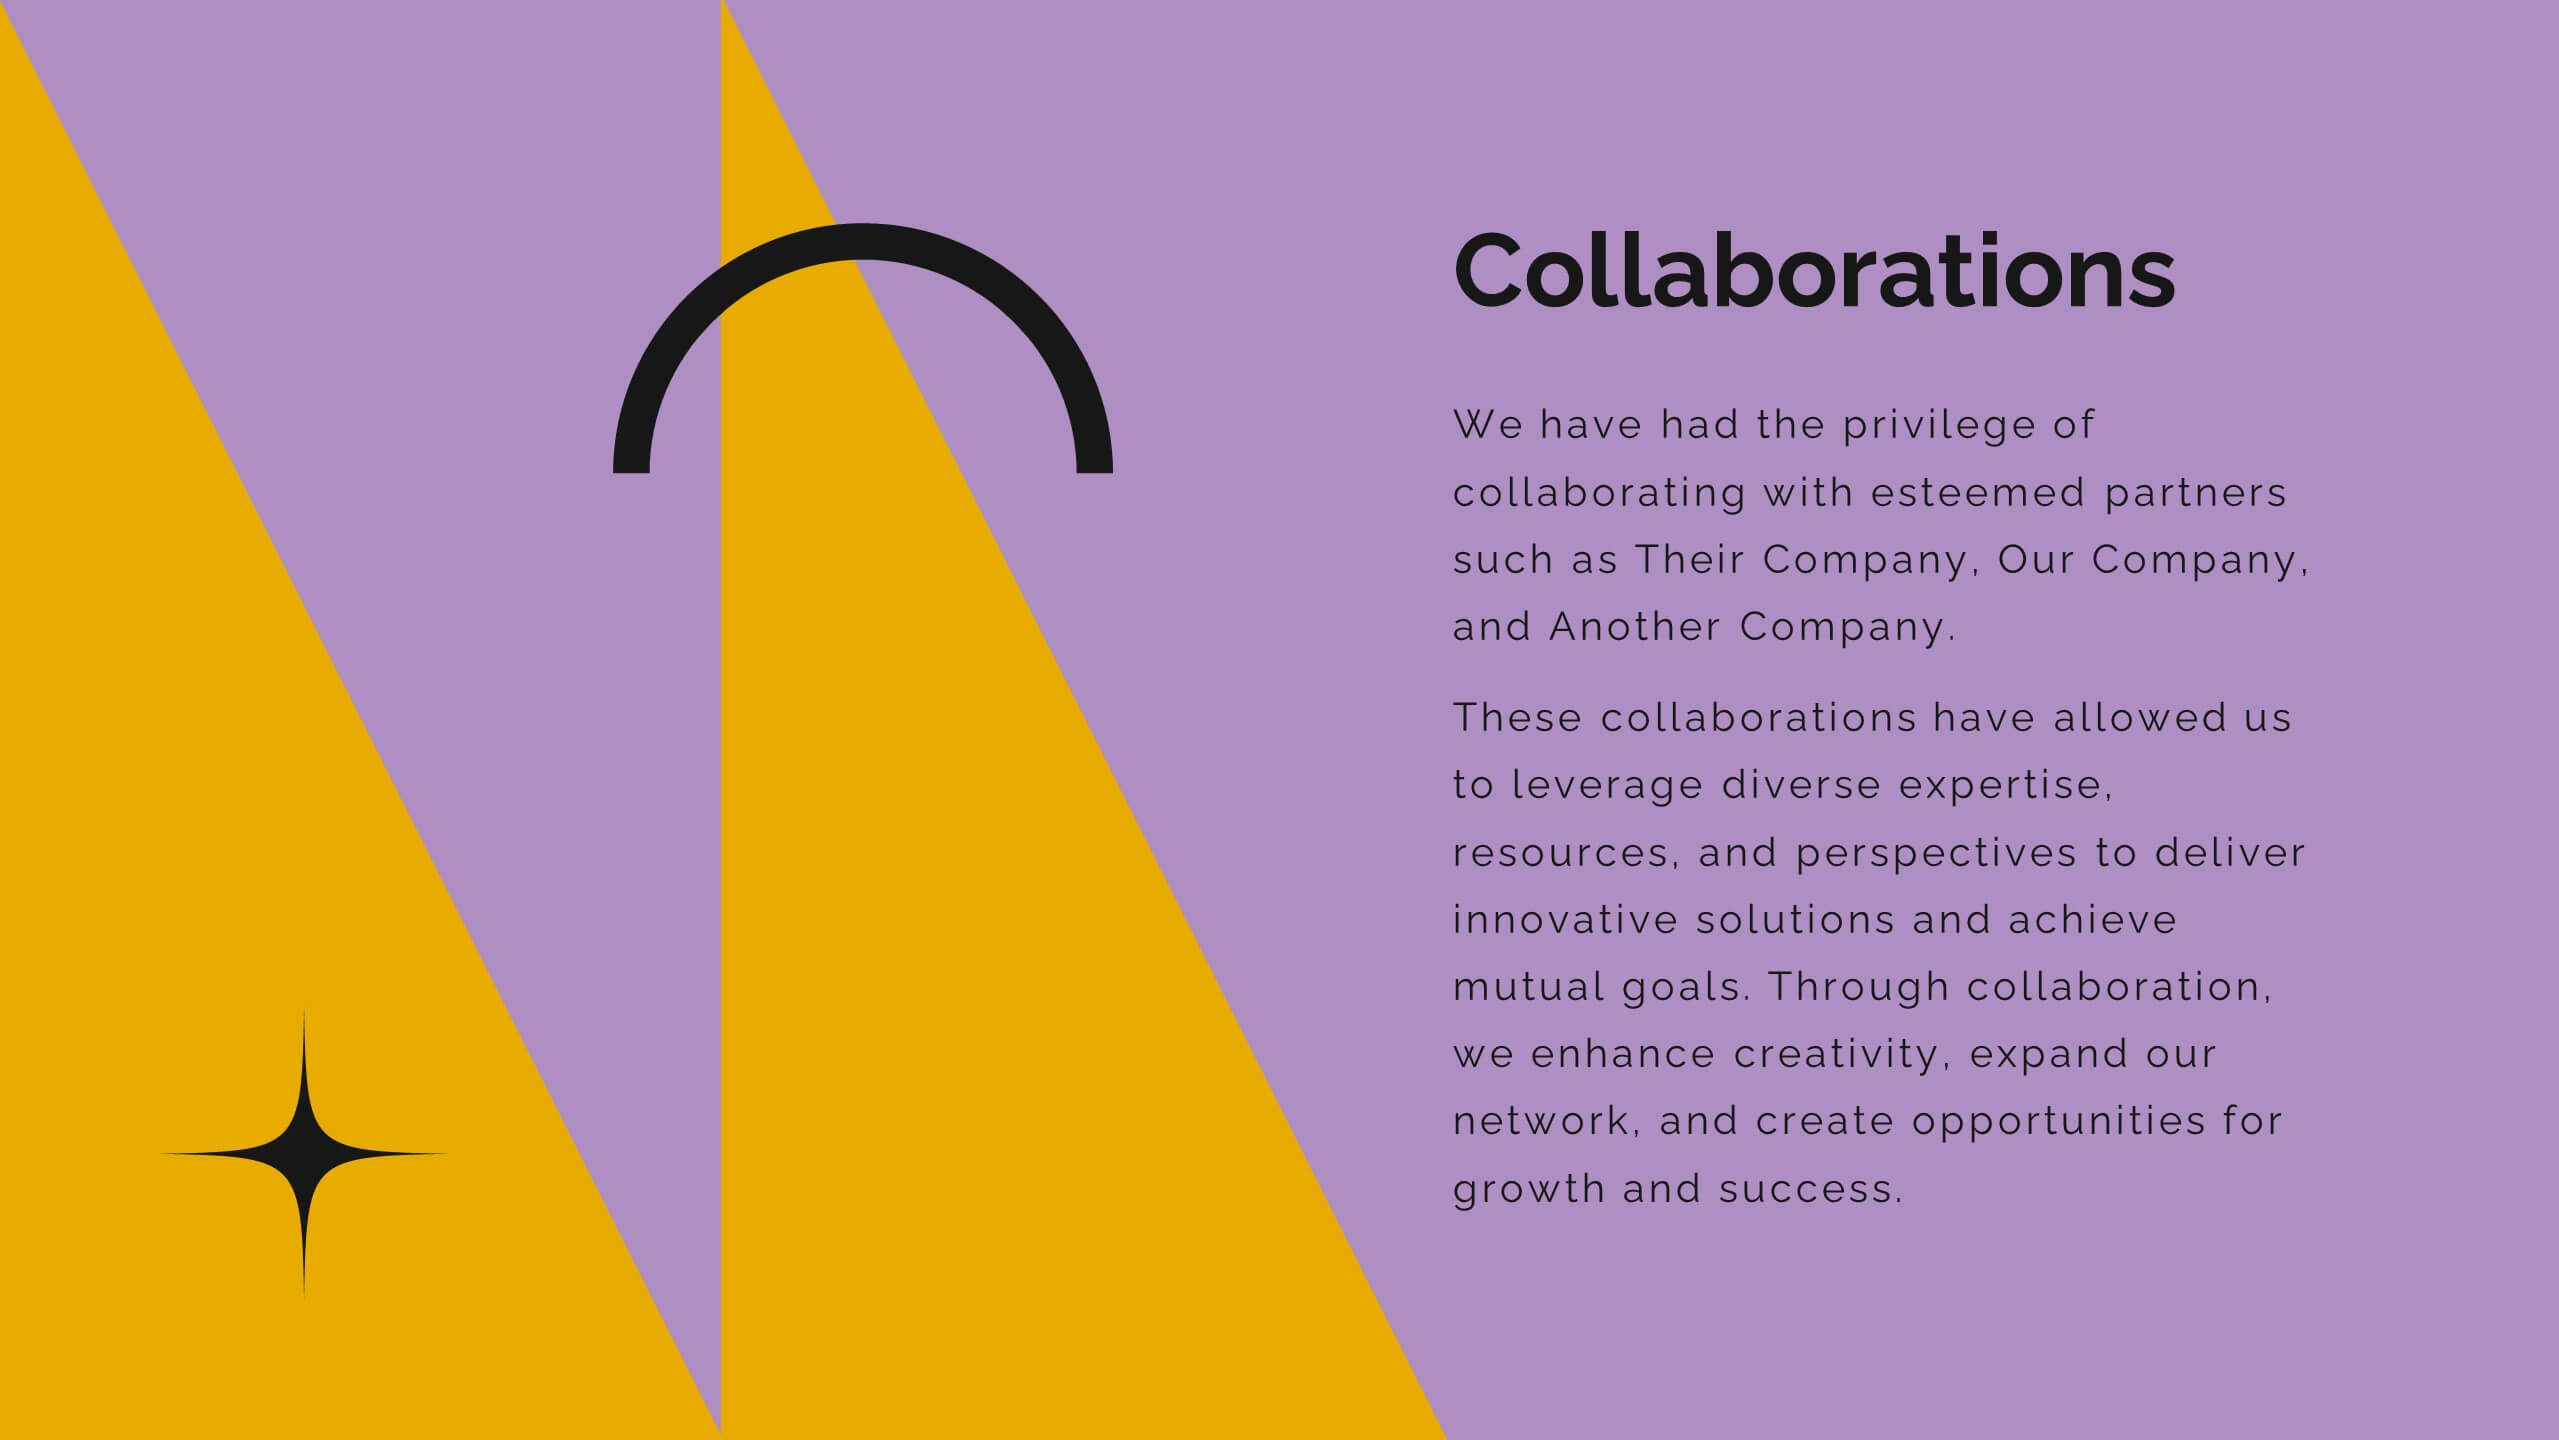
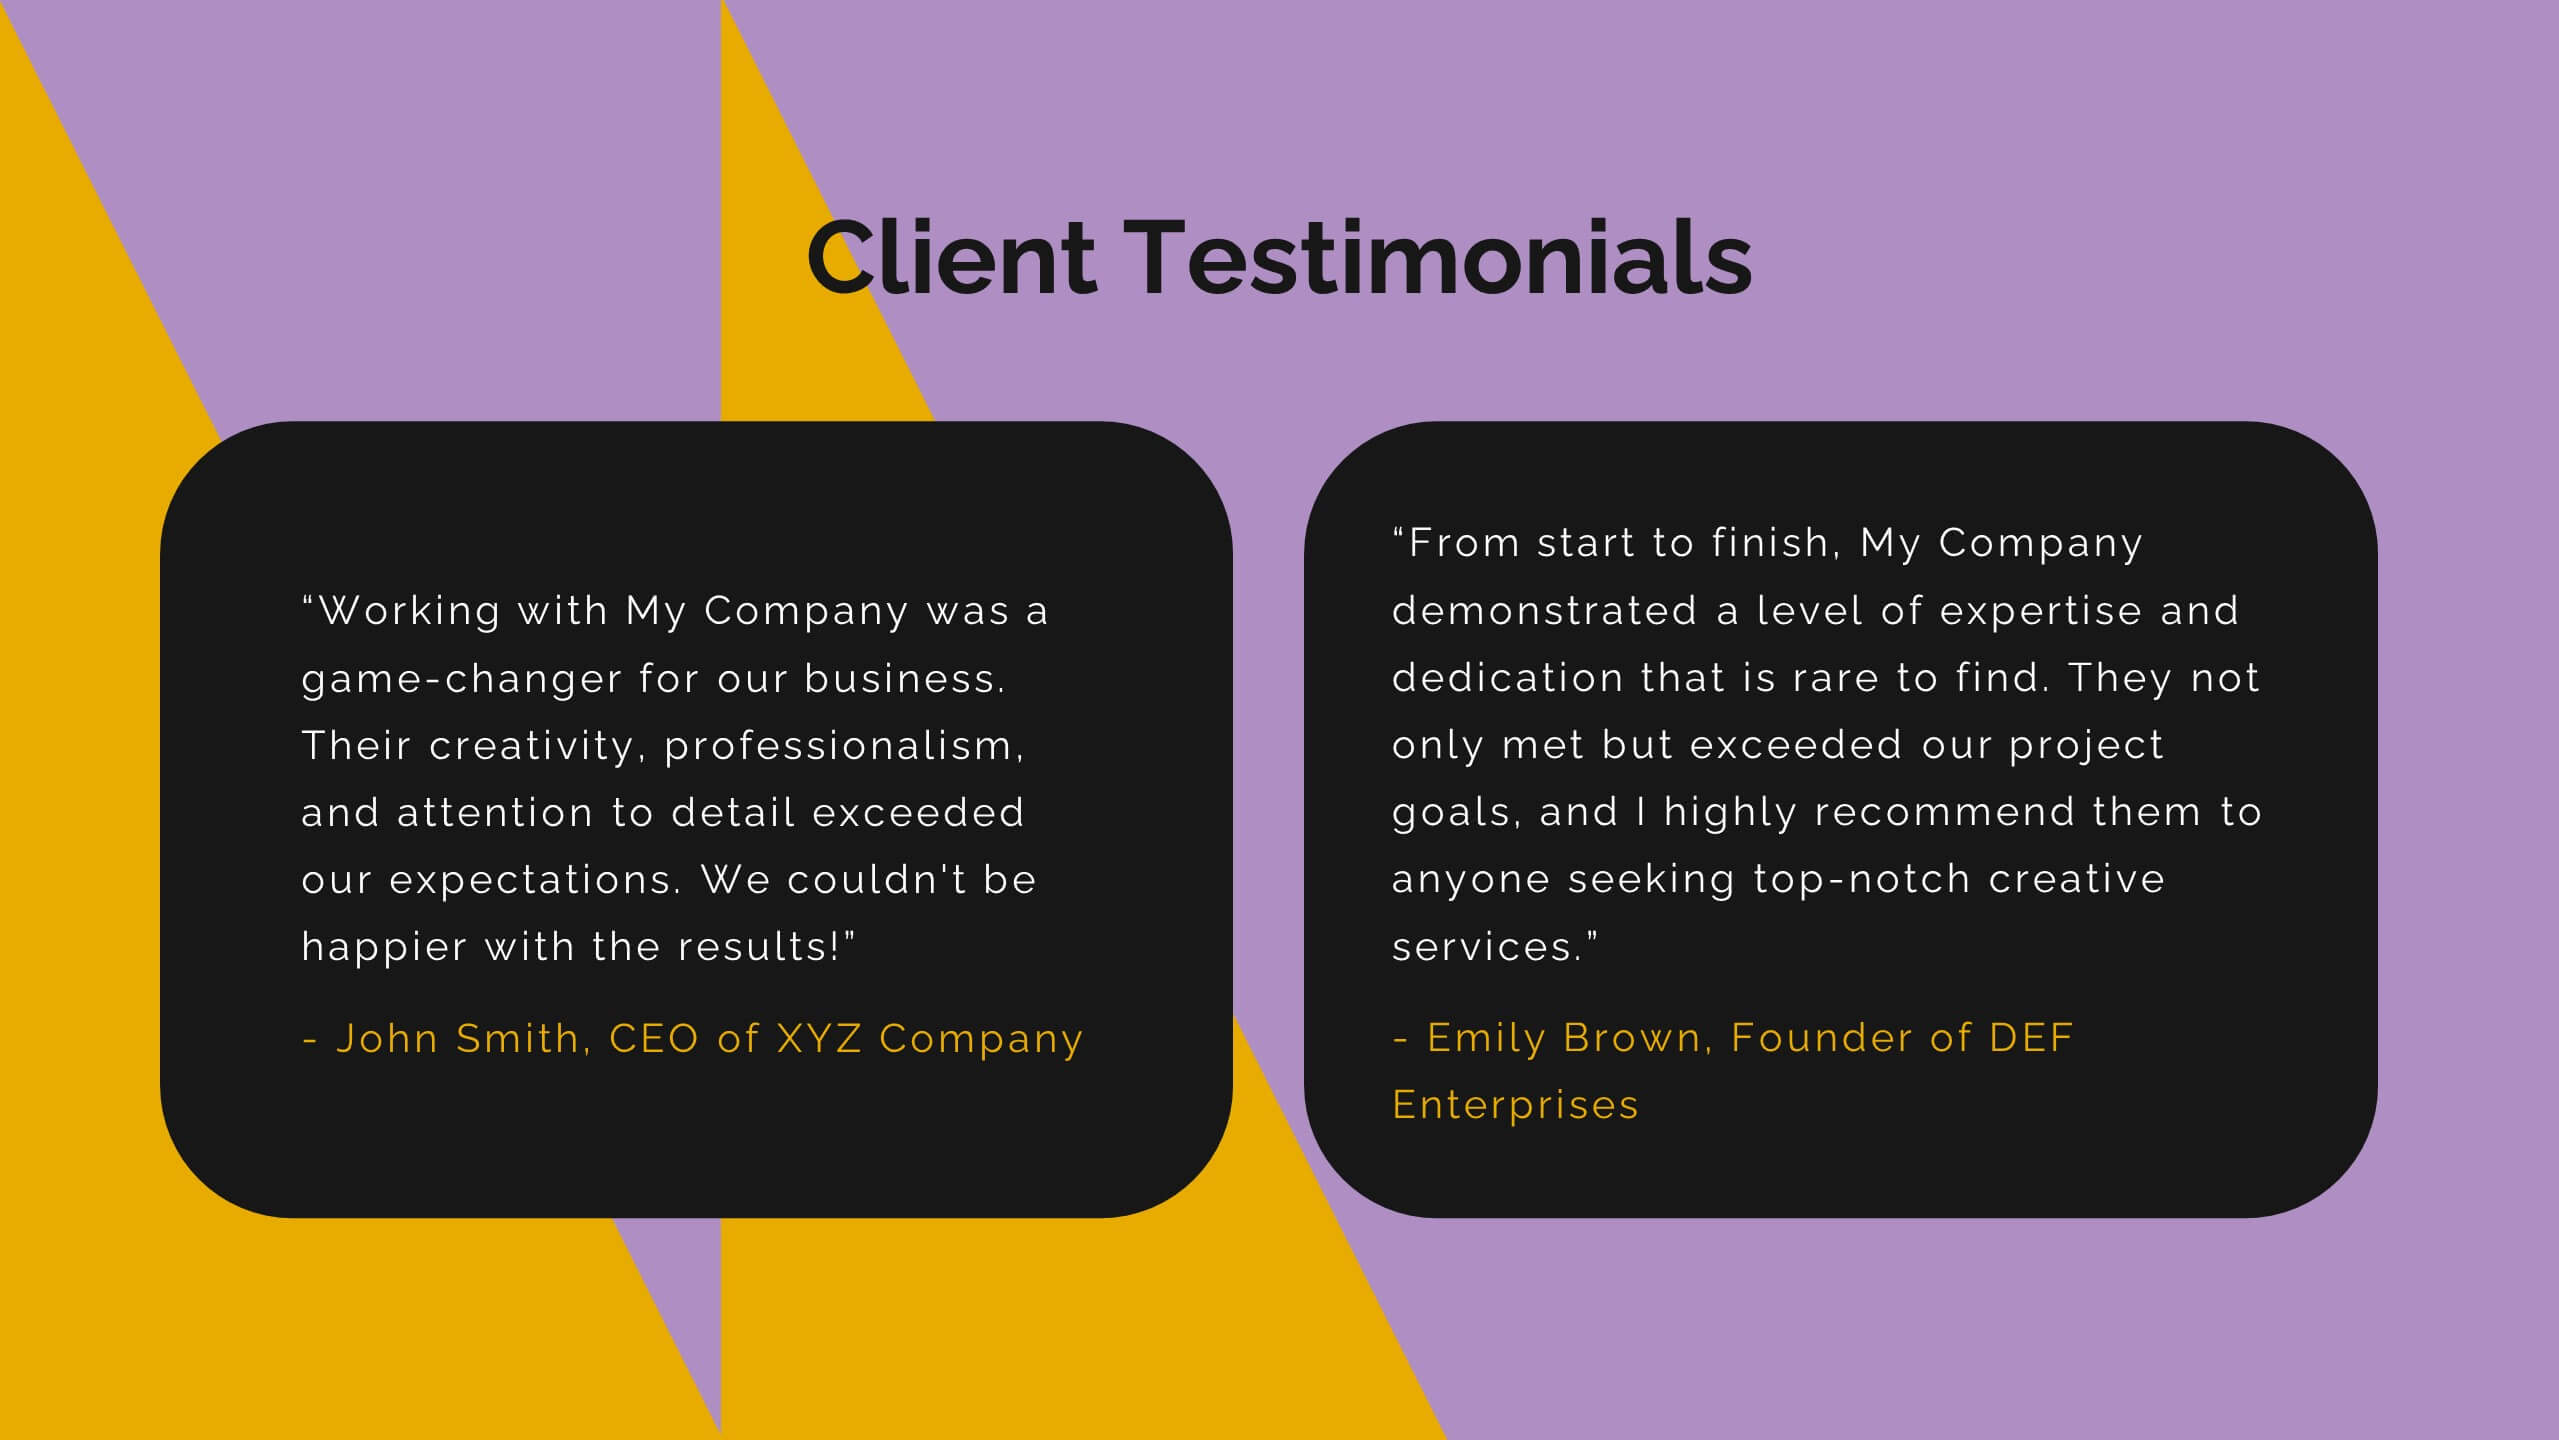
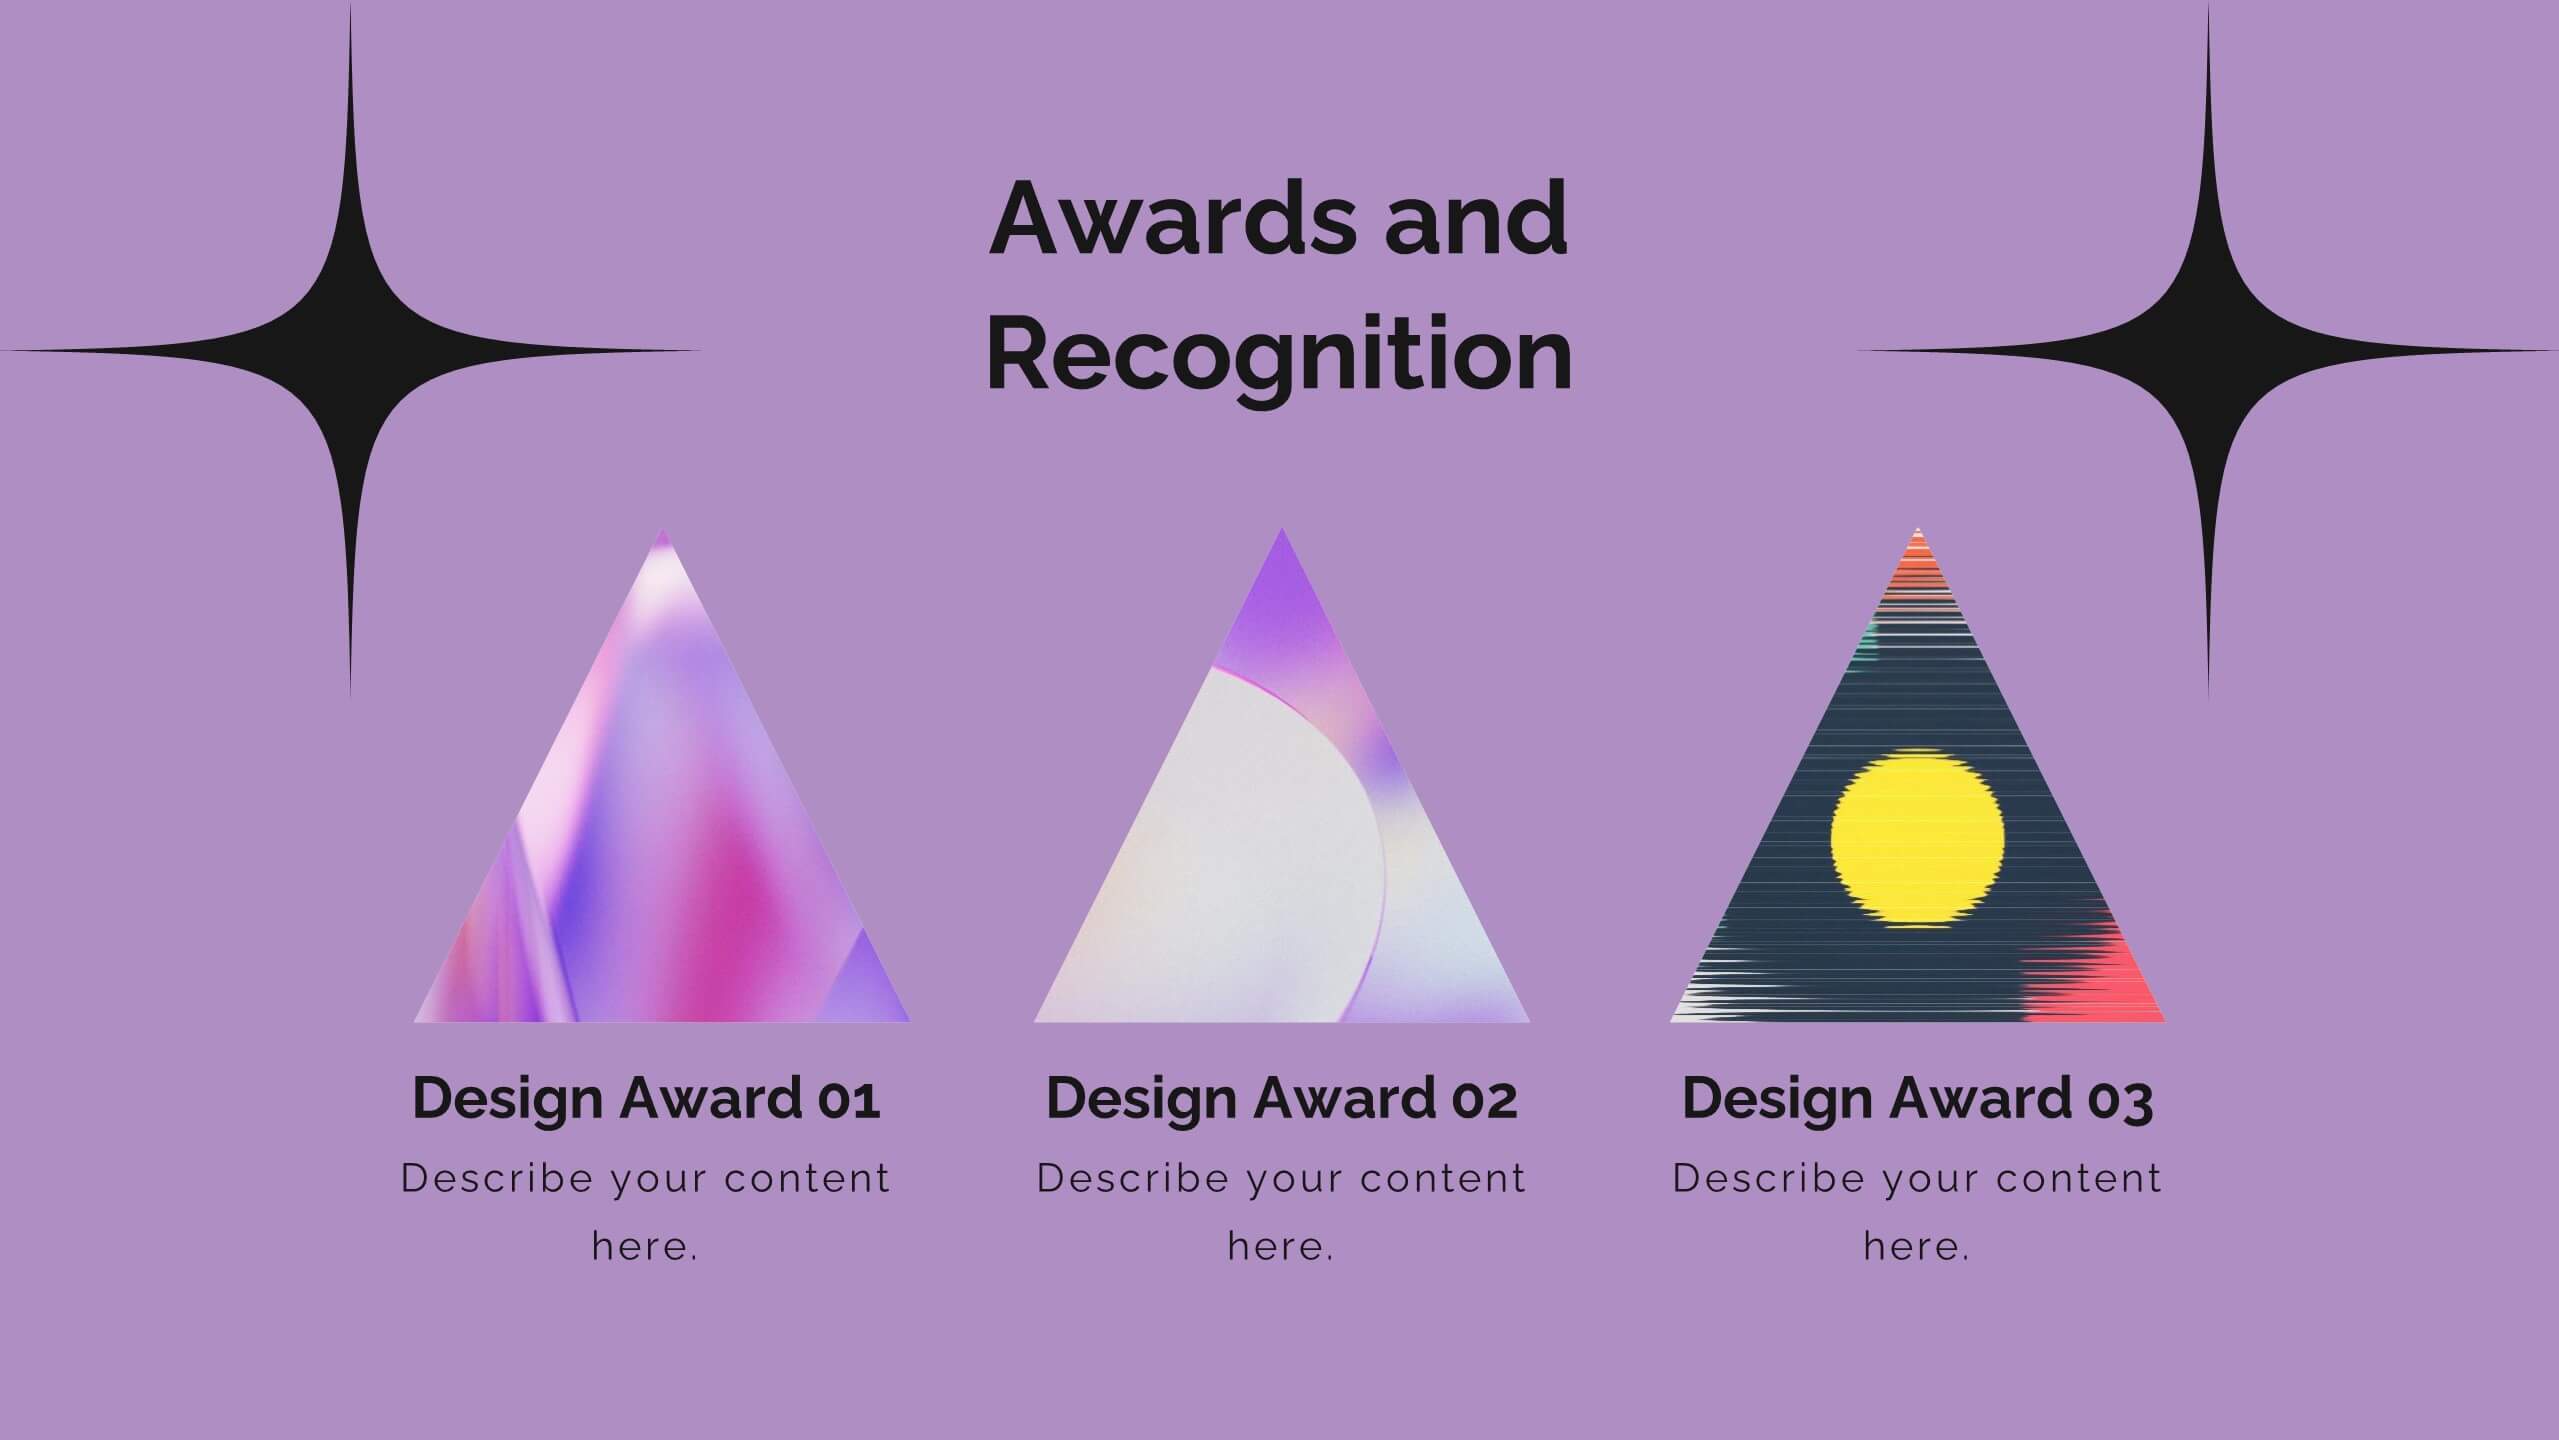
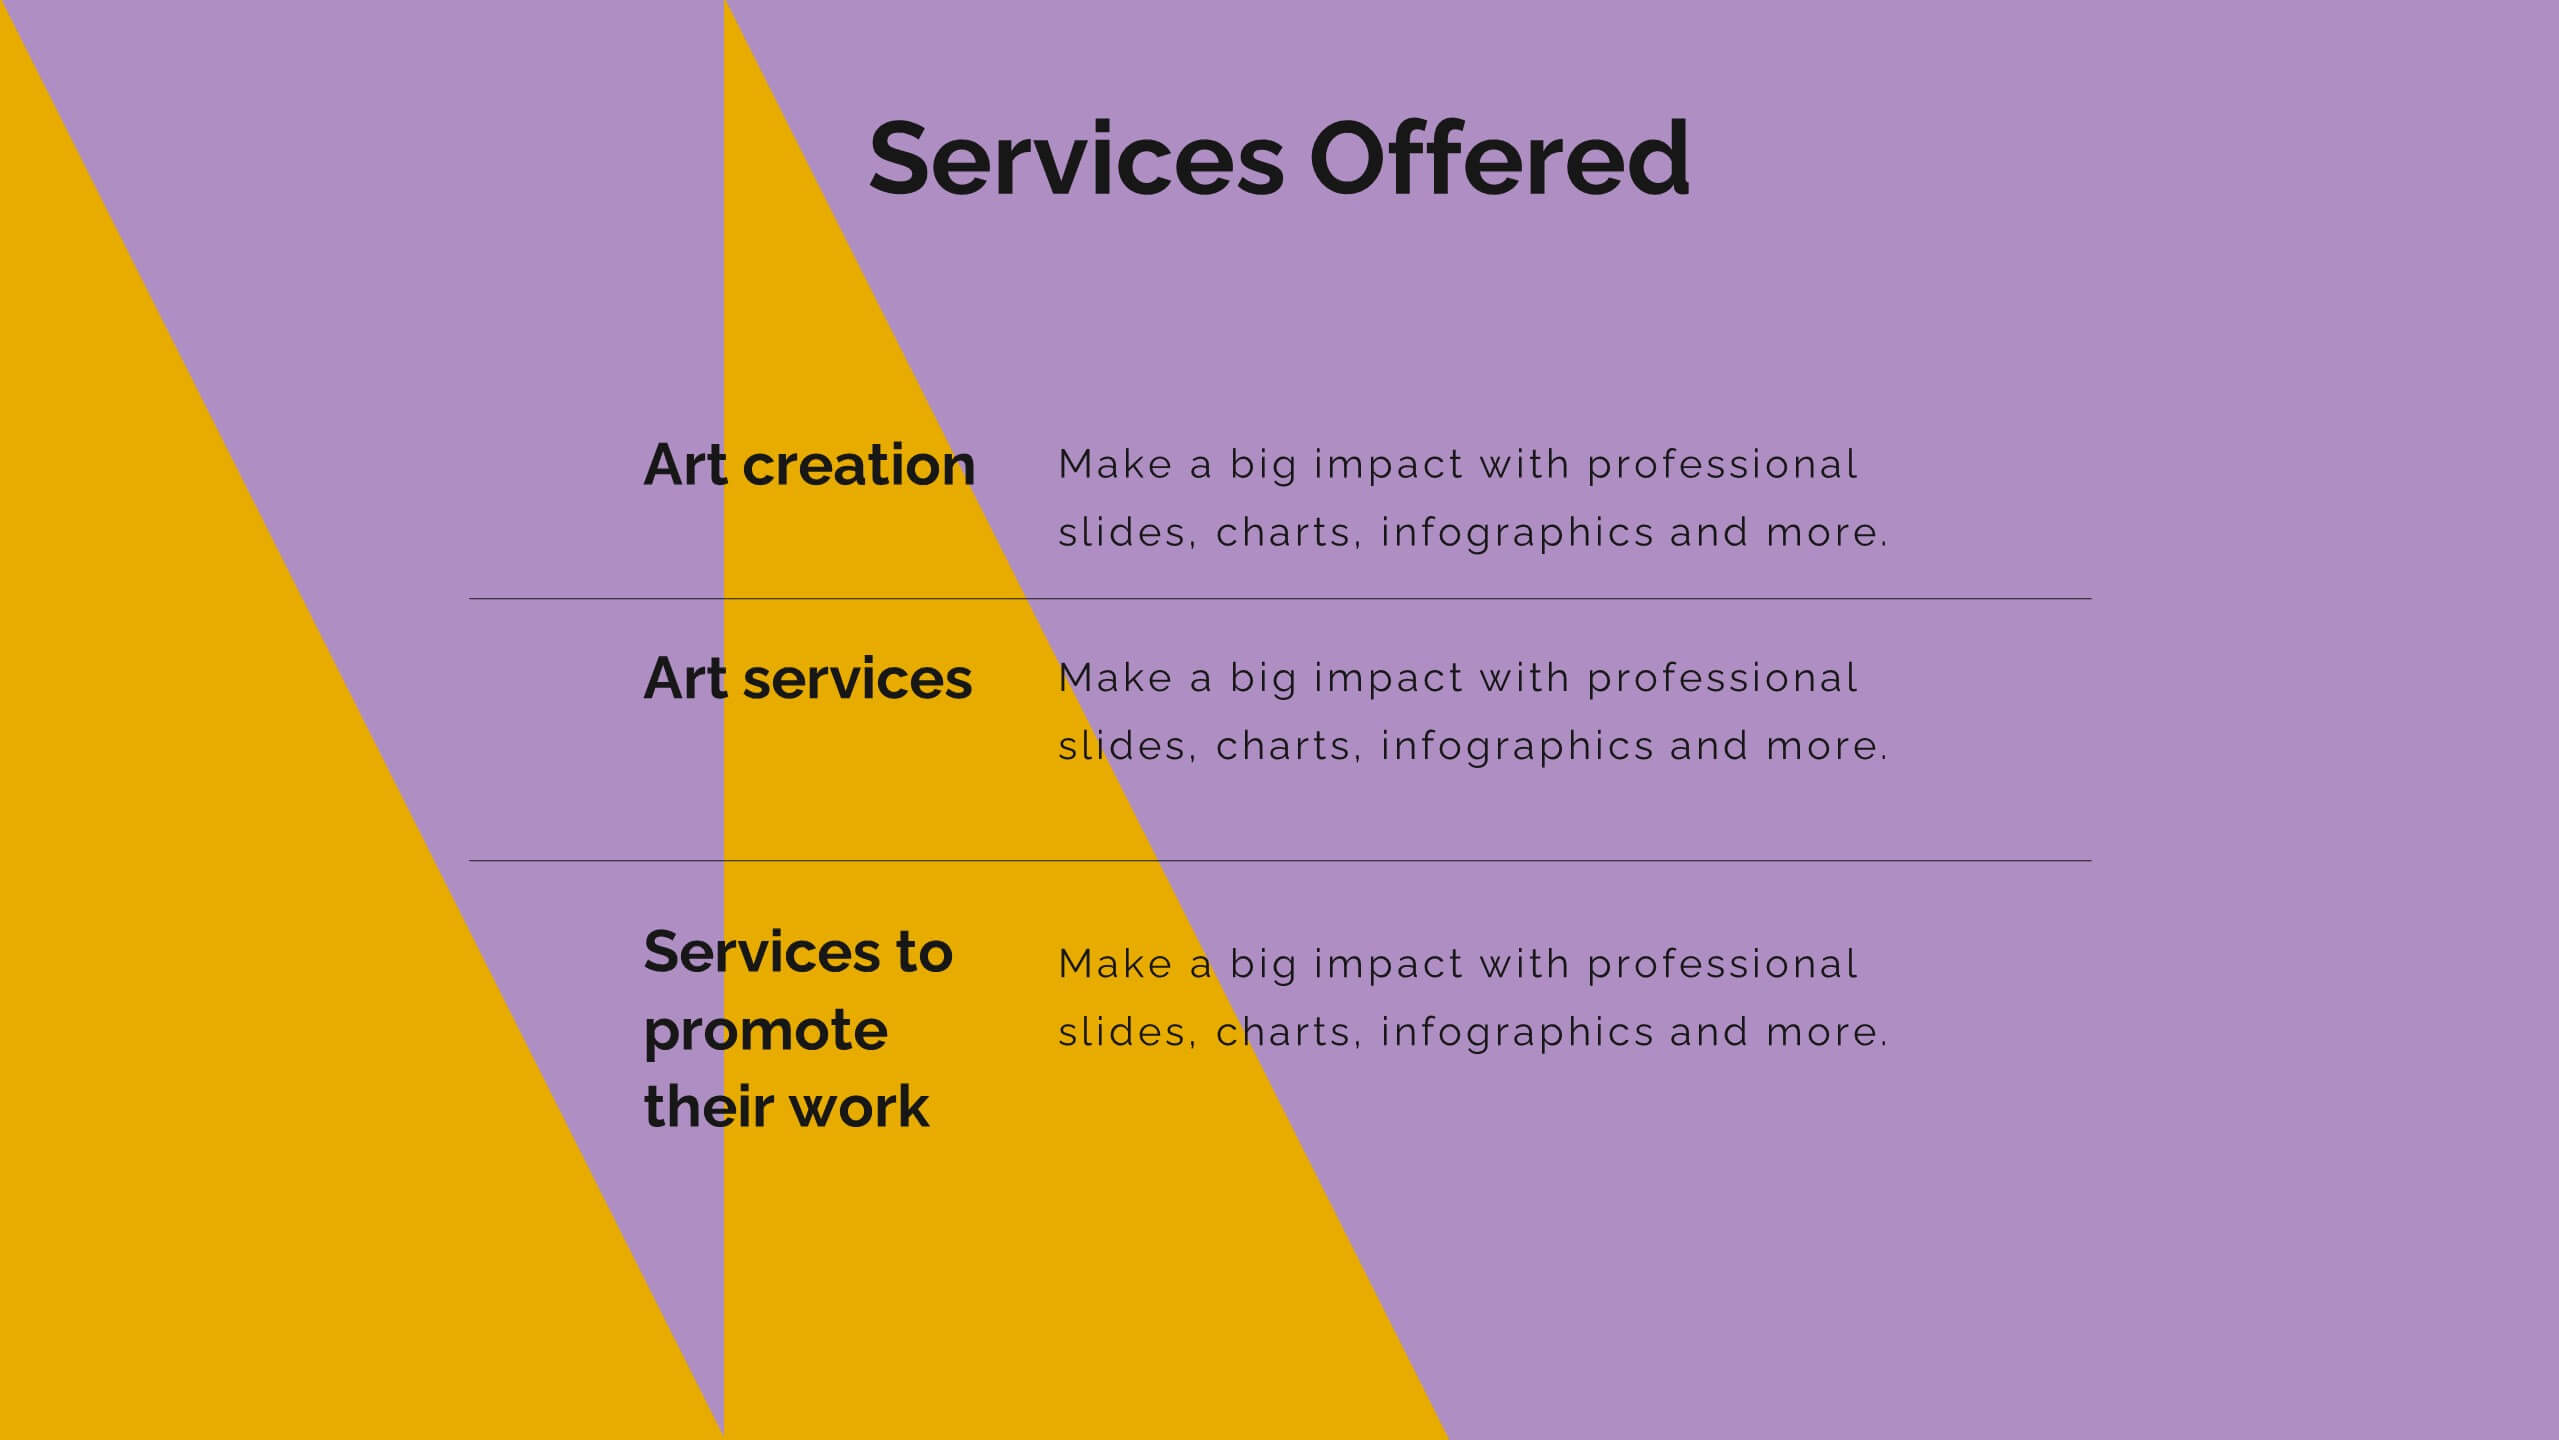
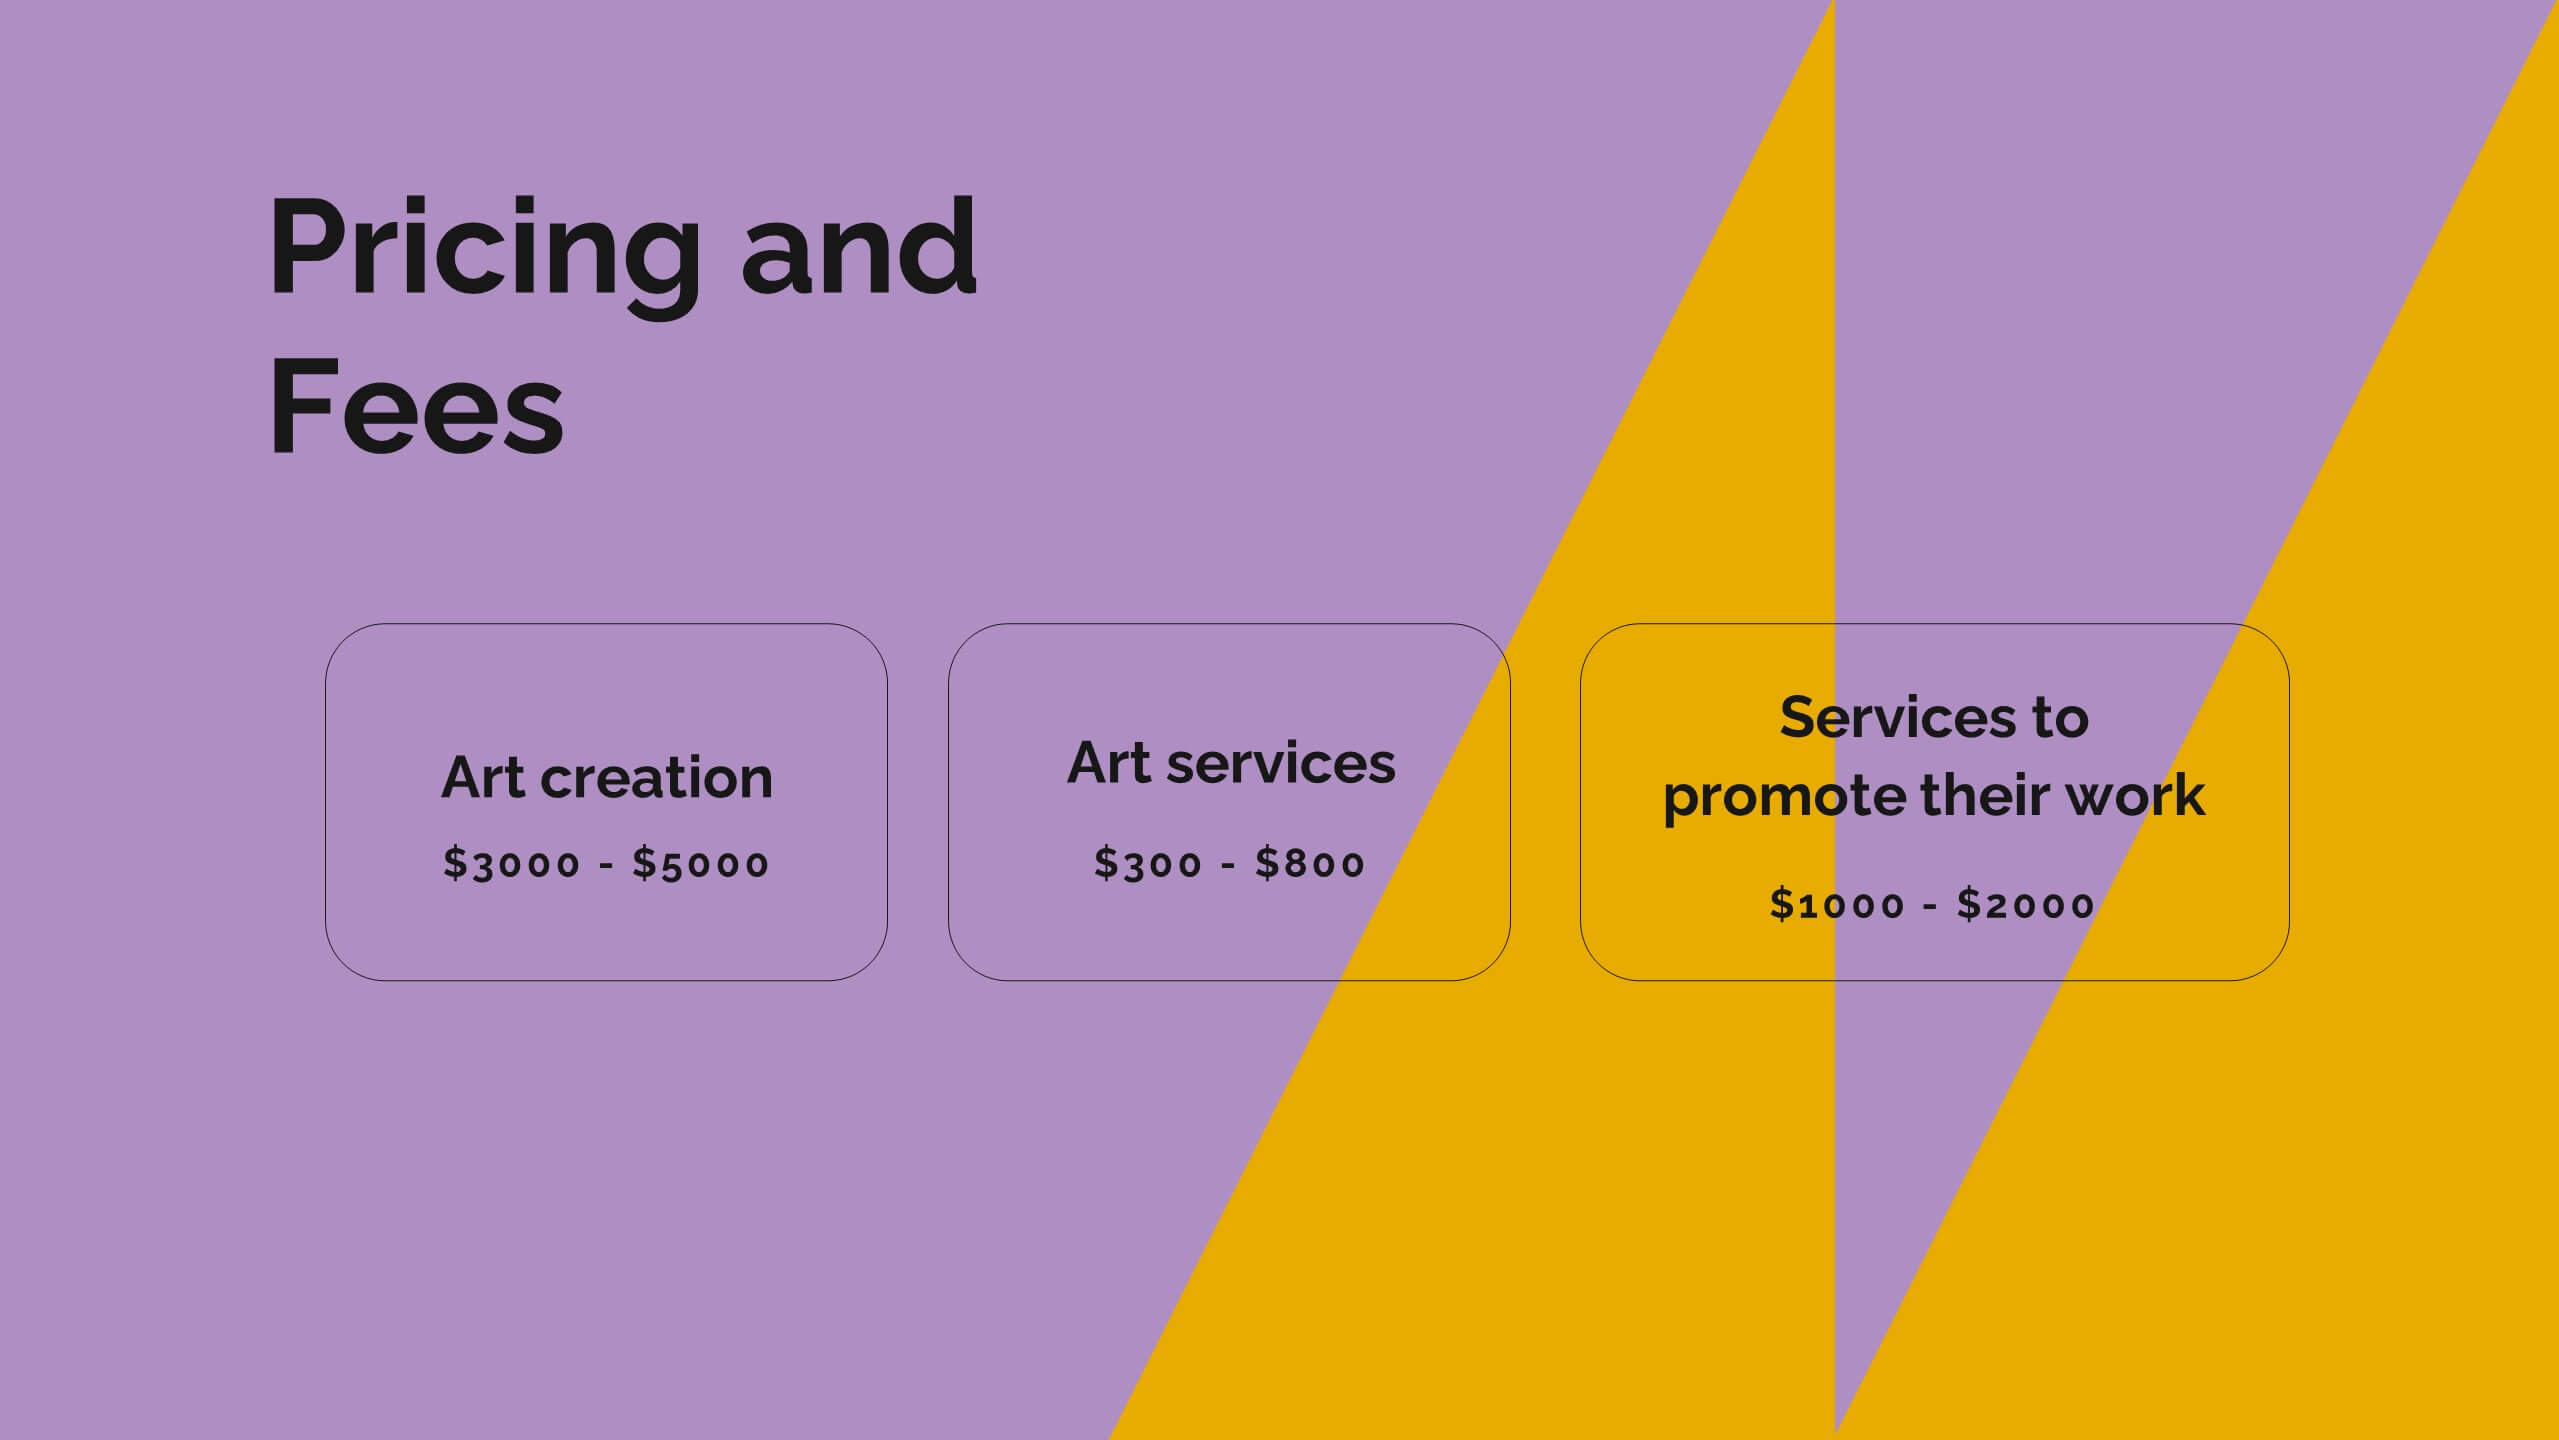
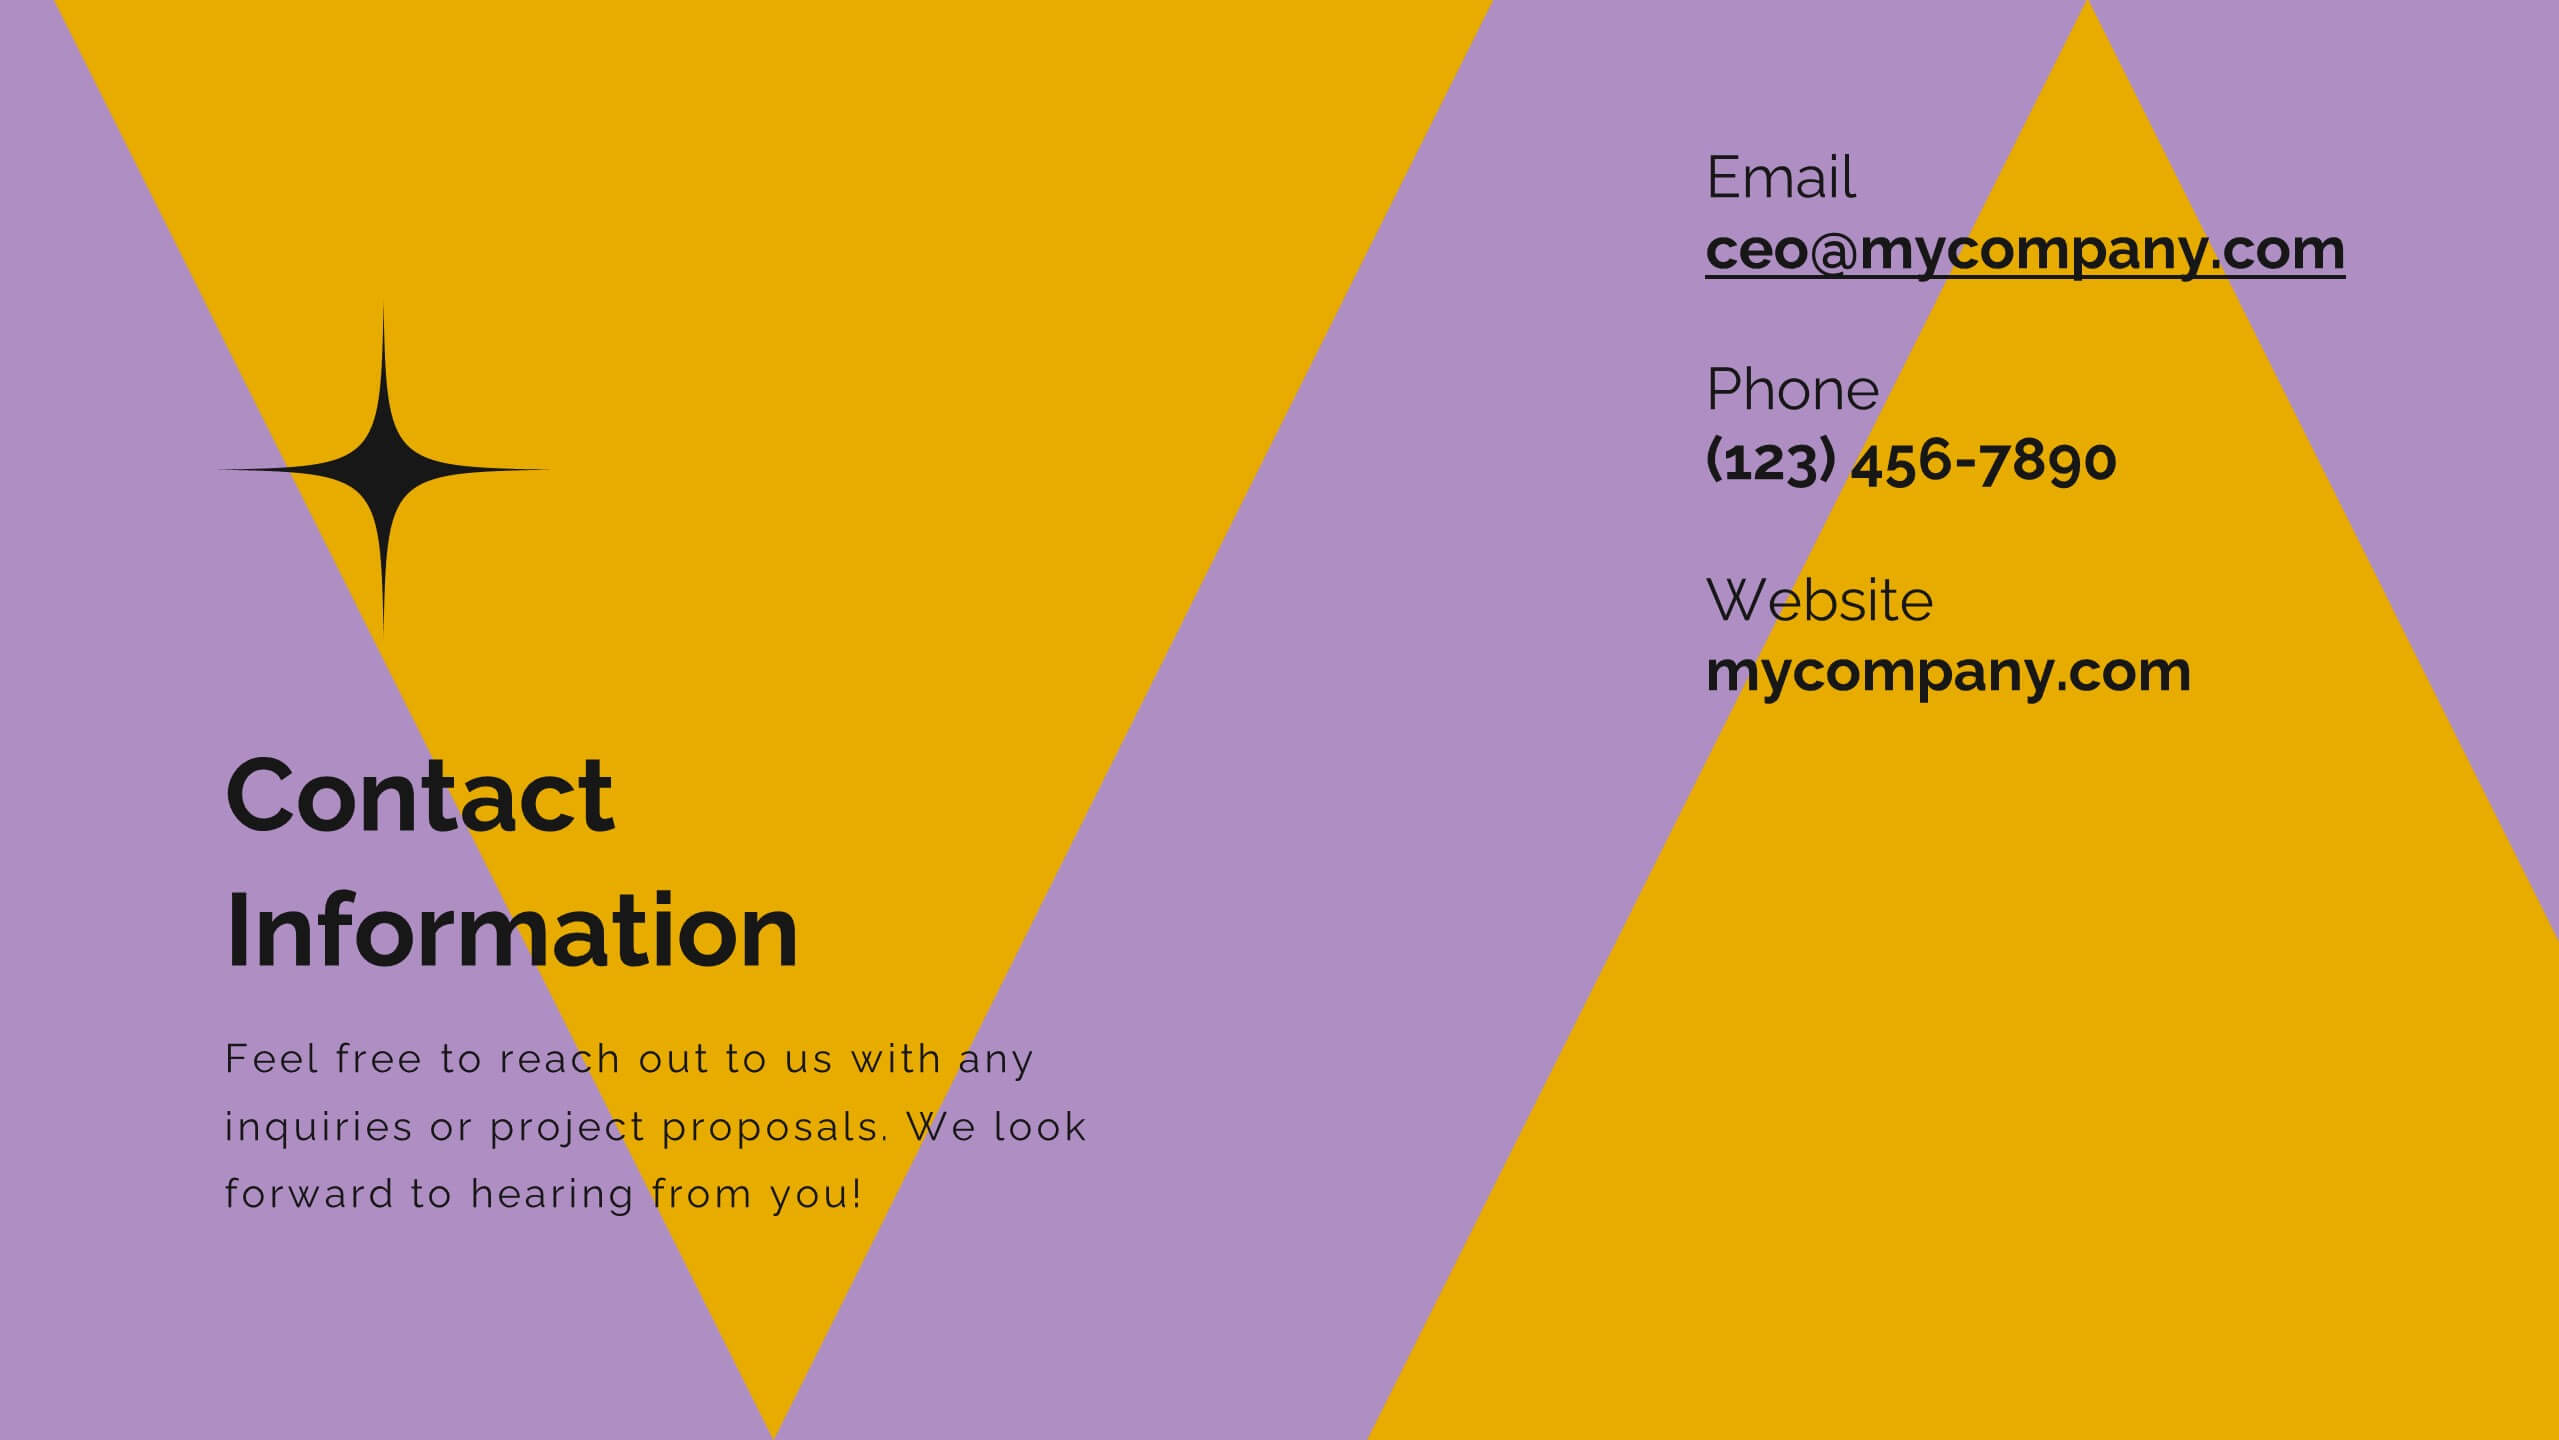
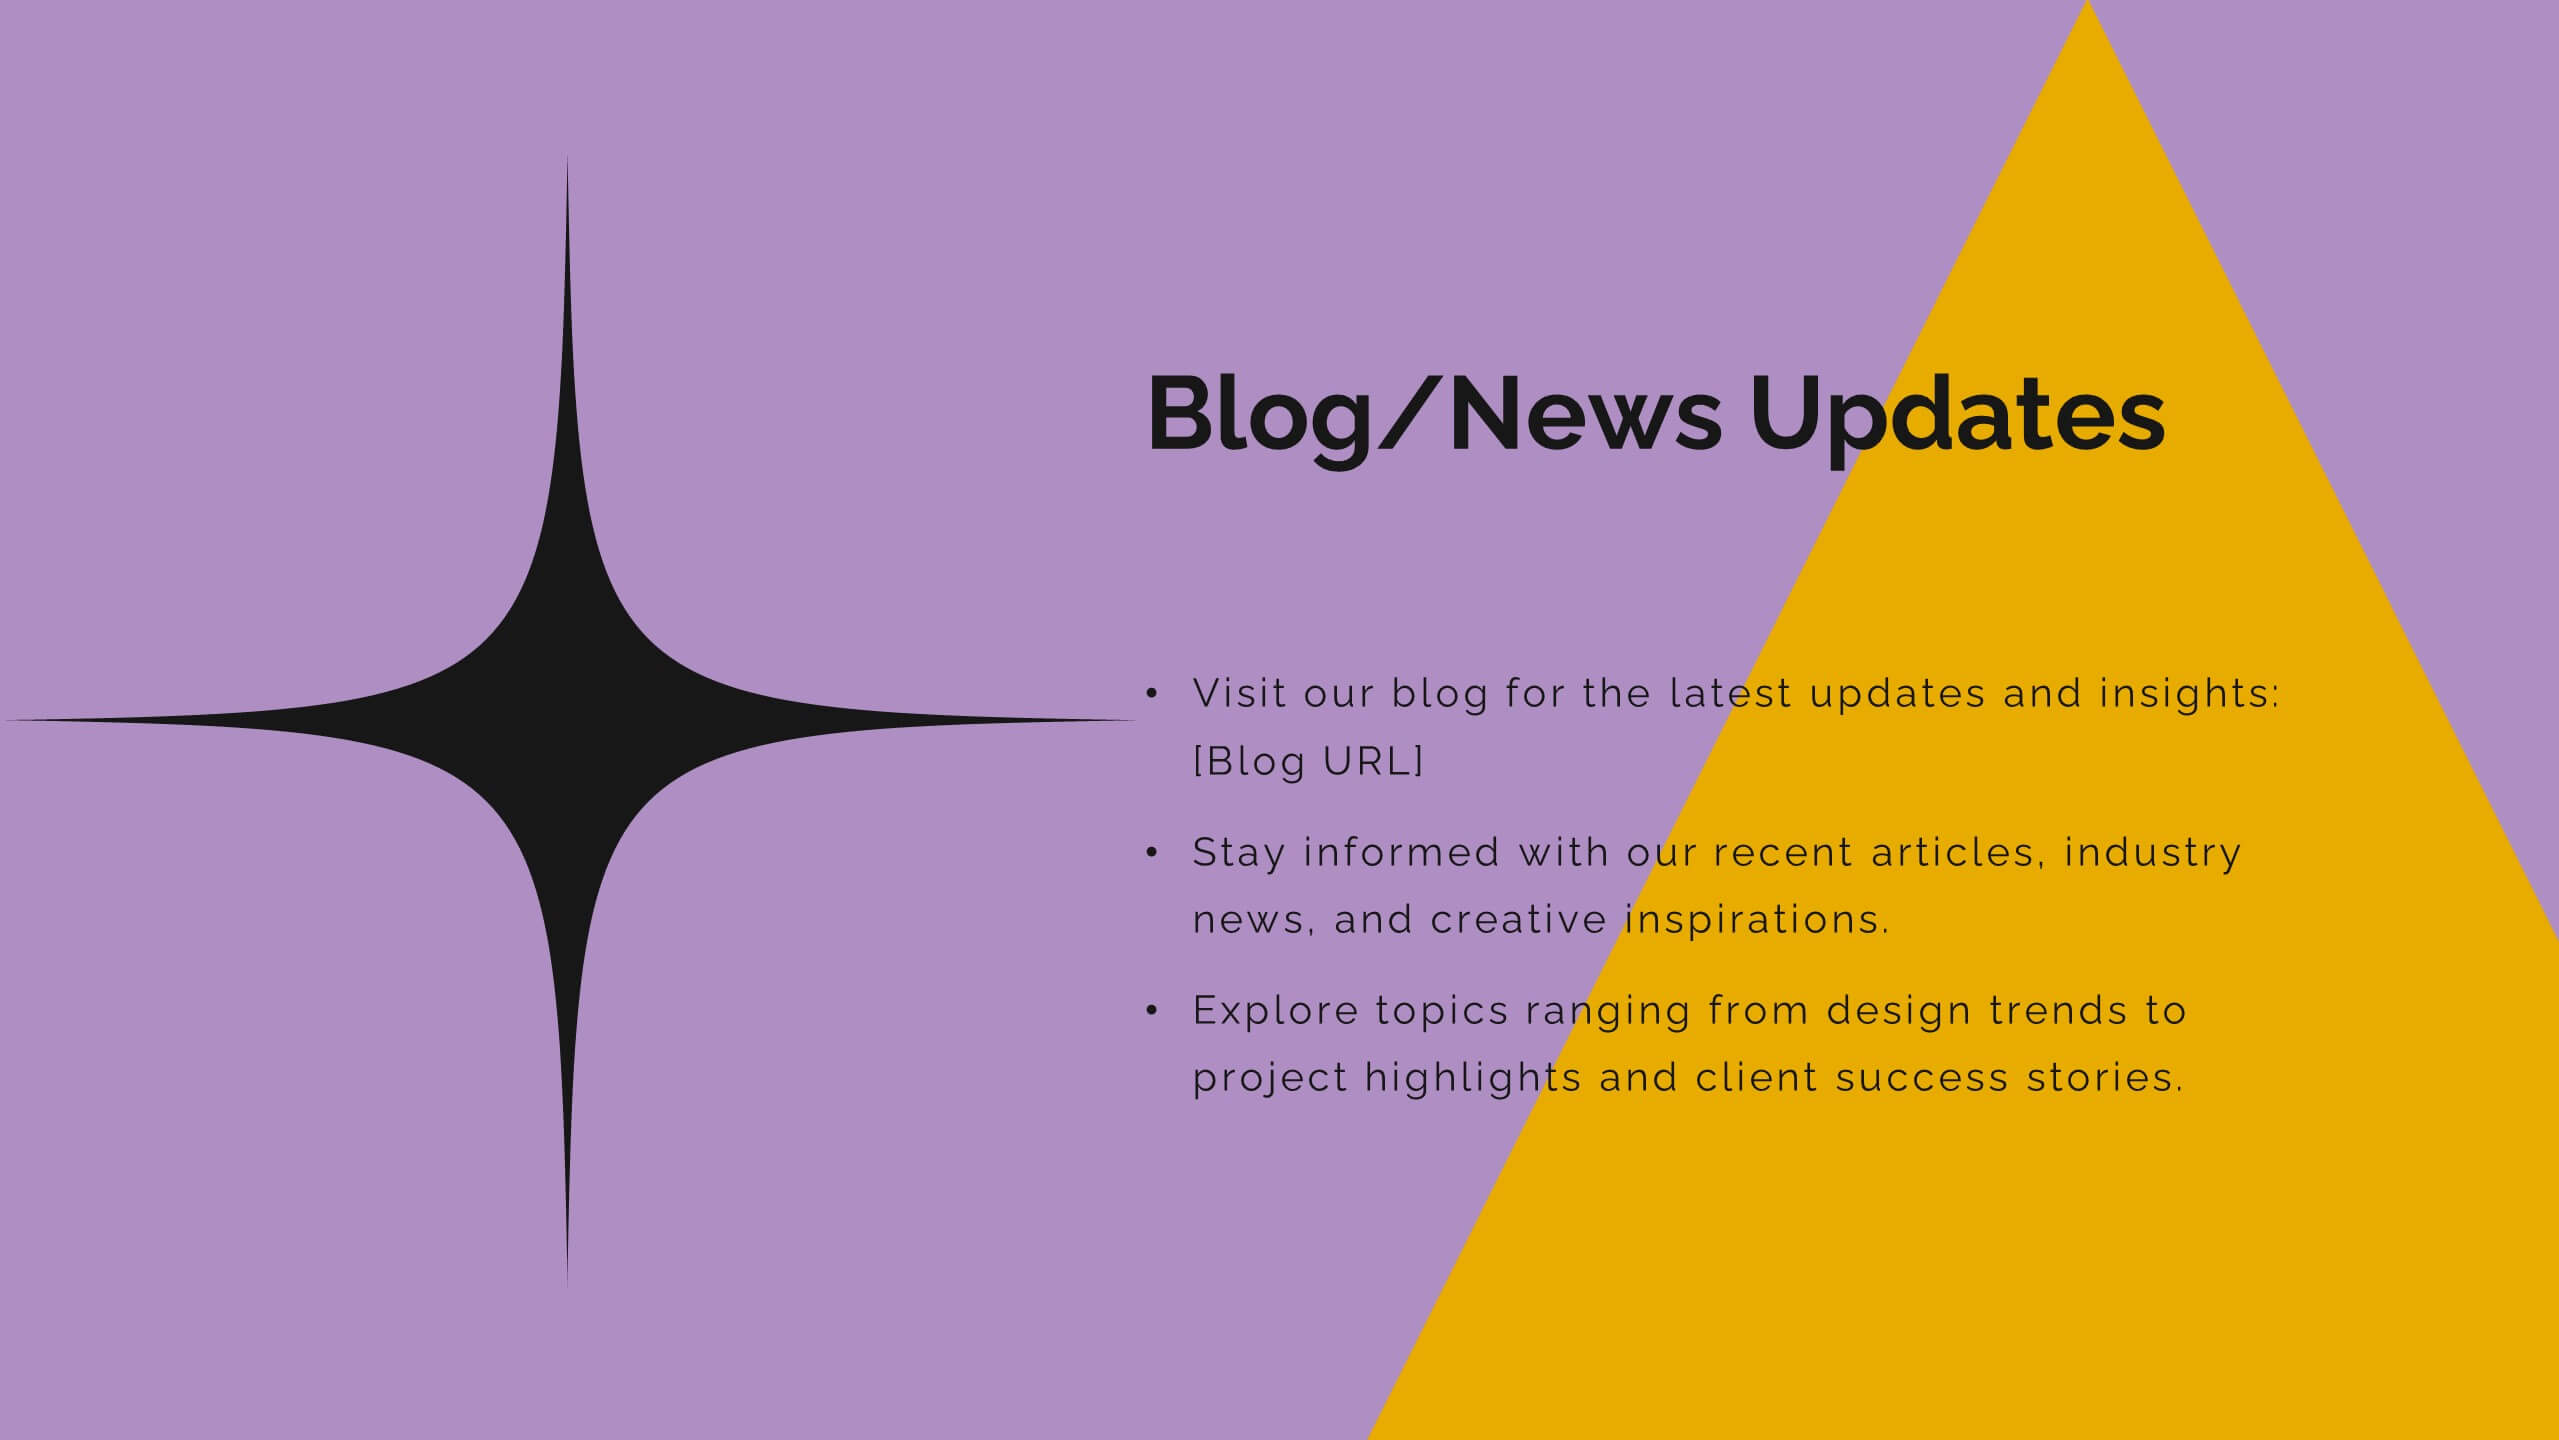
Vortex Artist Portfolio Template Presentation
Showcase your artistic brilliance with this eye-catching portfolio presentation template! Perfect for highlighting your projects, creative process, and awards, it features vibrant slides for your philosophy, collaborations, and client testimonials. Impress potential clients and collaborators with a stunning, well-organized portfolio. Compatible with PowerPoint, Keynote, and Google Slides for seamless presentations on any platform.


16 diapositivas
SEO Research Analysis Presentation
Designed with meticulous attention to detail, this presentation template offers an extensive overview of SEO Analysis Research, perfect for specialists eager to explore the depths of search engine optimization. The initial slide establishes a solid foundation for comprehensive analysis. Following, the 'About' segment delivers a brief yet informative look at the organization's prowess and experience in the realm of SEO. The 'Our Teamwork' slide introduces the team behind the SEO success, showcasing the individuals and their roles. Moving on to 'Strategy,' the template allows for a detailed exposition of the approach and methodologies applied to enhance online visibility. Key metrics are brought to the forefront in a monthly overview, providing insights into traffic sources, content performance, and keyword rankings. The 'SEO Report' highlights significant analytics, such as searches and sign-up rates, emphasizing the impact of the SEO efforts. Complete the presentation with a cordial 'Thank You' to the audience and a 'Credits' slide for resource attribution, ensuring transparency and professionalism. This template is ideal for delivering powerful insights into SEO practices and outcomes.


6 diapositivas
Framework for Business Hierarchies Presentation
Clearly define organizational layers with the Framework for Business Hierarchies Presentation. This pyramid-style layout is perfect for illustrating chain-of-command, leadership structures, or functional roles from executive to operational levels. The template features color-coded tiers, editable icons, and fully customizable text to suit your business model. Ideal for PowerPoint, Canva, Keynote, and Google Slides.


6 diapositivas
Business Performance Pie Chart Presentation
Showcase key business insights with the Business Performance Pie Chart Presentation template. Designed for professionals, this fully editable slide deck allows you to present performance metrics, financial data, and strategic analysis using visually appealing pie charts. Ideal for business reports, investor meetings, and corporate presentations, it ensures clarity and engagement. Compatible with PowerPoint, Keynote, and Google Slides.


12 diapositivas
Startup Investor Pitch Deck Presentation
Craft a compelling pitch with this Startup Investor Pitch Deck template. Featuring a structured layout, it helps showcase your startup’s vision, market potential, and financial projections. Designed for clarity and engagement, this template ensures a persuasive investor presentation. Fully compatible with PowerPoint, Keynote, and Google Slides for seamless customization.


6 diapositivas
Product Life Cycle Stages and Management Presentation
Visualize the journey from product development to market maturity with this modern, conveyor-style layout. Designed to represent five sequential phases, this presentation is perfect for product managers, marketing teams, or business strategists explaining launch strategies, performance tracking, or growth planning. Fully editable in PowerPoint, Keynote, and Google Slides.


23 diapositivas
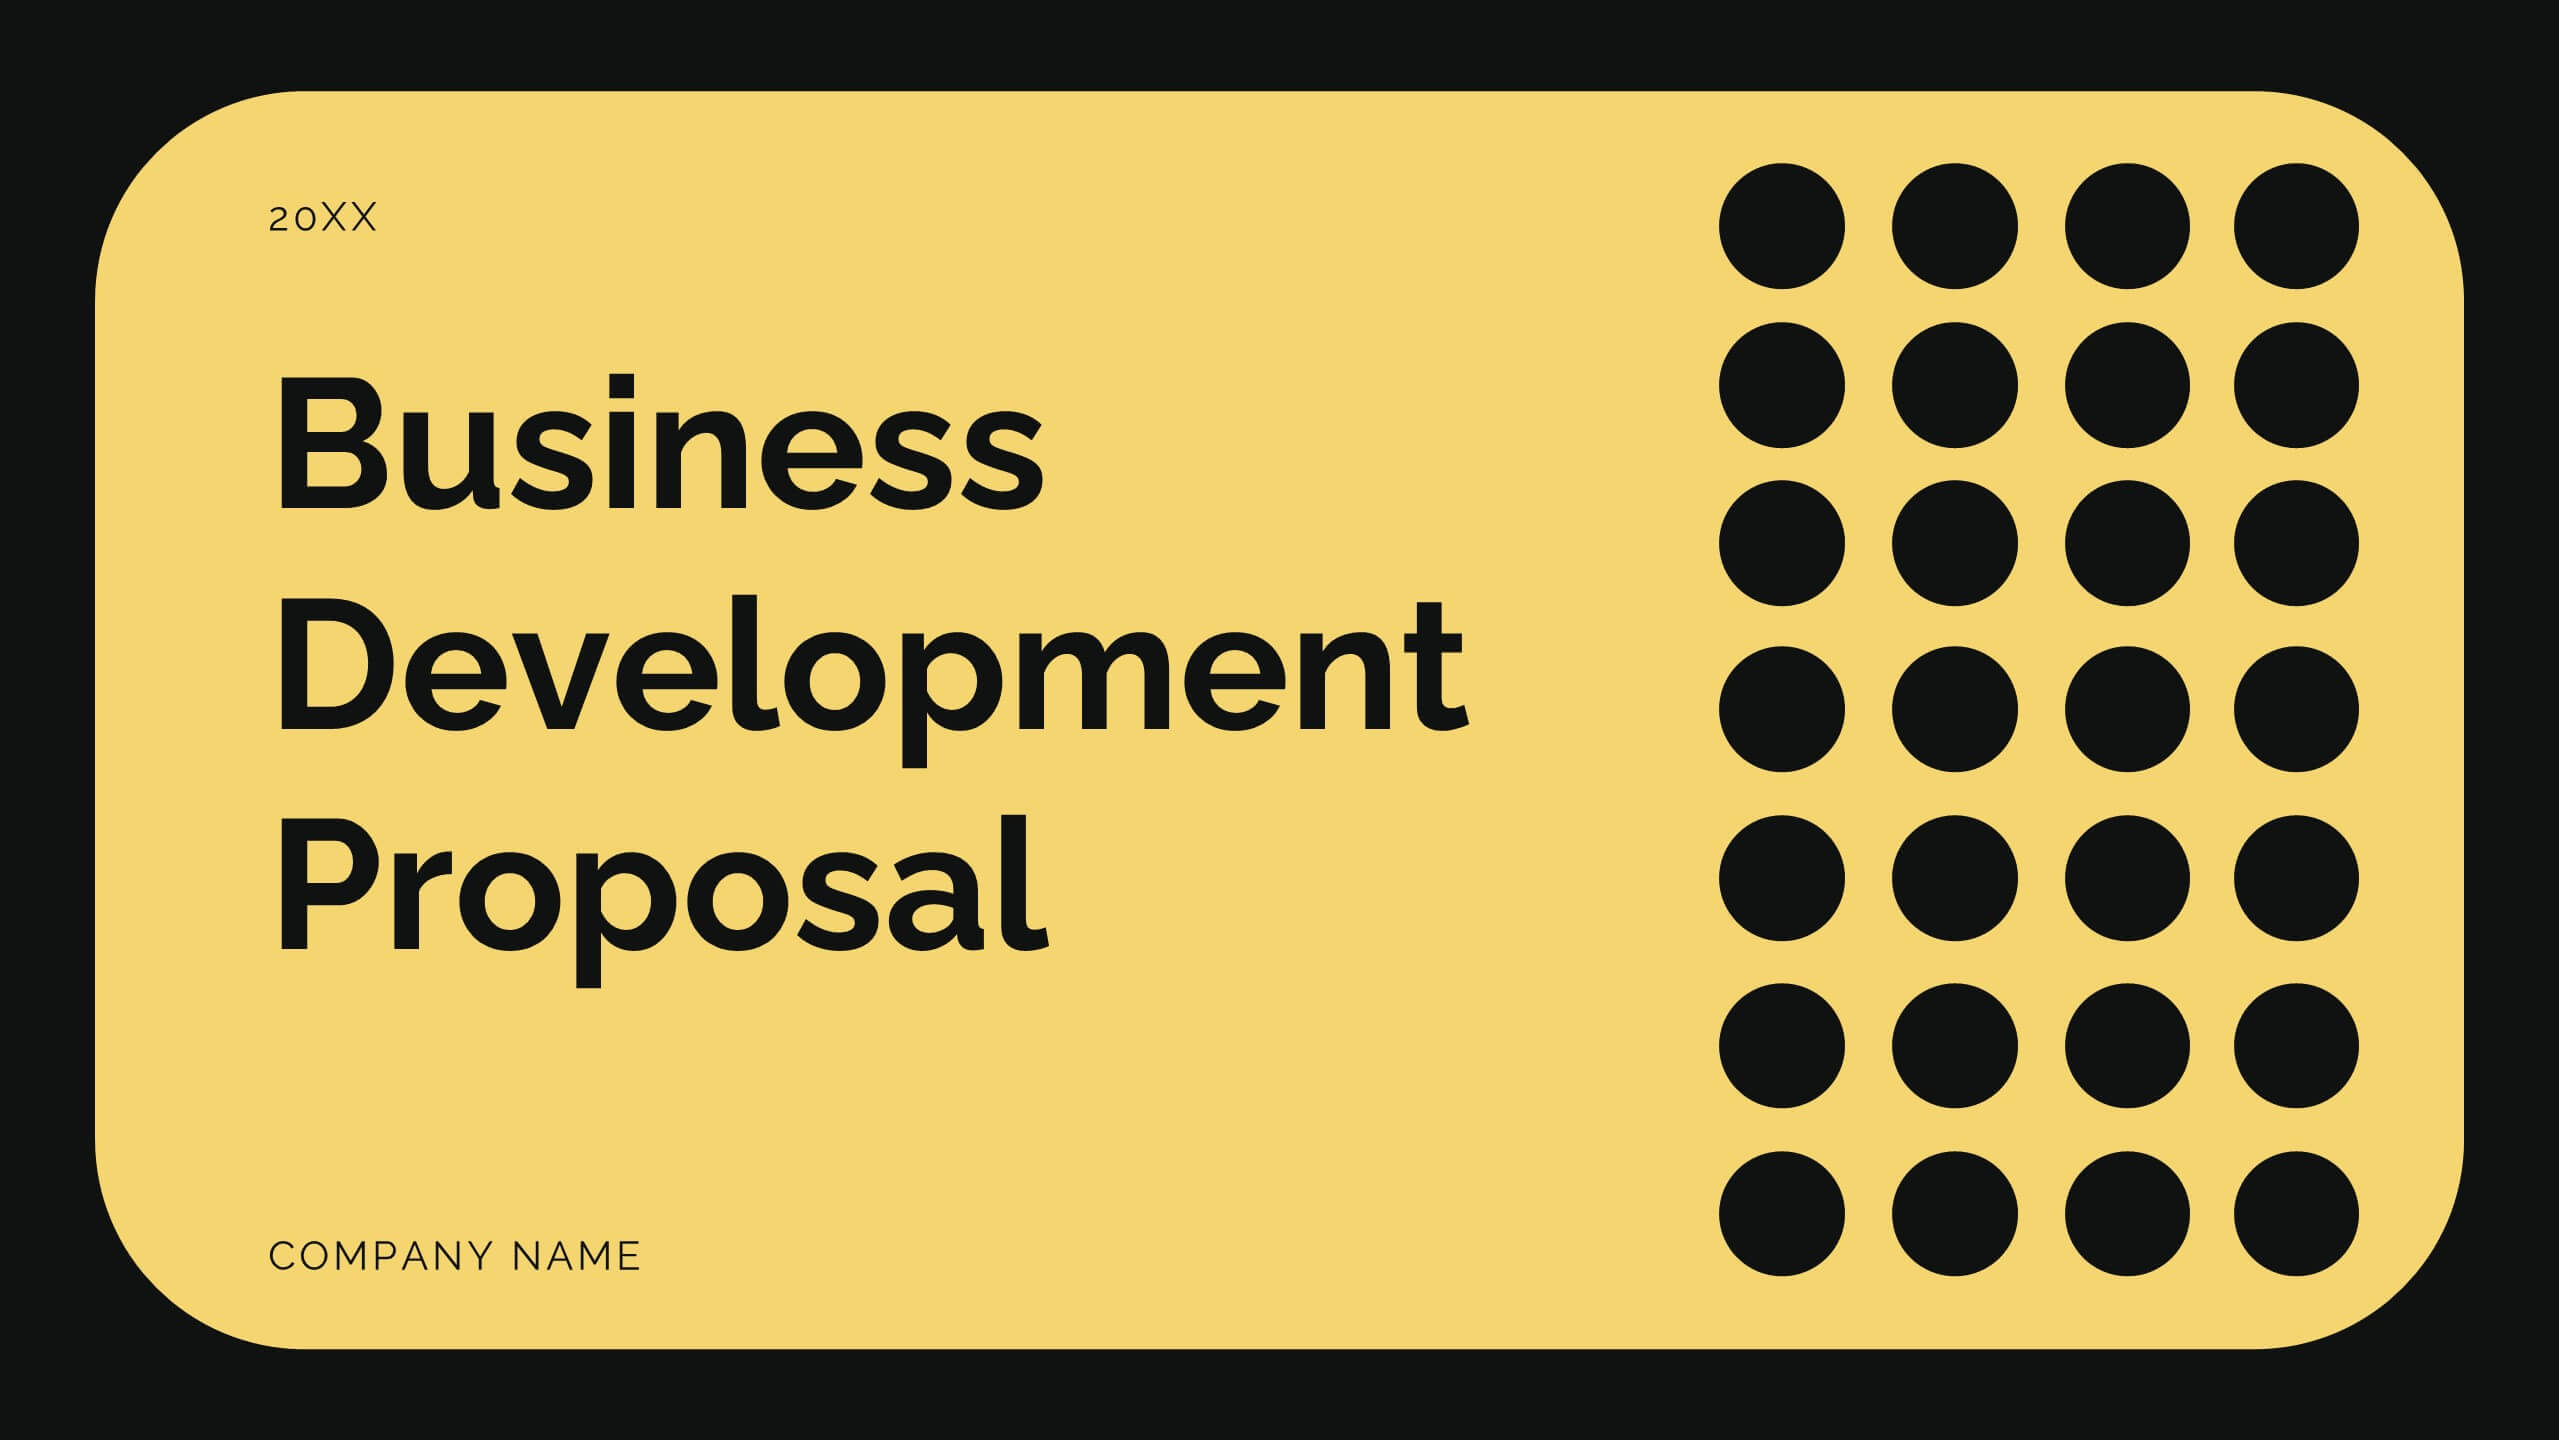
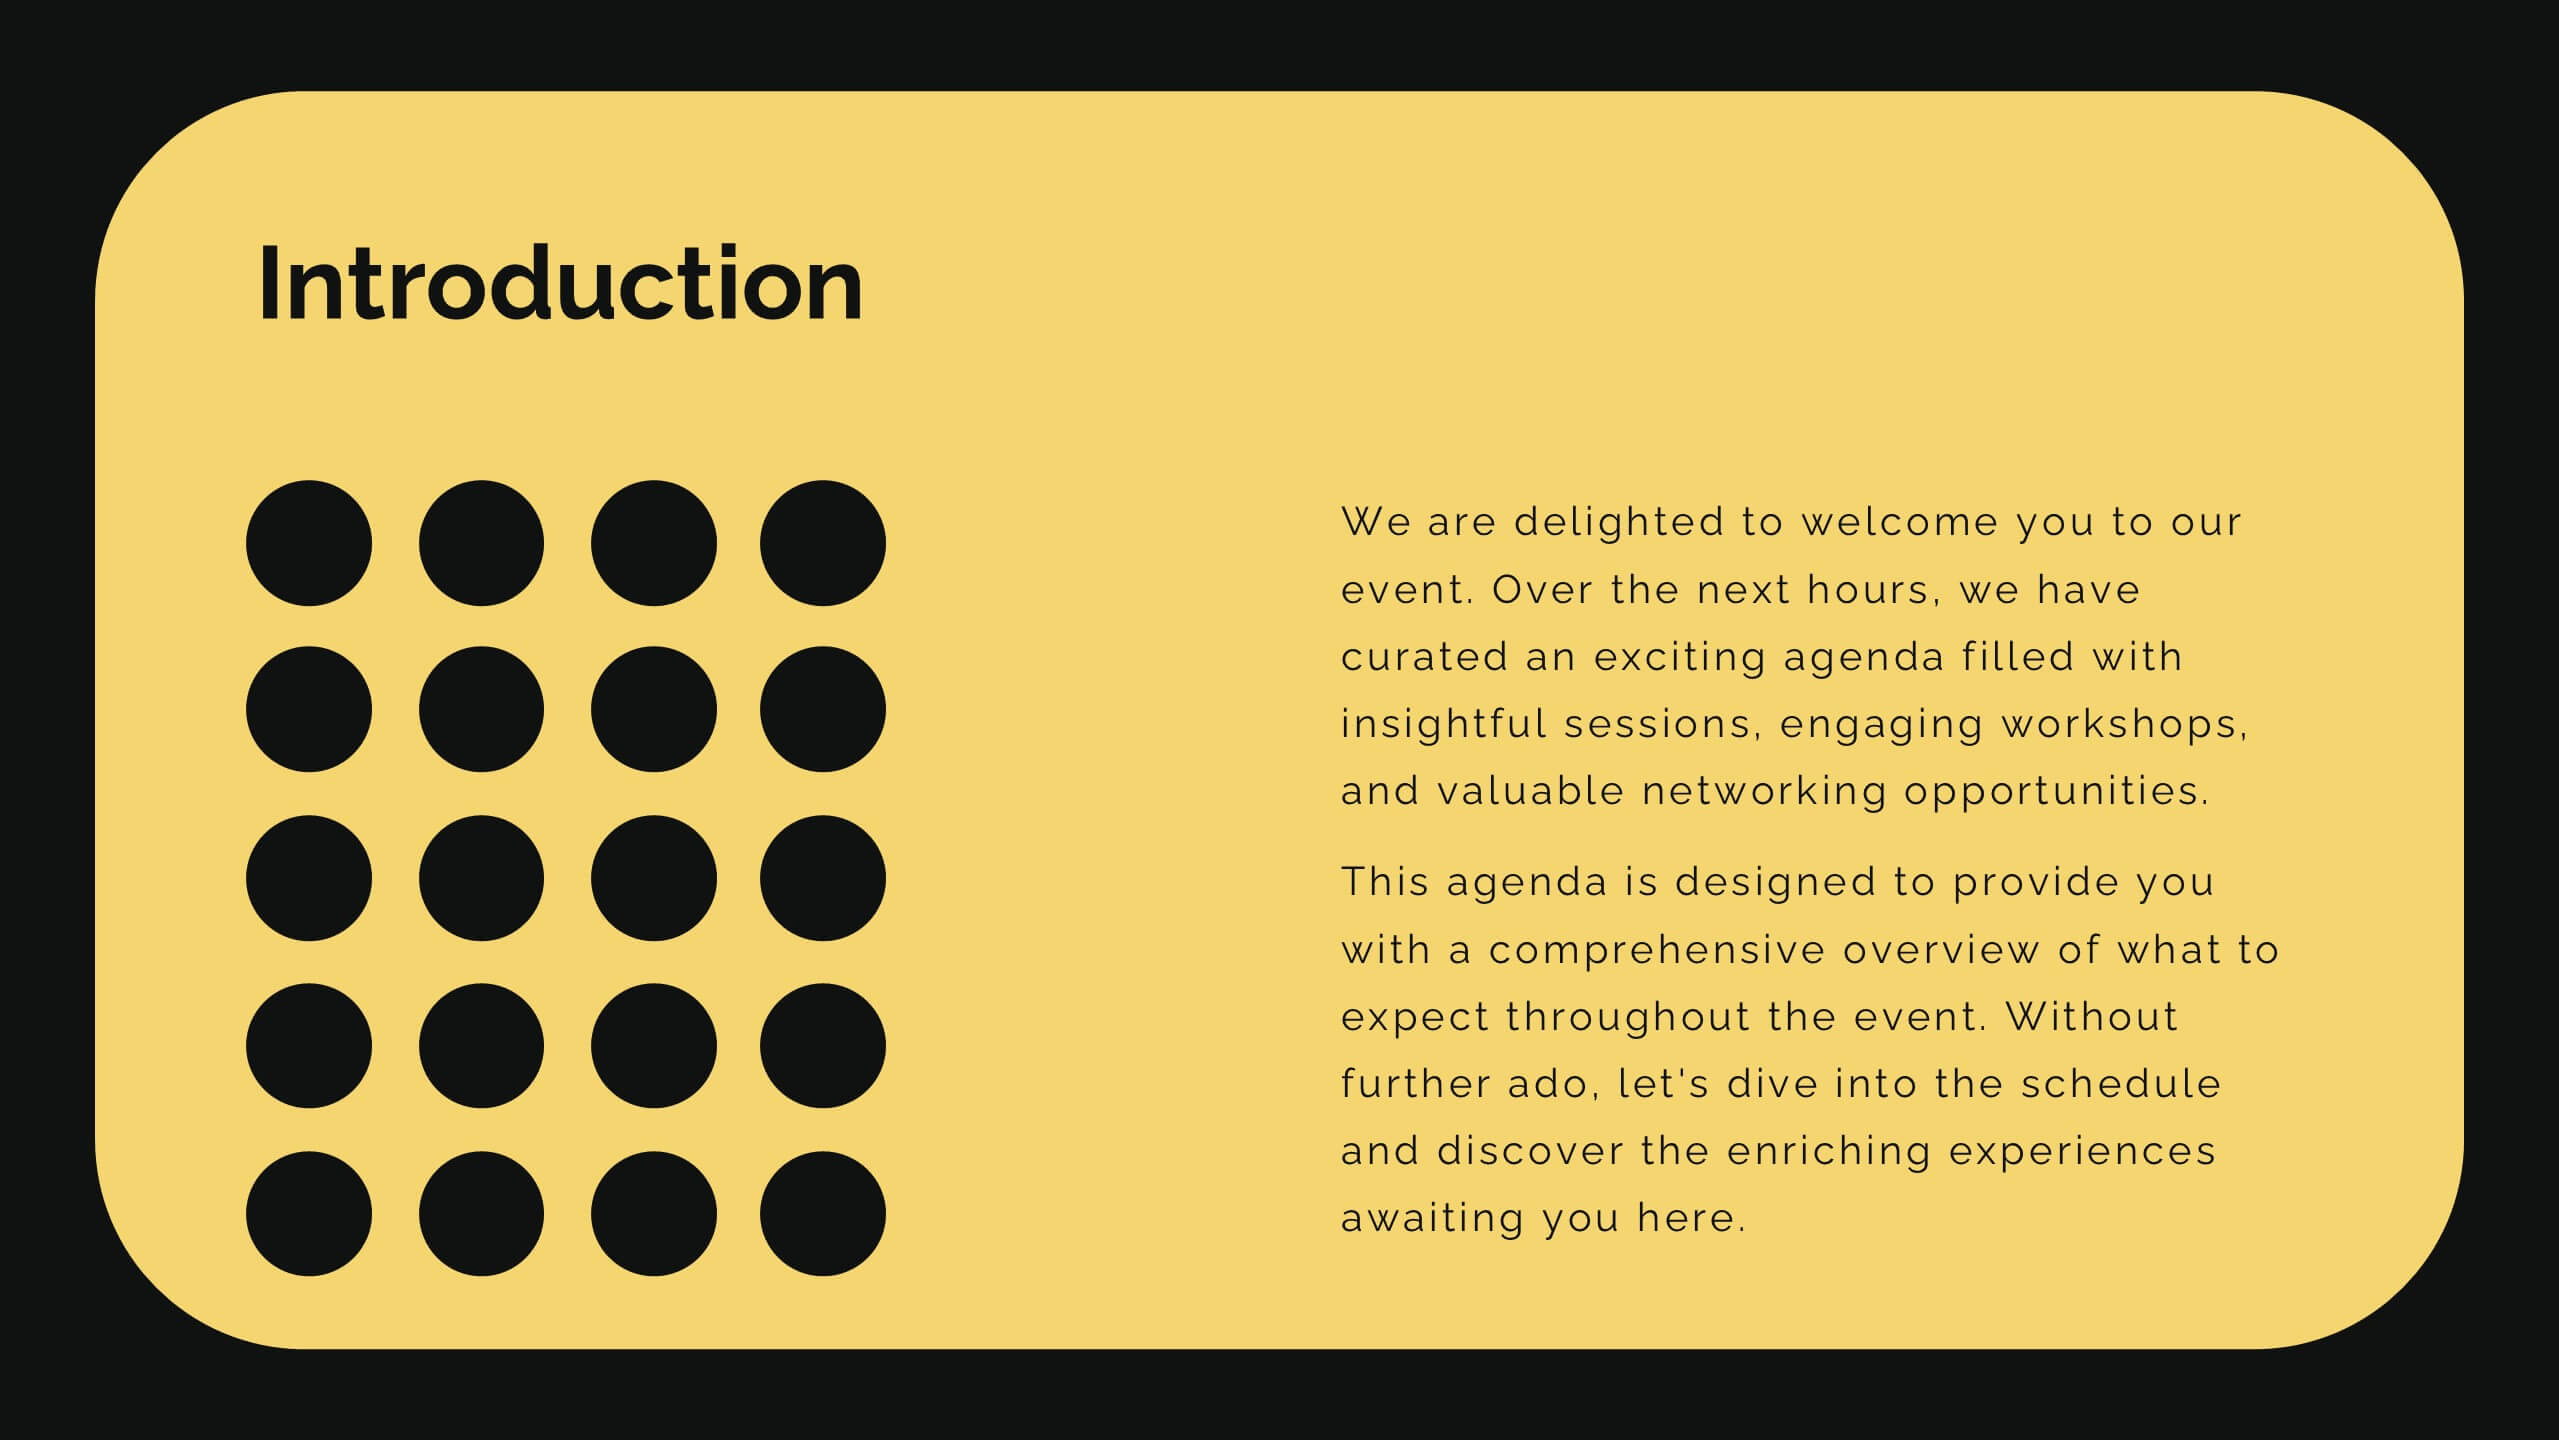
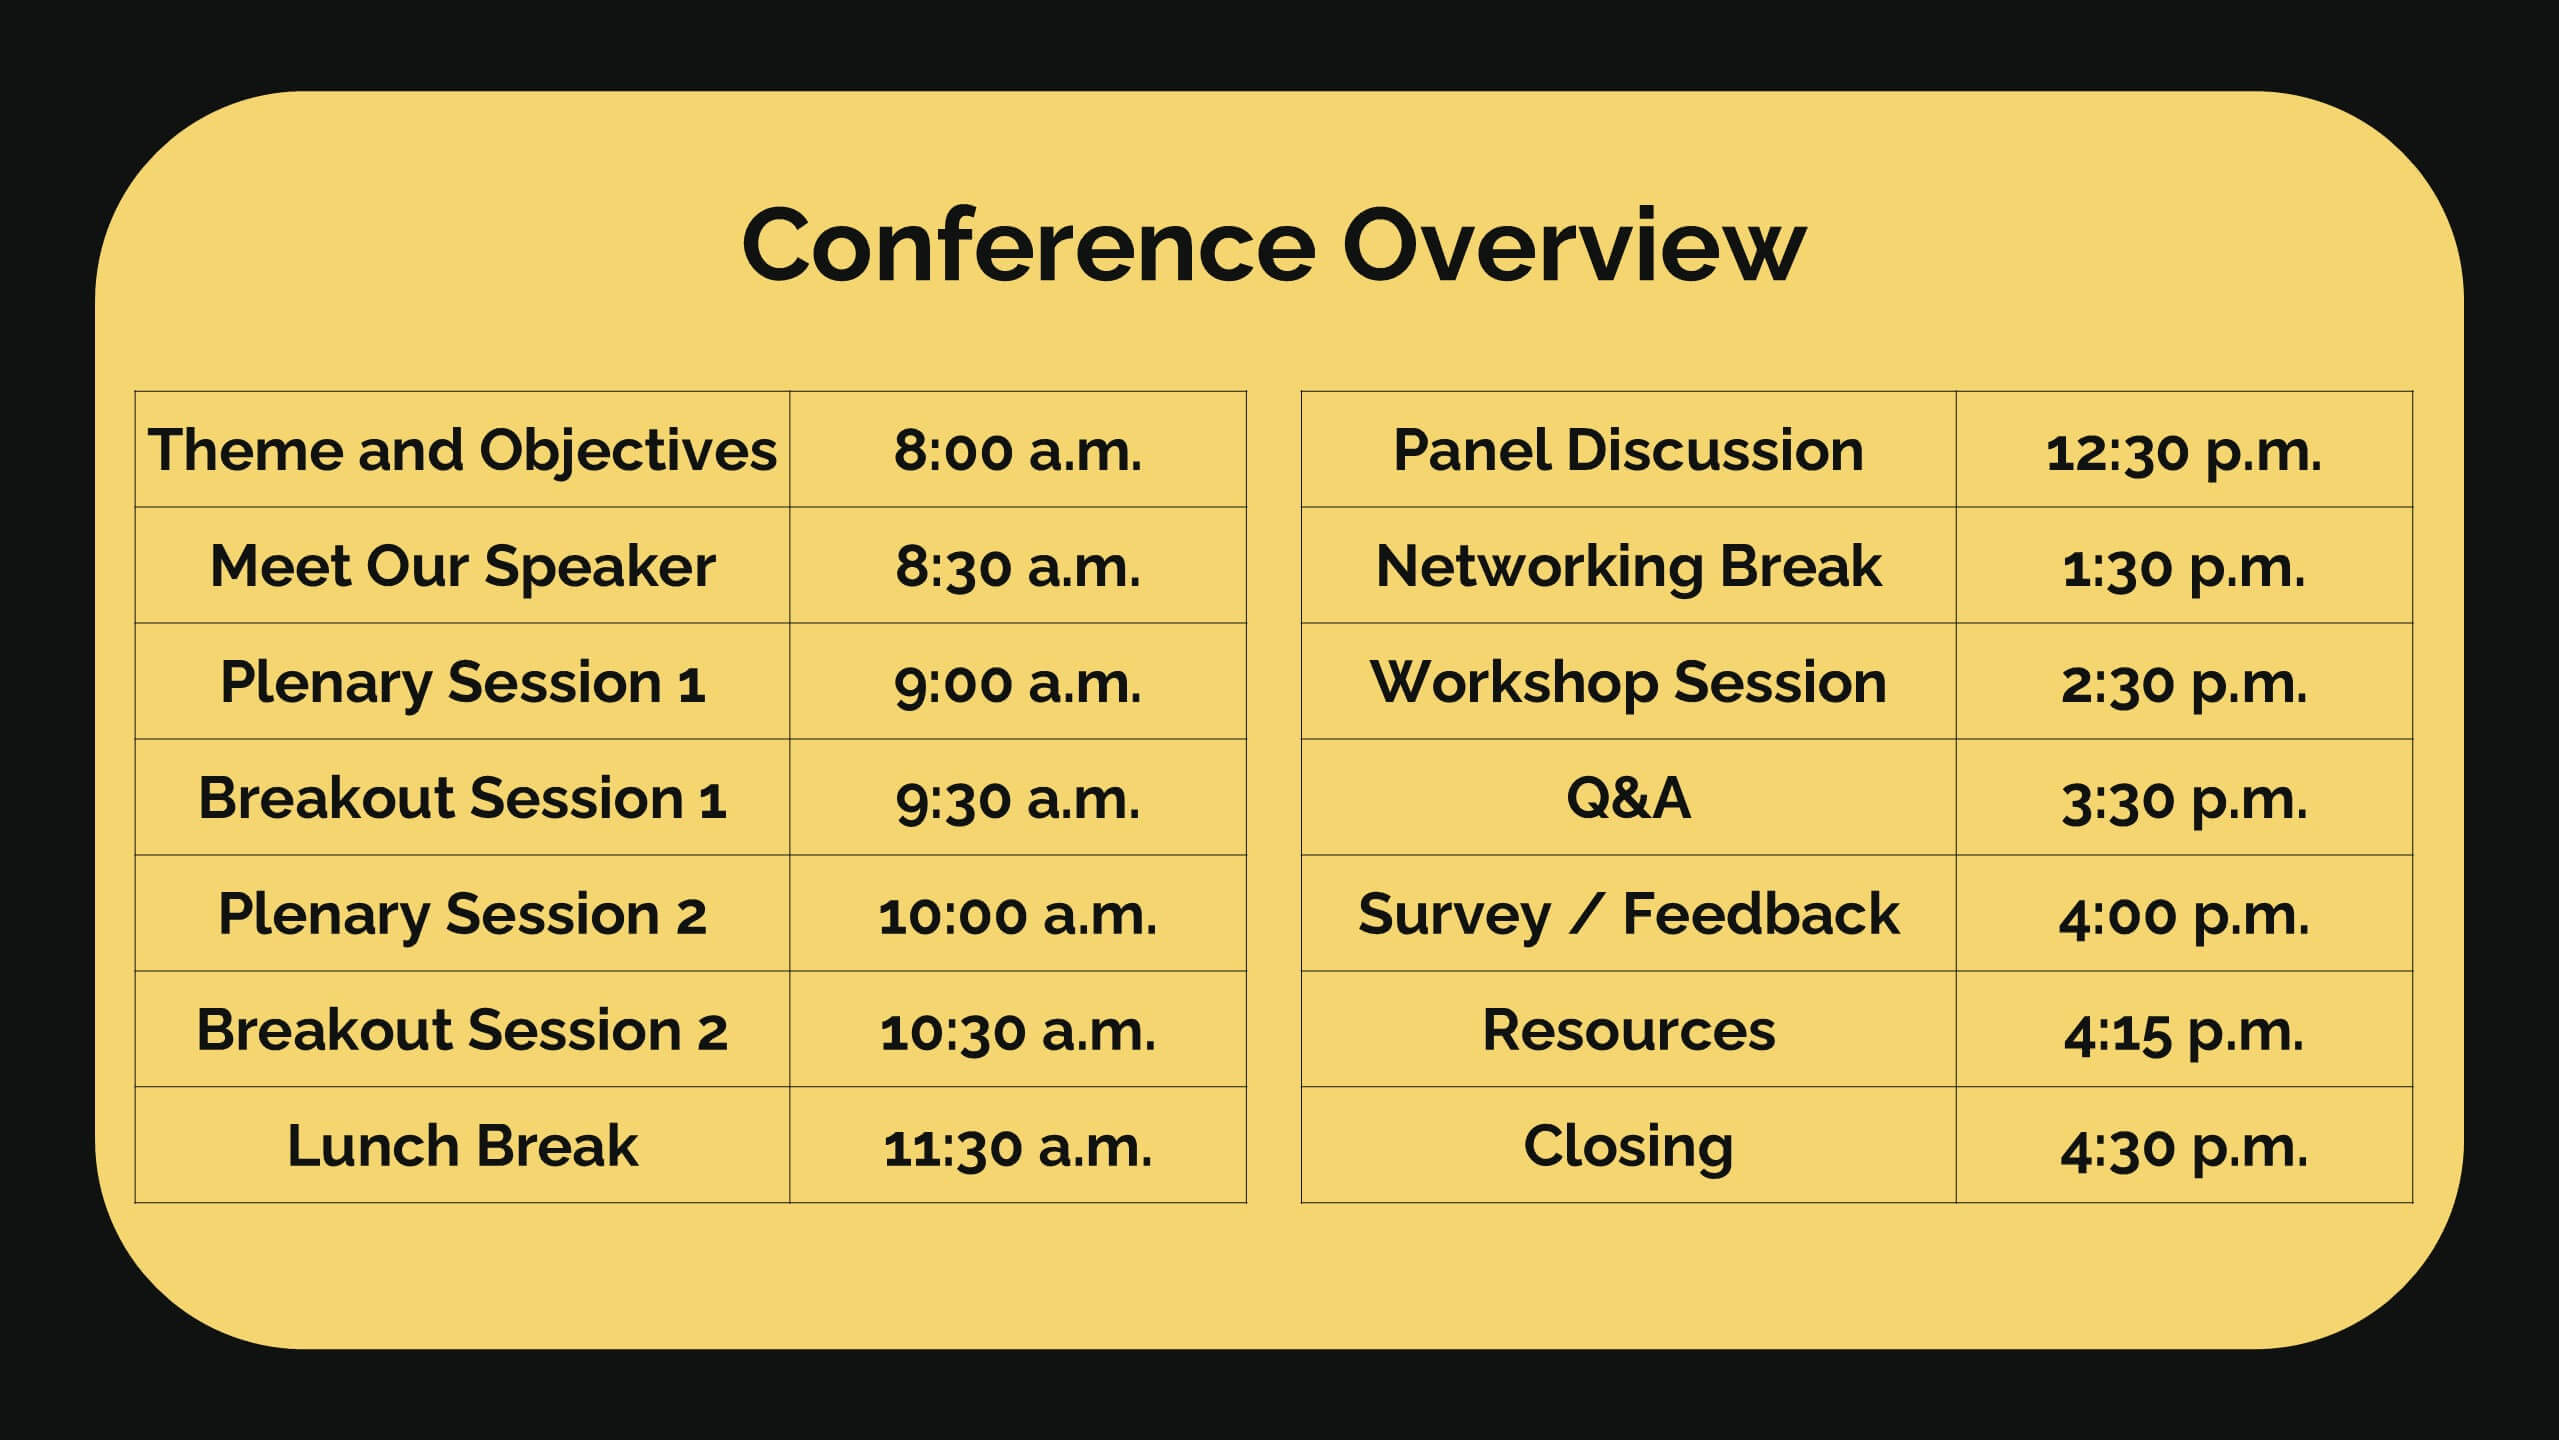
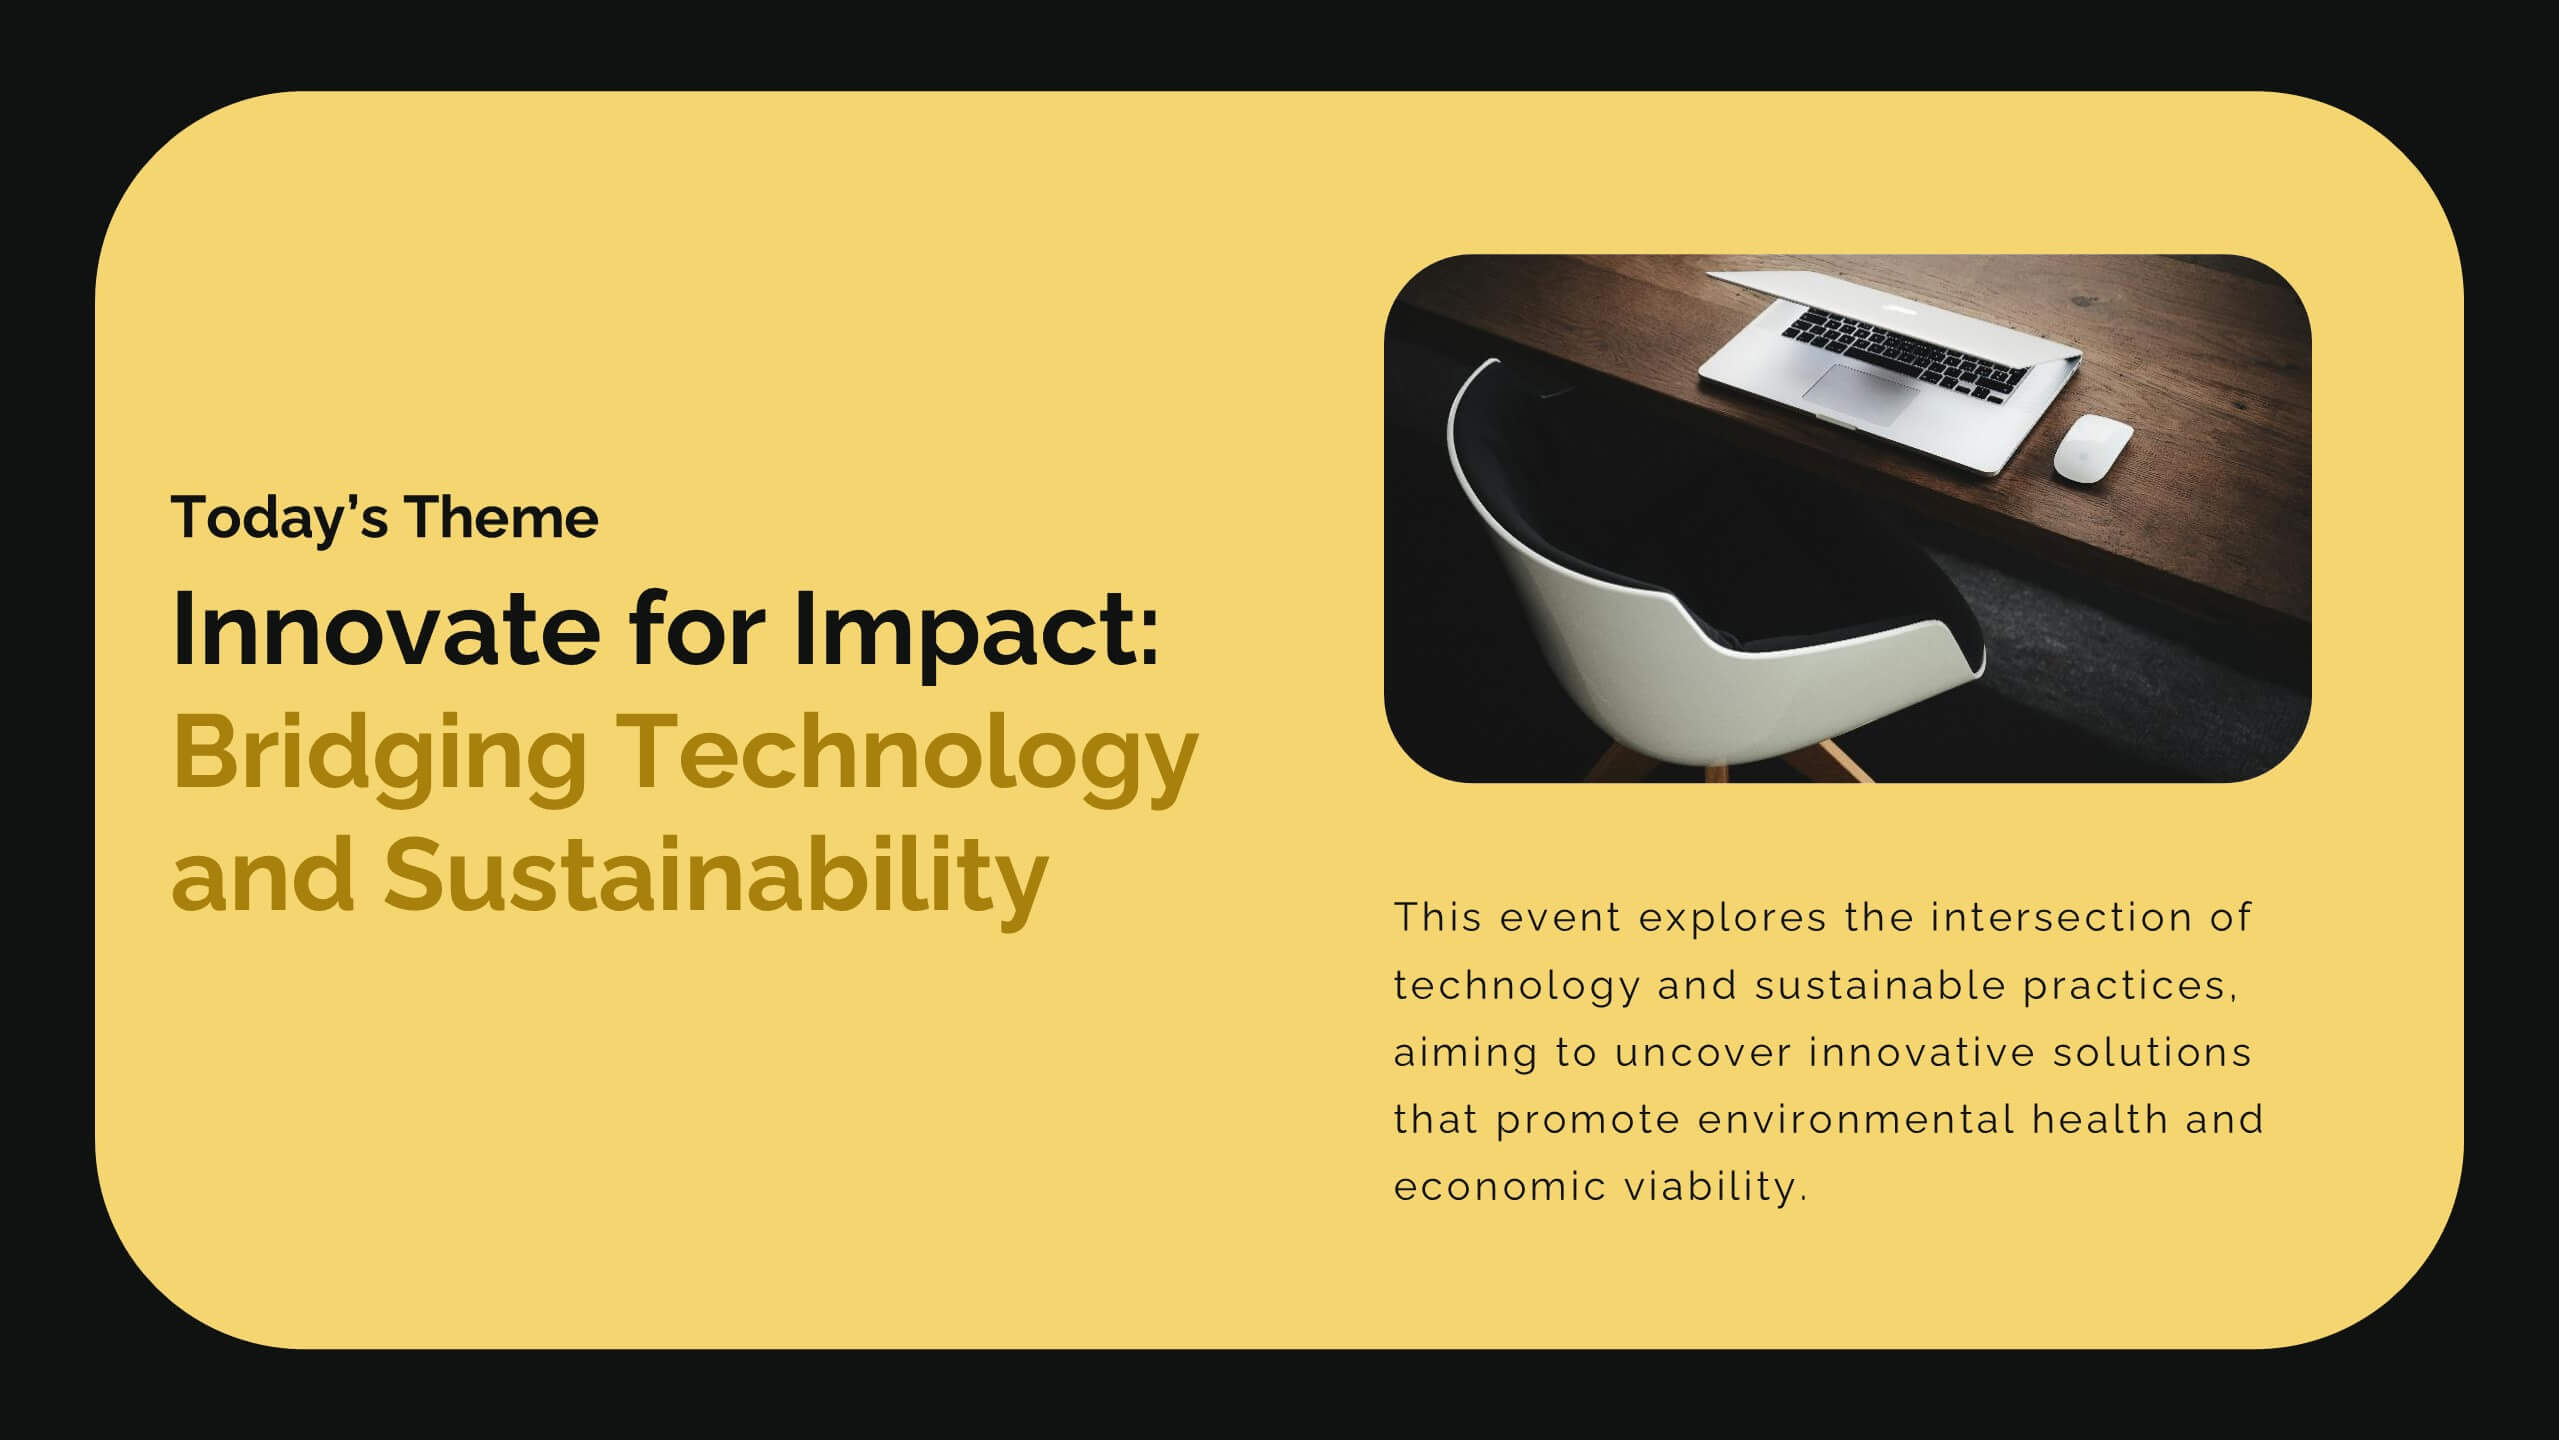
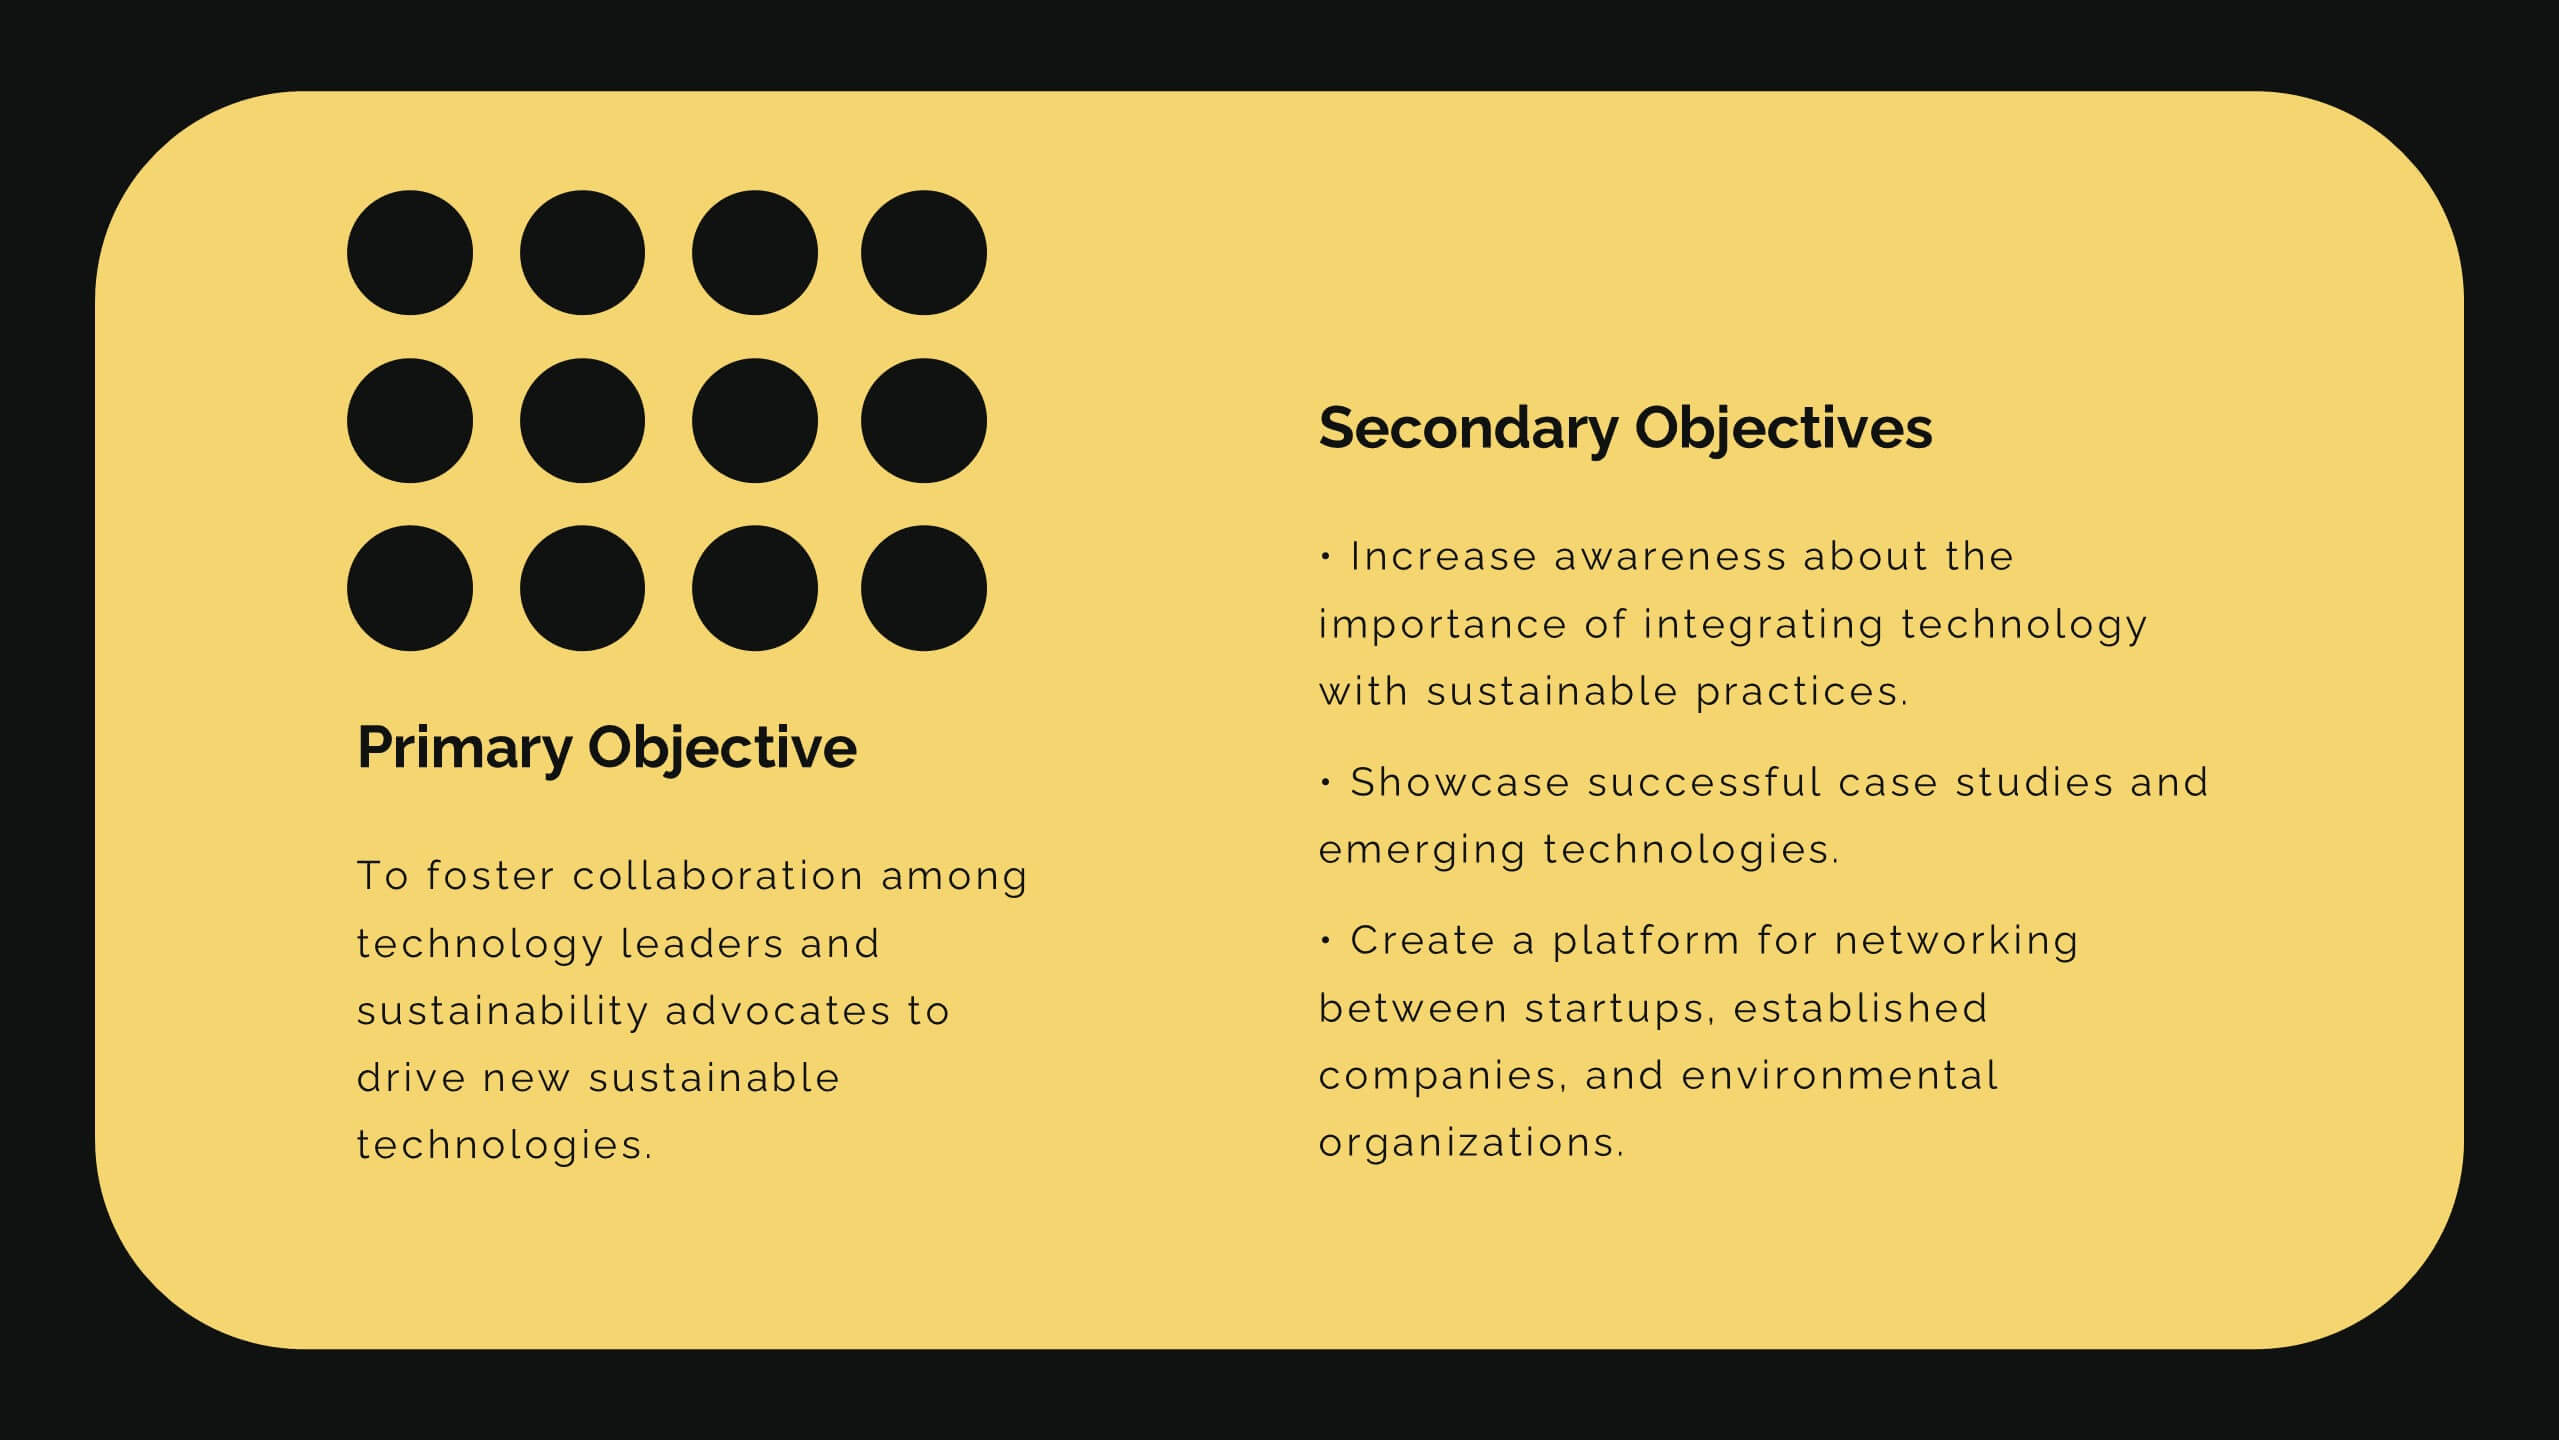
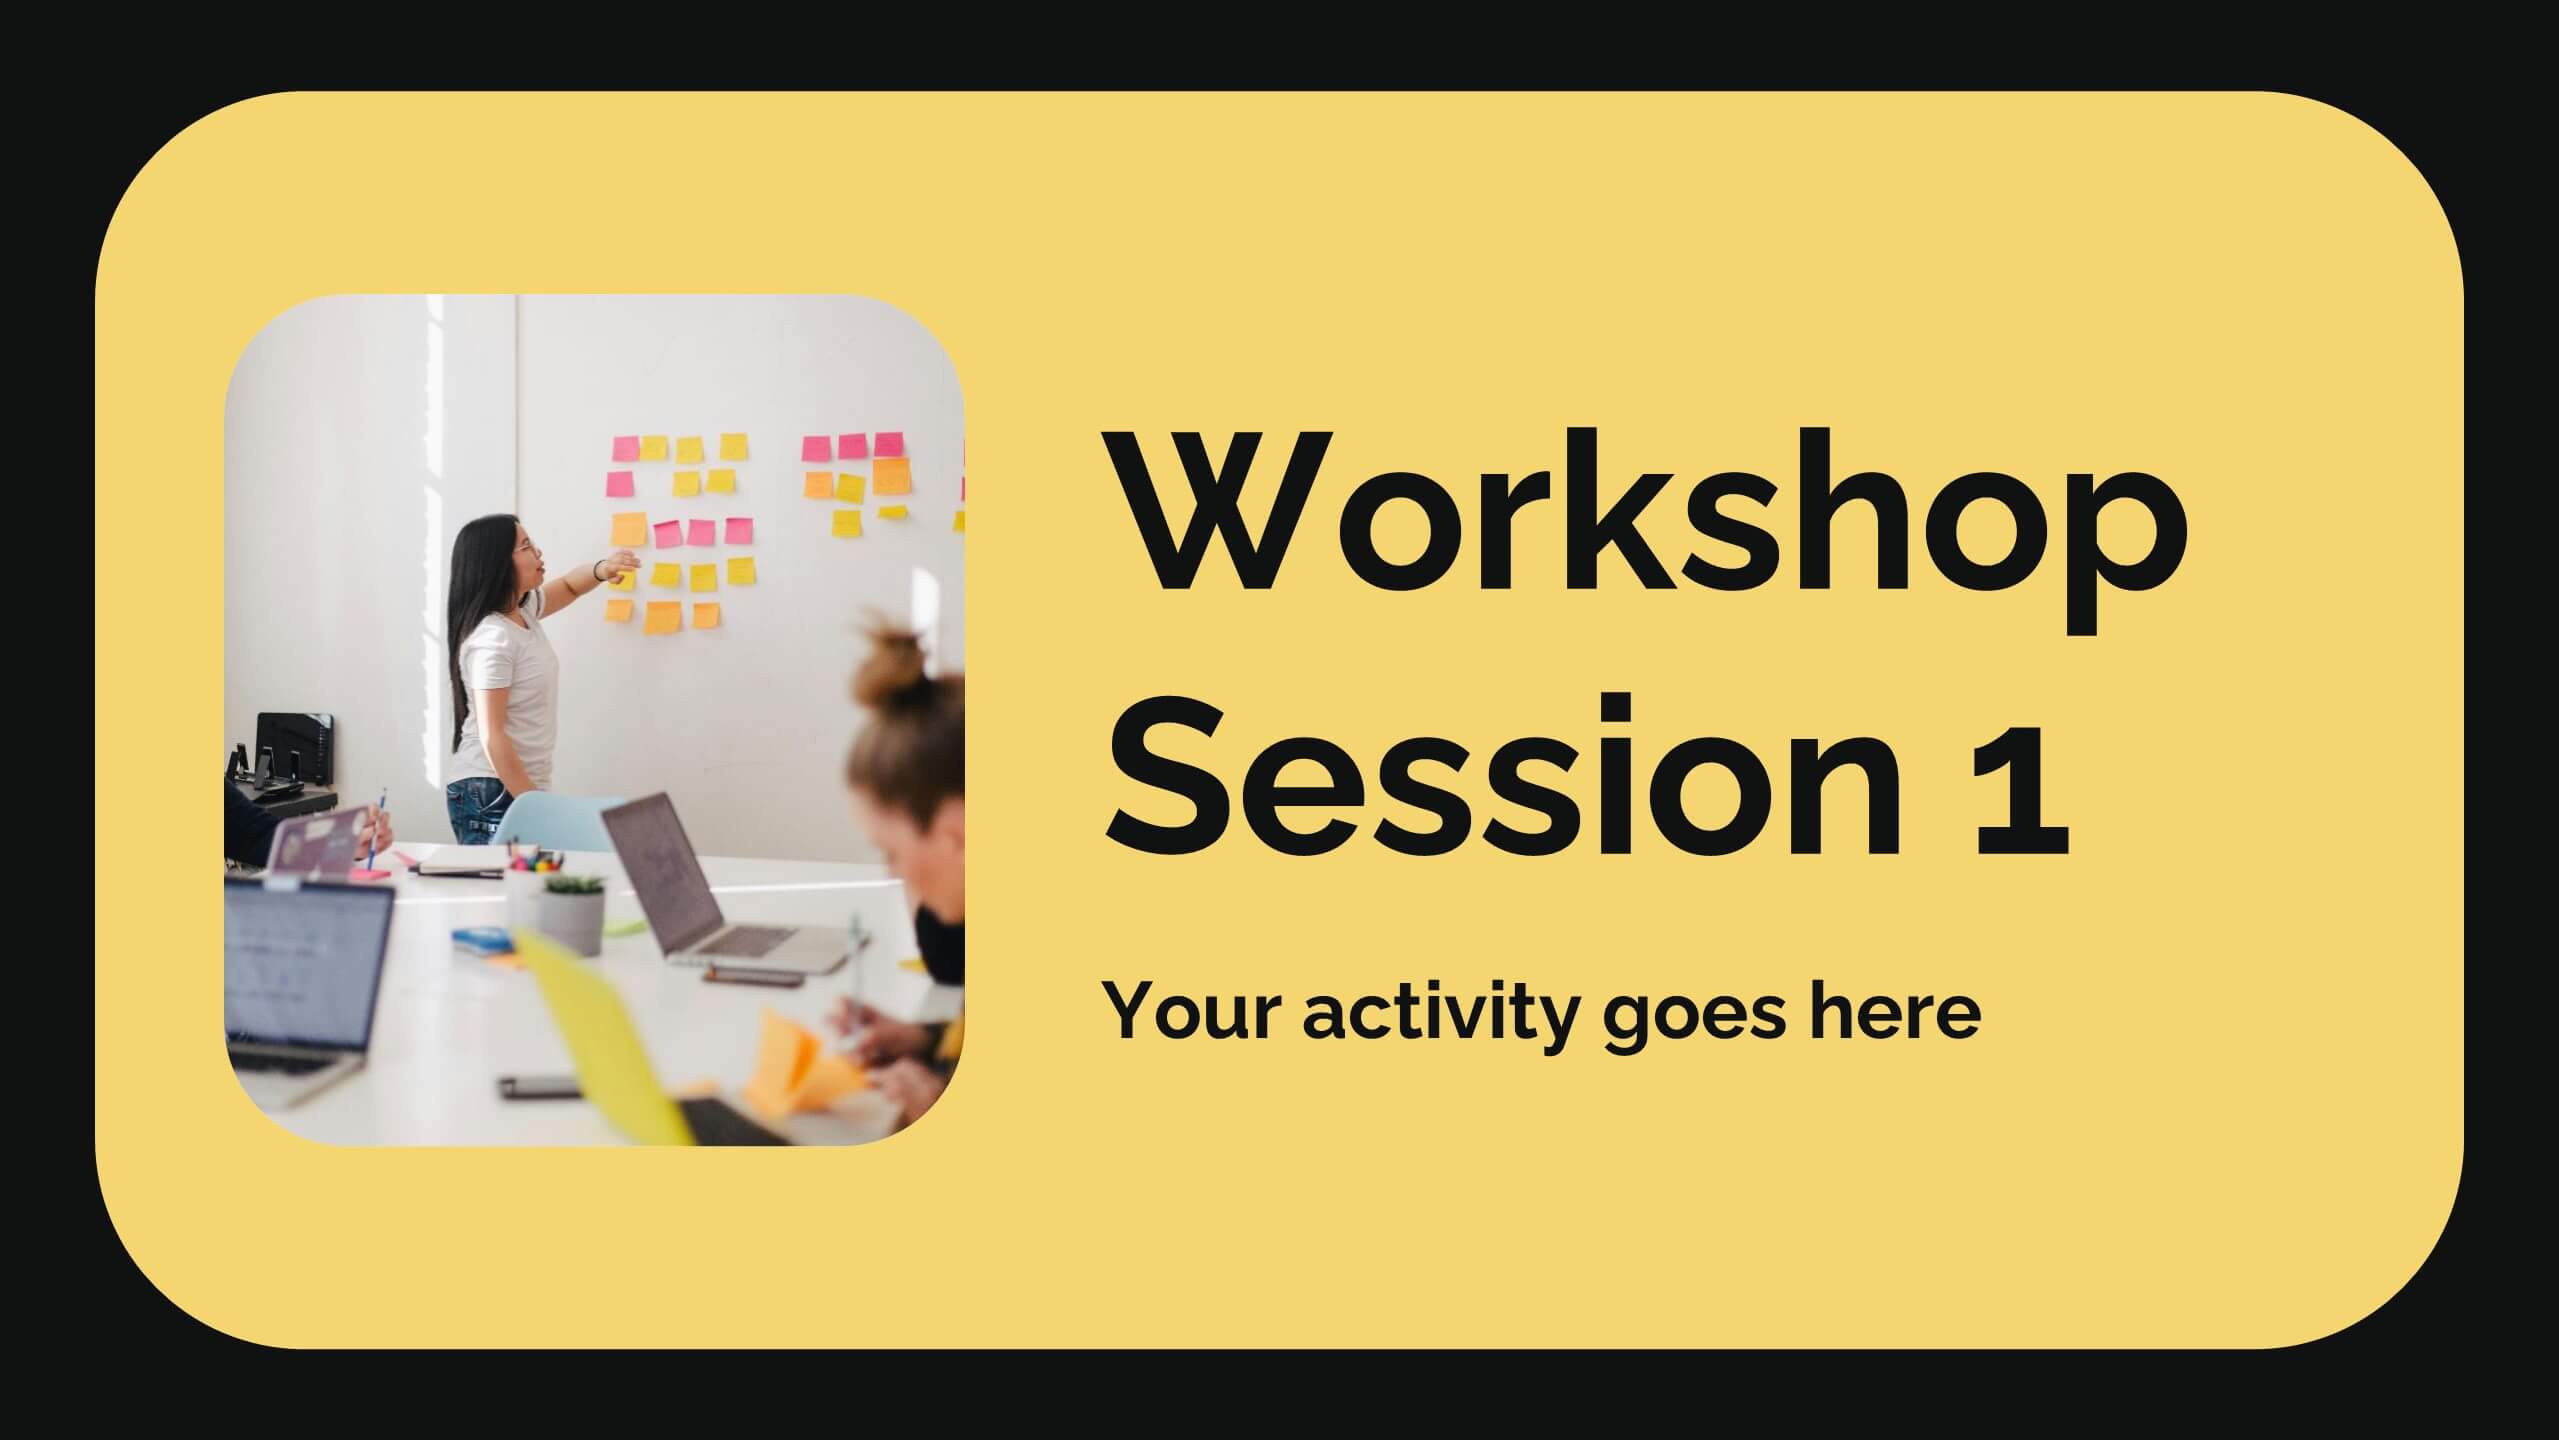
Diamond Business Development Proposal Presentation
Unlock the potential of your business proposals with this bold and engaging presentation template! Perfect for business development pitches, conferences, and workshops, it includes sections for speaker introductions, panel discussions, and session breakdowns. With its clean and professional design, this template ensures clarity and impact. Fully customizable and compatible with PowerPoint, Keynote, and Google Slides.


6 diapositivas
Managing Transition in Business Presentation
Make your next strategy session visually unforgettable with this clean, step-by-step layout. Designed to help explain transitional phases in business, this infographic template simplifies complex change processes into digestible segments. Ideal for professionals presenting transformation strategies. Fully editable and compatible with PowerPoint, Keynote, and Google Slides for easy use.


5 diapositivas
Lean Startup Business Presentation
A fresh, energetic layout brings your ideas to life, making it easy to present streamlined processes and early-stage strategies with clarity. This presentation highlights key steps, insights, and goals in a clean, modern flow designed for fast-moving teams. Fully compatible with PowerPoint, Keynote, and Google Slides.


26 diapositivas
Leyna Presentation Template
Leyna is an elegant and minimalist wedding planner presentation template. This wonderful presentation template will help couples know what all you’ll offer as a wedding planner. We have made it easy for you this this multipurpose template because you will be able to edit easily to make sure it fits what you need. We have built a clean, responsive and modern design for them to have a great experience on what they are looking for in the best way possible. This template provides a professional and clean design for your business or personal use. It's time to impress the potential clients!


5 diapositivas
Oceania Business Opportunities Map Presentation
Unlock growth potential with the Oceania Business Opportunities Map template, crafted to showcase key investment zones and emerging markets across the region. Utilize interactive mapping tools to analyze market viability and sector-specific opportunities effectively. Ideal for businesses looking to expand in Oceania. Compatible with PowerPoint, Keynote, and Google Slides.