


Características


¿Tienes alguna pregunta?
Recomendar


21 diapositivas
Flamelore Agile Project Plan Presentation
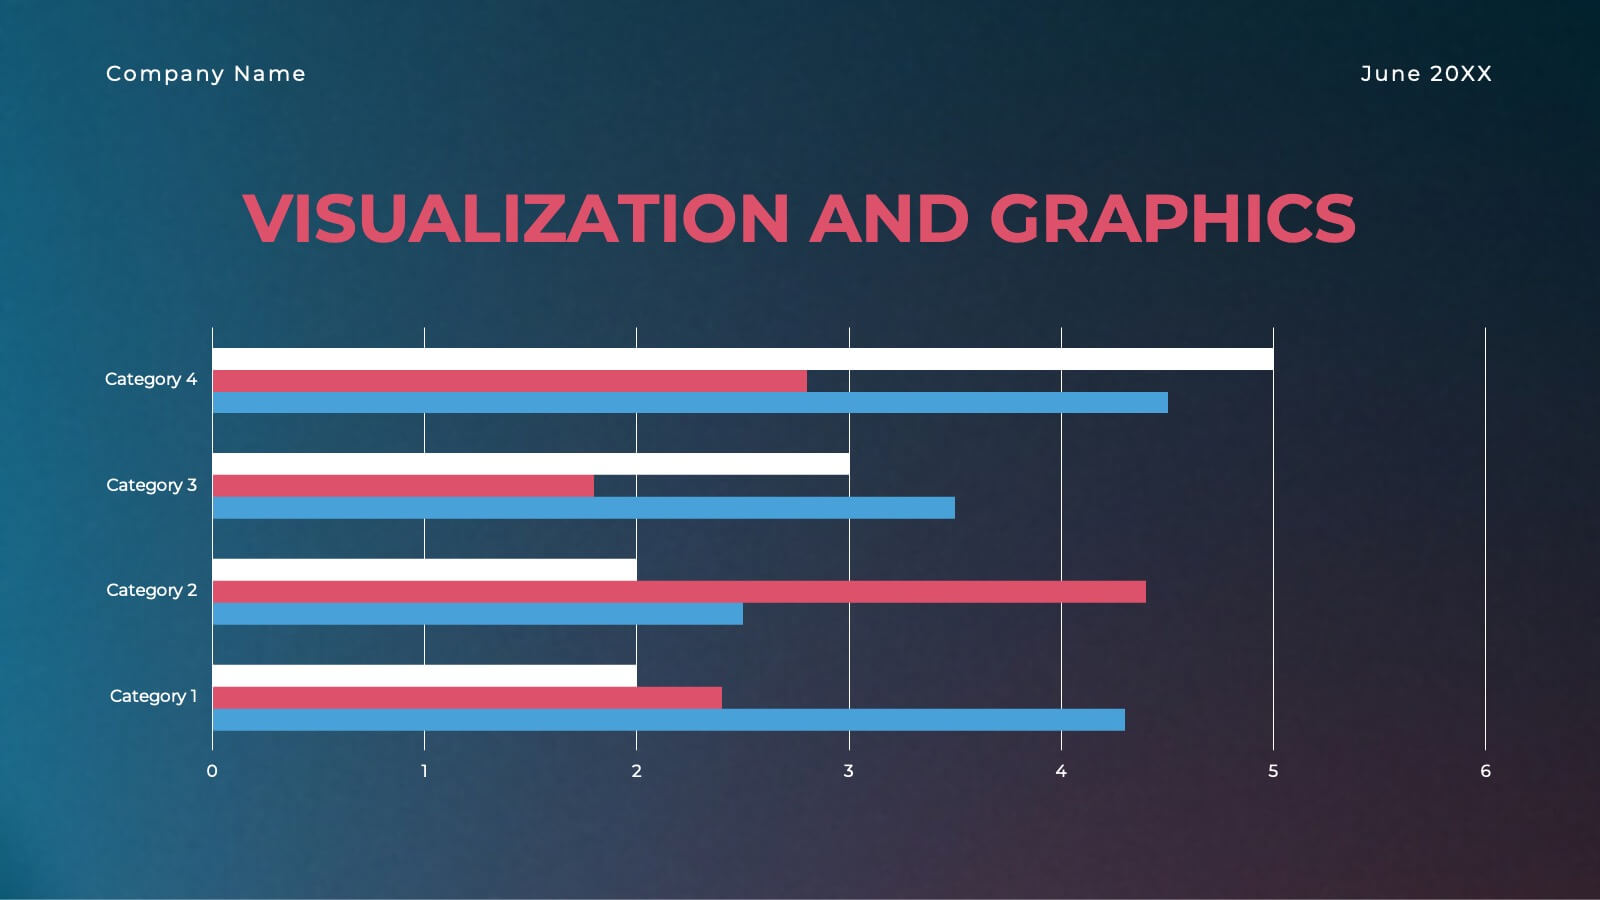
Organize and deliver your Agile Project Plan seamlessly with this dynamic presentation template. Designed to align with Agile principles, it features a comprehensive structure covering objectives, scope of work, and key deliverables. The template helps you outline a detailed project timeline and budget breakdown to keep stakeholders informed. Illustrate complex information with visual aids such as pyramids, charts, and process diagrams, making data interpretation effortless. Highlight team members, their roles, and responsibilities to foster transparency and accountability. With slides dedicated to risk assessment and evaluation criteria, you can confidently navigate potential challenges. This fully editable template works across PowerPoint, Google Slides, and Keynote, providing flexibility and a polished design for project managers, teams, and business professionals. Whether you're pitching to stakeholders or aligning your team, this Agile framework ensures clear communication and actionable steps.


22 diapositivas
Glidebeam Content Marketing Pitch Deck Presentation
Capture your audience’s attention and showcase your marketing strategy with confidence using this polished and thoughtfully designed marketing pitch deck. It covers key elements like company history, target audience, competitive landscape, financial highlights, and growth strategies. Ideal for pitches or meetings, it’s compatible with PowerPoint, Keynote, and Google Slides.


22 diapositivas
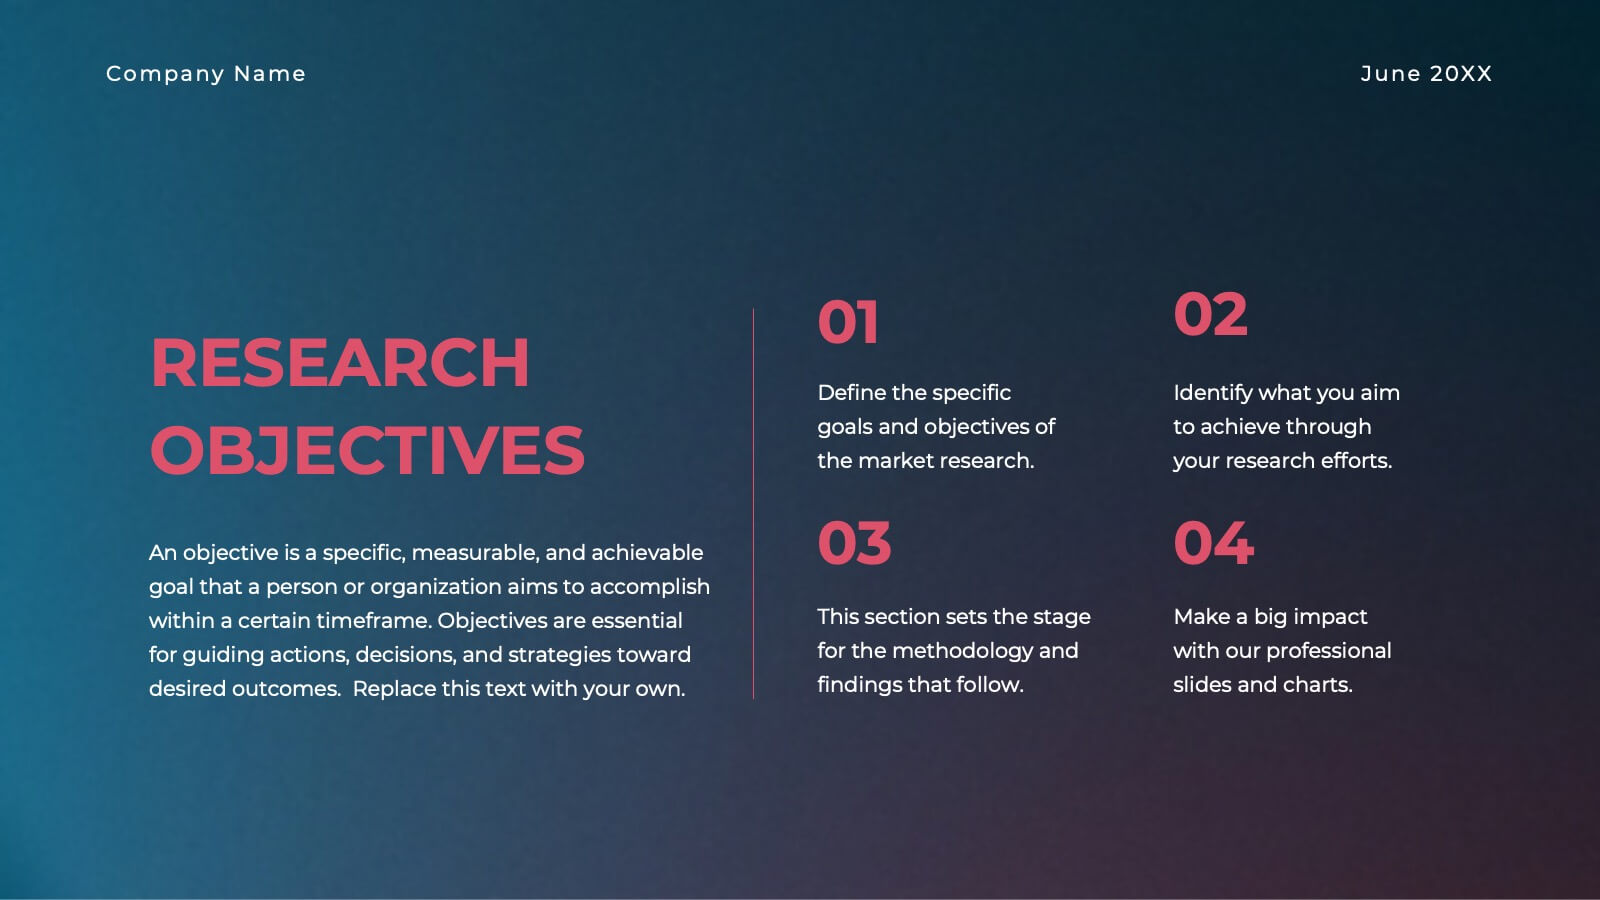
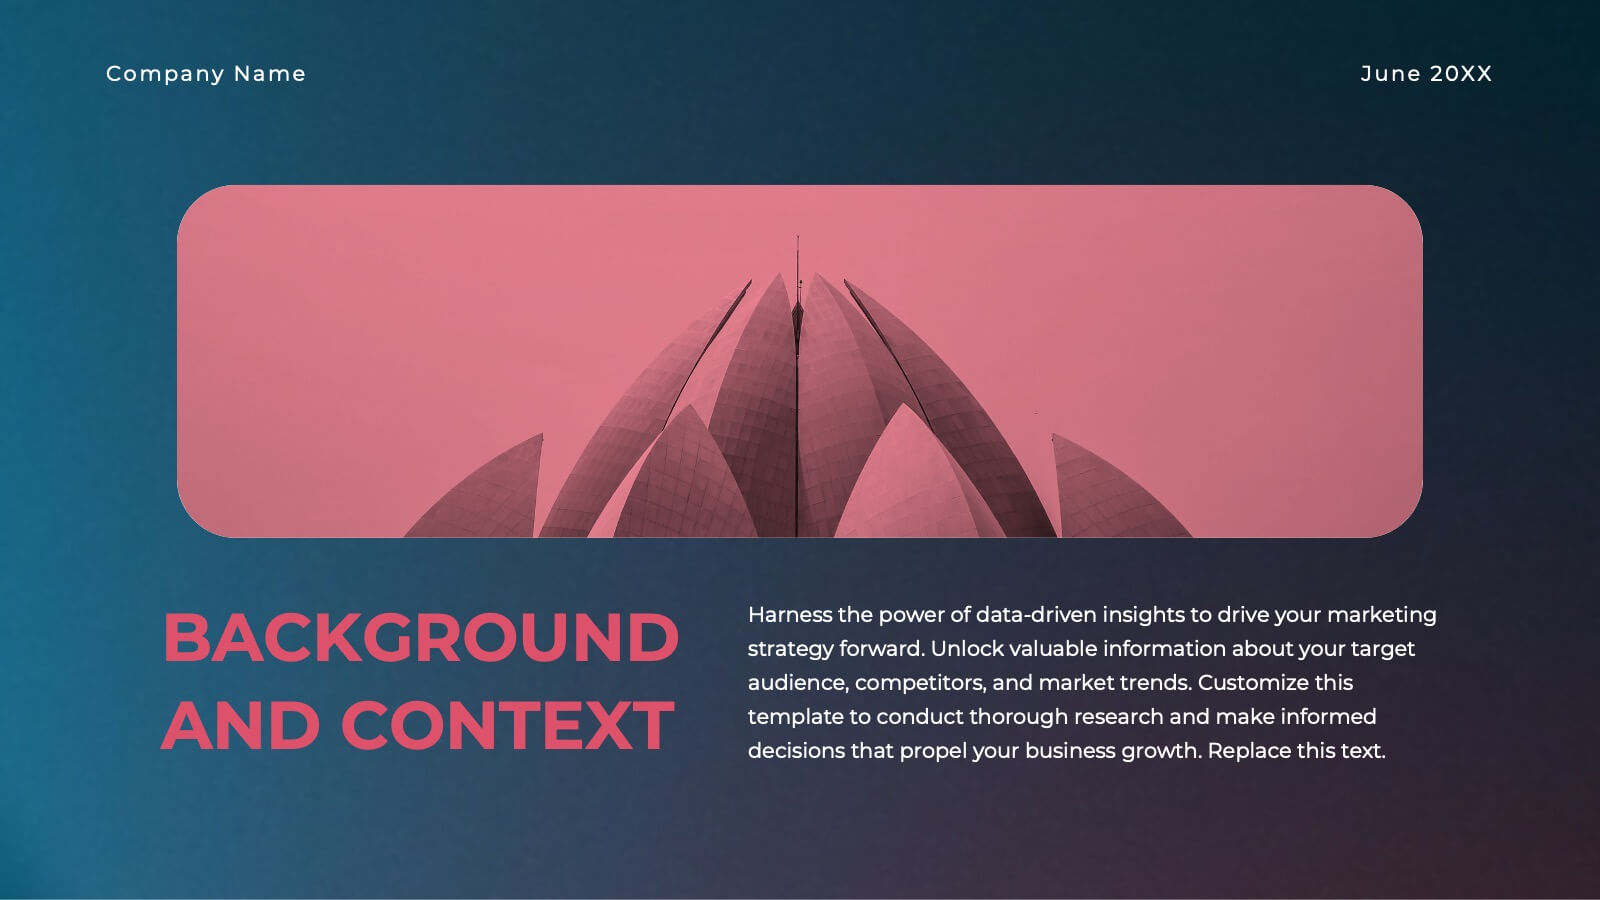
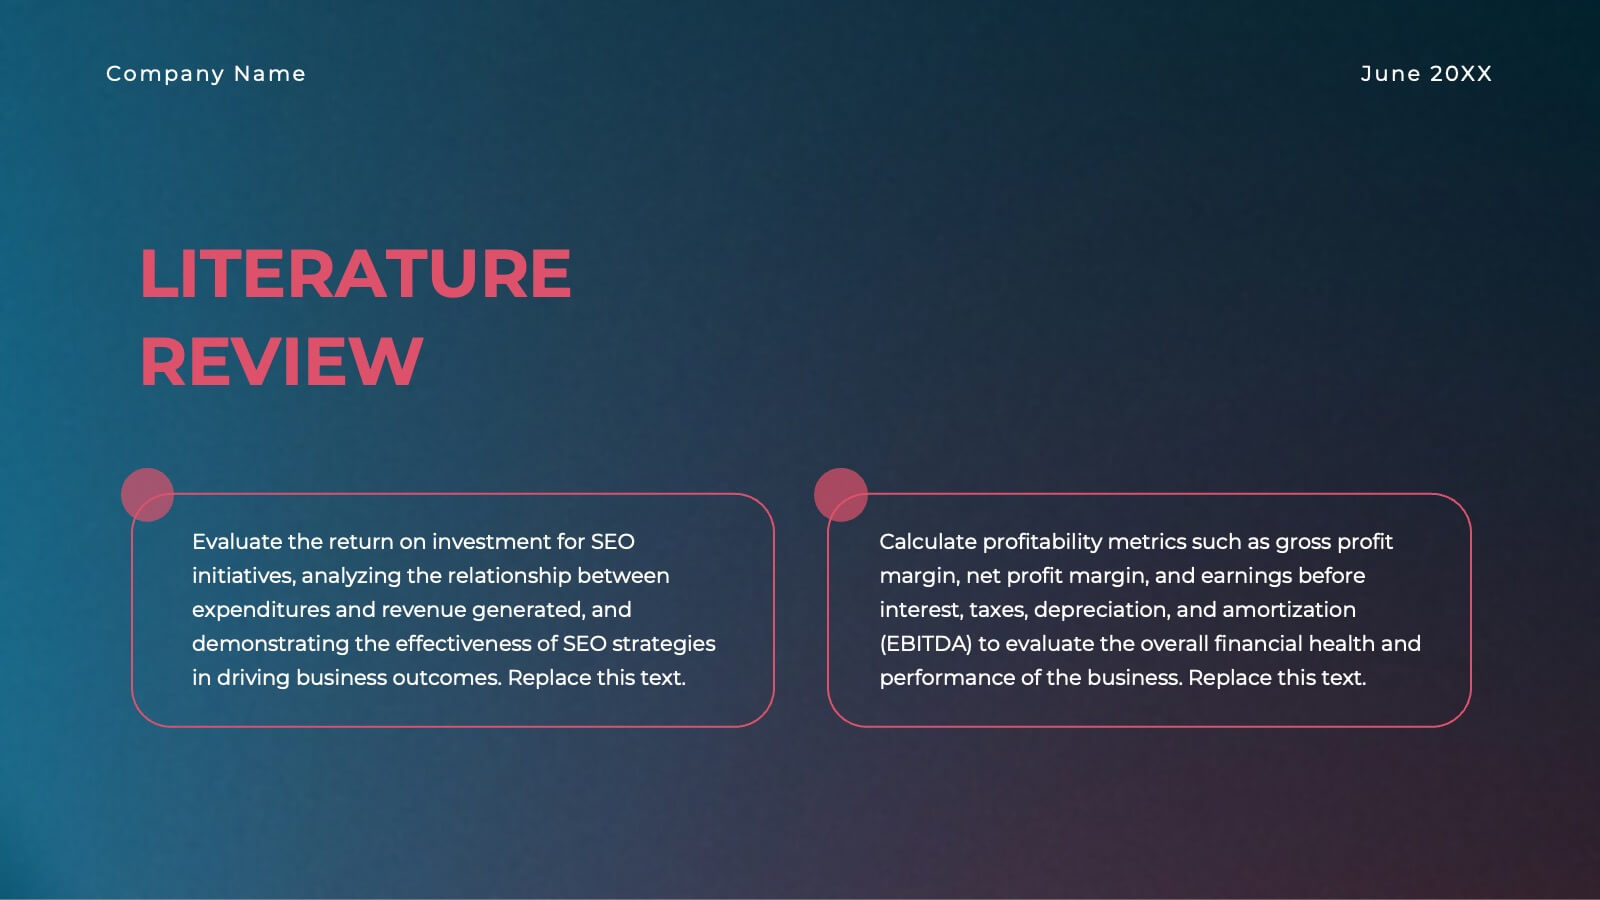
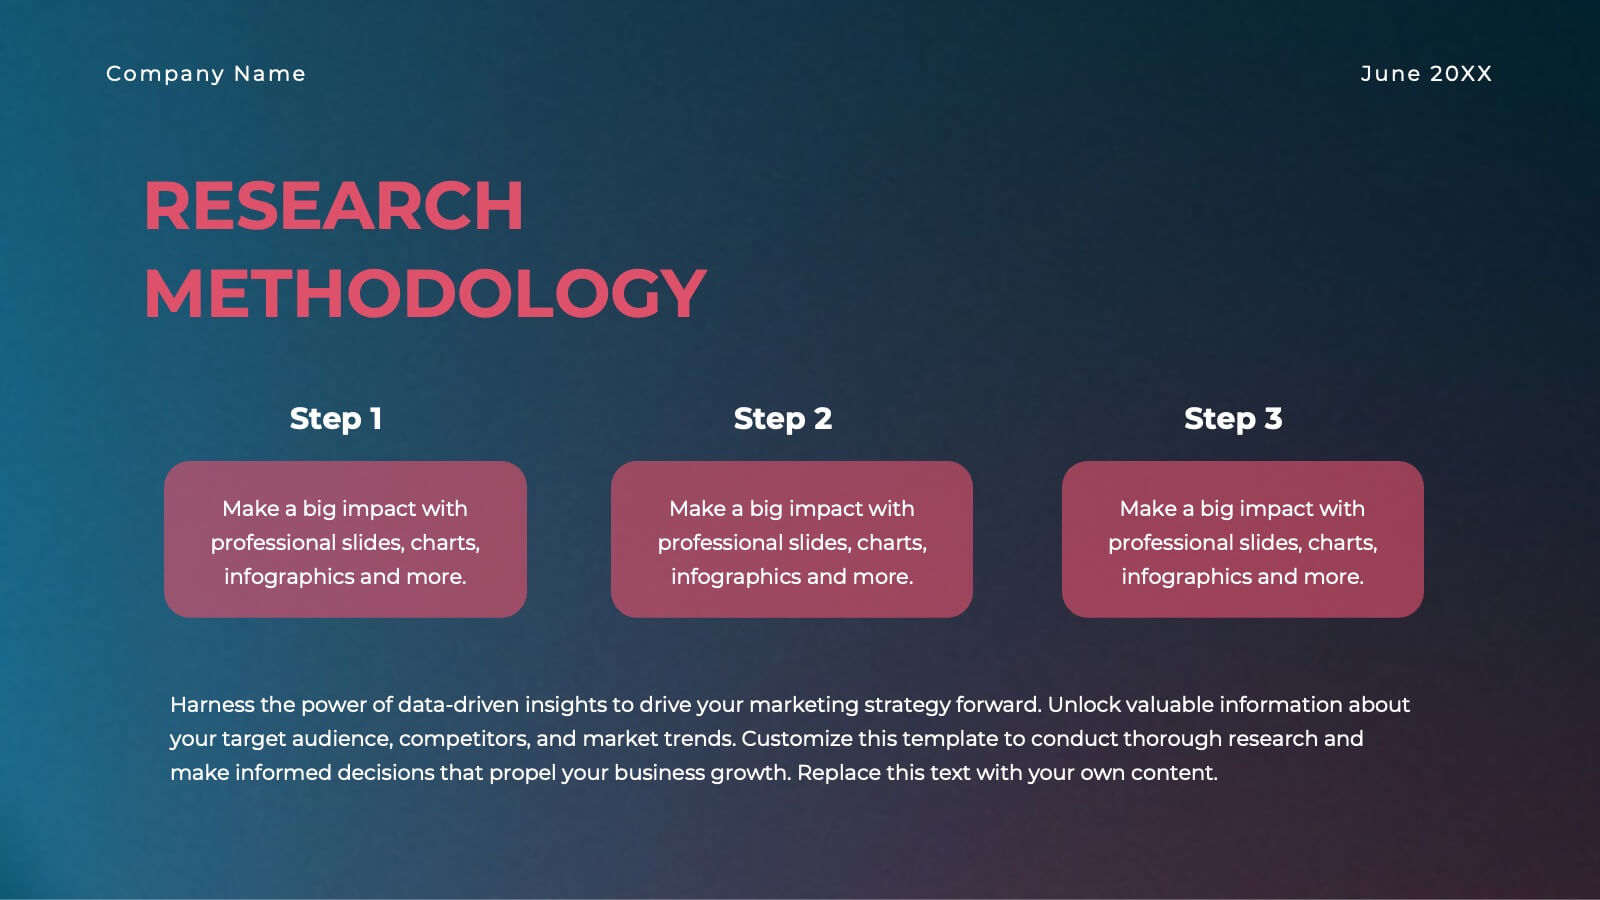
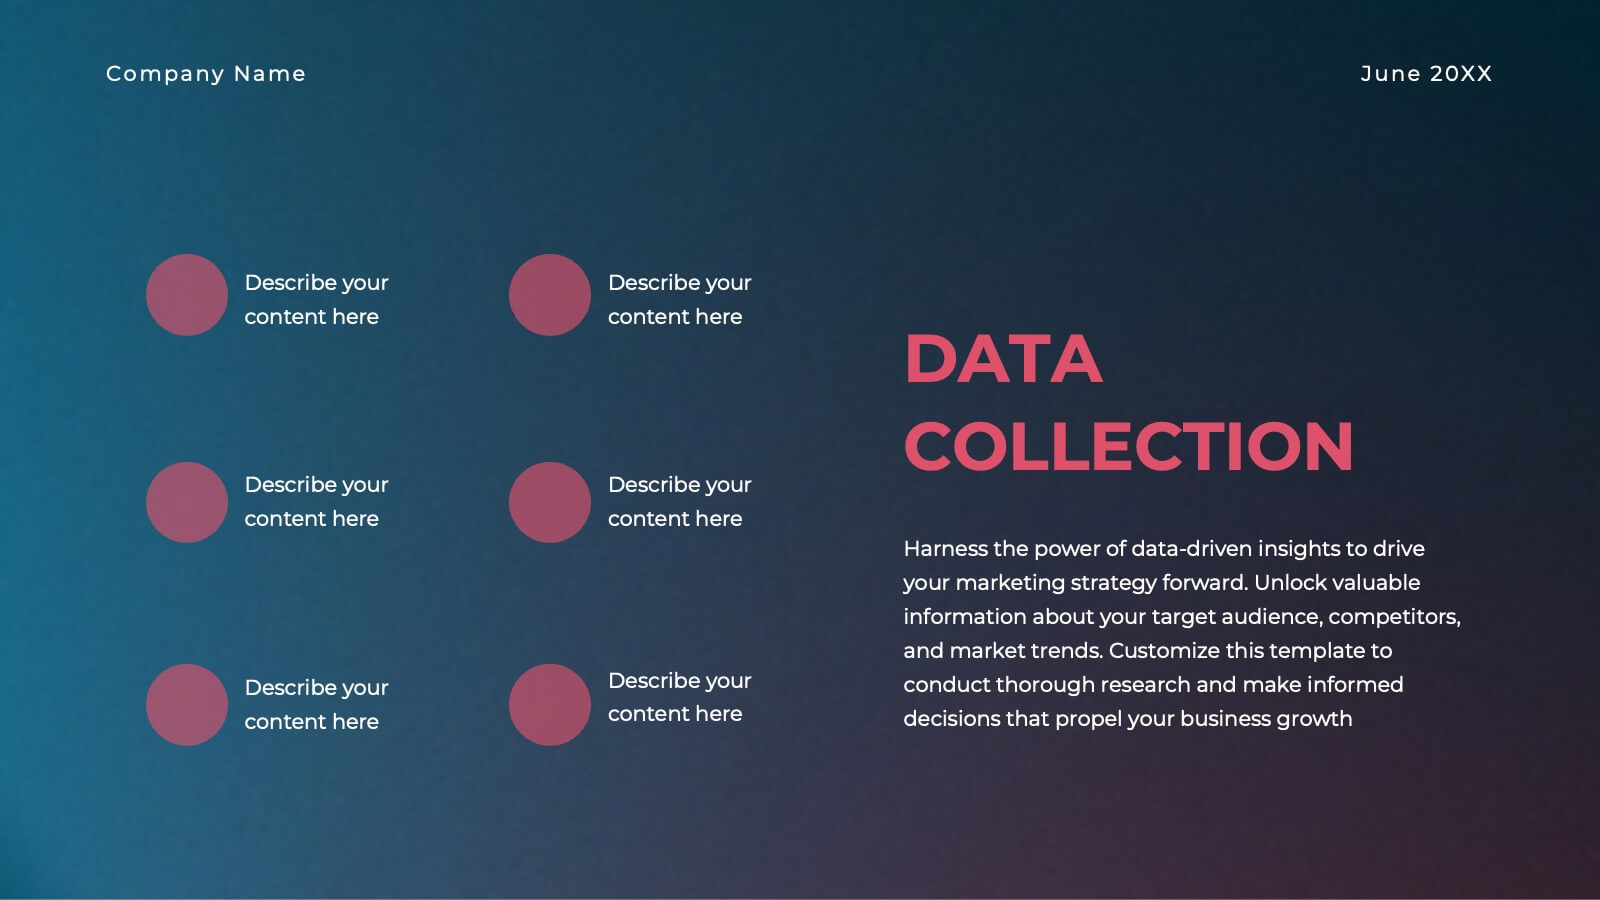
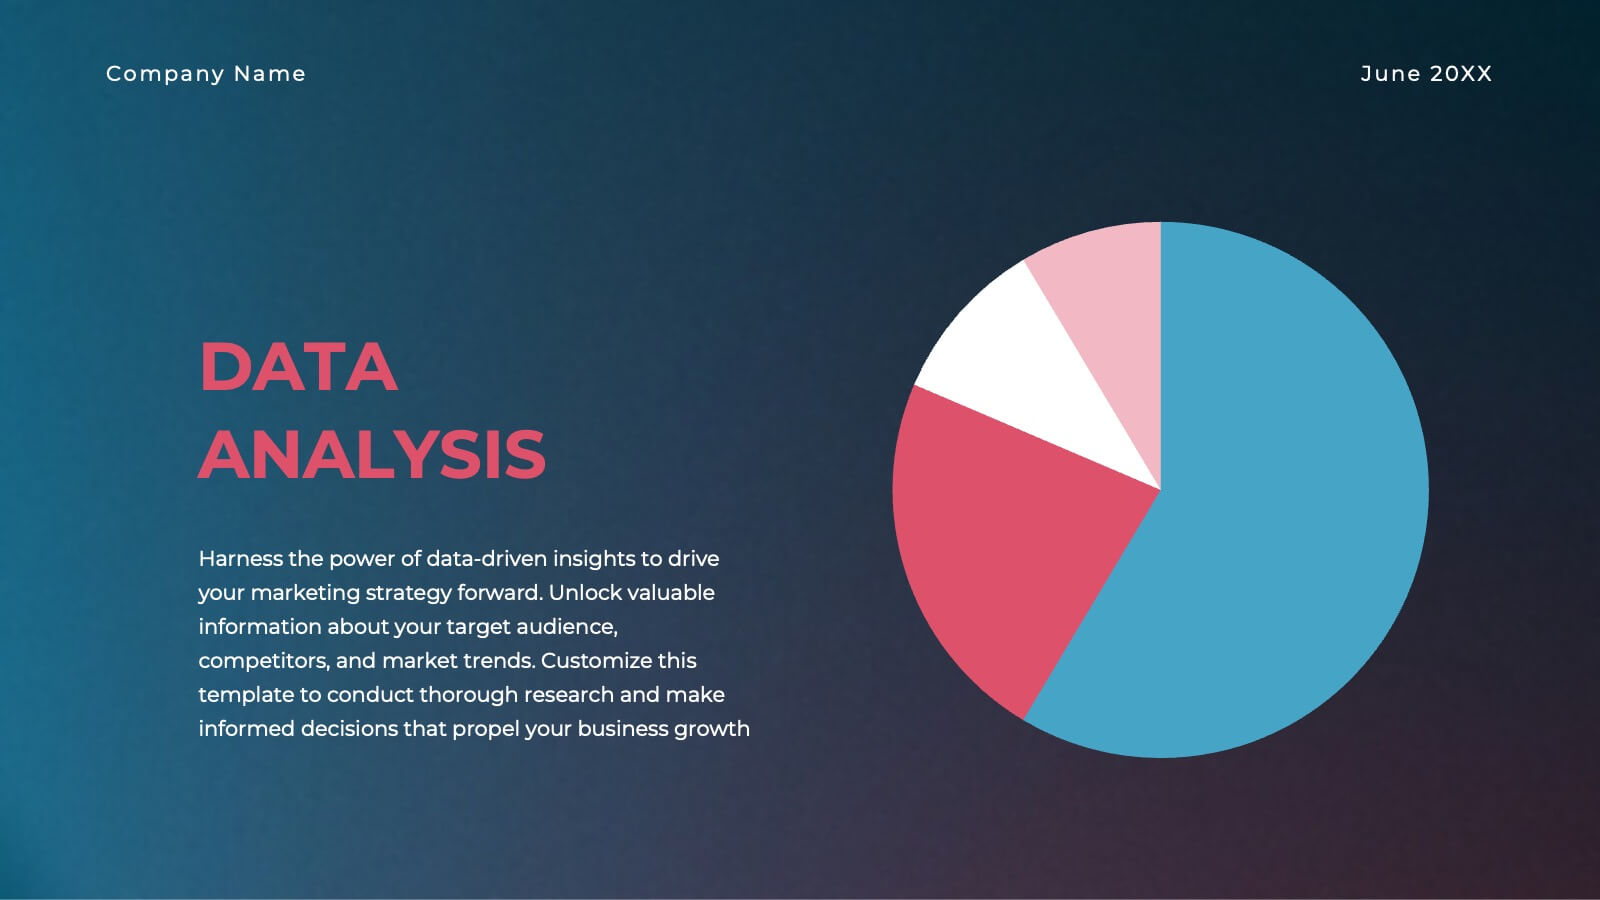
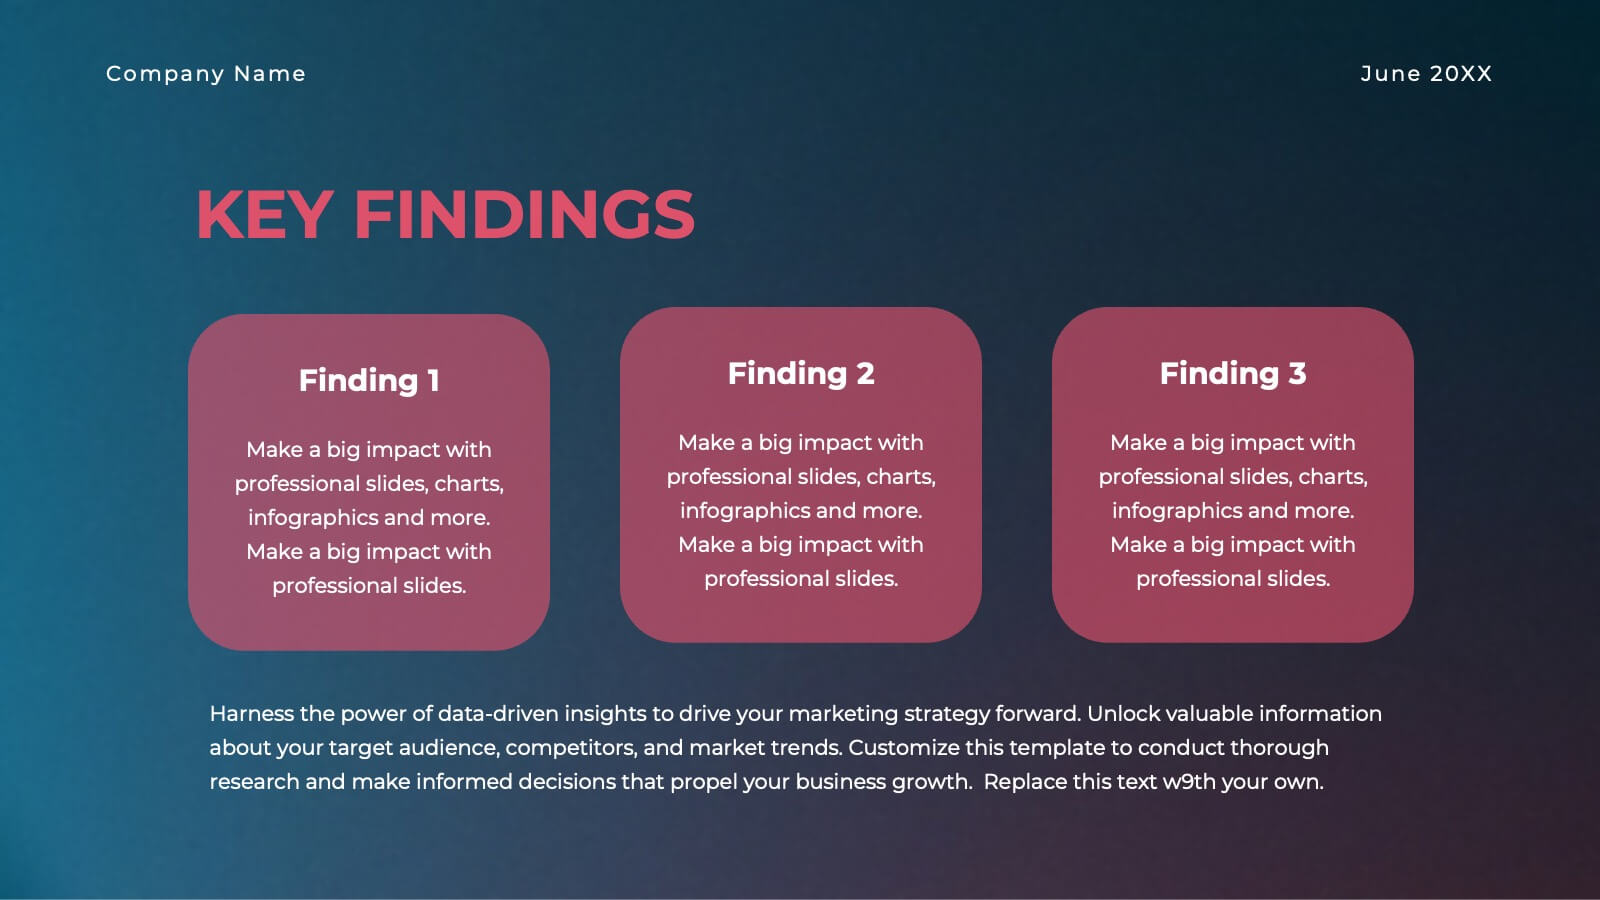
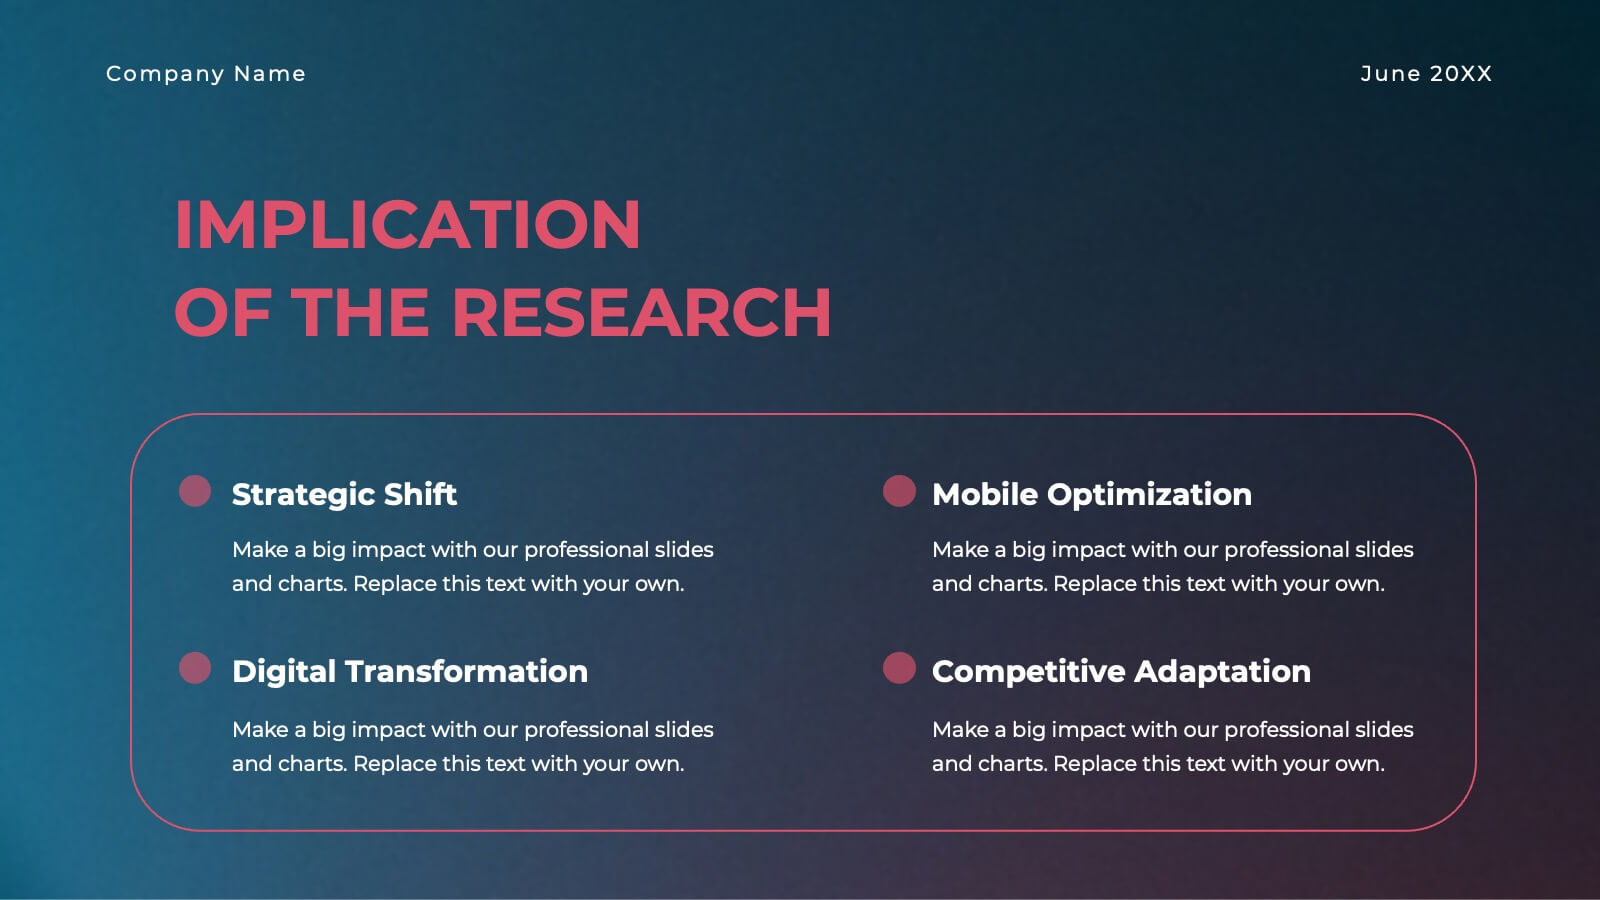
Gold Research Proposal Presentation
Present your research with impact using this sleek and modern research proposal template! Featuring sections for objectives, data collection, analysis, key findings, and recommendations, this template helps organize your research clearly and professionally. Fully customizable and compatible with PowerPoint, Keynote, and Google Slides, it's ideal for any research presentation.


4 diapositivas
Financial Overview Slide Presentation
Kick off your presentation with a clean, modern visual that makes financial insights easy to grasp at a glance. This slide helps you summarize key metrics, compare performance areas, and highlight important business trends in a simple, structured layout. Fully compatible with PowerPoint, Keynote, and Google Slides.


6 diapositivas
Targeted Segment Analysis and Mapping Presentation
Highlight your market focus with the Targeted Segment Analysis and Mapping Presentation. This circular layout is perfect for breaking down five audience segments, using subtle icons and visual emphasis for clarity. Ideal for marketers, strategists, and business analysts presenting niche targeting. Fully editable in Canva, PowerPoint, Keynote, and Google Slides.


10 diapositivas
Financial Dashboard Report Presentation
Stay on top of your financial metrics with the Financial Dashboard Report Presentation. Featuring clean visuals like line charts and icon-labeled KPIs, this layout makes complex data easy to understand. Perfect for monthly reviews, investor updates, or business reports. Fully editable in PowerPoint, Keynote, and Google Slides.


7 diapositivas
Home Office Scenes Infographic
Dive into the intricacies of the home office environment with our office scenes infographic. Rendered in a sophisticated palette of white and dark blue, this infographic offers an insightful visual exploration of today's work-from-home culture. With detailed icons and illustrative graphics, the design brings to life various scenarios and components of a home office. The layout is geared towards offering practical insights to its viewers. This template is perfect for remote work advocates, and any company transitioning to a hybrid work model. Compatible with PowerPoint, Keynote, and Google Slides this ensures seamless integration into your presentations.


7 diapositivas
Population United States Map Infographic Presentation
The United States is located in North America and is comprised of 50 states and the District of Columbia. This template is a stylish and attractive way to showcase your data on a map. It is compatible with Powerpoint, Keynote and Google Slides, making it easily customized and adjusted according to your needs, and for different presentations or reports. This United States Map is the perfect visual for presentations on geography, history, and political science! There are various icons where you can input your data, and statistics. This template can be used for your next map project!


26 diapositivas
Remote Work Best Practices Creative Presentation
Navigate the world of telecommuting with our Remote Work Best Practices presentation template, available for Powerpoint, Google Slides, and Keynote. This template is specially designed for the modern remote work environment, incorporating a blend of professional and engaging visuals that reflect the flexibility and innovation of working from home. The template features customizable slides for outlining communication tools, scheduling, and mental health tips. Whether you're onboarding new staff or refining your company's remote policies, this template will help you present a comprehensive guide to succeeding in the remote work landscape.


5 diapositivas
Space Race Infographics
The Space Race refers to the competition between the United States and the Soviet Union during the Cold War era to achieve milestones in space exploration and technology. These vertical infographics are informative resources that explore the historic space race. They are designed to present key facts, milestones, and achievements of this significant period in space exploration history. The template features a captivating design with space-themed visuals, cosmic colors, and modern typography. The visuals are carefully selected to depict iconic spacecraft, astronauts, celestial bodies, and other relevant elements, creating an immersive infographic experience.


5 diapositivas
Modern Design with Geometric Elements Presentation
Elevate your message with this clean, modern layout featuring four-leaf geometric icons and subtle color accents. Perfect for showcasing strategic concepts or business pillars in a stylish, easy-to-read format. Ideal for proposals, updates, or team presentations. Fully editable in PowerPoint, Google Slides, Keynote, and Canva. Professional and versatile.


26 diapositivas
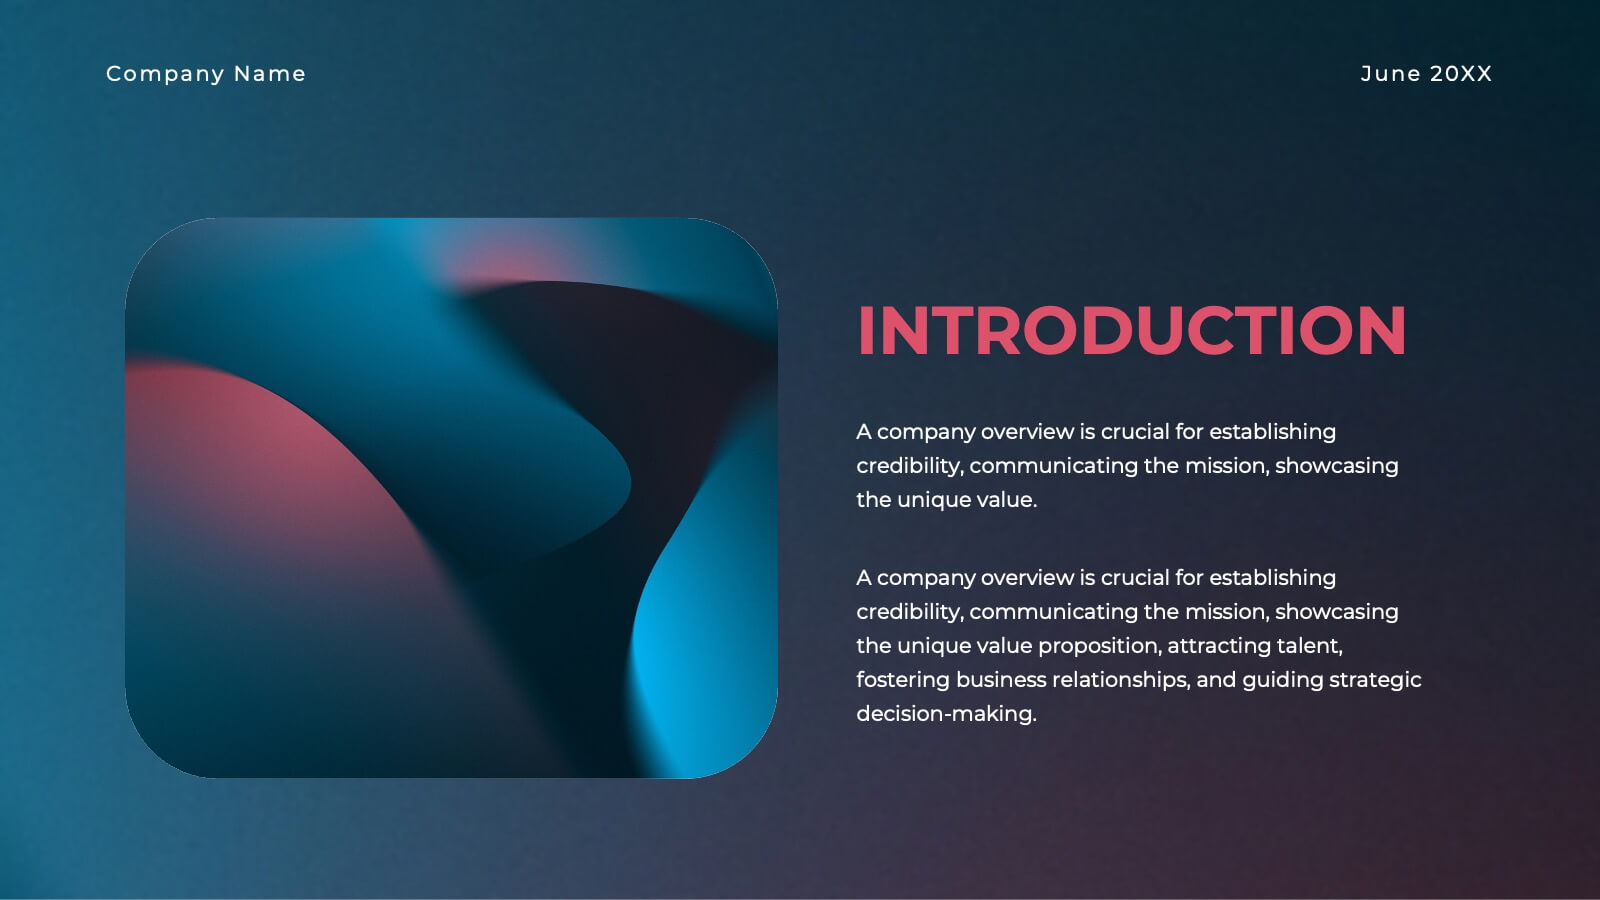
Modern Company Profile Striped Presentation
Present your company with style, our modern company profile presentation, is the perfect template to showcase your business in a contemporary and stylish way. This template combines professionalism with a touch of flair and striped elements, making it ideal for modern businesses looking to make a lasting impression. Ideal for tech startups, creative agencies, or a professional service firms, this presentation will help you convey your company's professionalism. Fully customizable and compatible with Powerpoint, Keynote, and Google Slides. This makes it easy for potential clients, partners, and investors to reach out!


8 diapositivas
Legal Framework for Corporations
Visualize corporate compliance and governance structures with this balanced legal framework slide. Featuring a scale diagram with adjustable sections, it’s perfect for explaining regulations, policies, and corporate ethics. Ideal for law firms, corporate teams, and compliance officers. Fully editable and compatible with PowerPoint, Keynote, and Google Slides.


6 diapositivas
Alphabet Learning Presentation
Make learning fun and engaging with this alphabet learning presentation template! Designed with vibrant visuals and a structured layout, this template helps educators, parents, and trainers introduce letters effectively. Perfect for early childhood education, homeschooling, and interactive lessons. Fully customizable and compatible with PowerPoint, Keynote, and Google Slides.


6 diapositivas
External Business Factors PESTEL Model Presentation
Present your strategic analysis with clarity using this External Business Factors PESTEL Model Presentation. Designed to break down Political, Economic, Social, Technological, Environmental, and Legal influences, this layout helps convey complex macro-environmental insights in a simple, color-coded visual format. Ideal for consultants, business analysts, and corporate strategists. Fully editable in PowerPoint, Keynote, and Google Slides.


5 diapositivas
Fishbone Diagram for Root Cause Analysis Presentation
Identify and Solve Business Problems with Precision using this Fishbone Diagram for Root Cause Analysis presentation template. Designed to visually map out potential causes, this template enhances problem-solving, decision-making, and process improvement. Featuring a clear fishbone structure, customizable icons, and text placeholders, this template is perfect for business analysts, strategists, and operations teams. Fully editable and compatible with PowerPoint, Keynote, and Google Slides, ensuring a seamless and professional presentation experience.


5 diapositivas
Editable RACI Chart Presentation
Streamline your team’s responsibilities with this clean and easy-to-use RACI chart template! Perfect for project managers, this presentation helps define who is Responsible, Accountable, Consulted, and Informed for each task. Simplify workflows, boost collaboration, and keep everyone aligned. Fully editable and compatible with PowerPoint, Keynote, and Google Slides for seamless customization.