


Características


¿Tienes alguna pregunta?
Recomendar


6 diapositivas
Technology Trends Overview Presentation
Step into the future with a sleek visual that maps out emerging ideas in a way anyone can follow. This presentation helps you break down key innovations, highlight major shifts, and explain how new technologies influence your strategy. Ideal for reports and trend discussions. Fully compatible with PowerPoint, Keynote, and Google Slides.


21 diapositivas
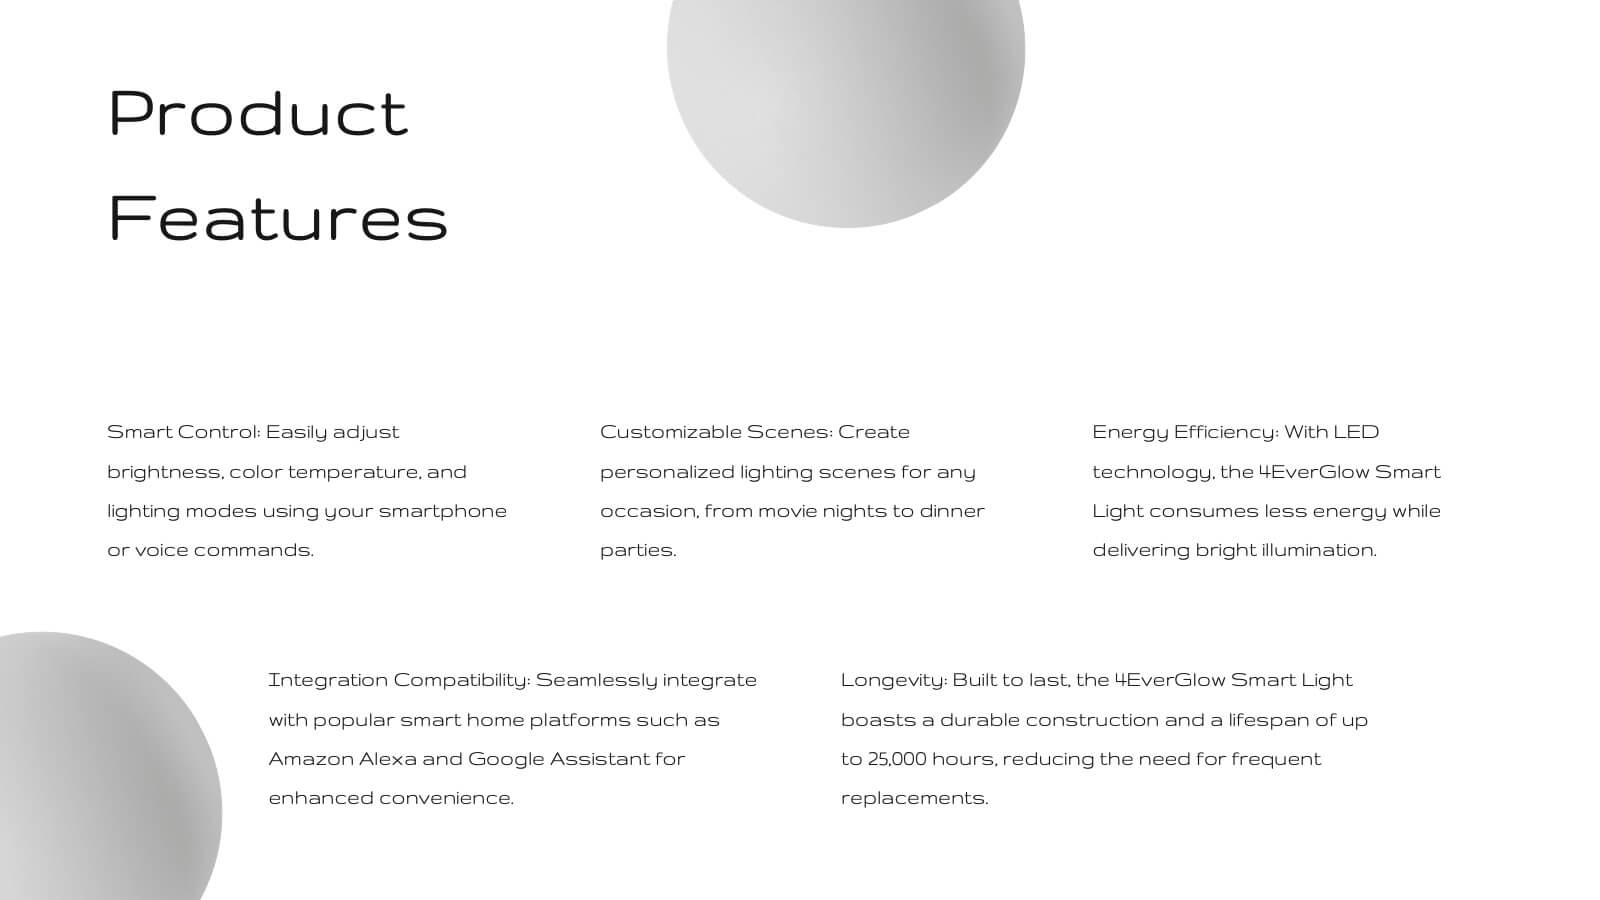
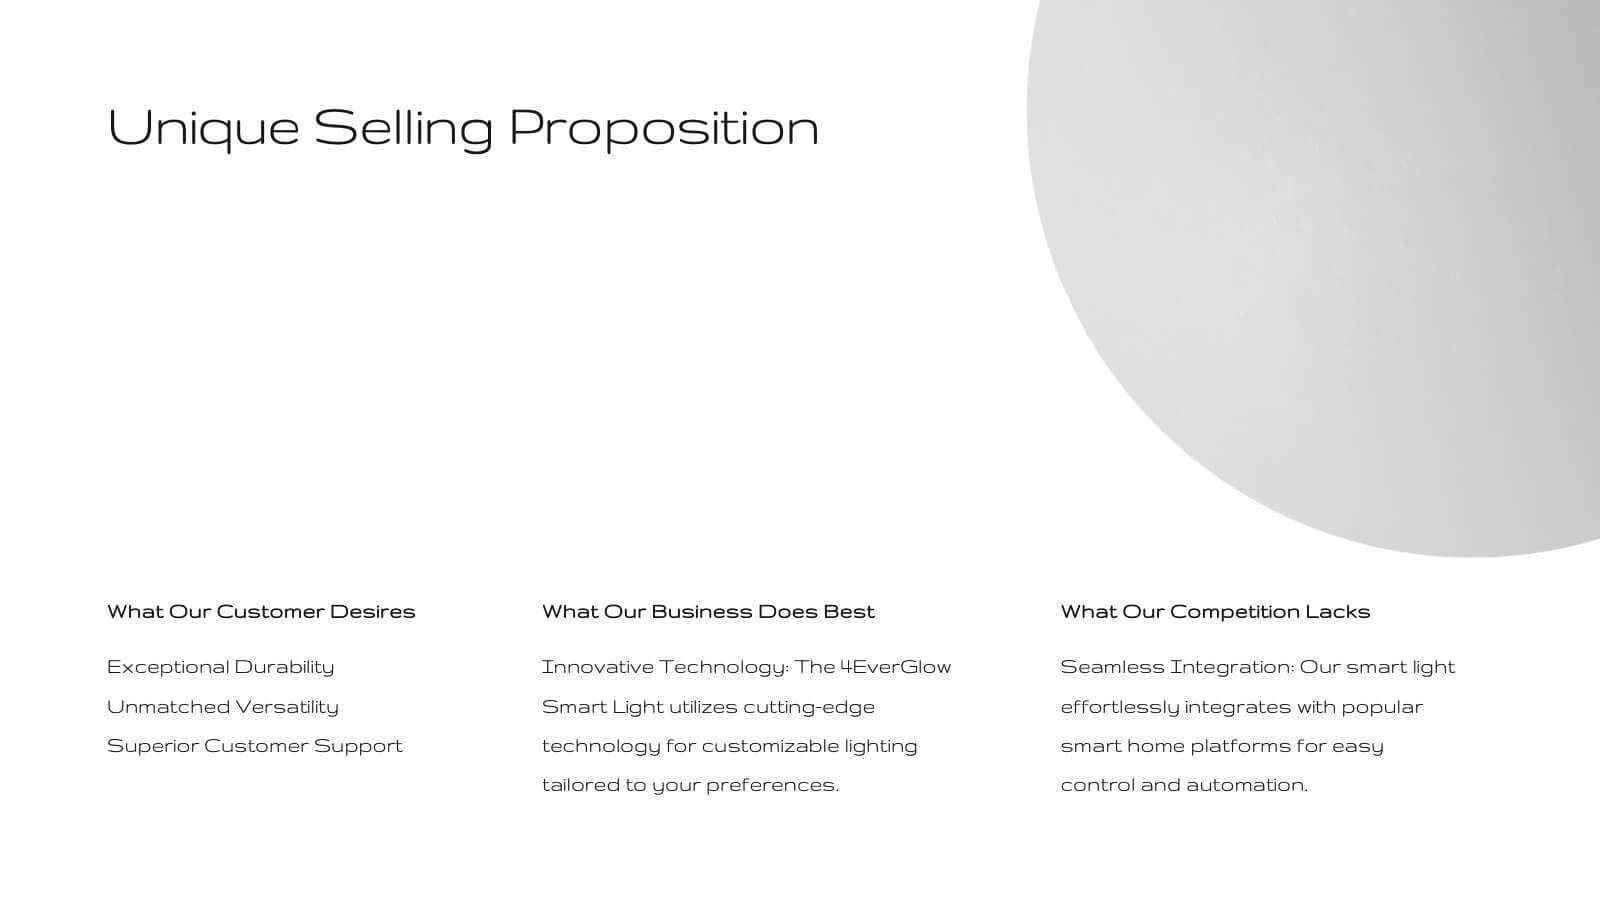
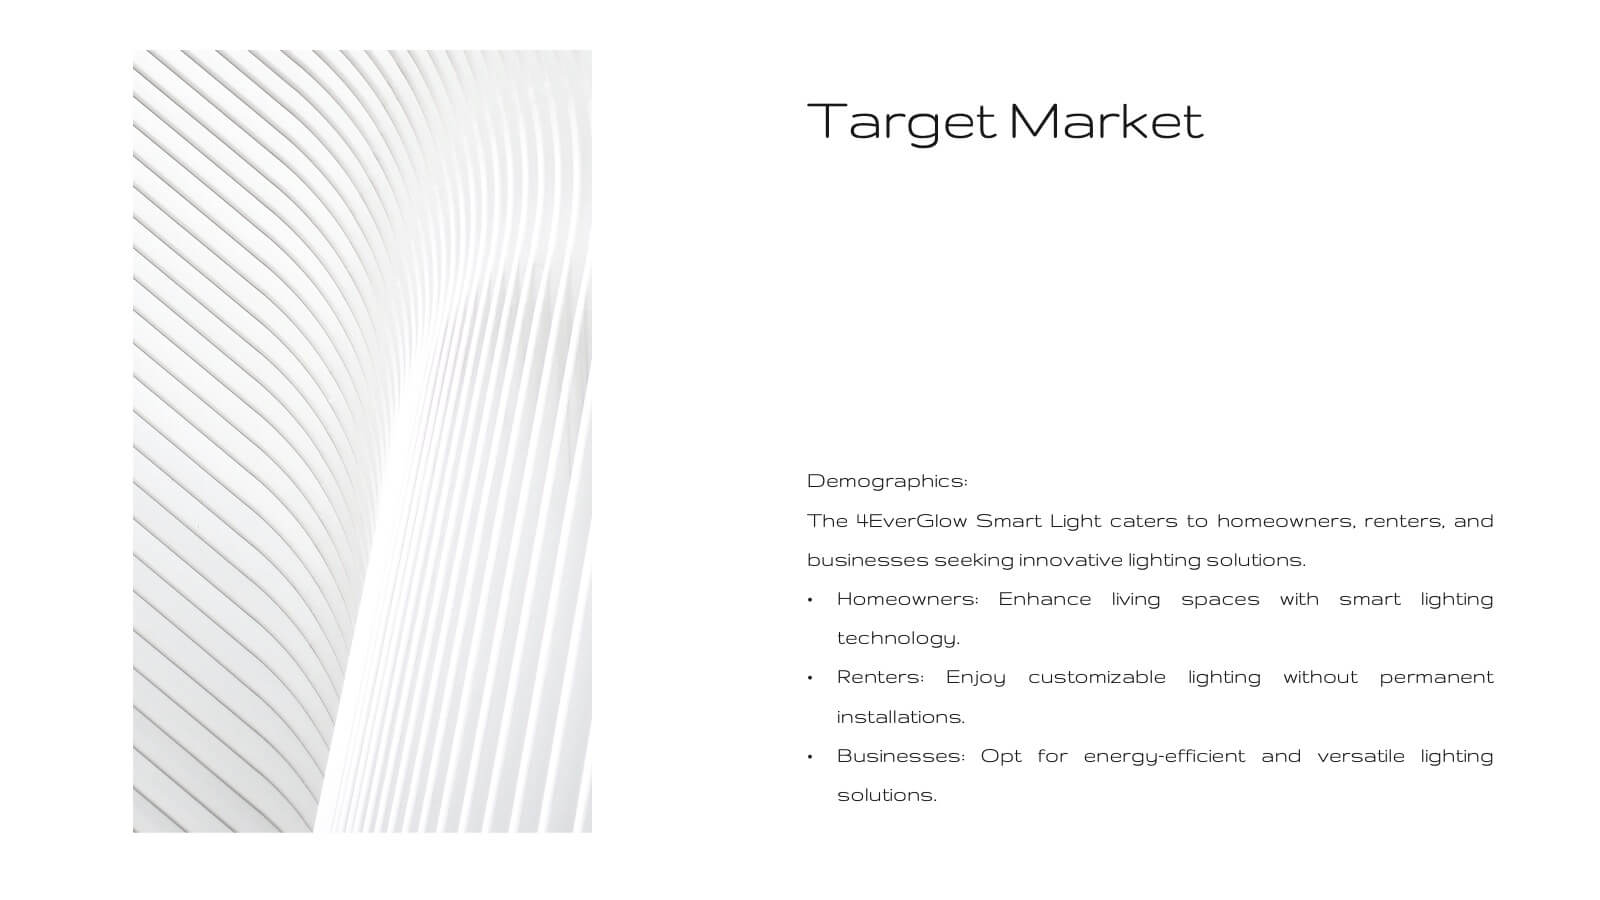
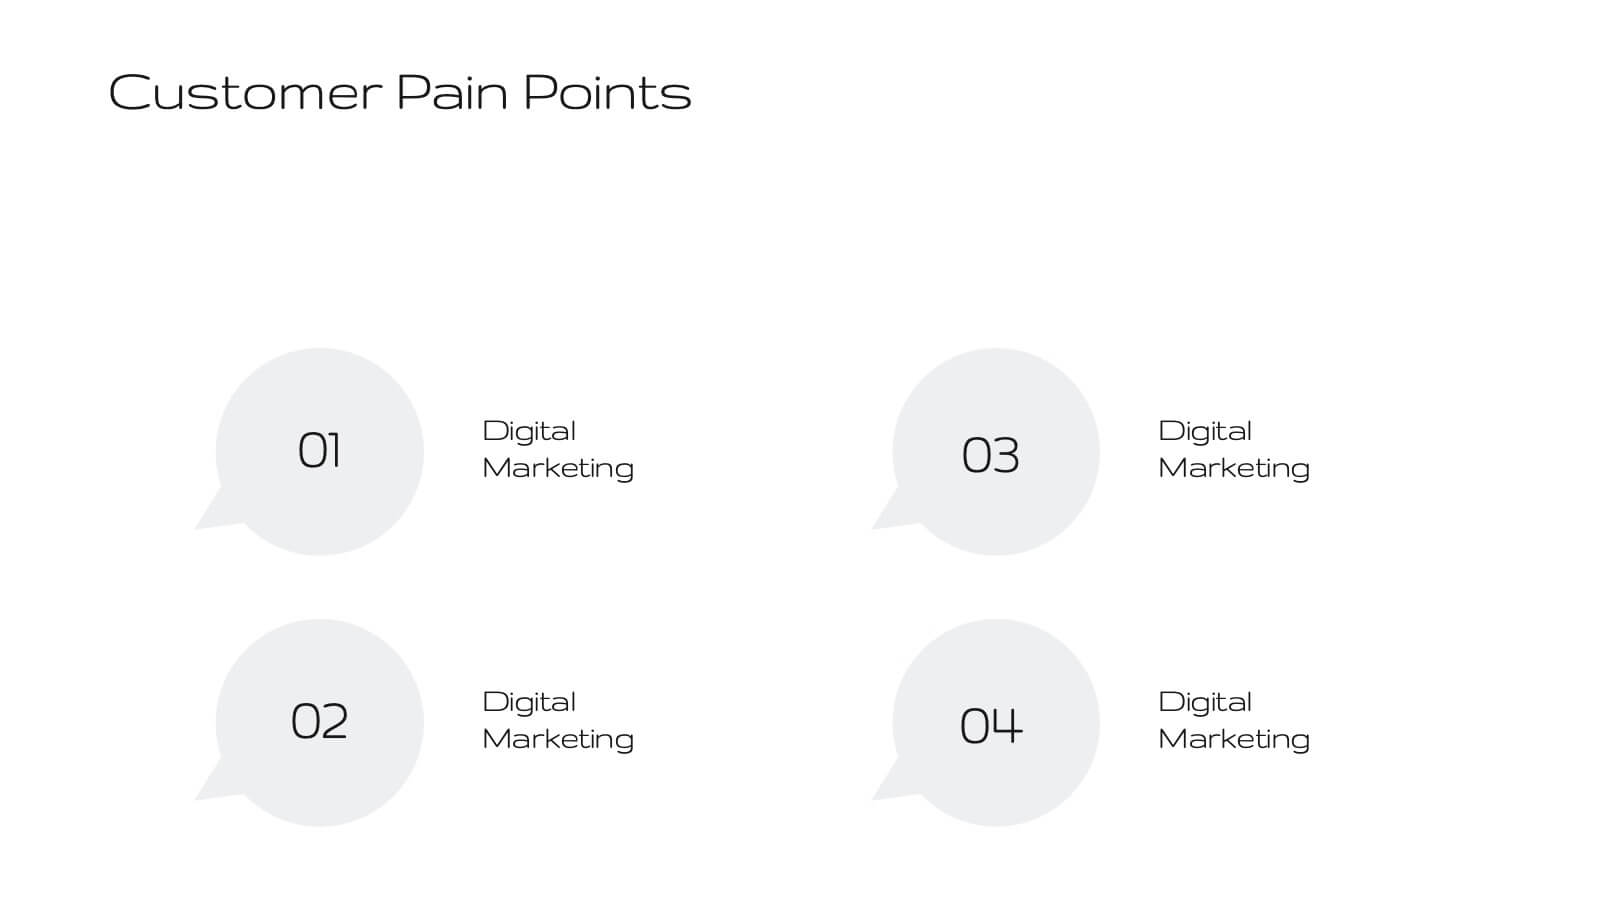
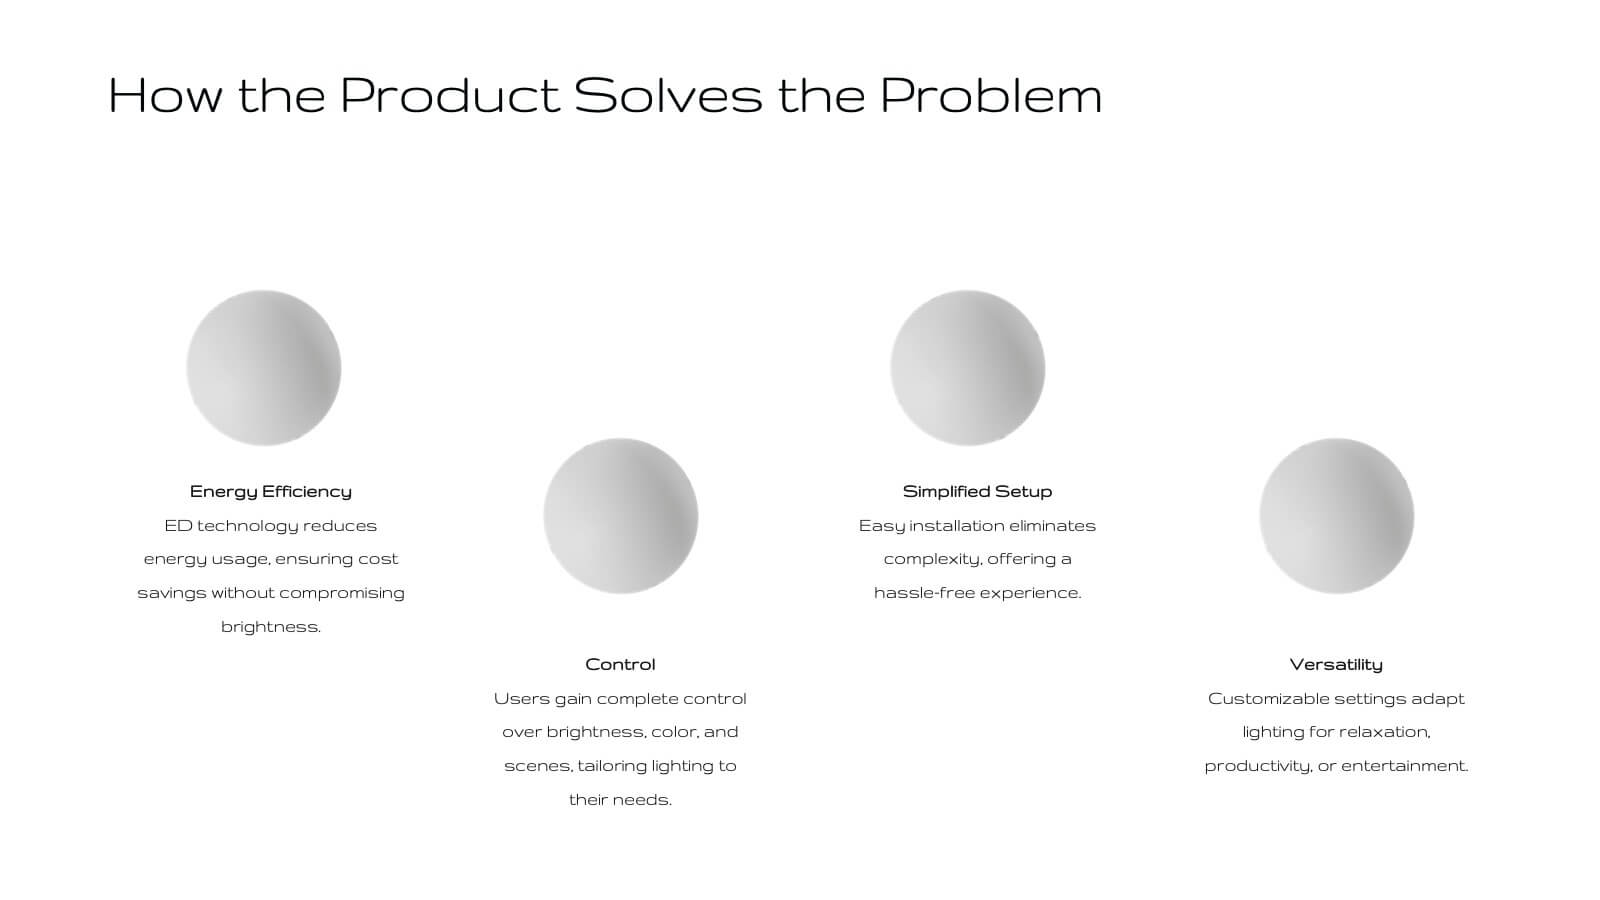
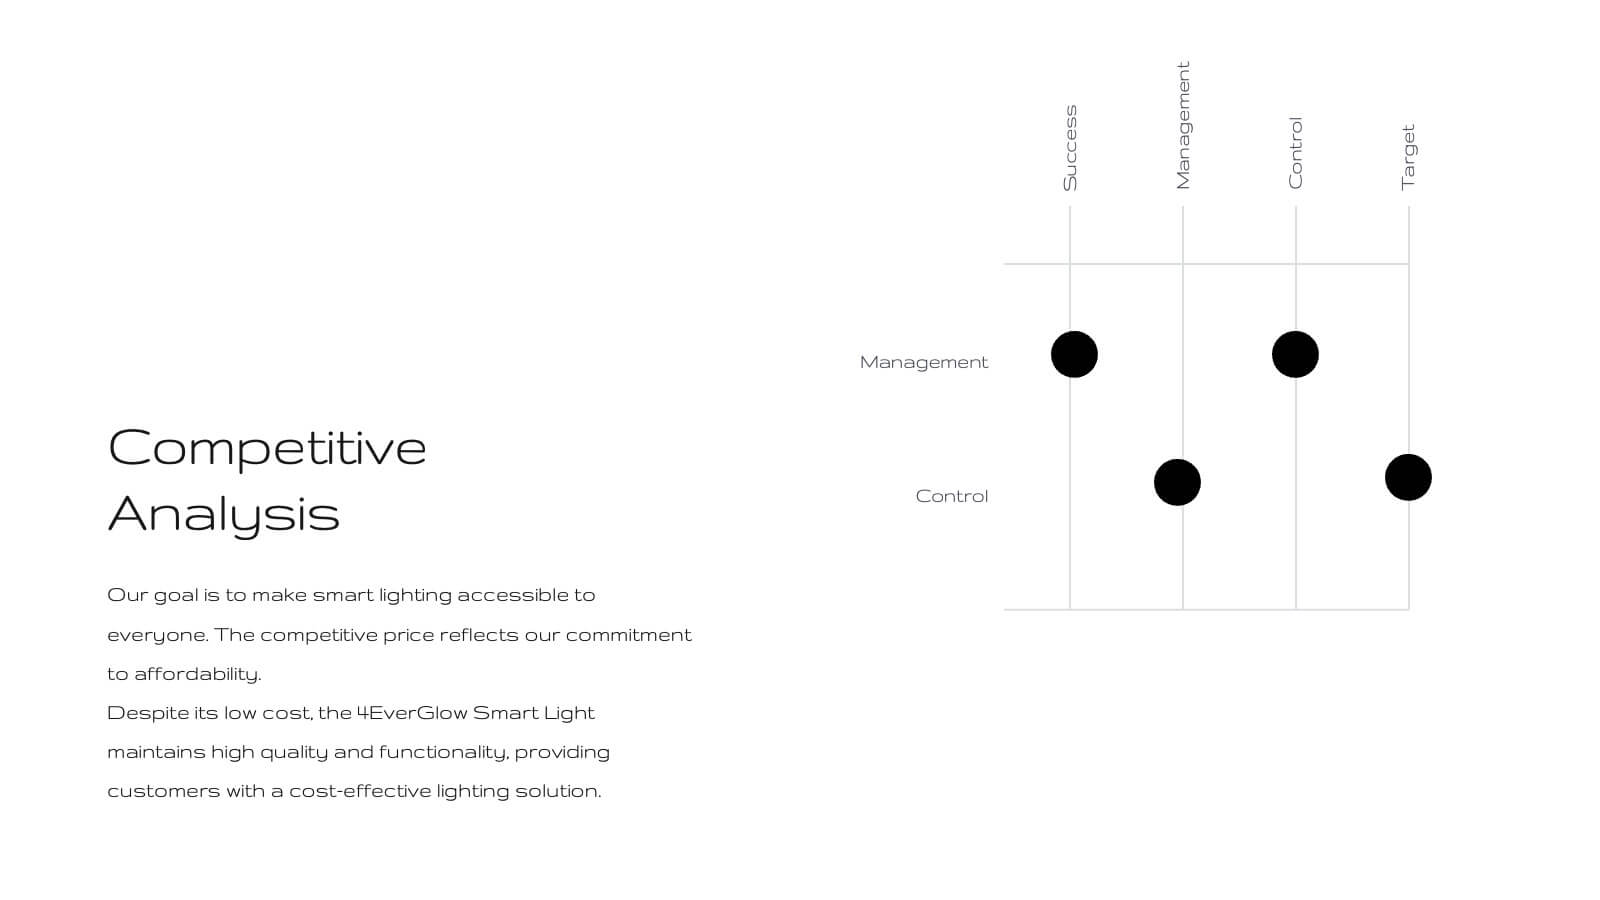
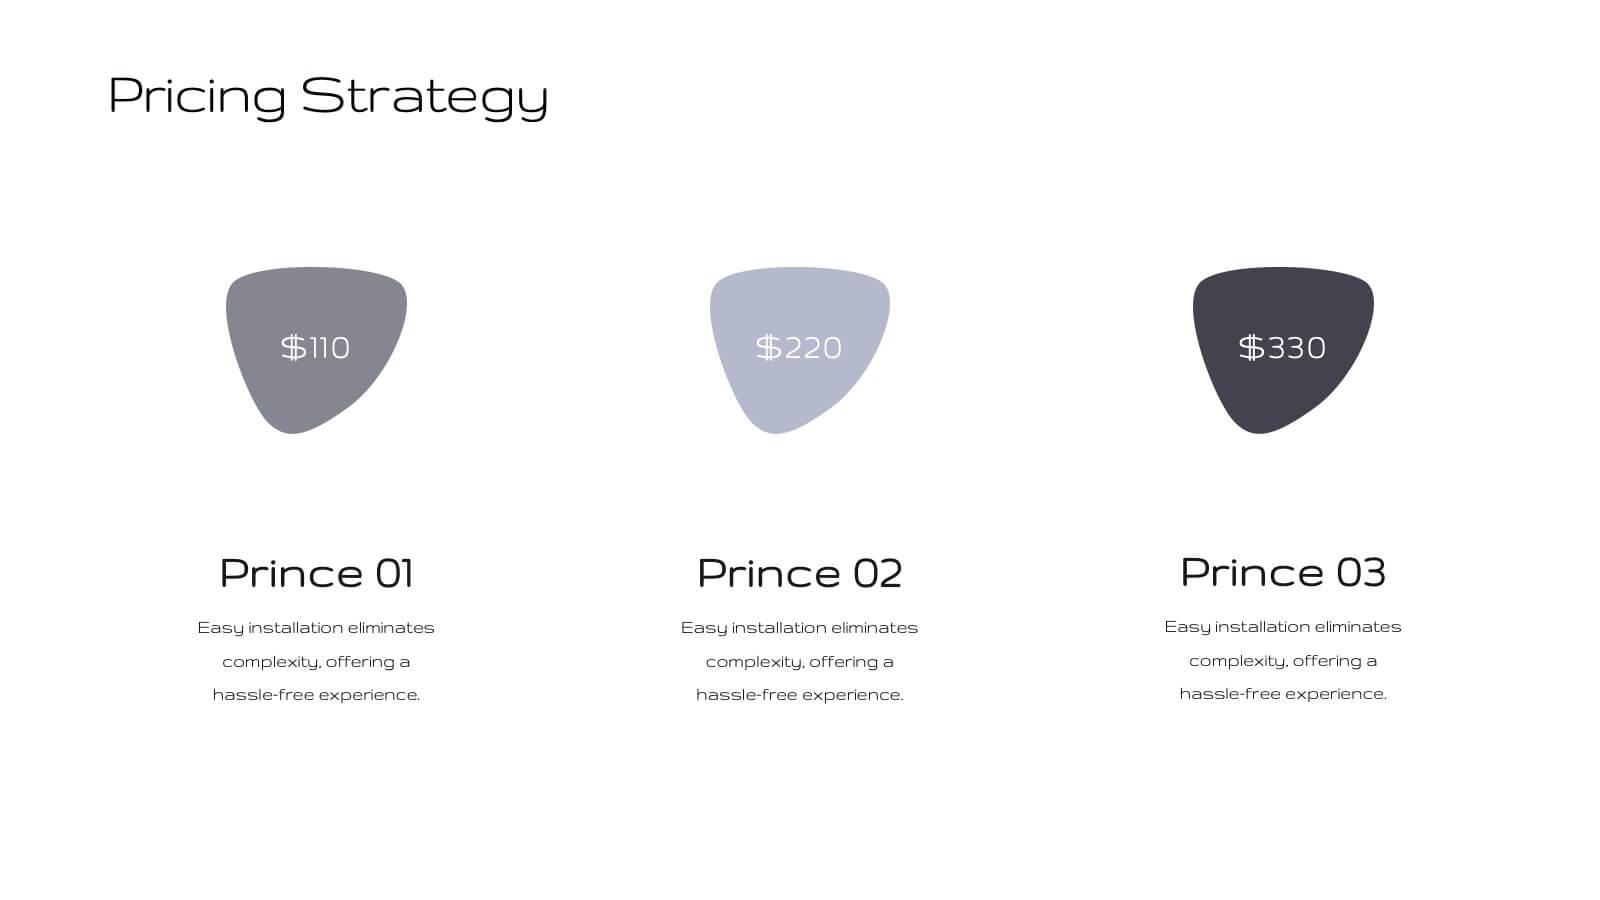
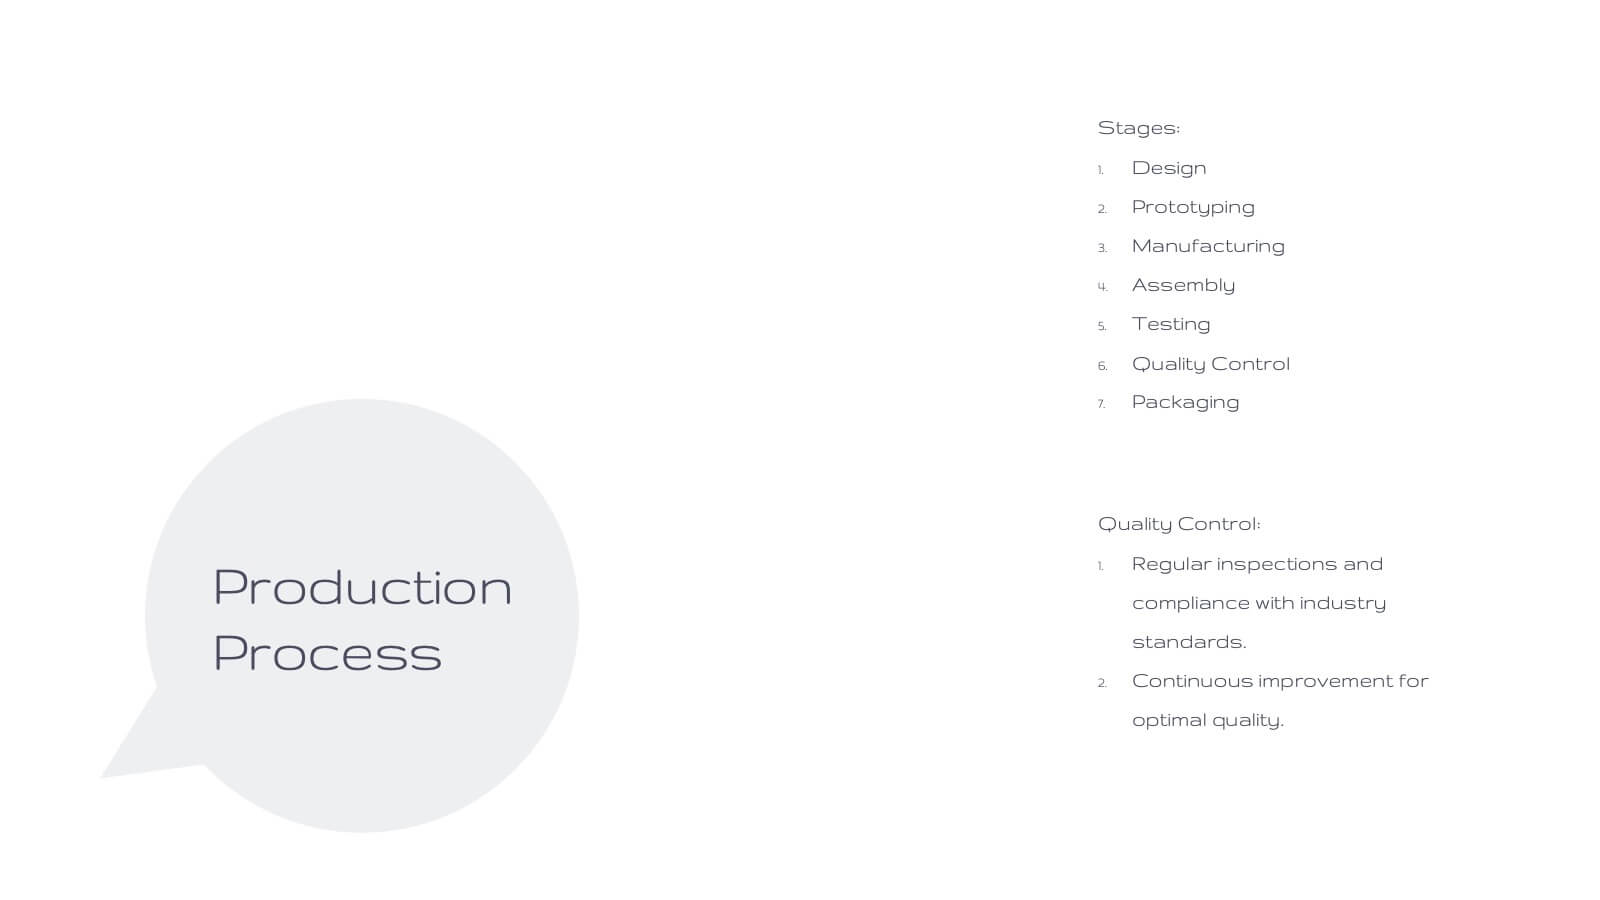
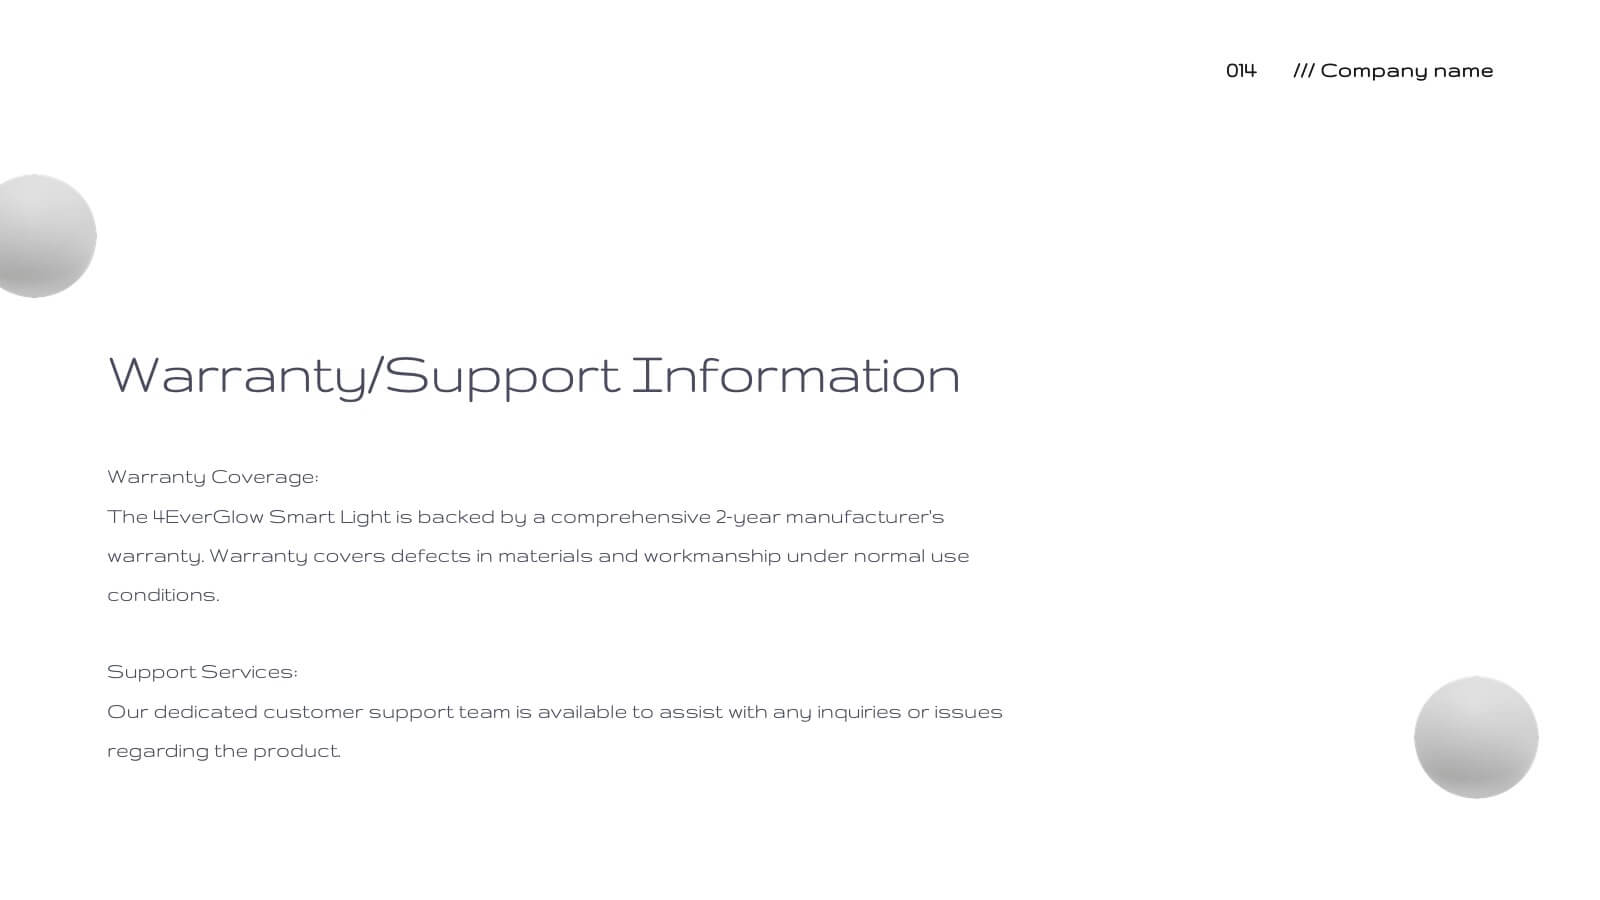
Fortuna Product Development Plan Presentation
Unveil your product's potential with this elegant, minimalist presentation template. Perfect for detailing product development, features, and market strategies, it features a clean design that emphasizes clarity and professionalism. Highlight key aspects like customer pain points, competitive analysis, and pricing strategies to captivate your audience. Compatible with PowerPoint, Keynote, and Google Slides, it ensures seamless presentations on any platform.


5 diapositivas
Workforce Alignment Strategy Presentation
Energize your strategy conversations with a clean, modern layout that makes team alignment feel clear, structured, and actionable. This presentation helps you break down goals, track priorities, and visualize key initiatives in a simple, intuitive flow. Ideal for planning sessions and leadership updates. Fully compatible with PowerPoint, Keynote, and Google Slides.


6 diapositivas
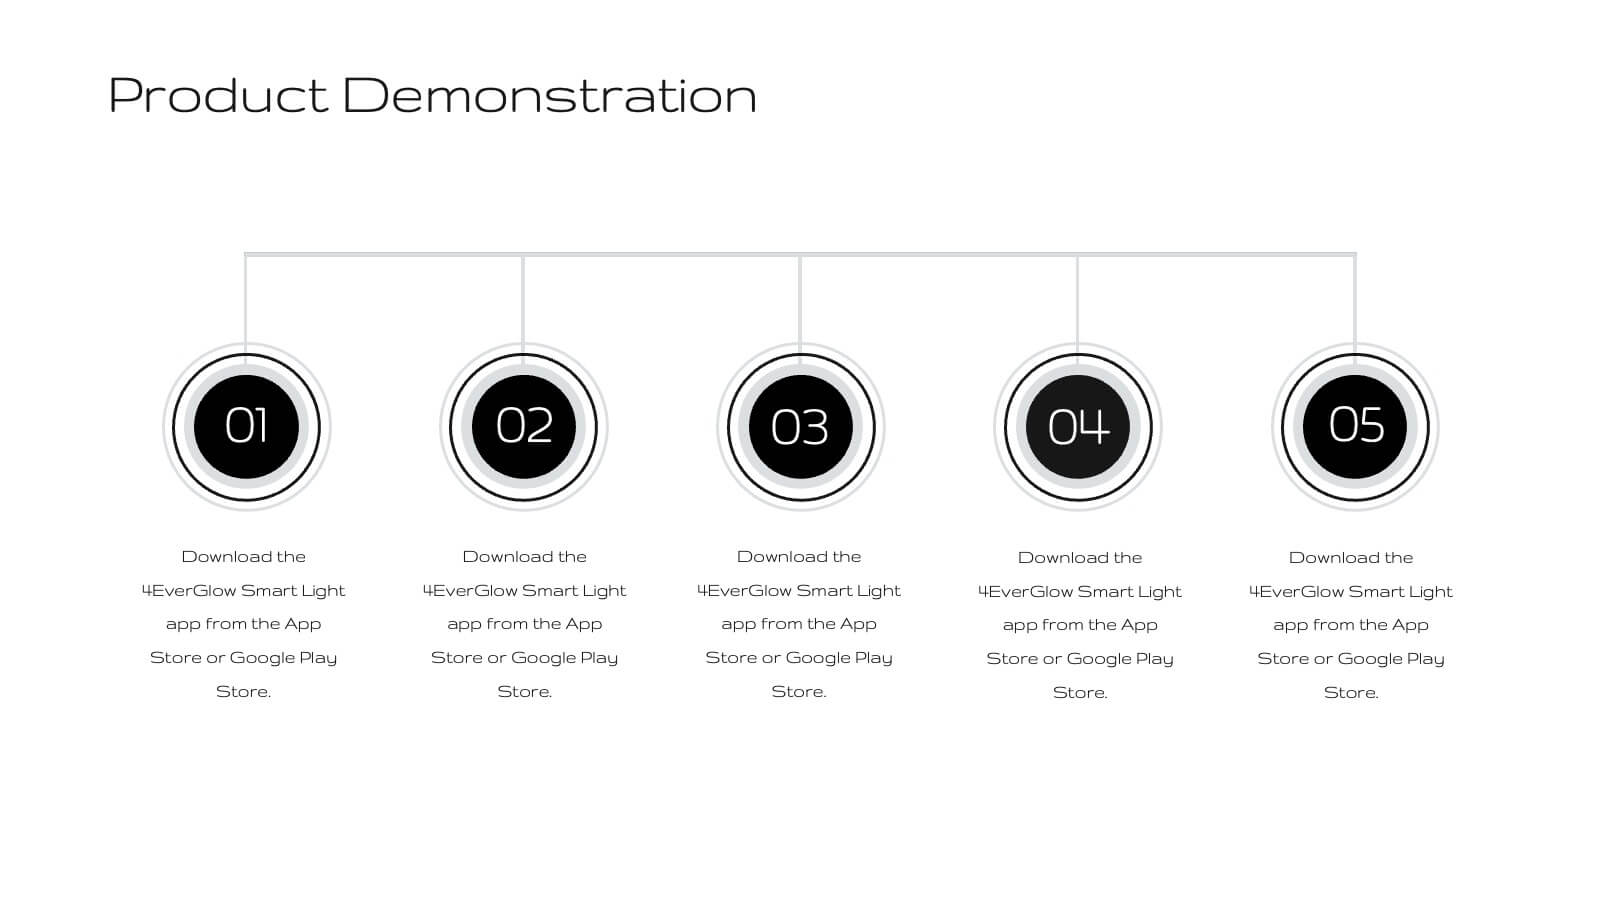
Visual Business Concept Triangle
Communicate processes, concepts, or growth stages with this dynamic triangle layout. Perfect for highlighting five key ideas or steps in a sleek, professional way. Fully customizable in PowerPoint, Keynote, and Google Slides for easy personalization.


7 diapositivas
Security Jobs Infographic
Security jobs refer to roles and positions within various industries that primarily focus on safeguarding individuals, properties, data, and assets from potential threats, risks, or unauthorized access. This infographic template is designed to shed light on the diverse and dynamic world of security professions. Fully customizable and compatible with Powerpoint, Keynote, and Google Slides. This infographic is your gateway to understanding the vital roles that contribute to a safer world. Discover your path, protect communities, and embark on a fulfilling career journey in security.


5 diapositivas
Coffee Brewing Methods Infographics
Coffee brewing methods refer to the various techniques and processes used to extract flavor and aroma from coffee beans. These infographic templates are a visually appealing and informative presentation tool designed to showcase various methods of brewing coffee. Whether you're a coffee enthusiast, a barista, or someone interested in learning more about coffee preparation, this template provides an engaging way to explore different brewing techniques and their unique characteristics. These allows you to showcase and educate others about various coffee brewing techniques. Fully customizable and compatible with Powerpoint, Keynote, and Google Notes.


6 diapositivas
Agile Development Methodology Infographic
Discover a visually engaging way to present the Agile Development Methodology with our versatile infographic template. Perfect for Powerpoint, Google Slides, and Keynote users, this template breaks down complex Agile concepts into easy-to-understand visuals. Whether you're illustrating the cycle of sprints, the importance of daily scrums, or the process of backlog refinement and reviews, our infographic makes it simple. It’s ideal for project managers, agile coaches, scrum masters, and team members looking to communicate the flexibility and dynamics of Agile workflows. Adopt a clear, concise approach to explaining iterative development and foster a better understanding in your audience with this user-friendly template.


21 diapositivas
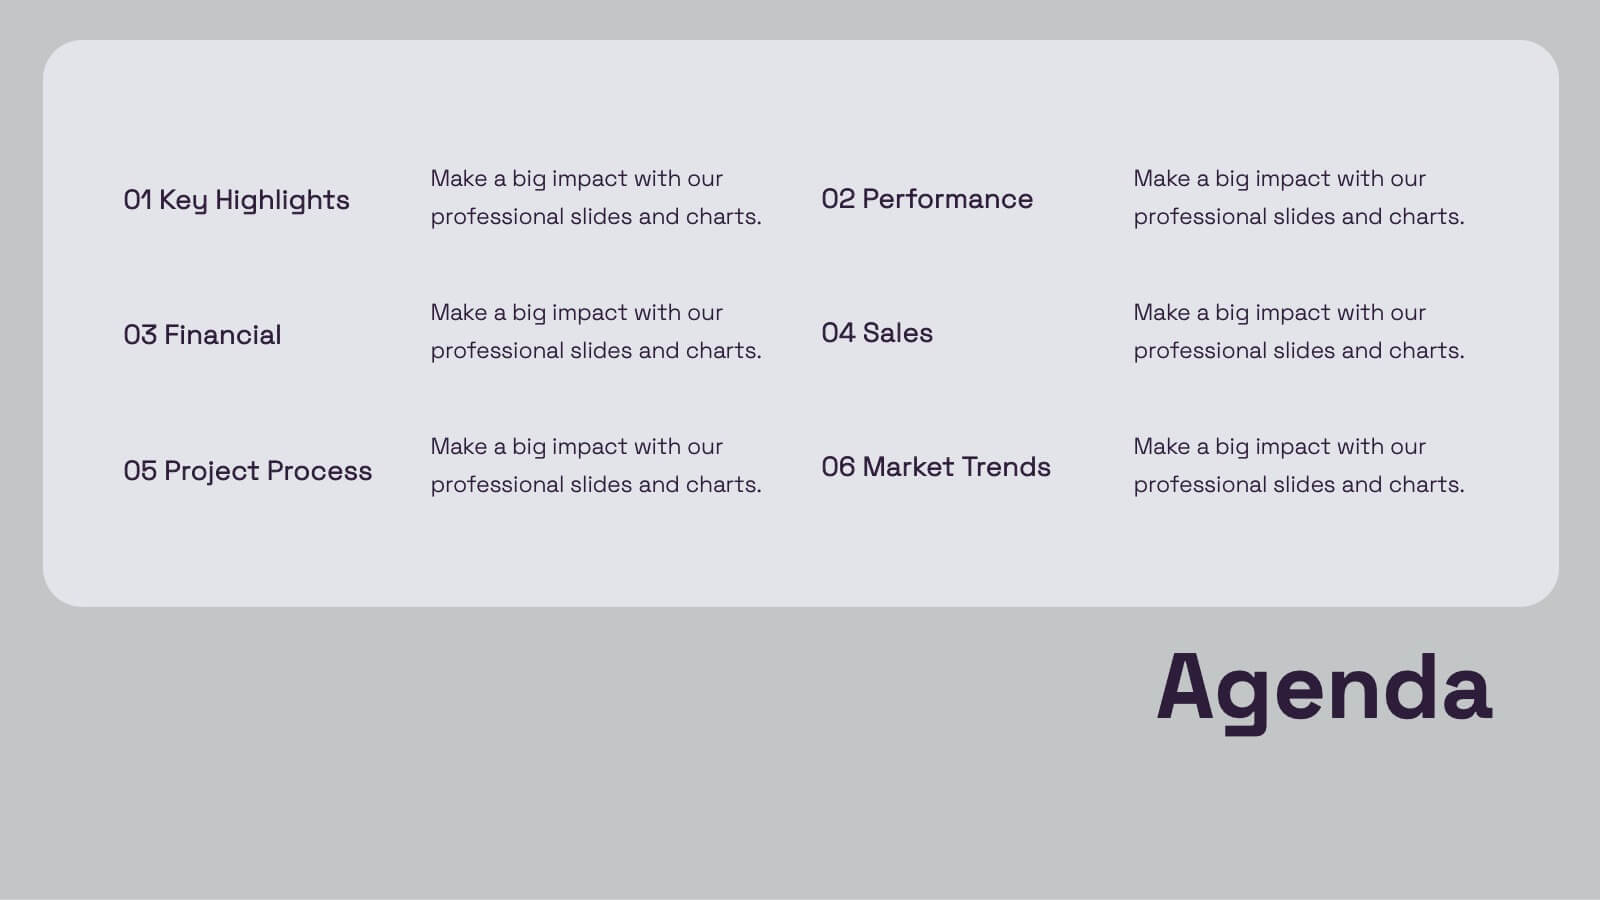
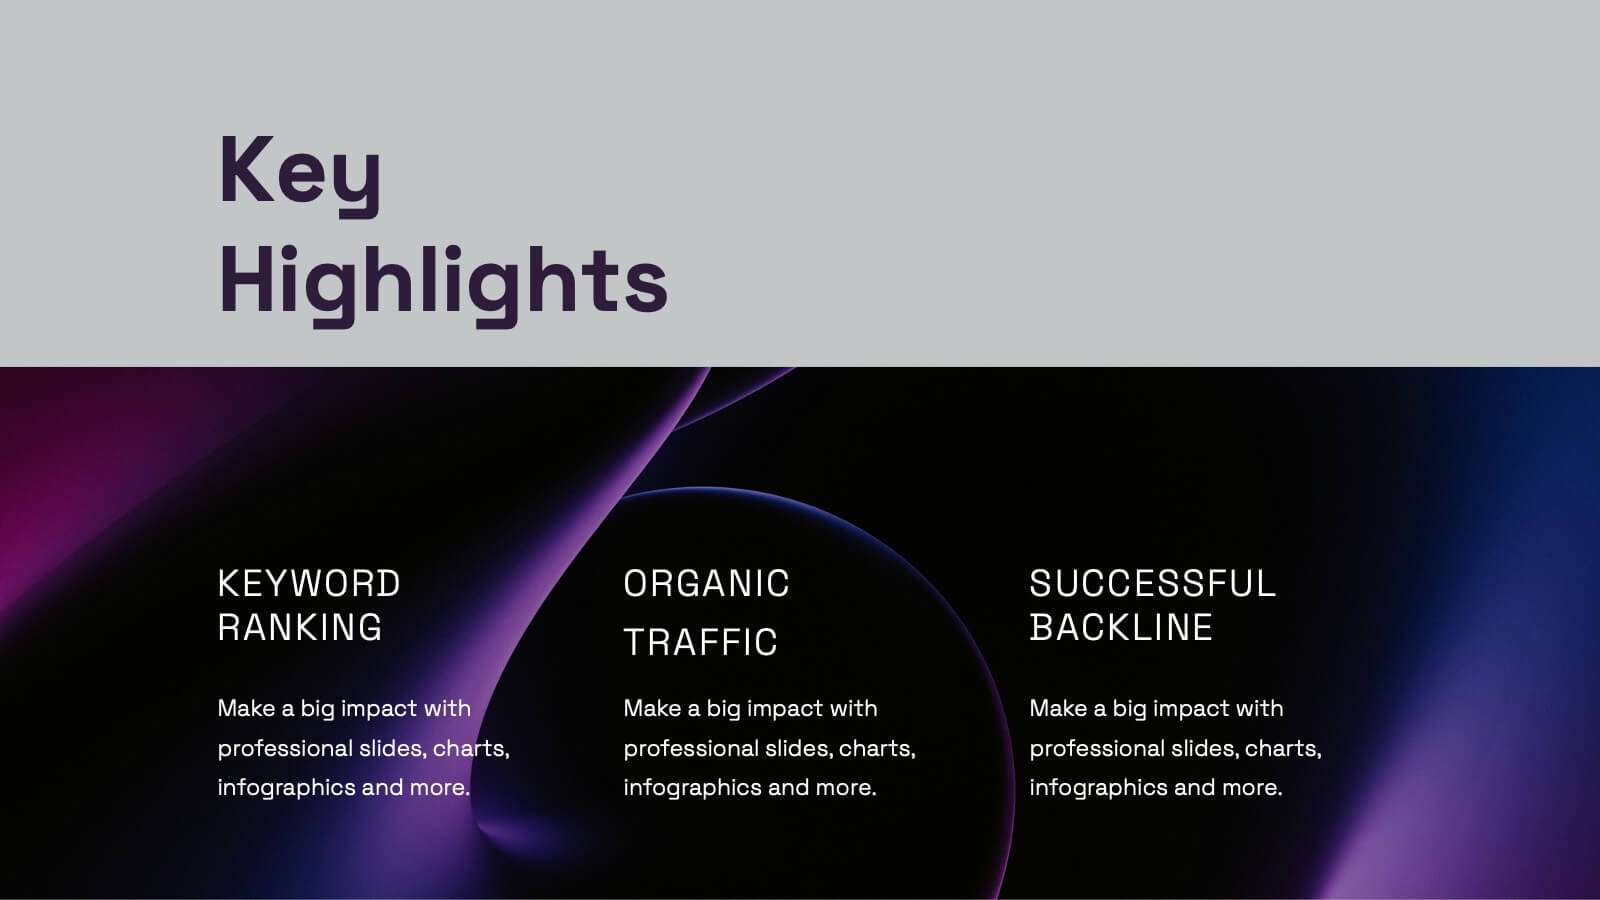
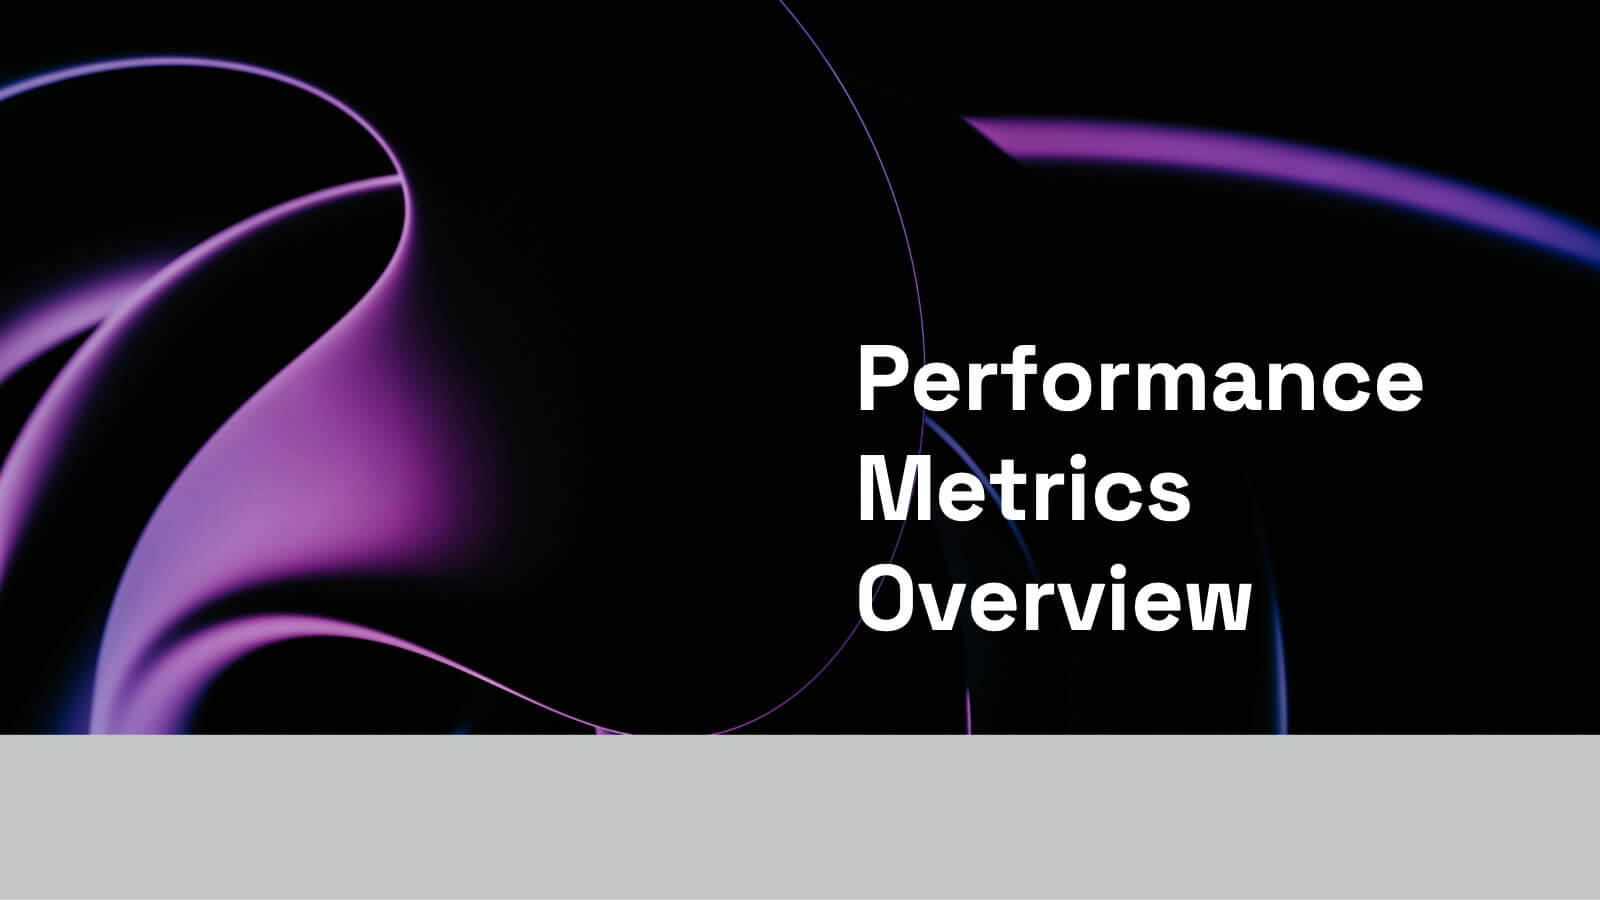
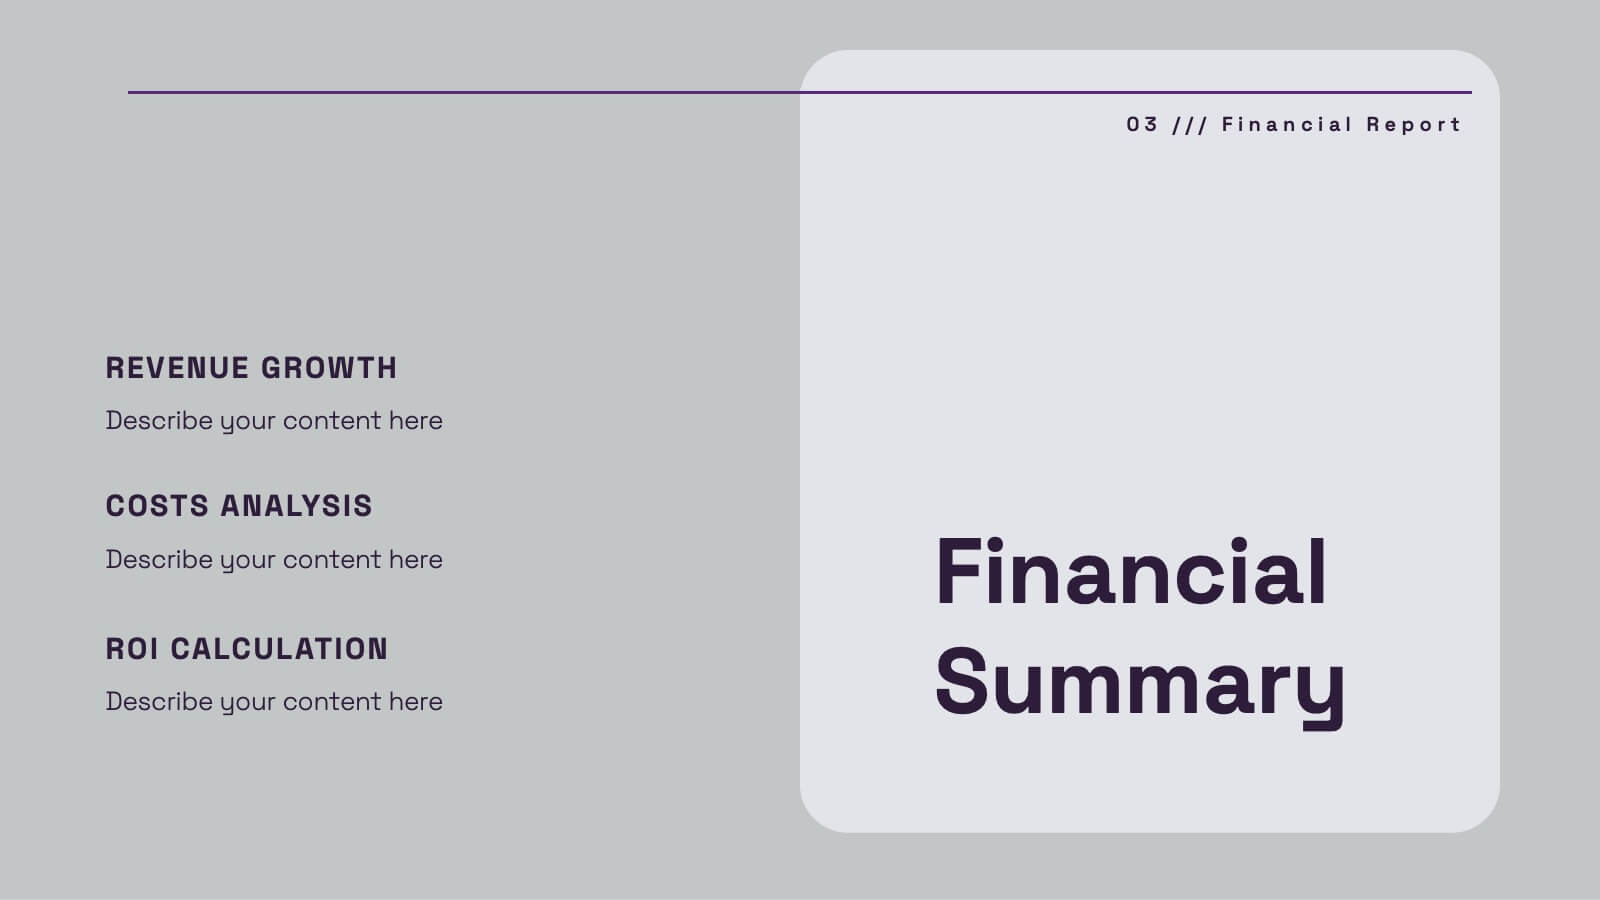
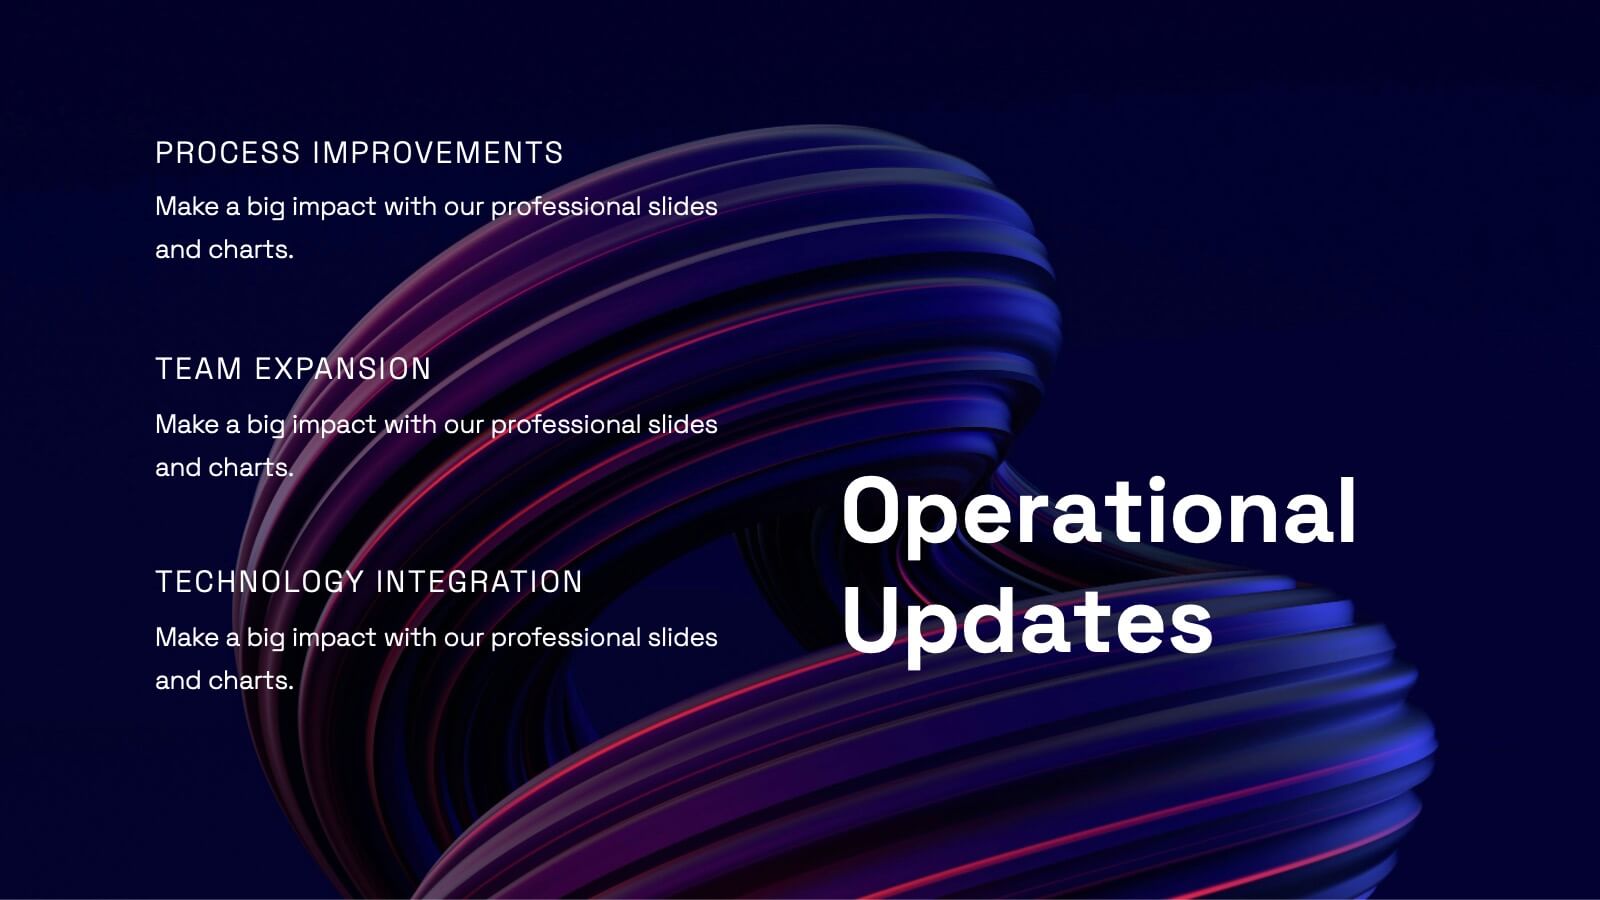
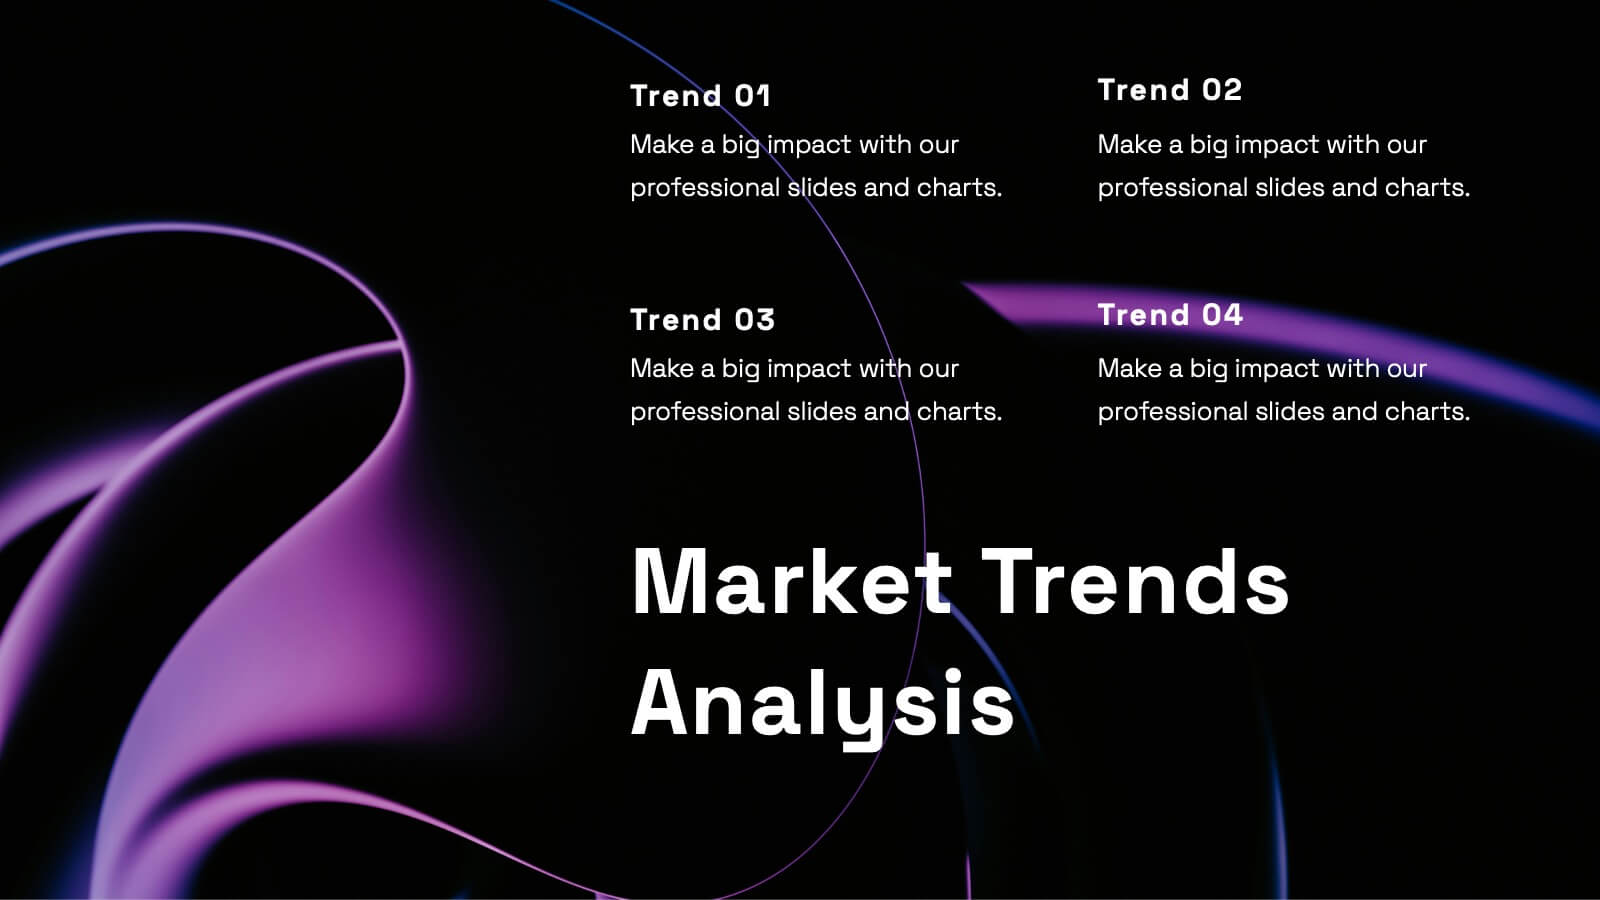
Uplift Financial Report Presentation
Present your financial or business report with this sleek and modern presentation template! It includes essential sections such as performance metrics, financial summaries, project progress, and market trends analysis, ensuring a comprehensive overview. Whether you're discussing key achievements or competitor insights, this template is perfect for delivering a professional and polished report. Compatible with PowerPoint, Keynote, and Google Slides for easy use and customization.


6 diapositivas
Session-by-Session Agenda Breakdown Presentation
Easily outline and compare multiple sessions with this Session-by-Session Agenda Breakdown presentation. Designed to group agenda topics and supplementary content side by side, this layout is perfect for workshops, summits, or recurring meetings. Fully editable in Canva, PowerPoint, and Google Slides for seamless branding and customization.


7 diapositivas
Venn Diagram Structure Infographic
Illuminate intersections and highlight distinctions with our Venn diagram infographic. Cast on a pristine white canvas, the design radiates with harmonious hues of pastel purple, calming blue, passionate red, and rejuvenating green, emphasizing the areas of overlap and distinct zones in a structured manner. Bolstered with infographics, representative icons, and adjustable image placeholders, this template is an epitome of clarity in showcasing relational logic among sets. Configured for Powerpoint, Keynote, or Google Slides. An ally for data analysts, statisticians, educators, or anyone seeking to depict intertwined relationships in a clear, visual format.


7 diapositivas
Prime Numbers Infographic Presentation
A numbers infographic is a visual representation of information using graphical elements such as charts, graphs, and diagrams. A well-crafted template is a powerful tool for conveying insights into your data. Numbers have the ability to transform your data into useful insights that can help you make an informed decision. This numbers infographics is made with different type of charts and diagrams, which will help you establish a relation between numbers and words. This fully editable template is designed to present numbers, data and statistics in a creative way unique to your brand.


23 diapositivas
Ethelin Digital Strategy Presentation
The digital strategy presentation template is designed to showcase your company's goals, market analysis, and strategic initiatives. Featuring slides for SWOT analysis, performance metrics, and action plans, it’s perfect for business planning and stakeholder engagement. Fully customizable and compatible with PowerPoint, Keynote, and Google Slides.


7 diapositivas
Annual Marketing Report Infographic
Elevate your corporate narrative with our meticulously curated Annual Report Infographic. Cloaked in the purity of white and varying professional blue tones, our template mirrors the precision and credibility essential for annual reviews. Enhanced with succinct infographics, coherent icons, and pertinent image placeholders, it weaves a year's data into a compelling visual story. Flawlessly adapted for Powerpoint, Keynote, or Google Slides. A quintessential instrument for CEOs, financial analysts, stakeholders, or any organization presenting its yearly milestones and future outlook. Reflect, report, and strategize; let every slide be a testament to your organization's journey and ambition.


5 diapositivas
Physical Science Infographics
Immerse in the realm of physical sciences with our physical science infographics template. Set against a deep cosmos of blues and purples, this template serves as a bridge between complex scientific principles and audiences, ideal for educators, students, and science communicators. The design, balancing creativity and informativeness, integrates stunning graphics and icons, turning data and facts into captivating visual stories. This dark-themed, visually engaging layout is not just an educational tool, but a spark that ignites curiosity and exploration in classrooms, scientific presentations, or educational content, making science both profound and accessible.


26 diapositivas
Warm Tones Real Estate Presentation
Create an engaging and inviting Warm Tone Real Estate presentation with this easy to use template. The color scheme of this welcoming template features warm tones to set the mood for a peaceful, natural environment. The cover slide features emerald green and brown, while the next two slides use warmer brown, tan shades, keeping the same theme going. Fully customizable, this template is ready to help you sell and promote properties quickly and easily. This layout is perfect for showcasing properties with a premium feel that’ll inspire confidence in both buyers and sellers alike.


4 diapositivas
Breakthroughs in Scientific Discovery Presentation
Highlight research milestones with this Breakthroughs in Scientific Discovery Presentation Template. Designed with a lab flask graphic that fills up with percentages, this layout is perfect for showcasing progress, success metrics, or phased experimentation. Ideal for researchers, science communicators, and biotech presentations. Fully editable in PowerPoint, Keynote, and Google Slides.


12 diapositivas
User Experience Journey Presentation
The "User Experience Journey Presentation" template offers a comprehensive visualization of the stages involved in user interaction with a product or service. This infographic template maps out each phase of the user experience journey, depicted in a sequence of steps marked from A to F, each stage highlighted with unique icons and a gradient color scheme enhancing visual appeal and understanding. Suitable for UX professionals, marketers, and product developers, this template aids in illustrating the process from initial contact to post-use evaluation, emphasizing key points at each stage. It is an invaluable tool for presentations aimed at enhancing customer satisfaction and optimizing user interaction strategies.