


Características


¿Tienes alguna pregunta?
Recomendar


7 diapositivas
Innovation Infographics Presentation Template
Our innovation Infographic template is a trendy and professional way to present innovation to your audience in a way that keeps them engaged. This design features simple yet striking elements which will deliver your message, while the font and color scheme gives you that flexibility to personalize this template to your brand’s identity. We have designed this presentation template to help you create and deliver engaging content for your audience. It is a powerful tool that helps you build interest, generate leads and position yourself as an authority on the subject of innovation.


6 diapositivas
Bubble Diagram for Idea Development
Streamline your brainstorming sessions and visualize concept progression with this Bubble Diagram for Idea Development presentation. Featuring a circular, color-coded layout from A to F, it’s ideal for mapping interconnected ideas, workflows, or innovation cycles. Easily editable in PowerPoint, Keynote, and Google Slides.


6 diapositivas
Defining Project Scope
Visualize your project's key components with this sleek hexagonal layout, perfect for outlining milestones, deliverables, and priorities. This six-part diagram helps teams align goals and clarify scope early in the process. Ideal for PMs, strategists, and consultants. Fully editable in PowerPoint, Keynote, and Google Slides.


20 diapositivas
Spartan Content Marketing Pitch Deck Presentation
The Spartan Marketing Pitch Deck is designed to captivate and impress with its bold, modern layout and striking black-and-white color scheme. Perfect for delivering powerful marketing strategies, this template covers all essential aspects from industry overview to consumer behavior analysis. It seamlessly guides you through emerging technologies, content marketing trends, and mobile marketing insights. The deck emphasizes personalization trends, influencer marketing, and the latest eCommerce developments, ensuring your pitch resonates with cutting-edge strategies. Whether discussing SEO and SEM trends or diving into customer experience and brand storytelling, this template delivers your message with clarity and impact. Conclude with a strong call to action, ensuring your audience is engaged and ready to take the next step. Fully compatible with PowerPoint, Keynote, and Google Slides, the Spartan Marketing Pitch Deck is an excellent choice for professionals aiming to deliver a memorable and persuasive presentation.


7 diapositivas
Startup Company Infographic
Embark on the entrepreneurial journey with our startup infographic. Adorned in a professional palette of pristine white and corporate blue, this template is tailored to narrate the dynamic lifecycle of a startup. From ideation to scaling, each phase is depicted through custom graphics, intuitive business icons, and strategic image placeholders, ensuring that your audience remains engaged while grasping the essence of startup progression. This infographic is tailored for aspiring entrepreneurs, business educators, startup incubators, or any corporate entity aiming to elucidate the nuances of initiating a startup. Compatible with Powerpoint, Keynote, and Google Slides.


6 diapositivas
Connection and Relationship Strategy Presentation
Present your workflow or relationship journey with clarity using the Connection and Relationship Strategy Presentation. This linear hexagon path is ideal for visualizing sequences, strategies, or stages in professional relationships. Fully customizable for PowerPoint, Keynote, and Google Slides—perfect for consultants, marketers, or project managers.


7 diapositivas
Framework Infographics Presentation Template
A framework infographic is a visual representation of a structured approach or system for addressing a problem, organizing information, or making decisions. Our framework infographic is designed to help you understand complex concepts and to provide a visual roadmap that can be easily followed. This template makes an impact with a professional design, customizable text and graphics, and compelling visual content. If you need to display and share information, charts, graphs or lists in a creative way this template will guide you through each step to create a professional looking infographic.


7 diapositivas
McKinsey 7S Framework Presentation
Dive into organizational alignment with our McKinsey 7S Framework infographic presentation template, perfect for consultants and business managers. This visually appealing template organizes your discussion around Structure, Strategy, Systems, Skills, Staff, Style, and Shared Values, ensuring a comprehensive overview. Crafted for clarity and effectiveness, it's ready to use in PowerPoint, Keynote, and Google Slides, helping you present complex interdependencies with ease and style.


5 diapositivas
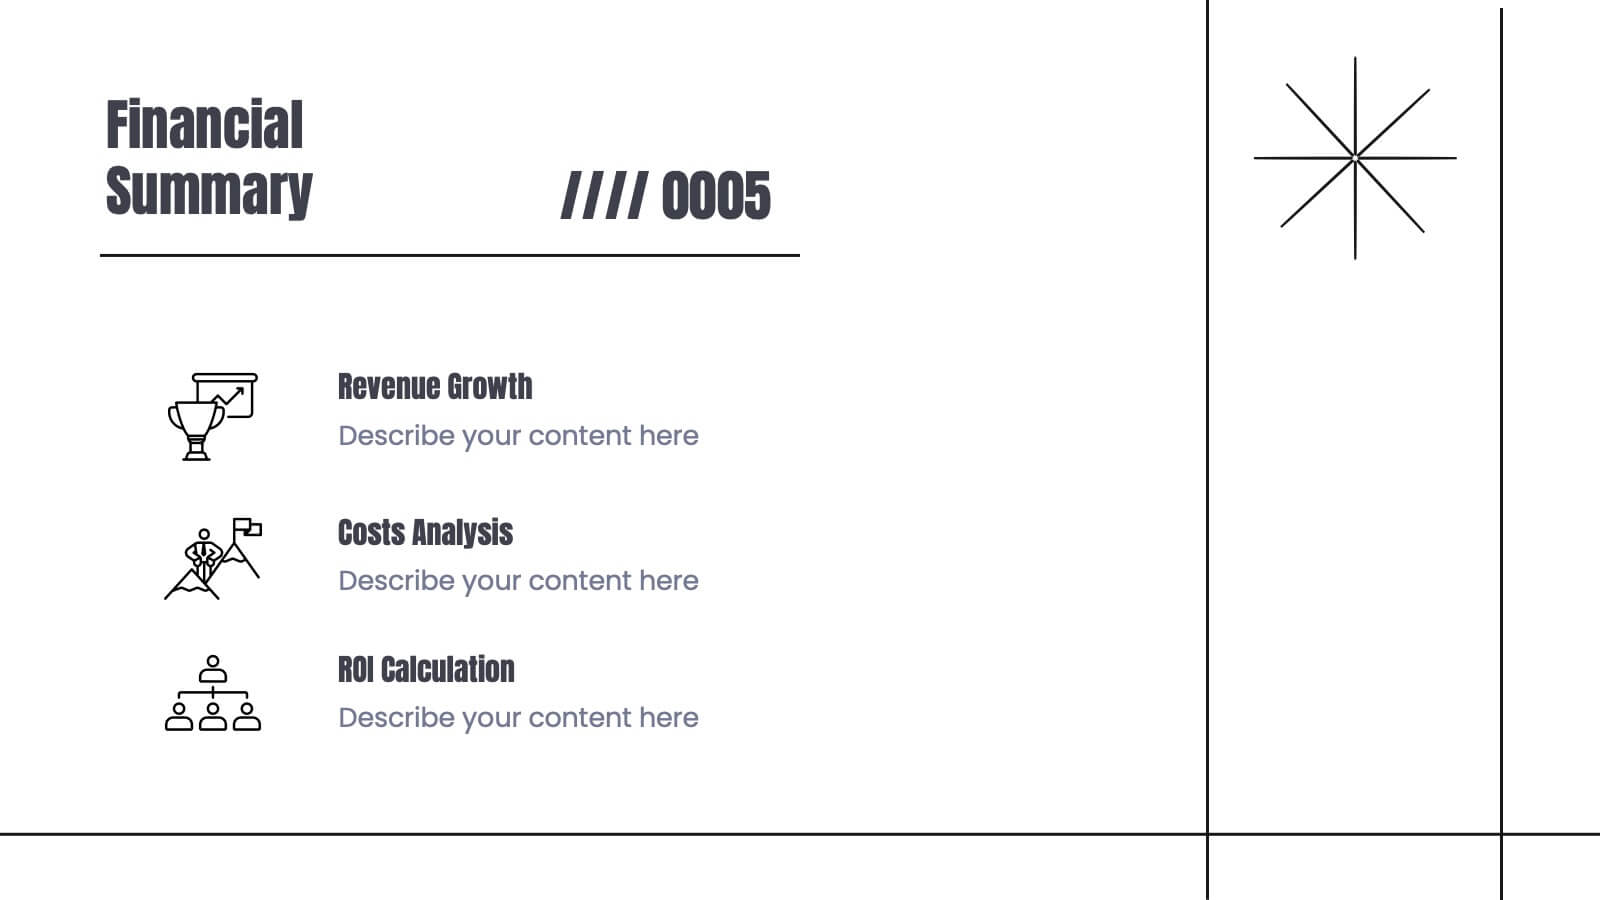
Monthly Financial Report Infographics
Dive into financial analytics with our monthly financial report infographics template. This indispensable tool, designed for finance professionals, managers, and business owners, comes in a stimulating mix of orange, pink, and green, reflecting the dynamic nature of finance. The template stands out with creative graphics, detailed icons, and designated areas for images that encapsulate various financial parameters. Ideal for depicting key statistics, trends, and financial insights in a clear, engaging manner, this vertical-style infographic template is perfect for simplifying complex data, ensuring your monthly reports are both comprehensive and captivating.


6 diapositivas
Staff Integration and Onboarding Journey Presentation
Streamline your onboarding process with the Staff Integration and Onboarding Journey Presentation. This clean, step-by-step layout uses human icons to represent each phase of a new hire's journey—from orientation to full integration. Ideal for HR professionals, it’s fully editable in Canva, PowerPoint, Keynote, or Google Slides for easy customization.


21 diapositivas
Mystorin Market Analysis Report Presentation
Present your market analysis findings with this sleek and professional report presentation template. Covering essential sections such as key highlights, performance metrics, competitor insights, and strategic initiatives, it provides a comprehensive framework for data-driven decisions. Ideal for businesses and analysts. Compatible with PowerPoint, Keynote, and Google Slides for easy customization.


8 diapositivas
Employee Onboarding 30-60-90 Day Plan Presentation
Set new hires up for success with this employee onboarding 30-60-90 day plan template! Designed to streamline the onboarding process, this structured layout helps HR teams and managers define clear goals, training steps, and performance milestones. Fully customizable and compatible with PowerPoint, Keynote, and Google Slides for seamless adaptation.


7 diapositivas
KPI Dashboard Infographic Presentation Template
A KPI (Key Performance Indicator) dashboard is a visual tool that displays important metrics and data related to a specific business or organizational goal. It allows users to track and monitor key performance indicators (KPIs) over time, making it easier to identify trends, track progress, and make data-driven decisions. This template is perfect for keeping track of important information about your business or organization. This template include a variety of charts, graphs, and tables that present information in an easy-to-understand format. Customized to track different types of data.


6 diapositivas
Career Goals Infographic
Career goals refer to the professional objectives and aspirations that individuals set for themselves to achieve in their chosen careers. This infographic template serves as a powerful tool for individuals to map out their career aspirations, create a clear roadmap, and communicate their goals effectively. This template is designed to articulate and communicate your career aspirations and goals. This infographic provides a clear and organized overview of career objectives, steps for achieving those goals, and key milestones along the way. Compatible with Powerpoint, Keynote, and Google Slides.


5 diapositivas
Optimized Process Flow Diagram Presentation
Streamline workflows with the Optimized Process Flow Diagram. This professional template visualizes key business processes for efficient decision-making and execution. Designed for project managers, analysts, and strategists, it ensures a clear, structured overview of sequential steps. Fully editable and compatible with PowerPoint, Keynote, and Google Slides.


5 diapositivas
Health Care Access and Equity Infographics
Health Care Access refers to the ability of individuals and communities to obtain medical services and receive appropriate care when needed. These infographic templates serve as an educational and advocacy tool, helping to raise awareness about the importance of equitable healthcare access and the need for addressing disparities. Whether used in healthcare organizations, educational settings, or public awareness campaigns, this template effectively communicates the urgency of achieving health equity and encourages individuals to take action towards a more equitable healthcare system. Compatible with Powerpoint, Keynote, and Google Notes.


6 diapositivas
Big Data Visualization Dashboard Presentation
Bring your data story to life with a slide that feels dynamic, modern, and effortlessly clear. This presentation highlights key metrics through clean icons and a bold circular progress graphic, making complex information easy to follow and visually engaging. Perfect for sharing insights, tracking performance, or presenting analytics updates. Fully compatible with PowerPoint, Keynote, and Google Slides.