


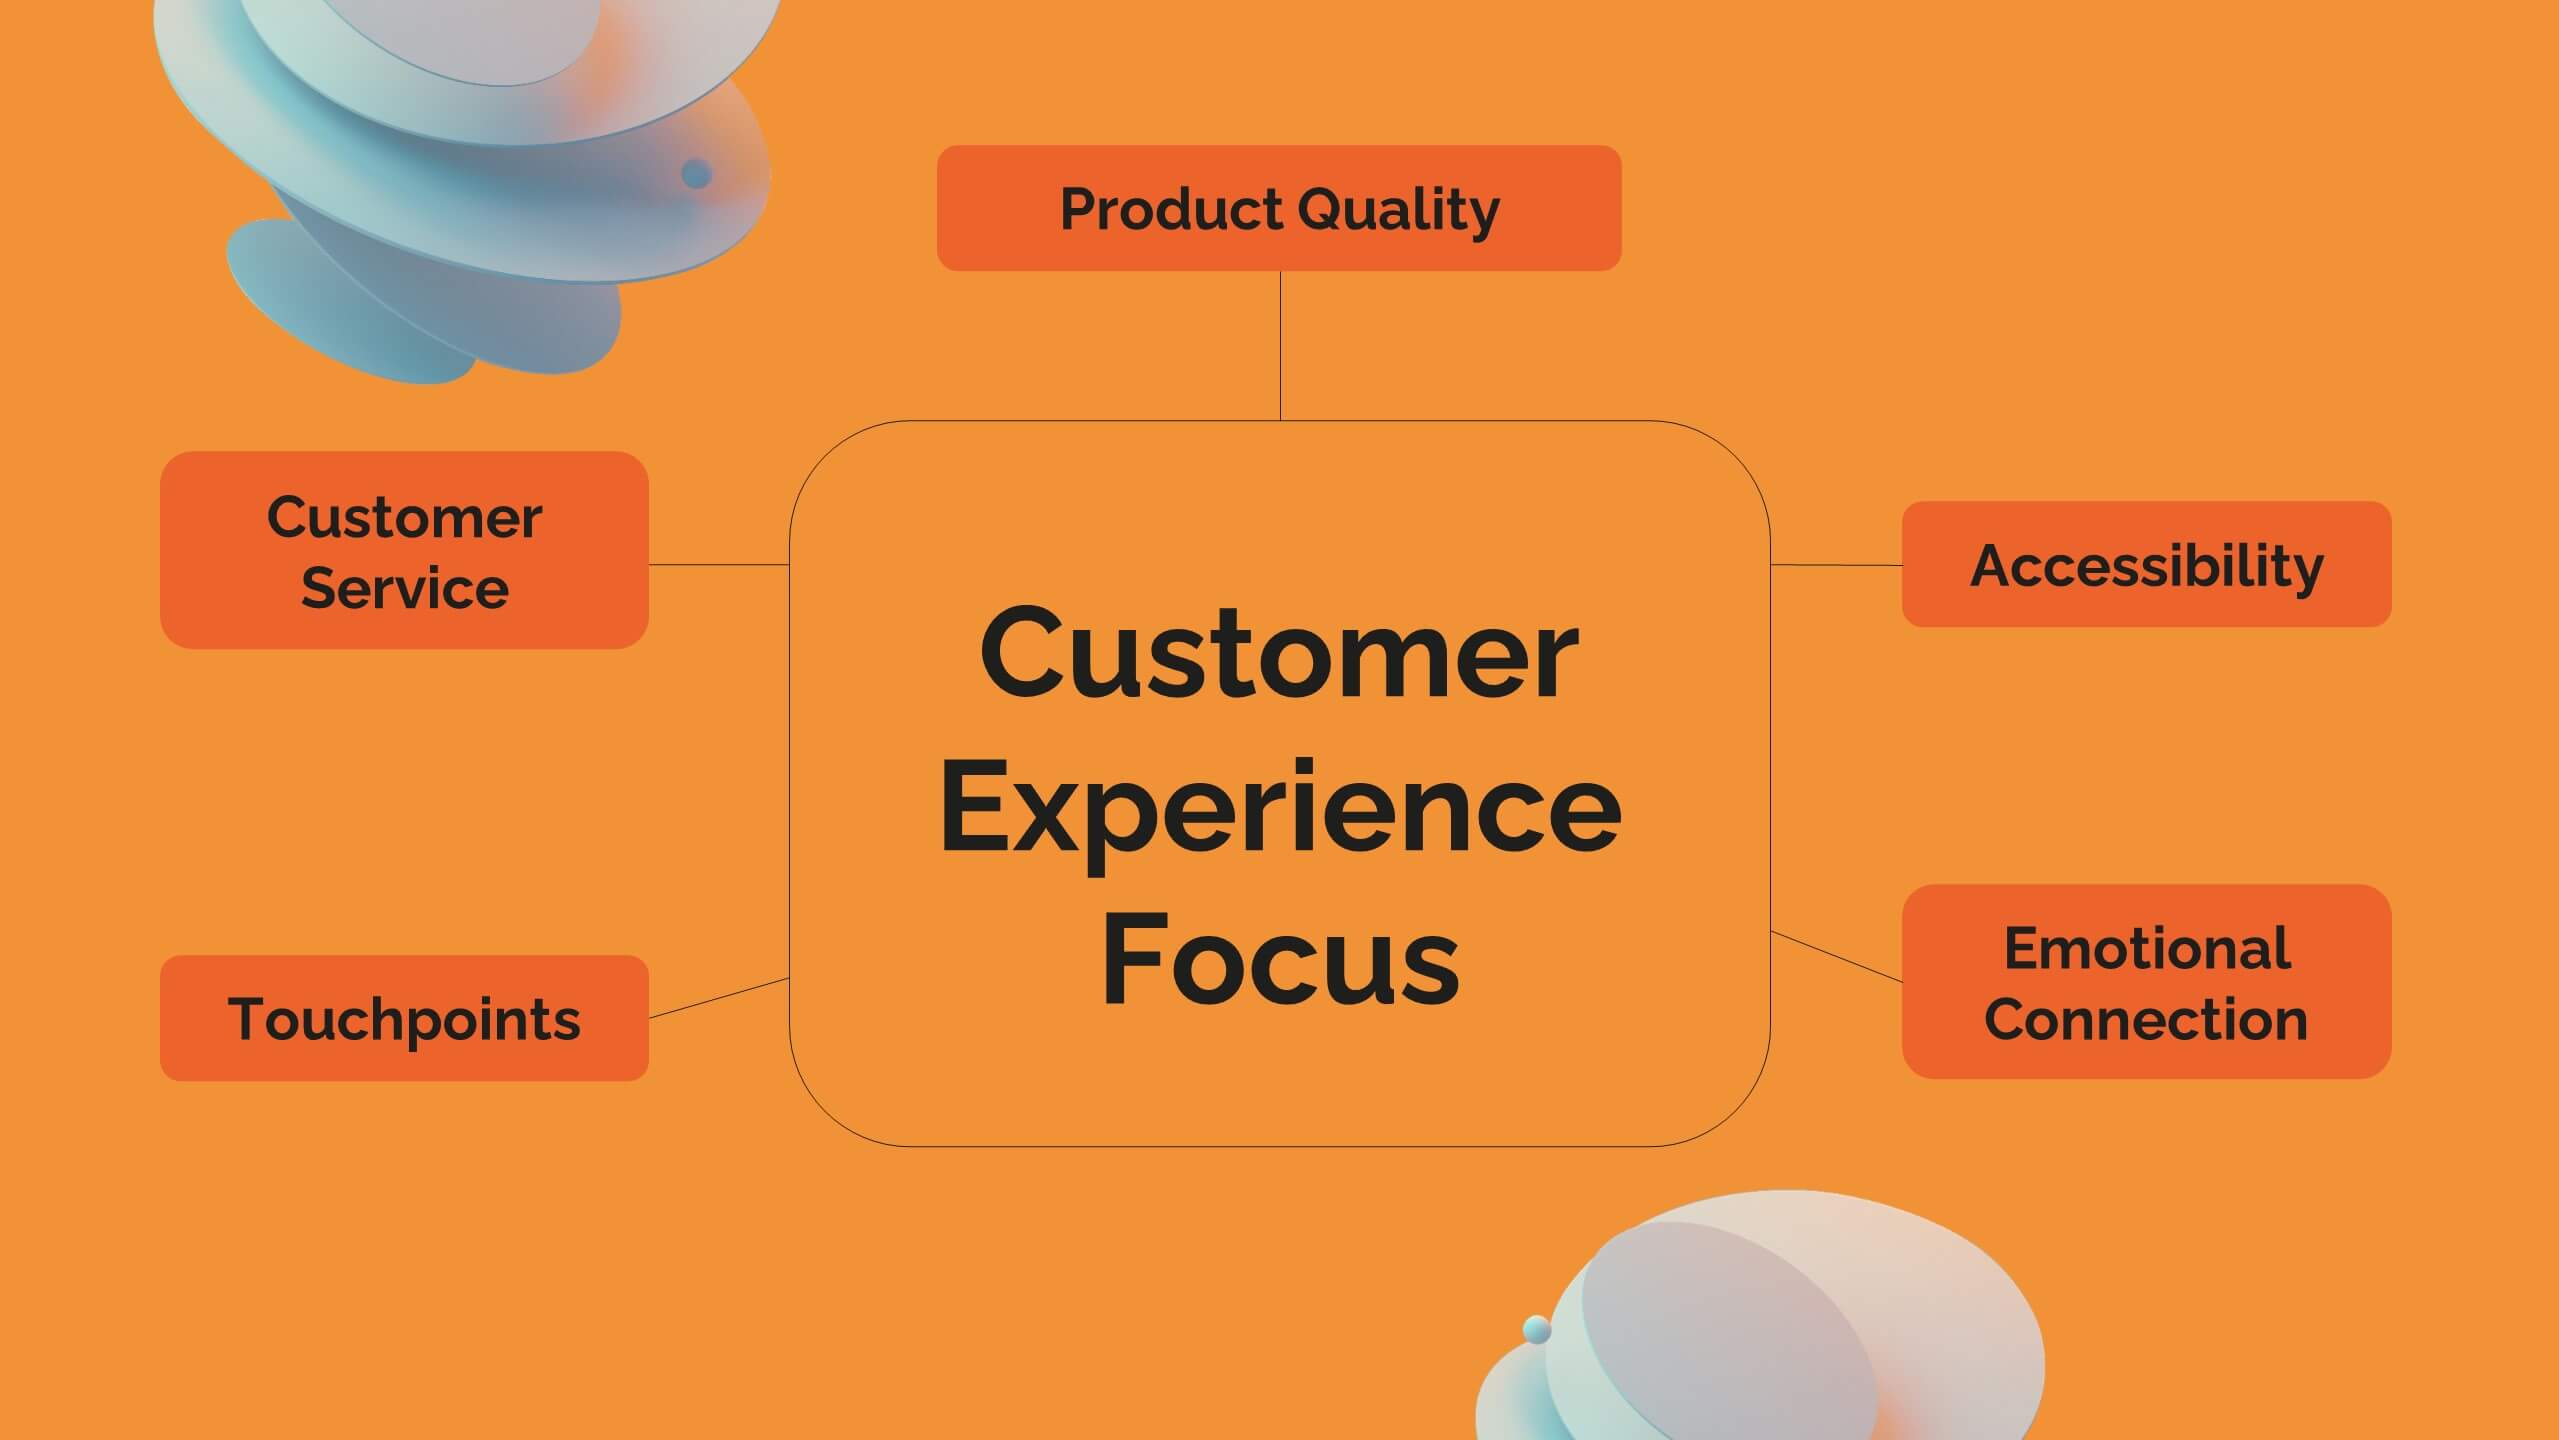
Características


¿Tienes alguna pregunta?
Recomendar


6 diapositivas
Team Vision Infographic
Explore our collection of Slide Templates tailored to showcase your team's vision and future ambitions. These templates offer a blend of modern and professional designs that are perfect for laying out your team's objectives and strategies. Each slide is crafted to facilitate clear communication of your vision, ensuring every team member is aligned and motivated. These visually appealing templates are ideal for team meetings, strategic planning sessions, and leadership presentations. They are fully customizable, allowing you to adapt the colors, text, and graphics to match your team's identity and goals. Optimize your team's presentations with these versatile templates, designed to promote understanding and enthusiasm for your collective vision.


20 diapositivas
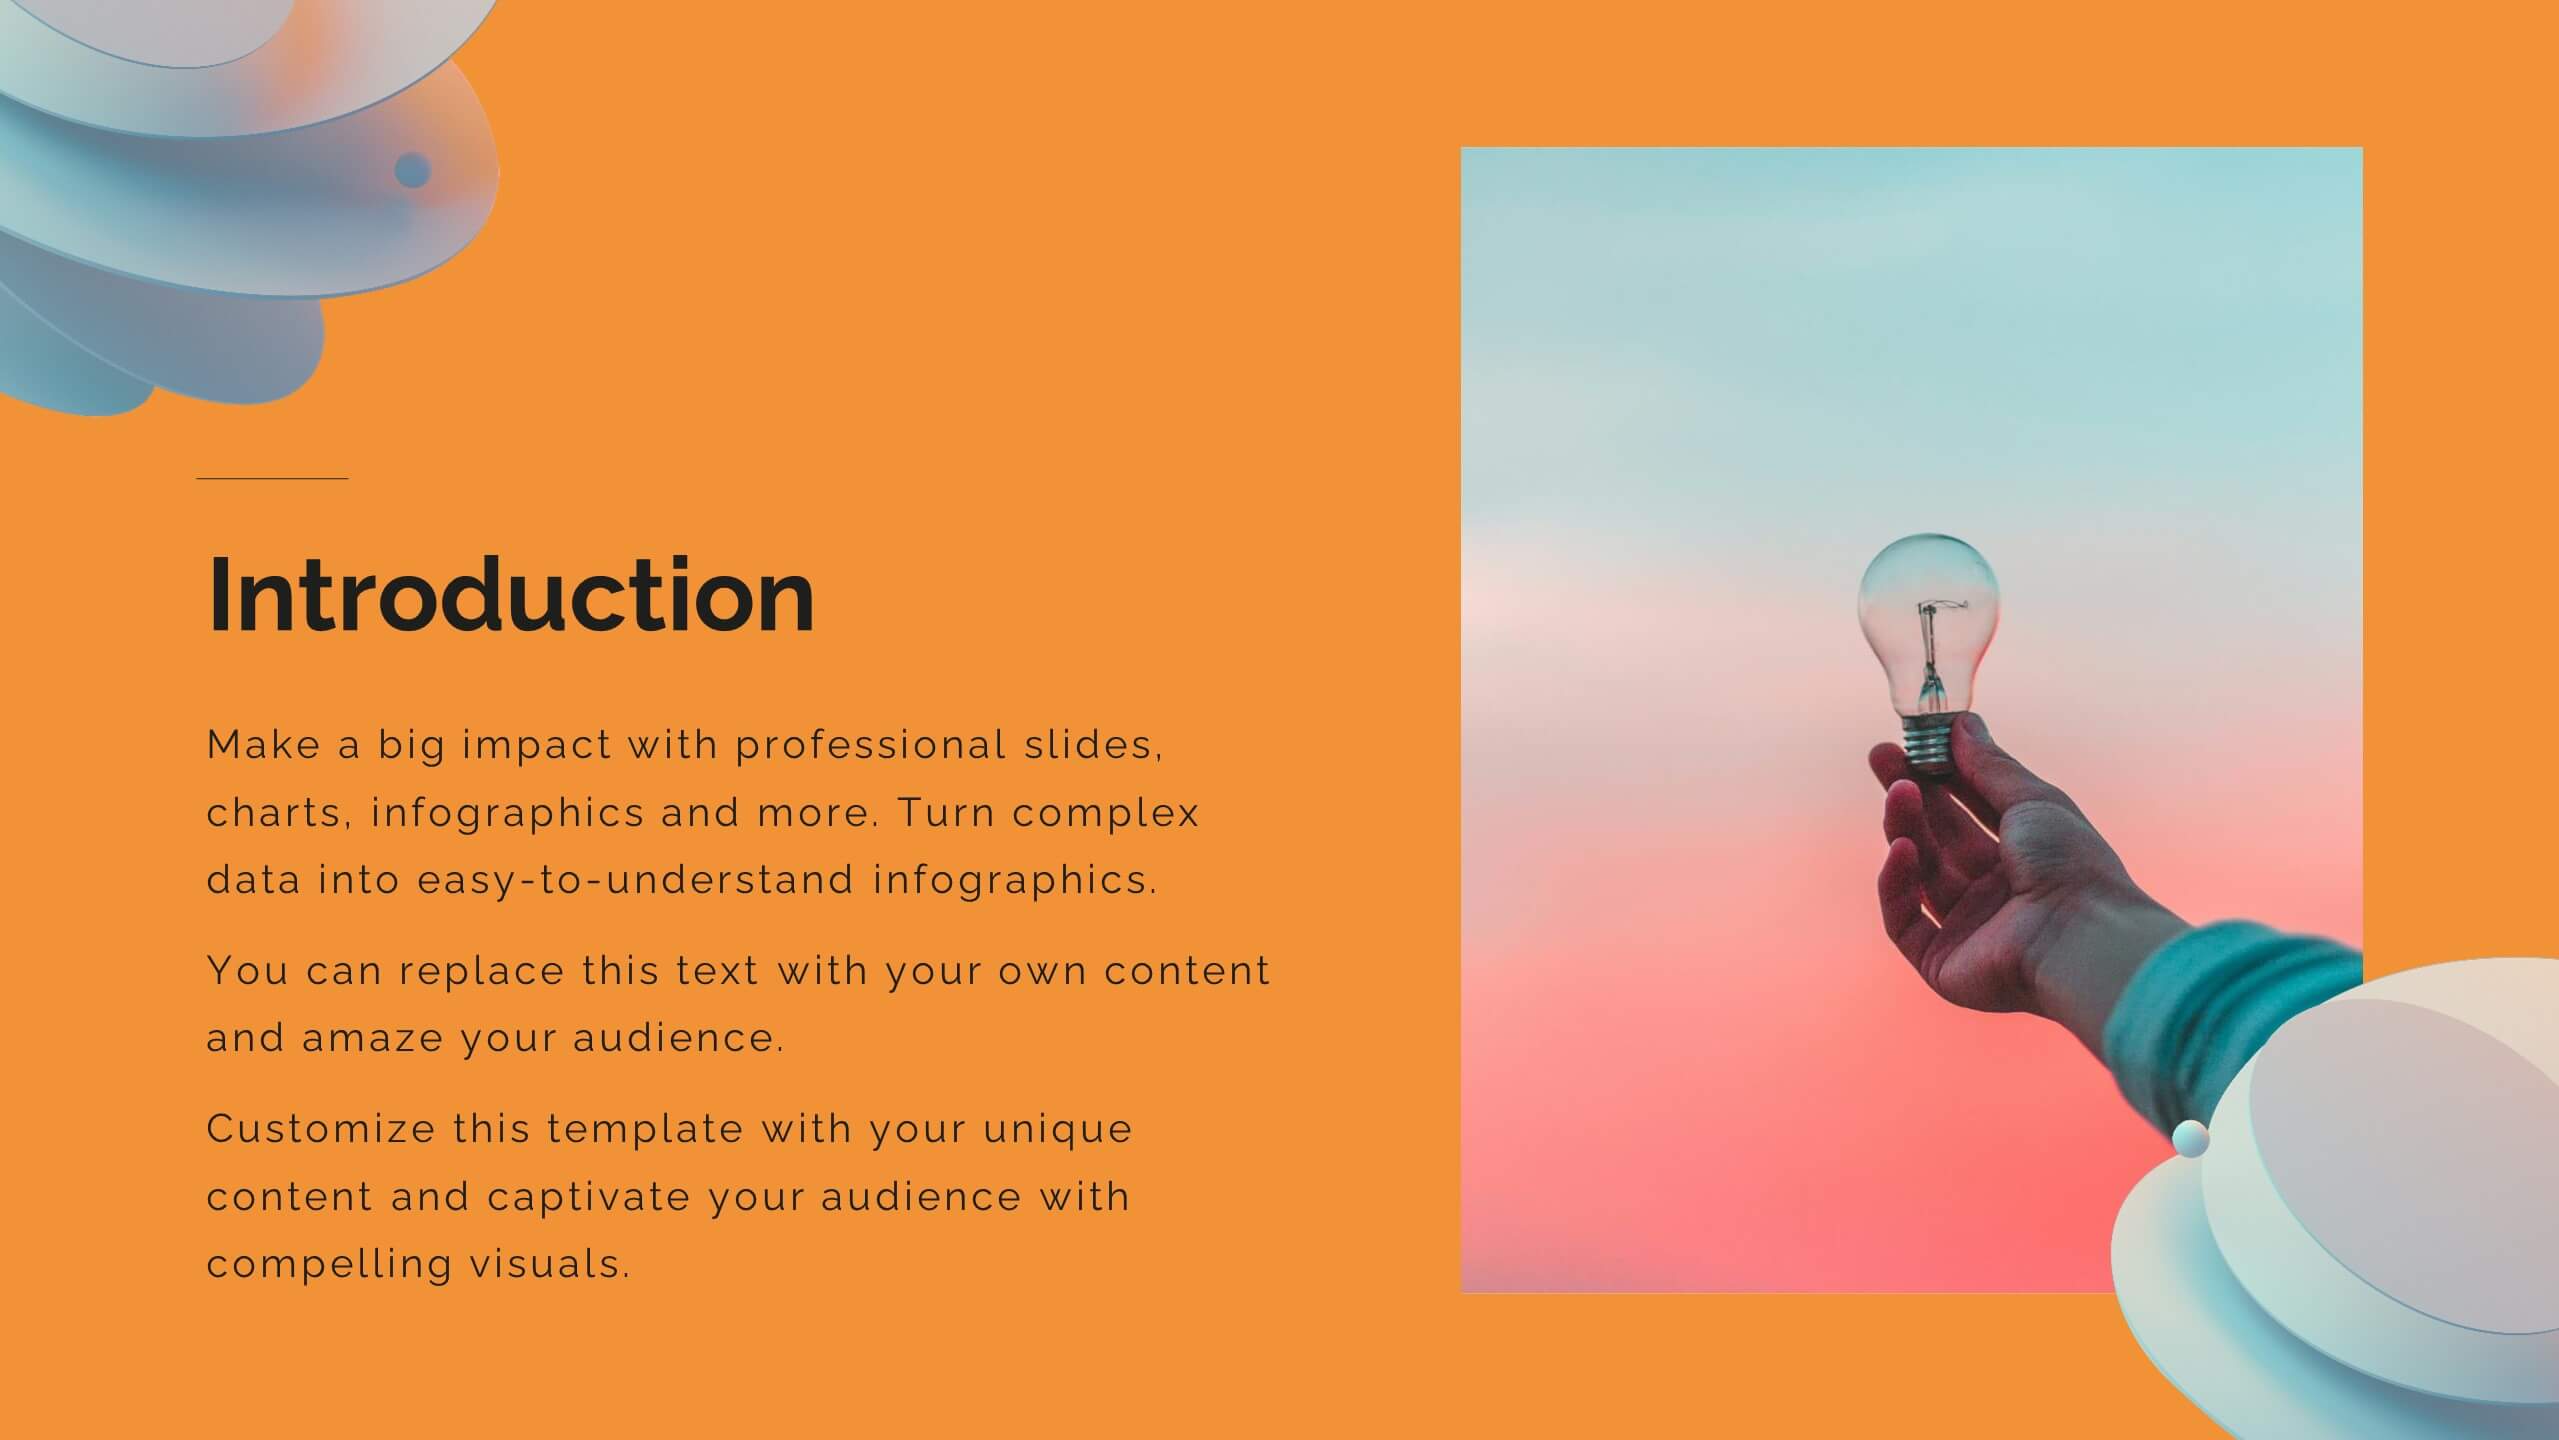
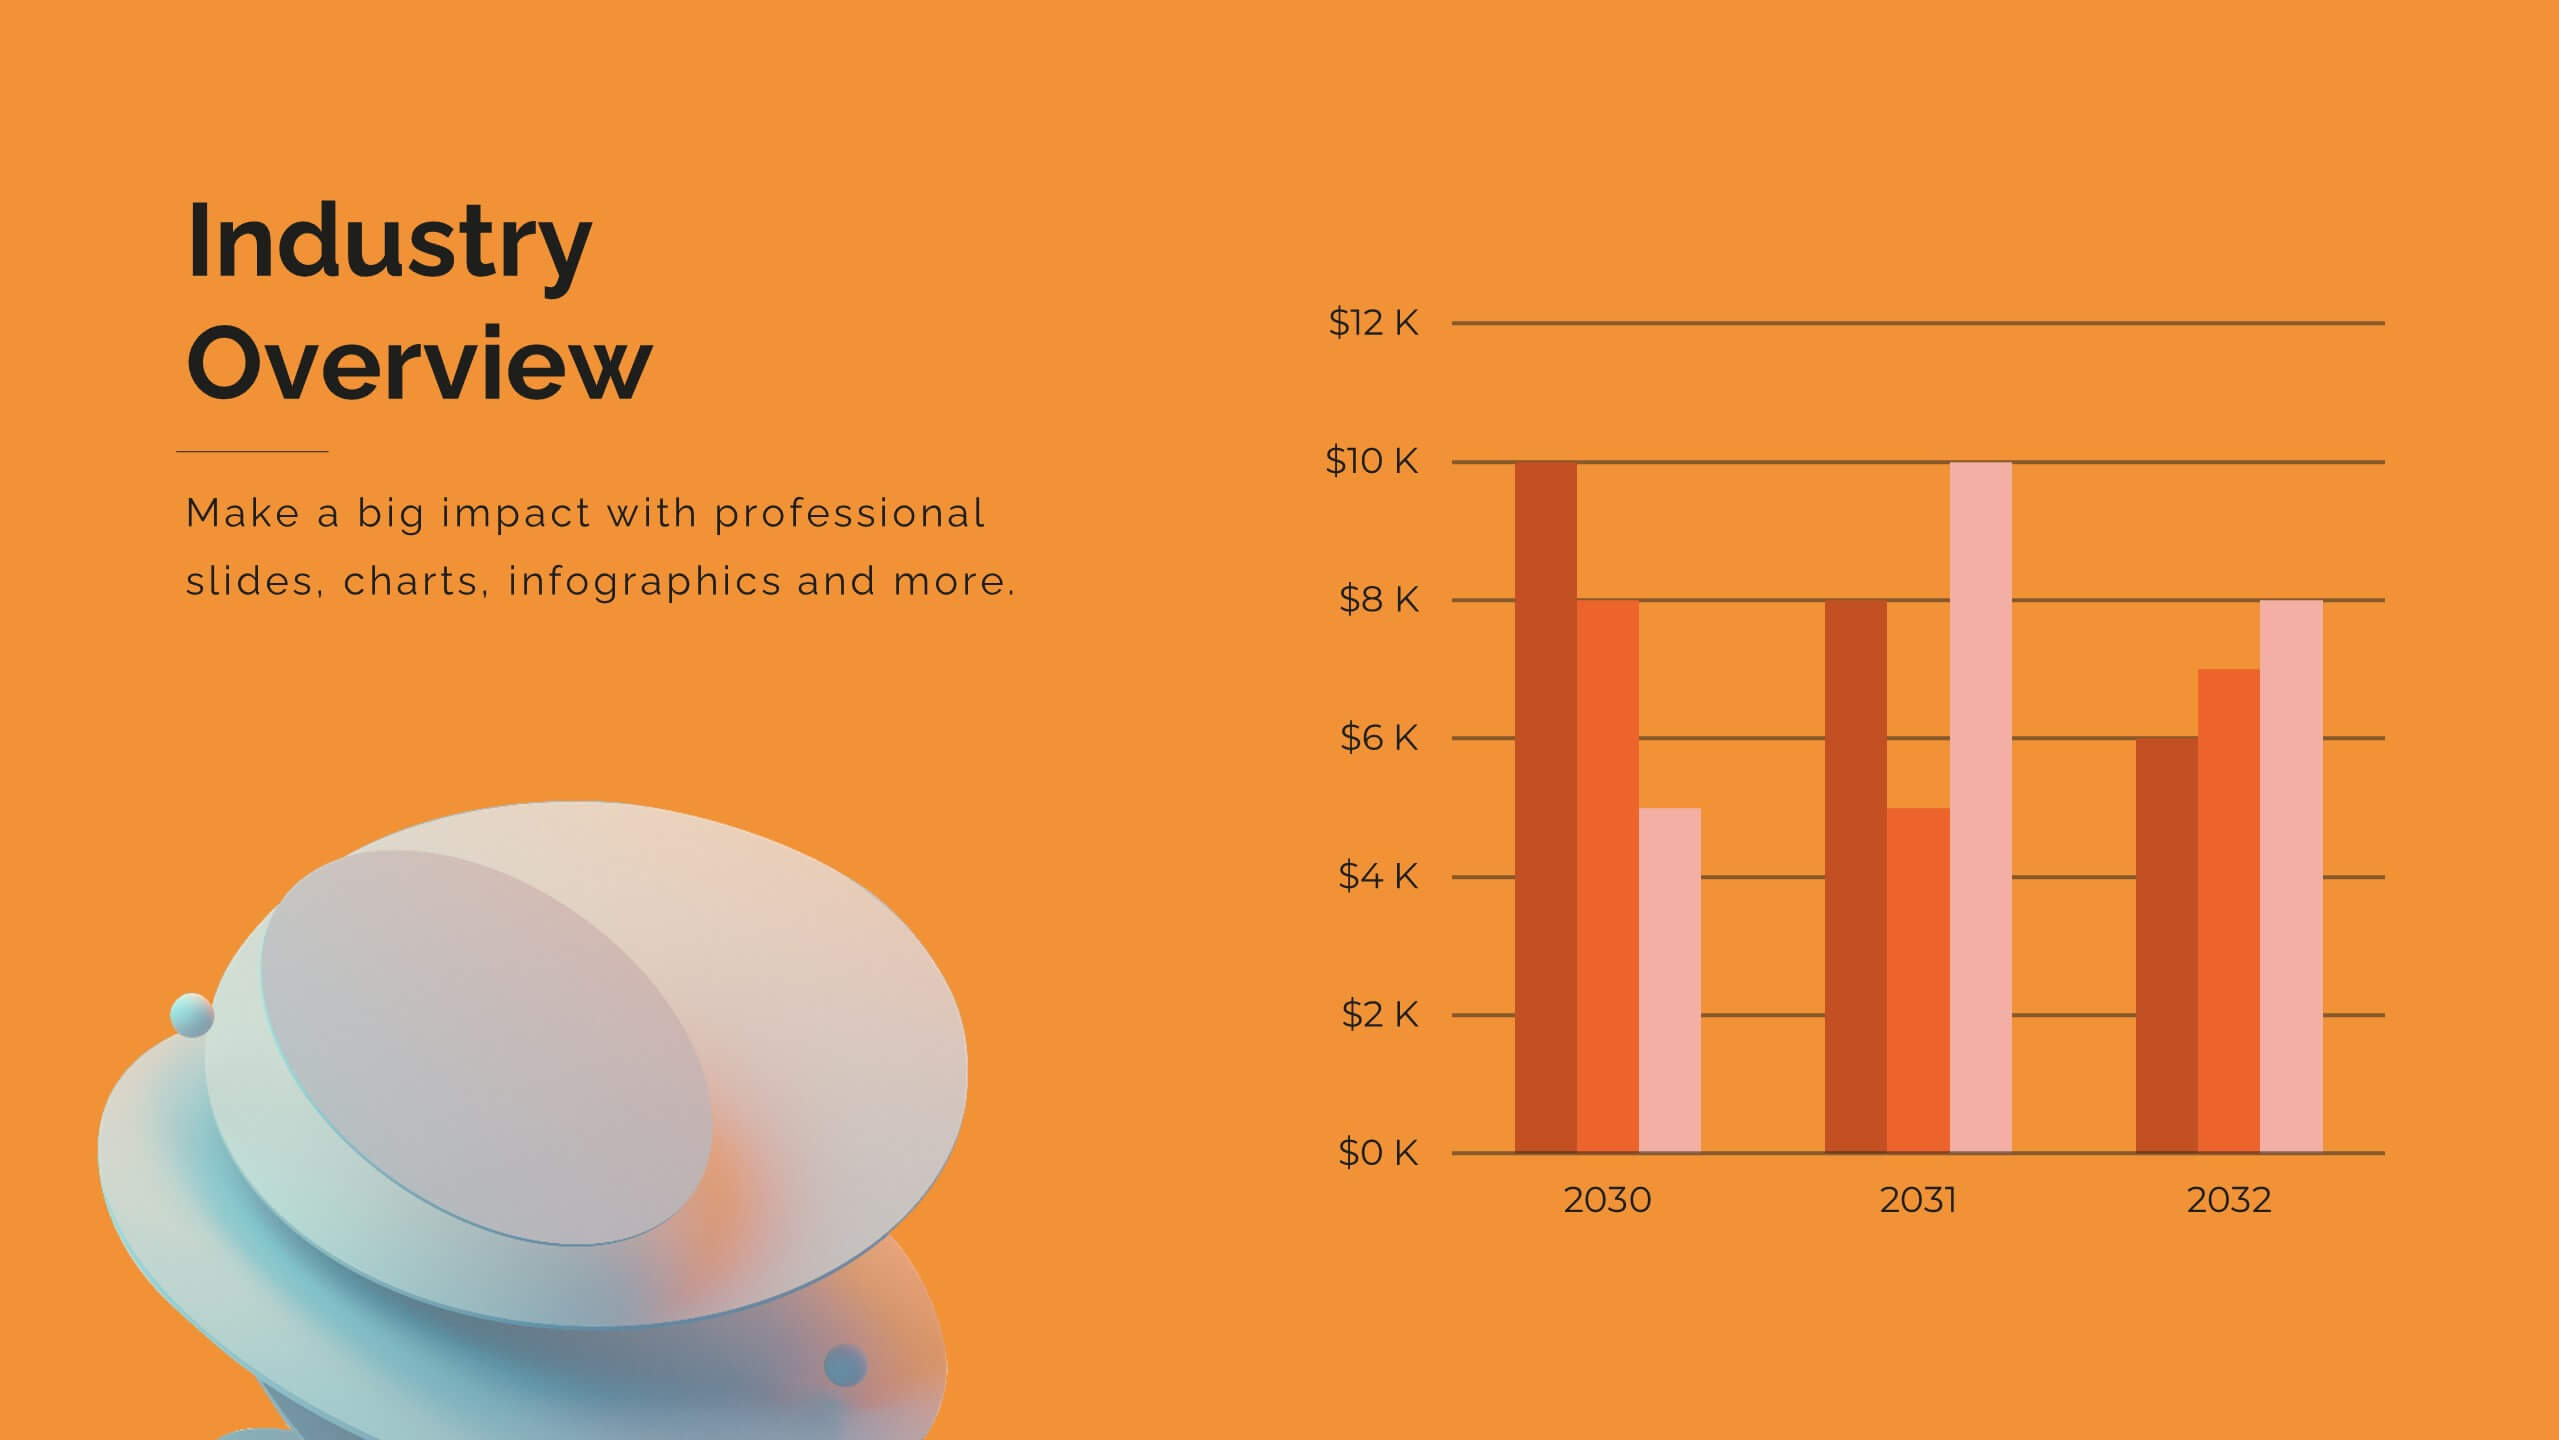
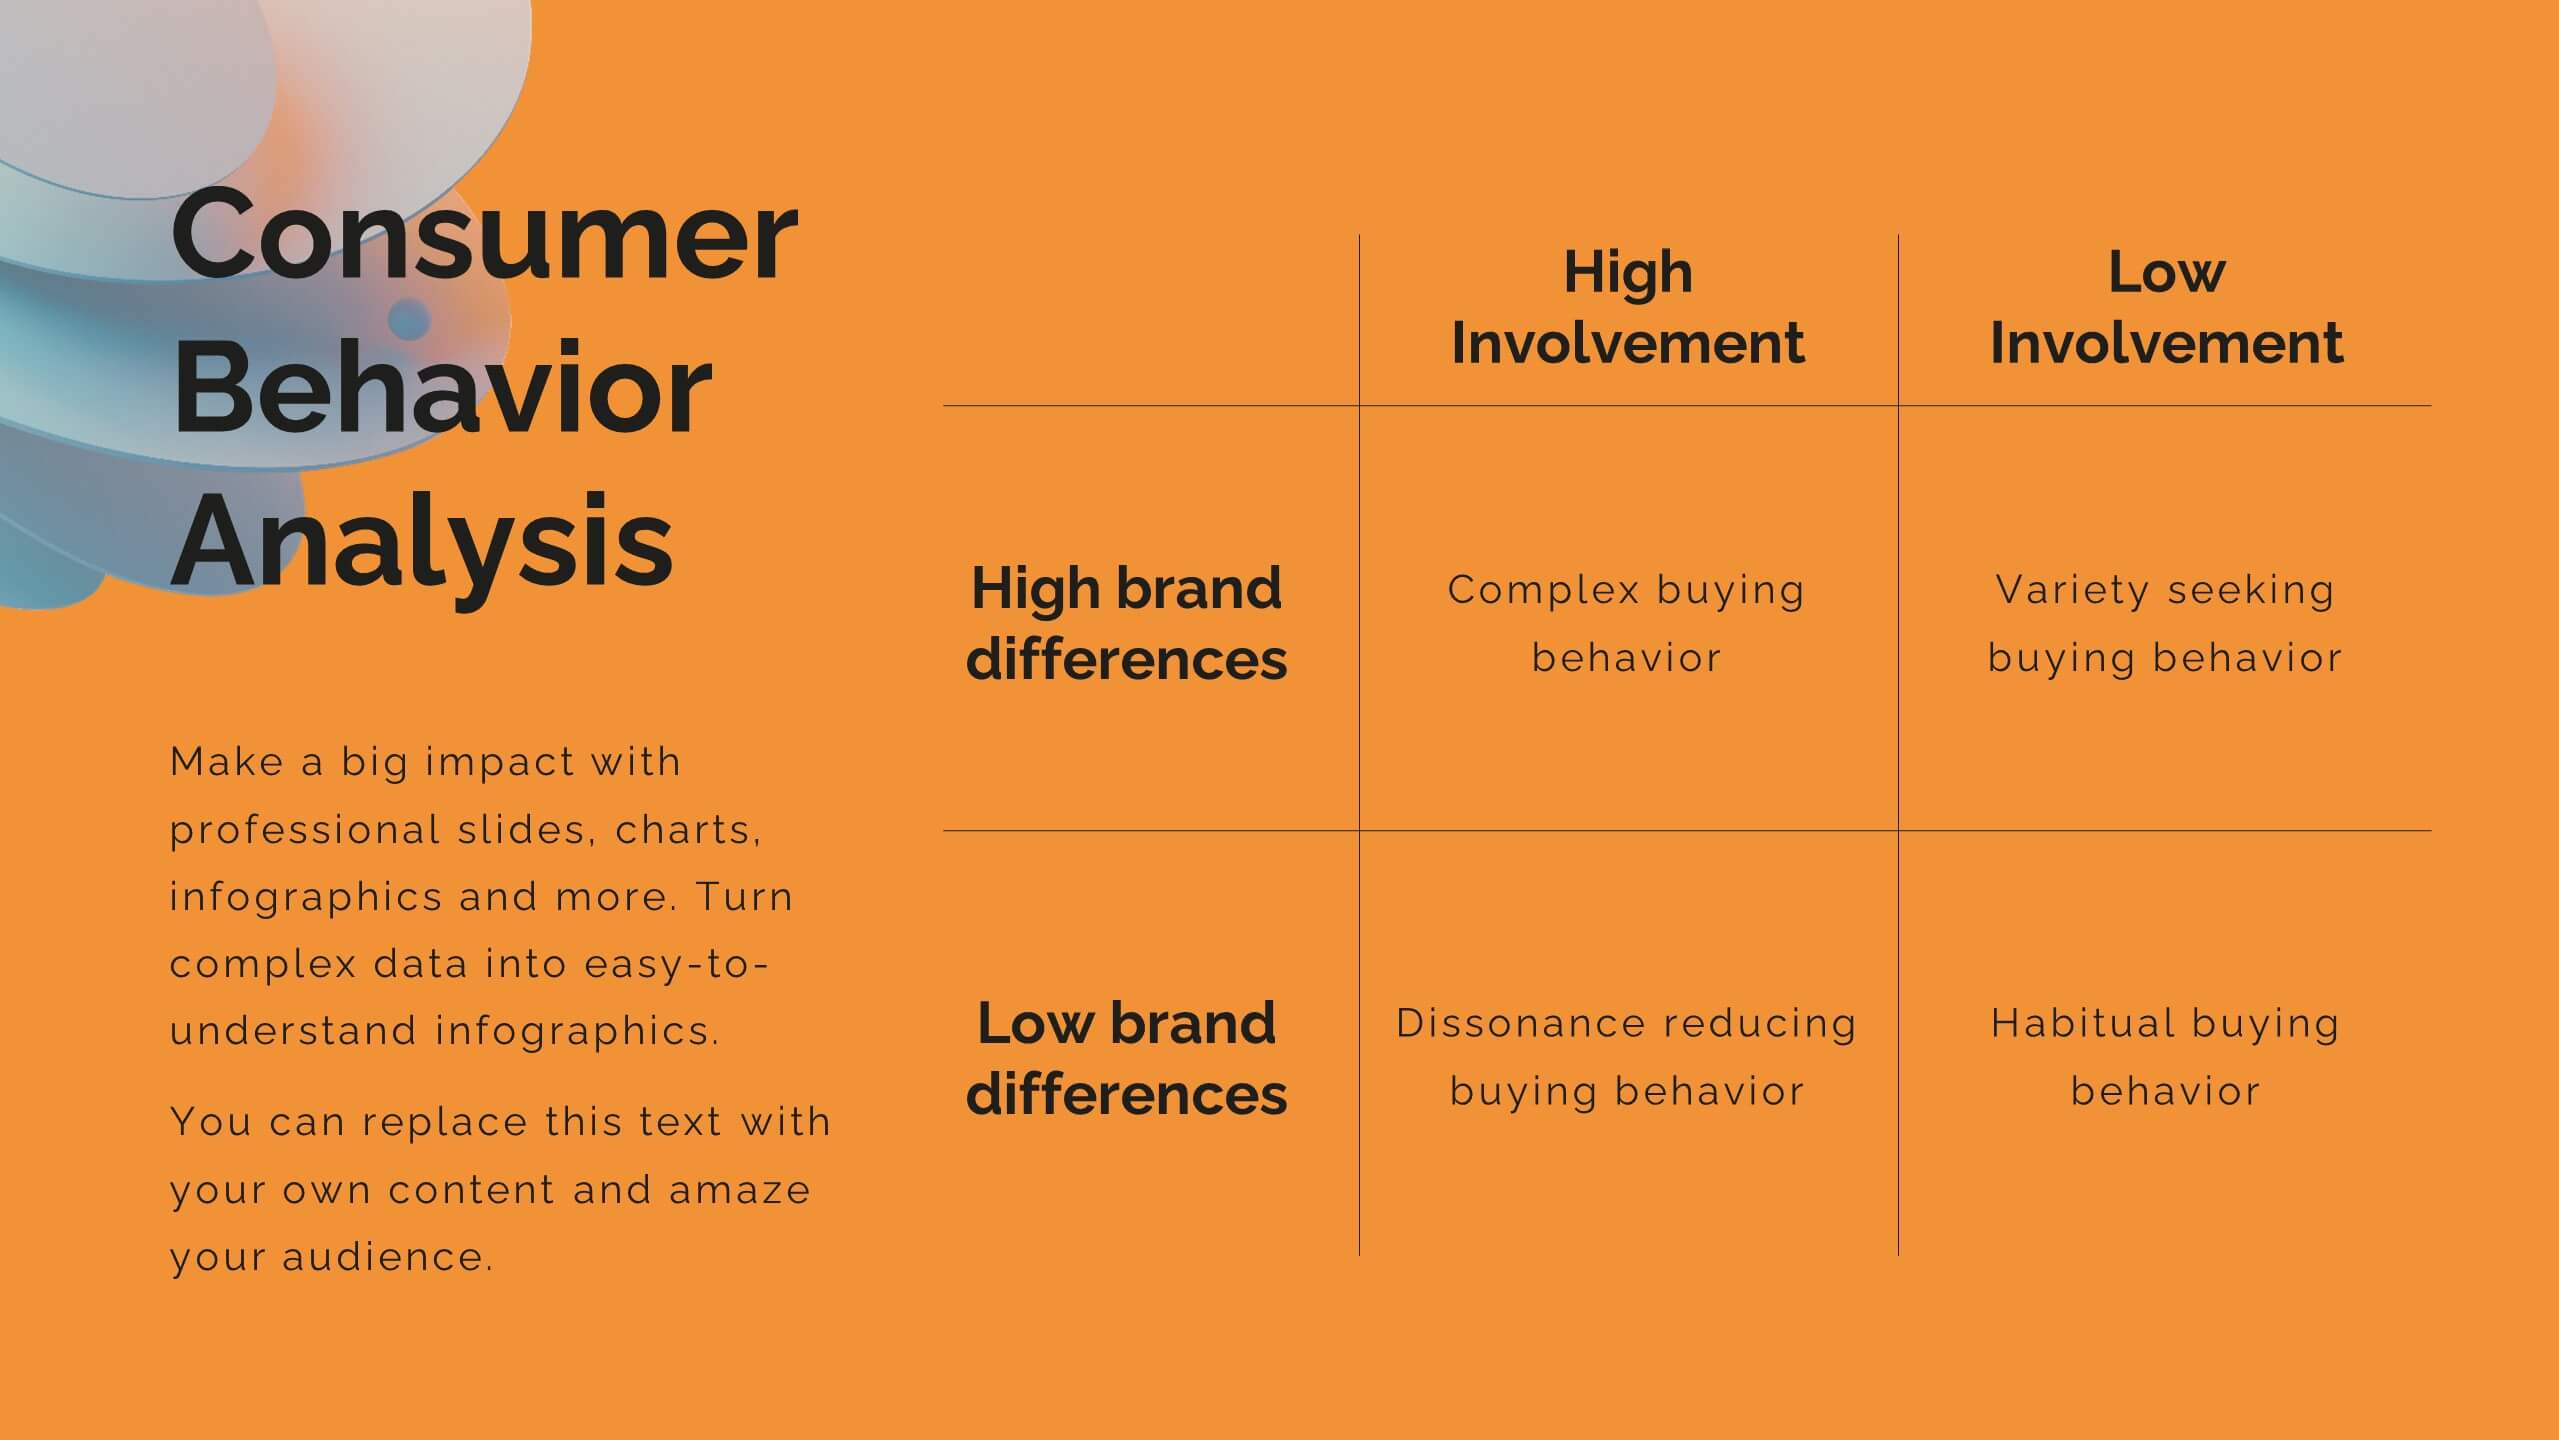
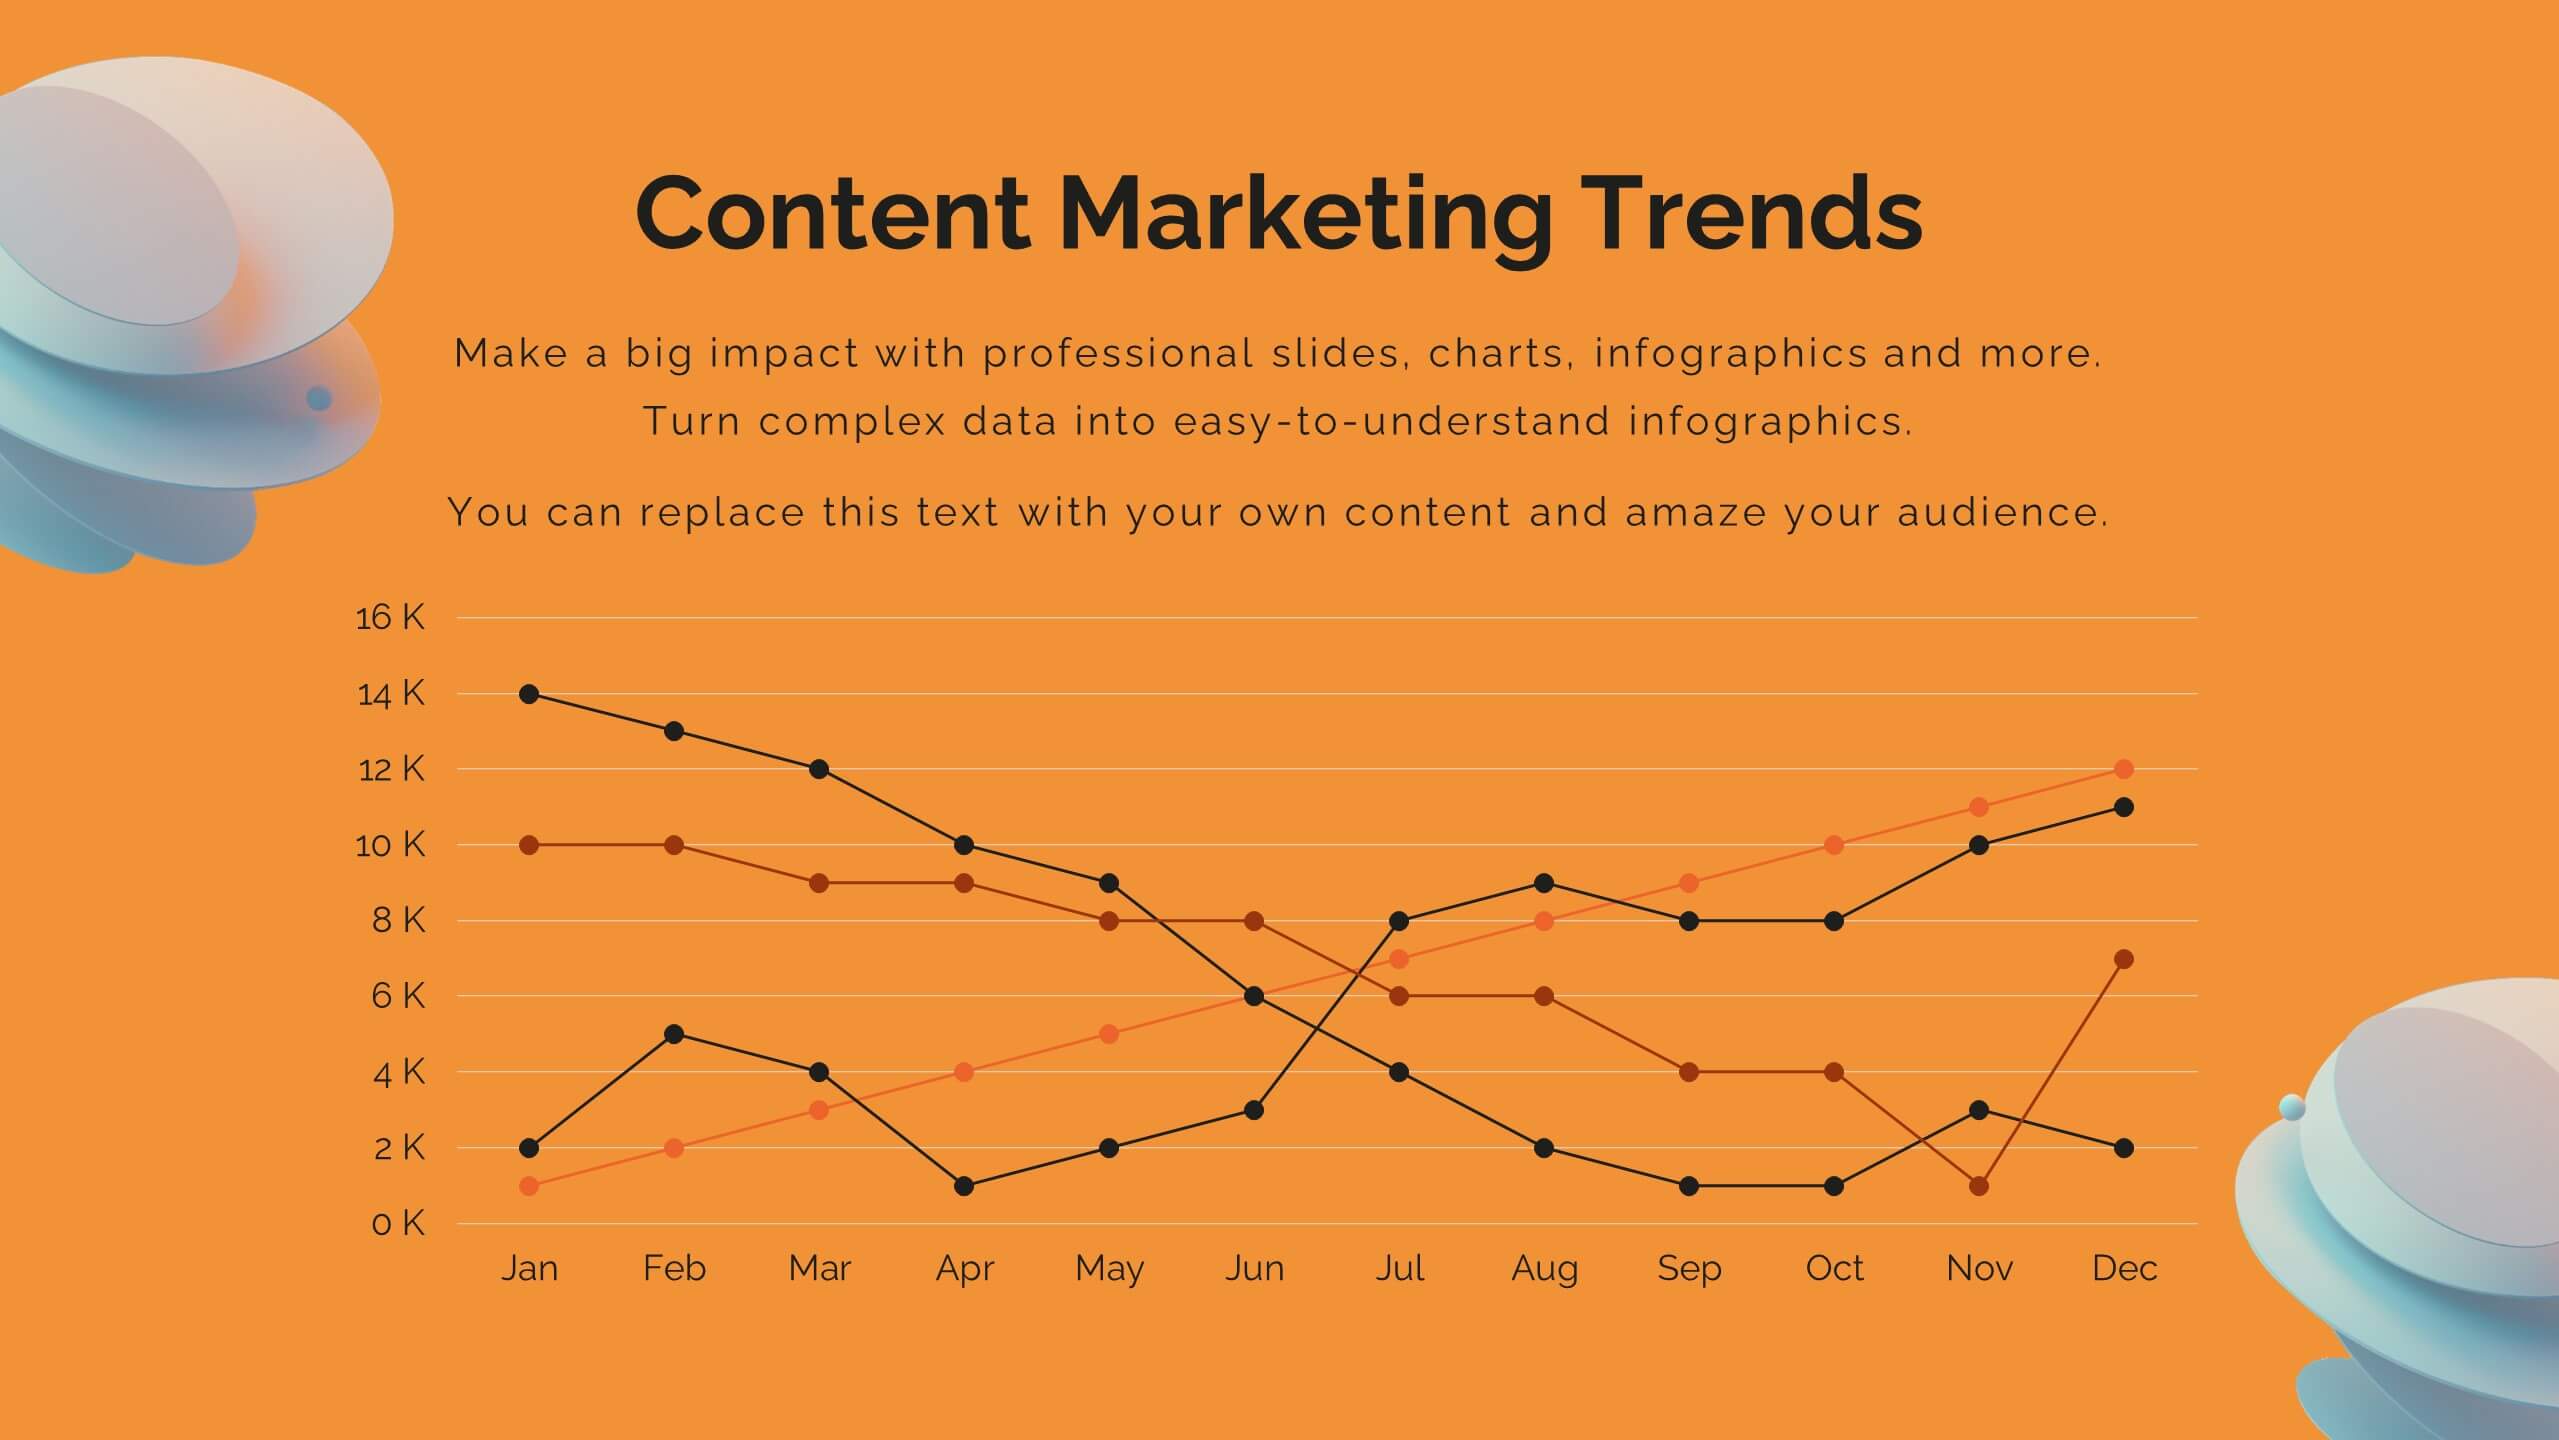
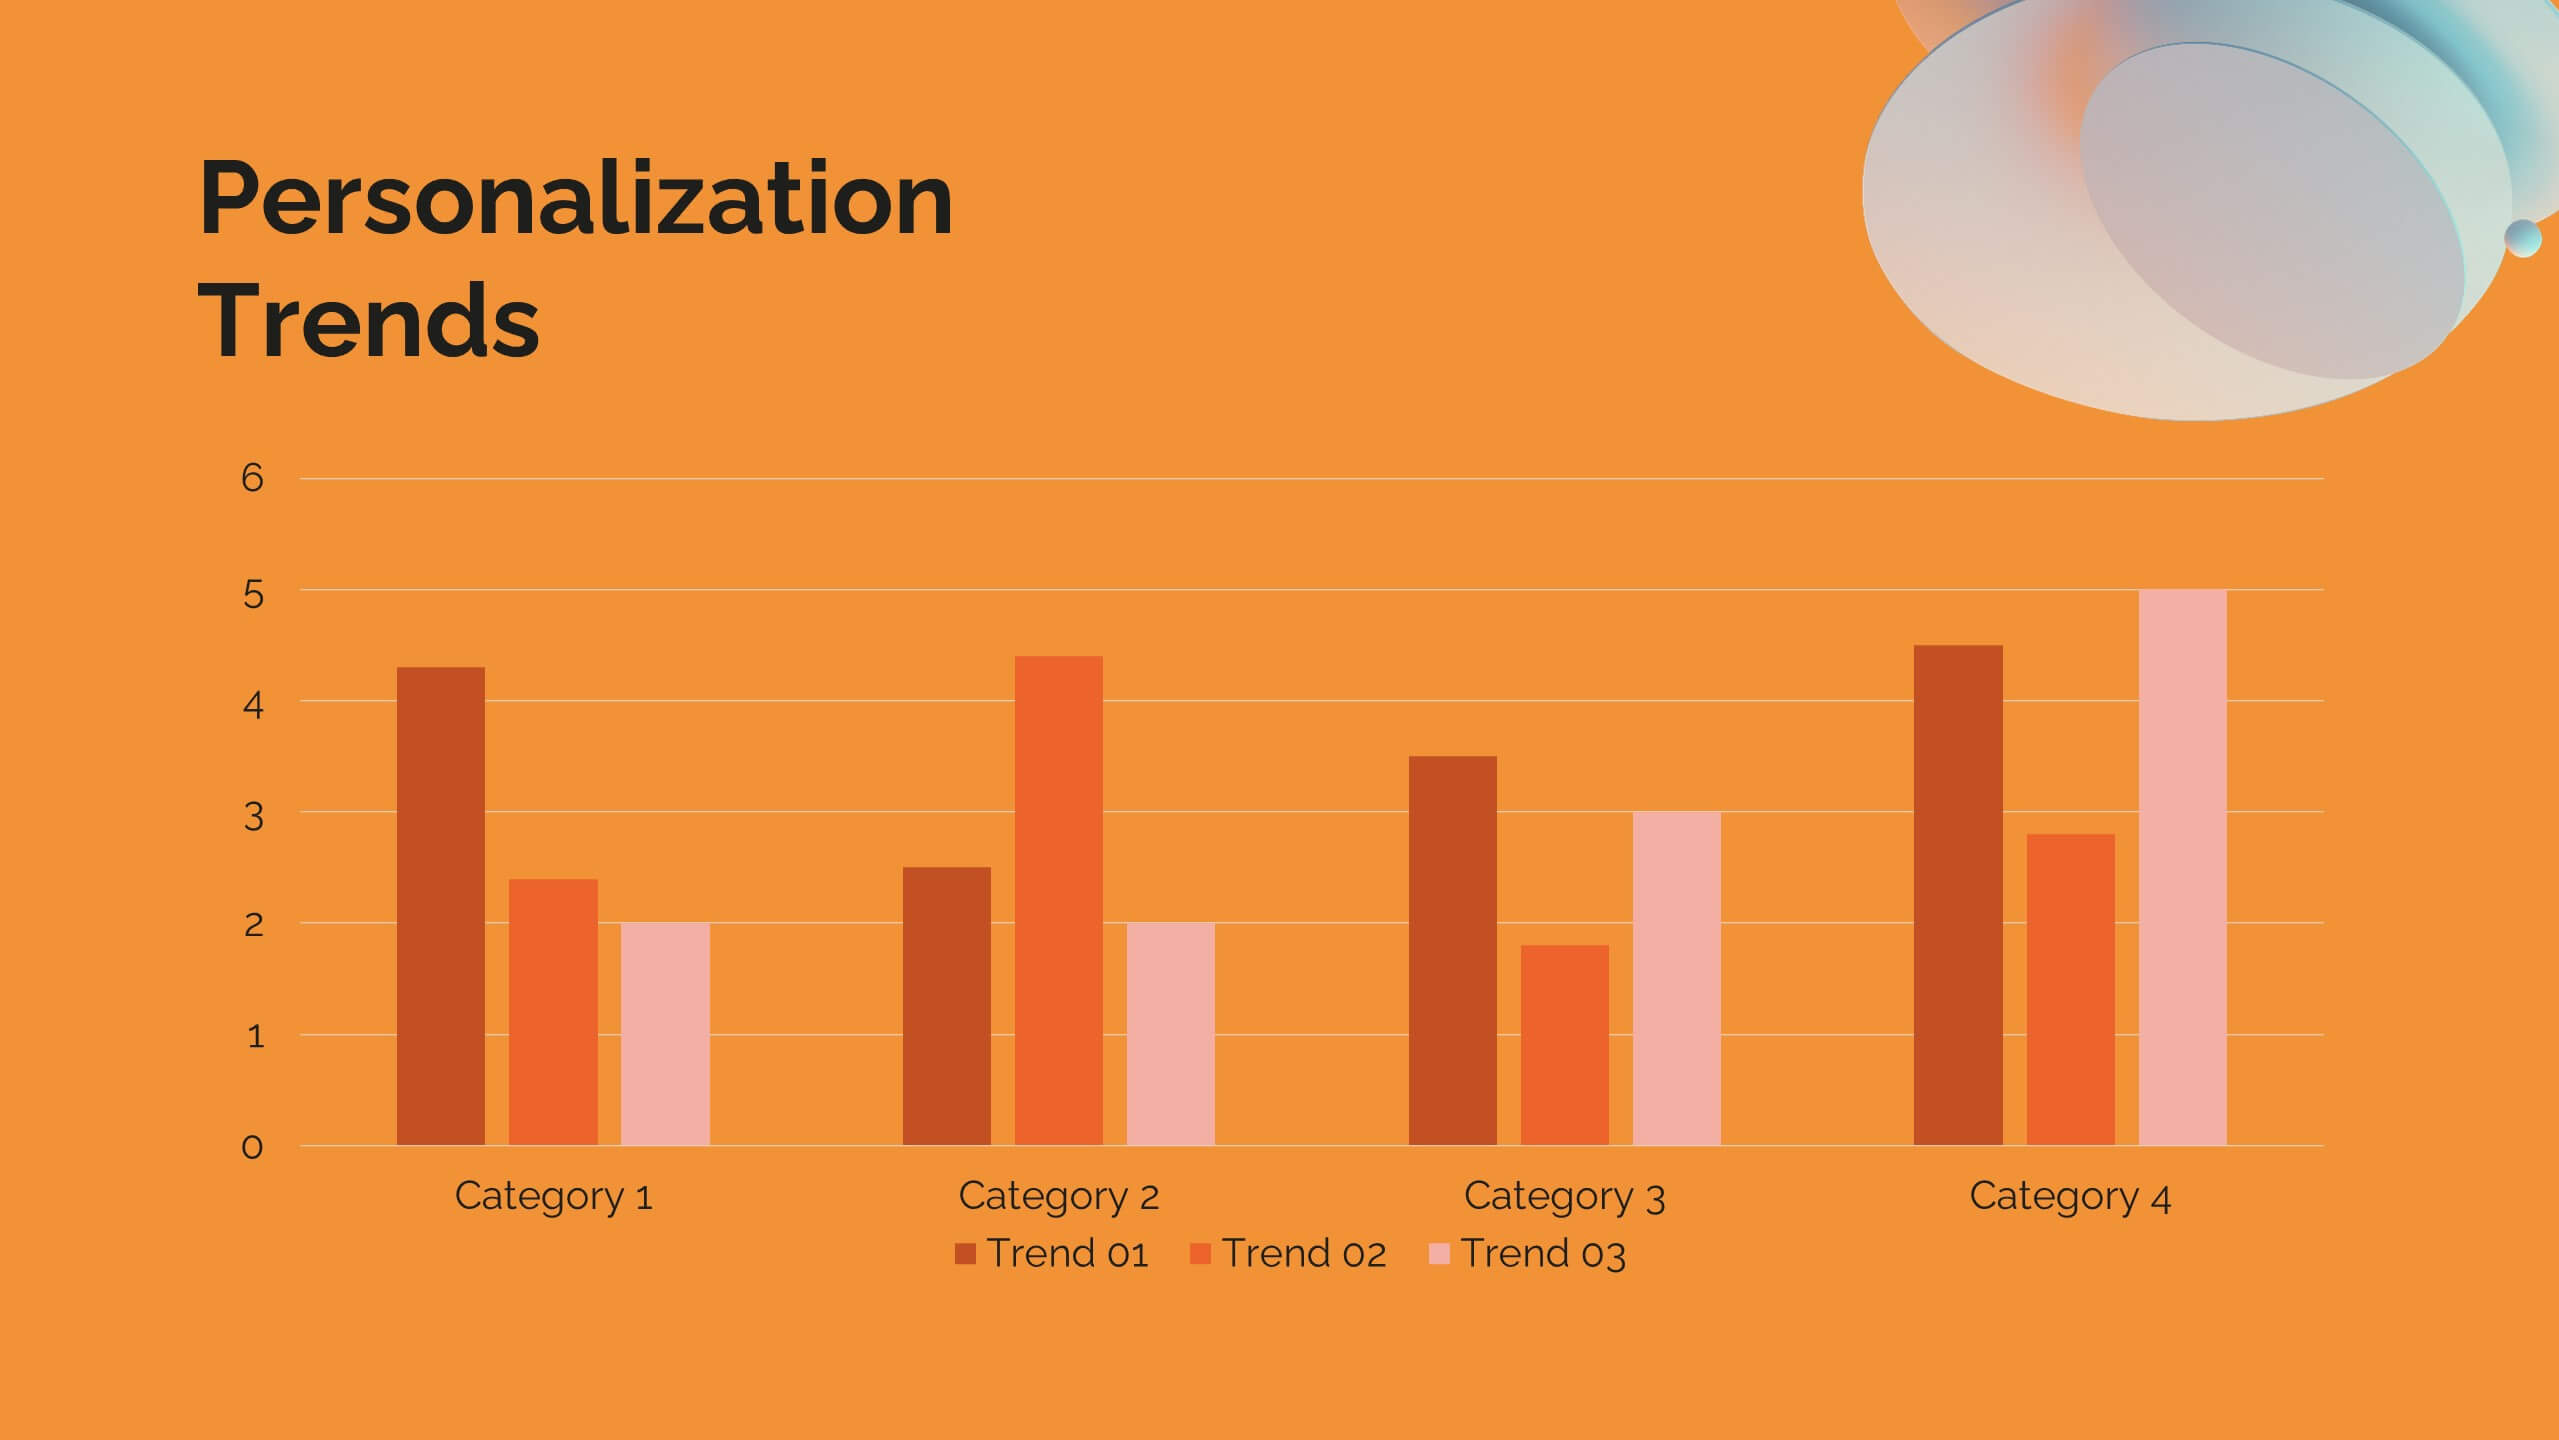
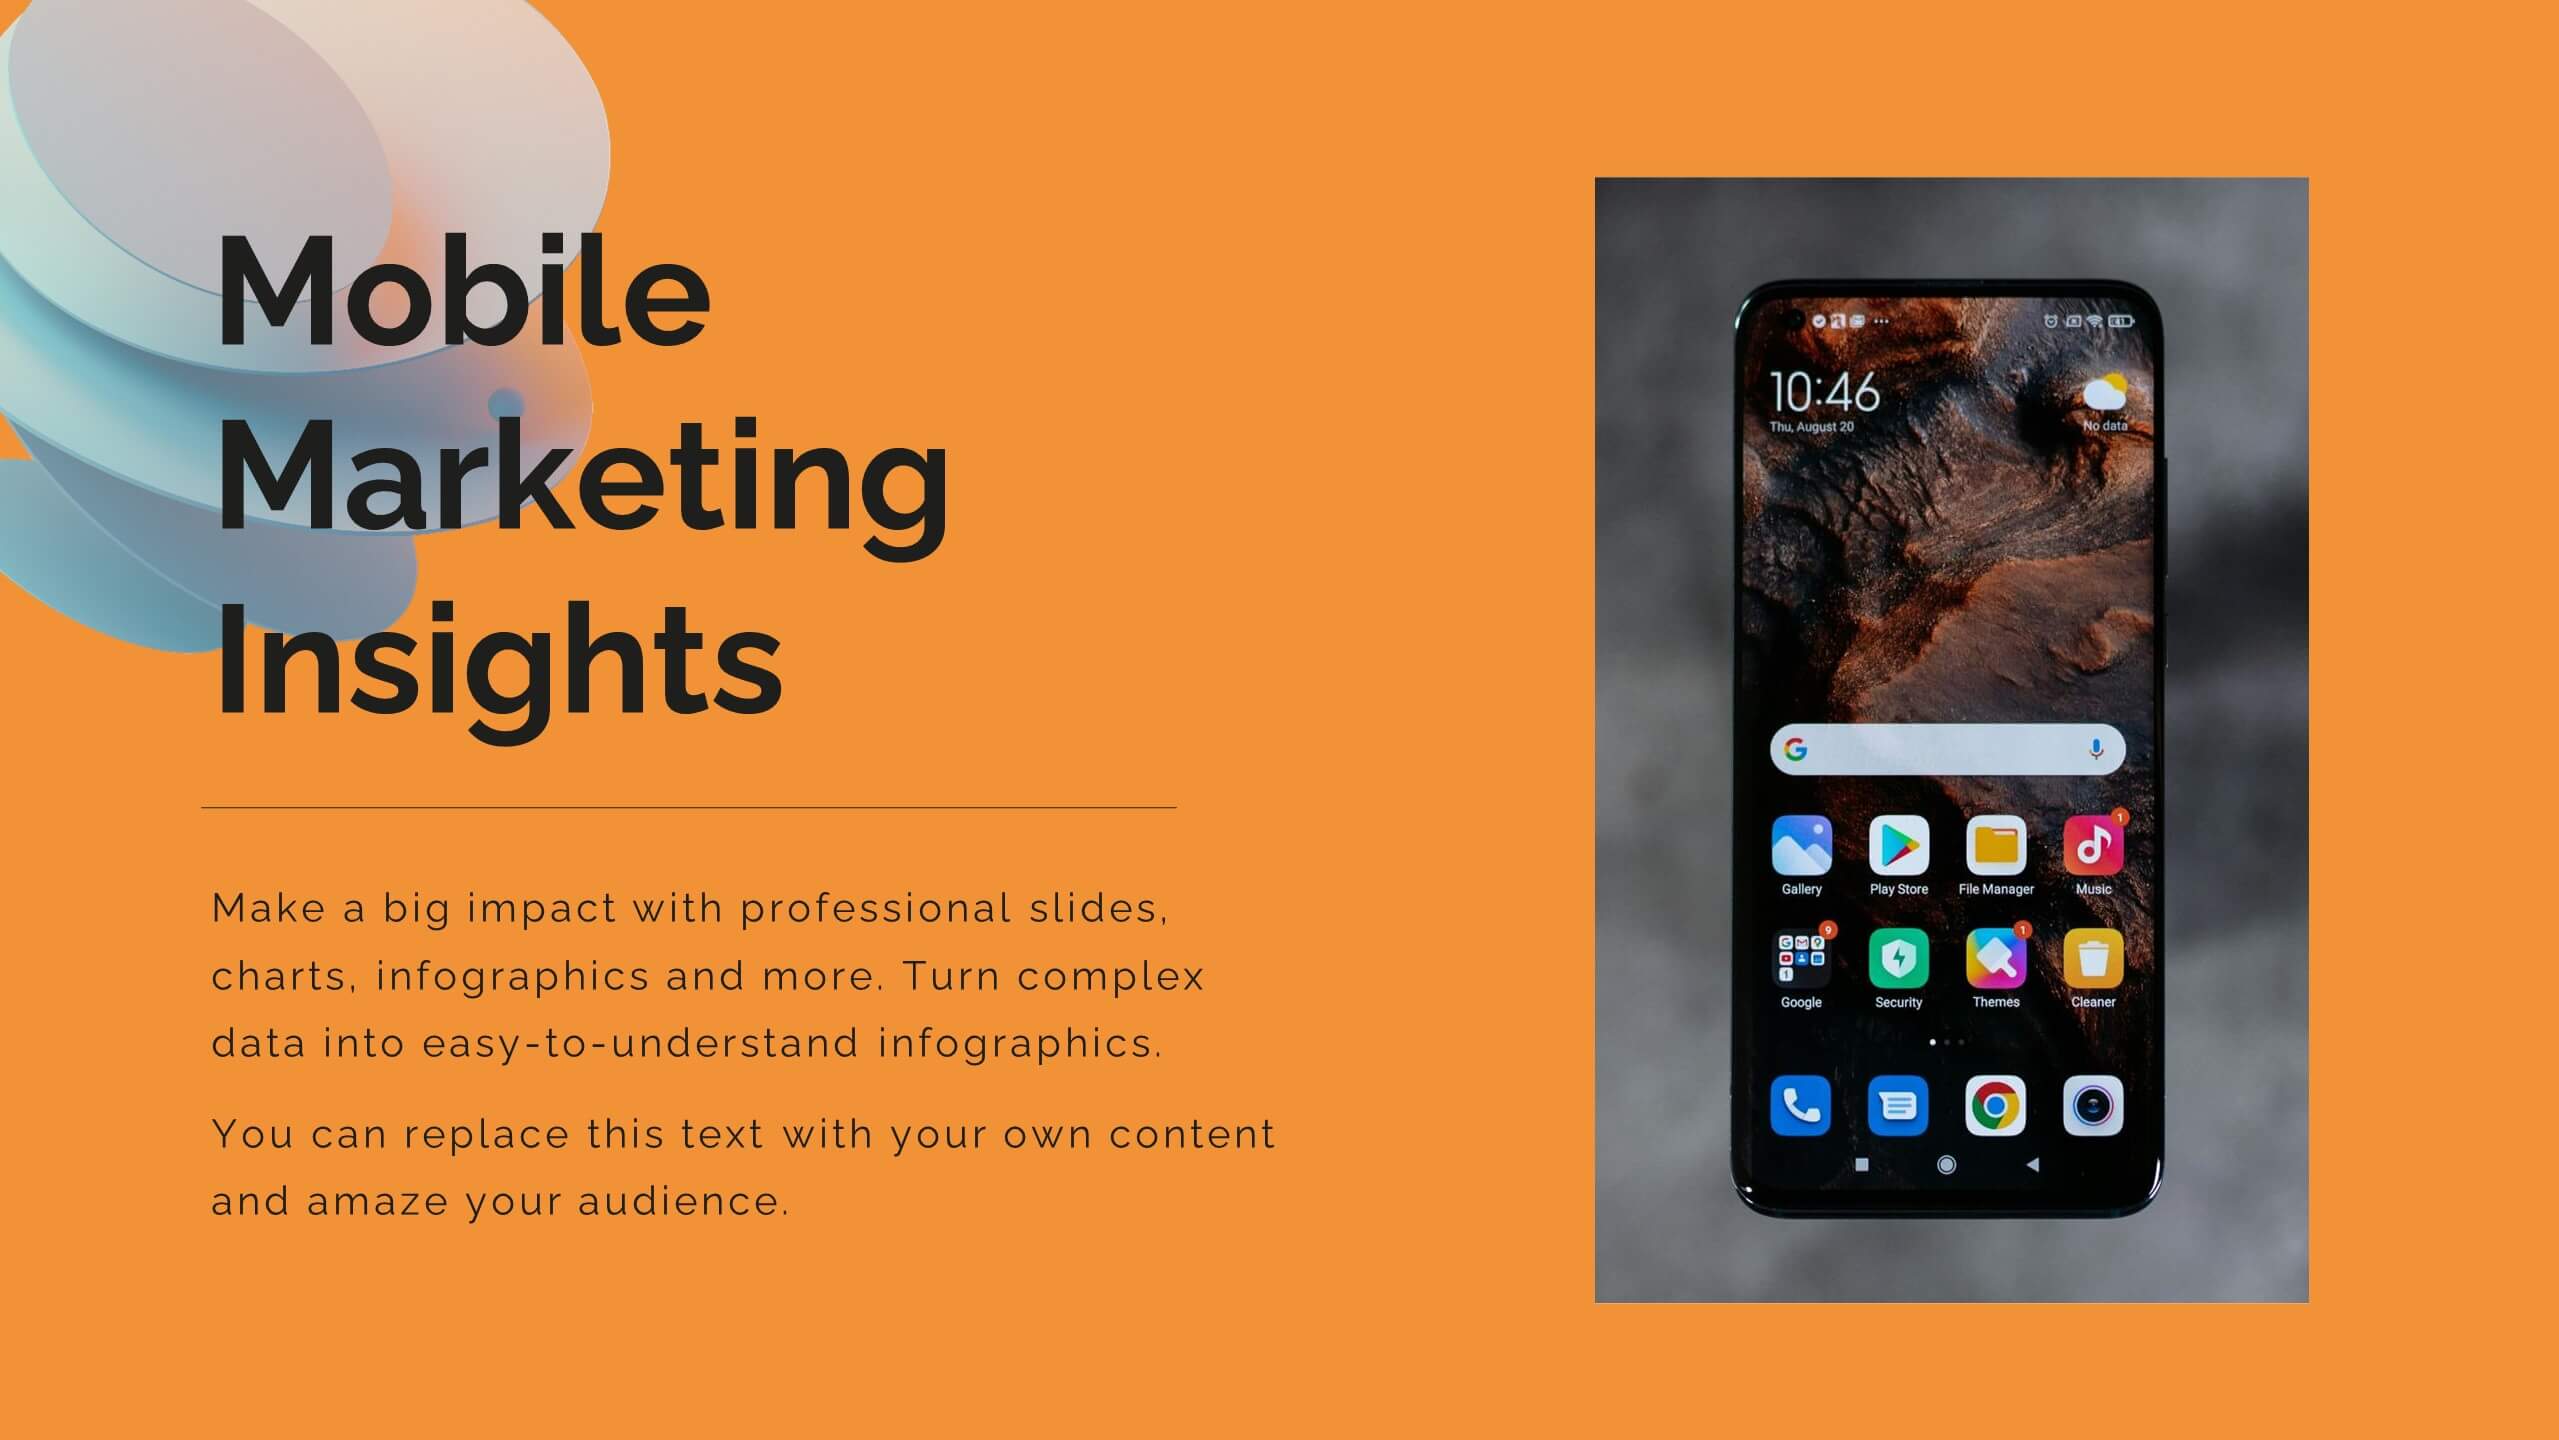
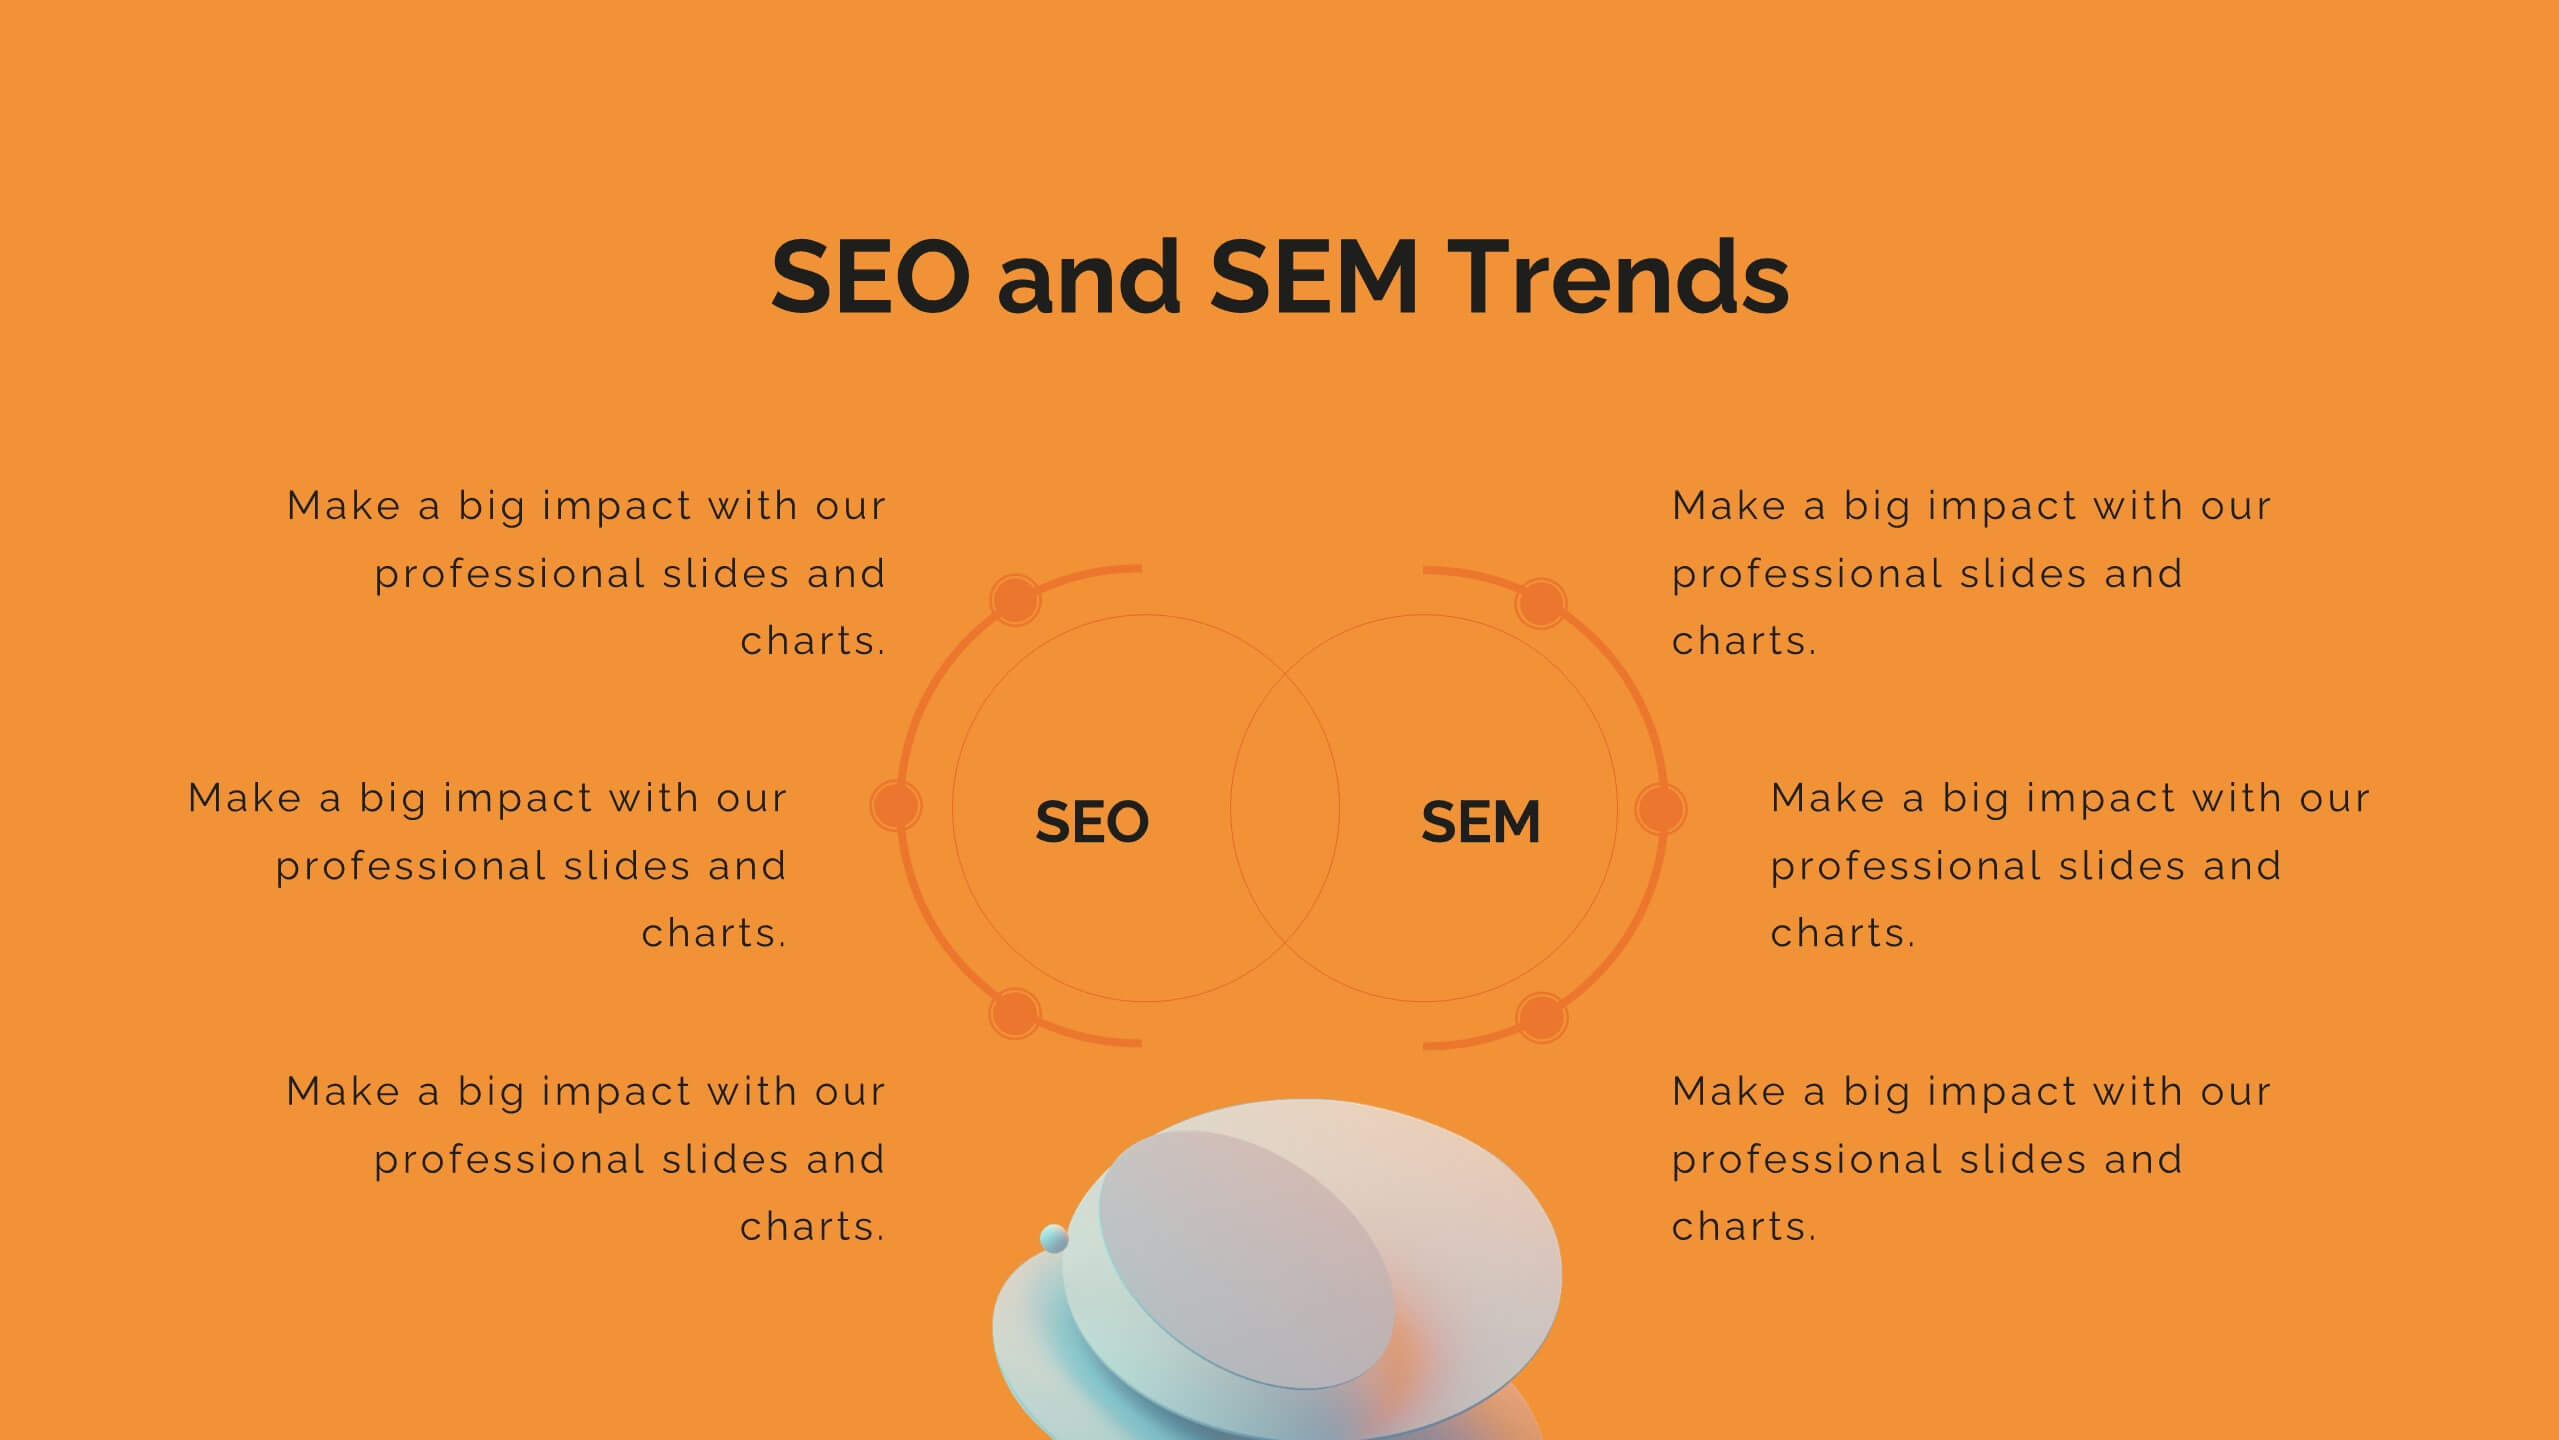
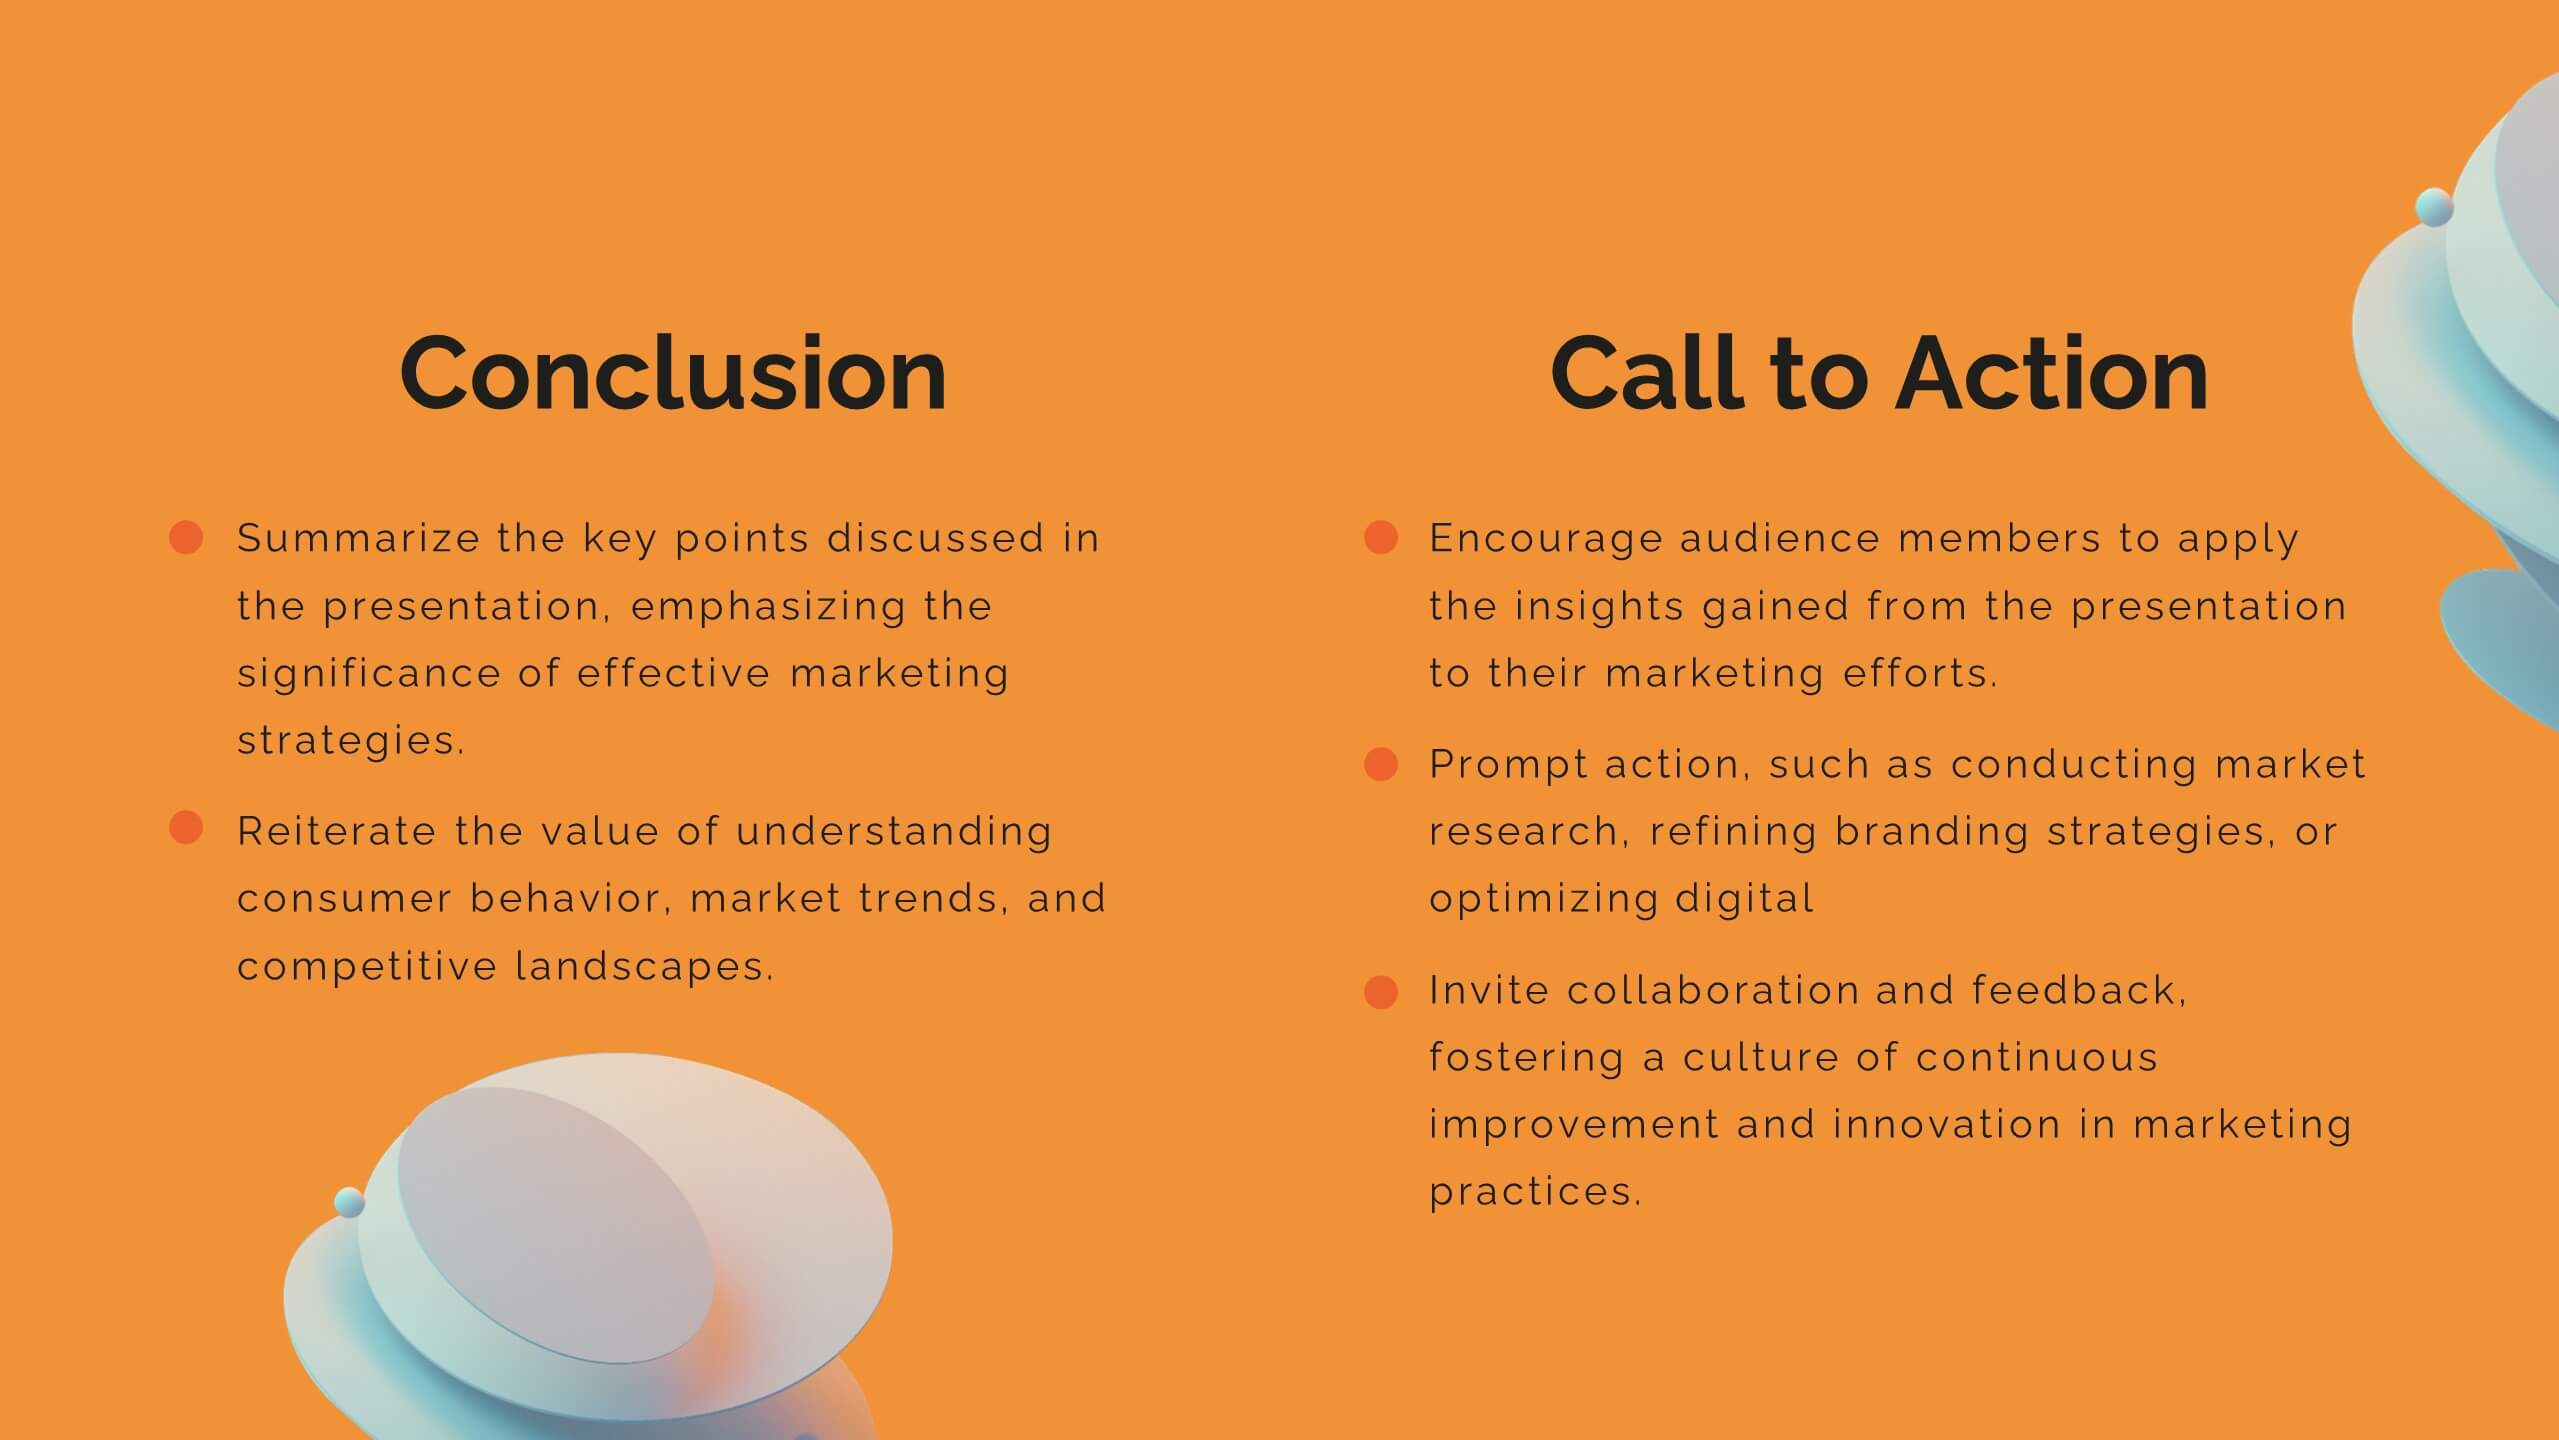
Breeze Content Marketing Pitch Deck Presentation
Elevate your content marketing strategy with this vibrant pitch deck! Perfect for outlining industry trends, consumer behavior, and innovative techniques. Ideal for marketers aiming to impress clients and stakeholders. Compatible with PowerPoint, Keynote, and Google Slides, this template ensures your pitch is engaging, persuasive, and professional. Achieve marketing success today!


4 diapositivas
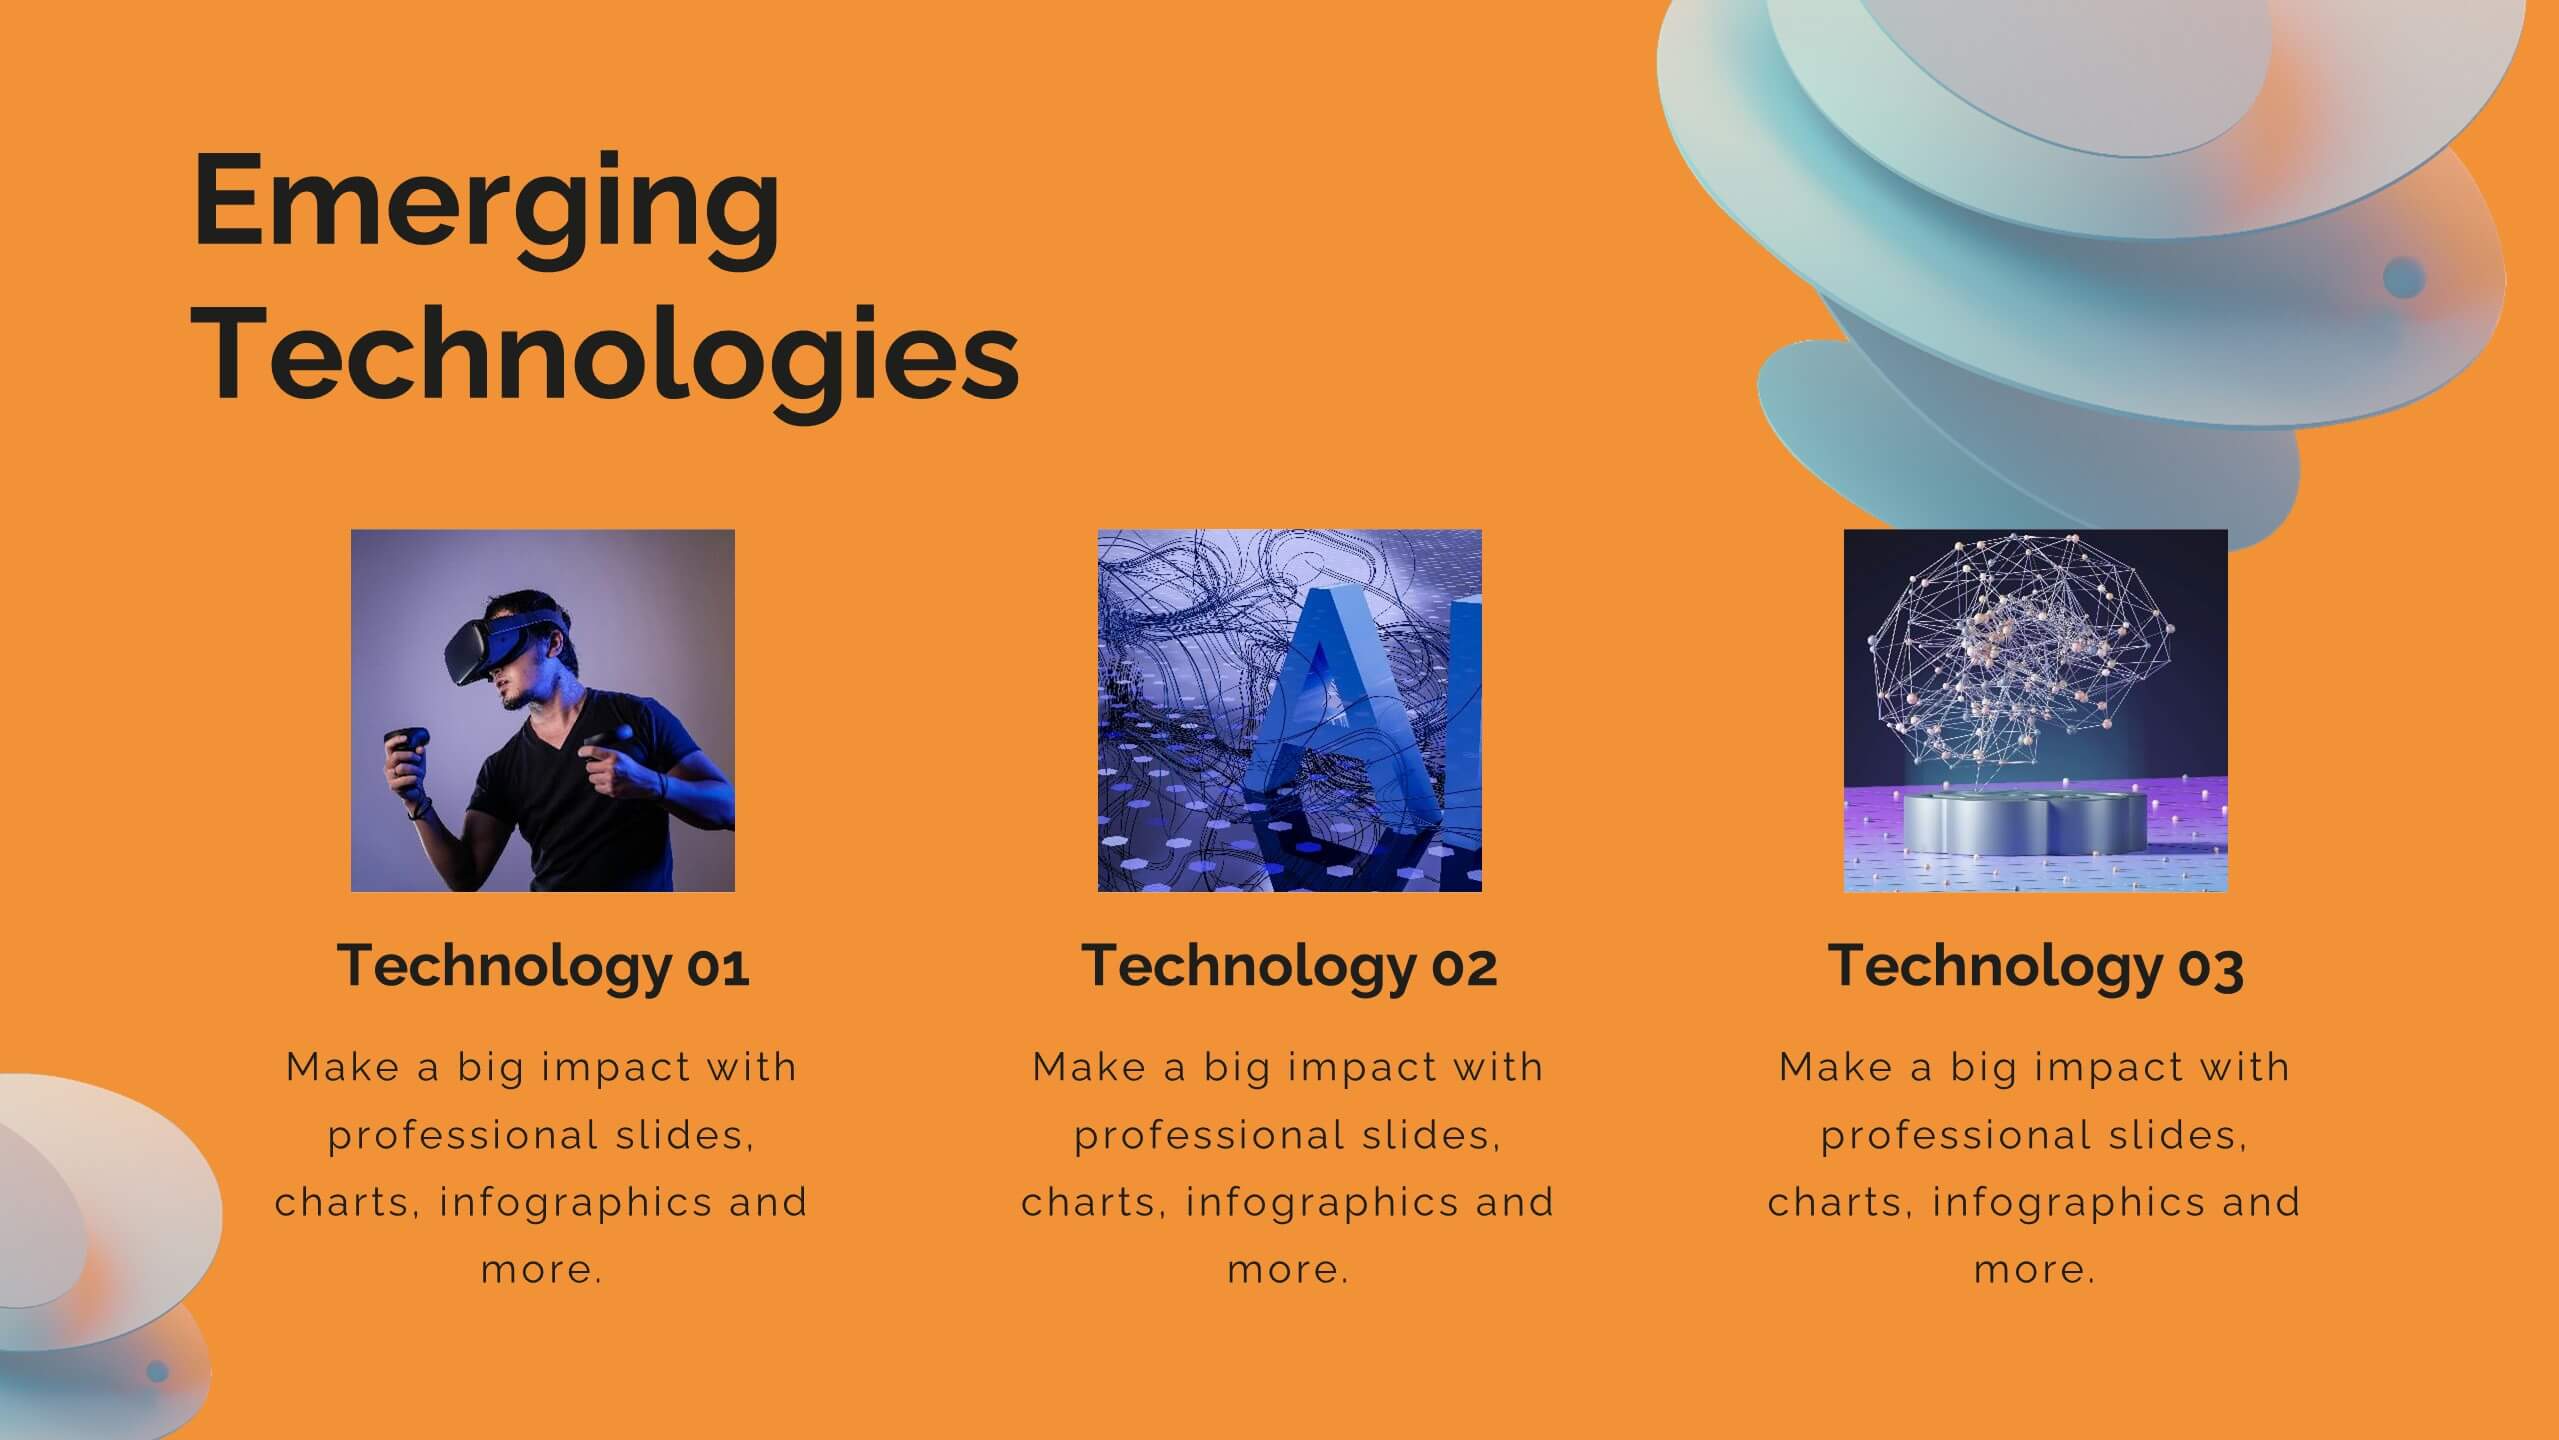
Machine Learning Overviews Presentation
Bring your audience into the world of intelligent automation with a bold, visual layout that makes complex concepts feel simple and engaging. This presentation breaks down key processes, workflows, and insights using clear graphics that support your message. Fully customizable and compatible with PowerPoint, Keynote, and Google Slides.


30 diapositivas
Fusoria Brand Guidelines Proposal Presentation
Build a strong and cohesive brand identity with this sleek and professional brand guidelines proposal presentation. Covering essential topics like typography, color palettes, visual direction, and branding principles, this template helps you define and communicate your brand’s essence. Fully customizable and compatible with PowerPoint, Keynote, and Google Slides for a seamless presentation experience.


6 diapositivas
Seven Factors for Business Success Presentation
Present key drivers of business success with this visually balanced 7-element diagram. Featuring Systems, Structure, Strategy, Skills, Staff, Style, and Shared Value, this slide is ideal for strategic planning and leadership presentations. Fully customizable in PowerPoint, Keynote, and Google Slides to match your branding and presentation objectives.


7 diapositivas
Property Market Forecast and Trends Presentation
Present your real estate insights clearly with this Property Market Forecast and Trends Presentation. Featuring a central isometric house graphic surrounded by six editable segments, this layout is perfect for highlighting key indicators like market trends, pricing shifts, and investment zones. Use the icons and color-coded areas to enhance clarity. Ideal for housing reports and investor decks. Fully compatible with PowerPoint, Canva, Keynote, and Google Slides.


5 diapositivas
Comprehensive Sex Education Infographics
Navigate the sensitive landscape of human sexuality education with our comprehensive sex education infographics. Cast on a canvas of bold colors like black, yellow, and red, these infographics delicately handle the topics inherent to sex education. This tool is invaluable for educators, health professionals, advocacy groups, and policymakers who champion for informed, safe, and healthy choices. Compatible with Powerpoint, Keynote, and Google Slides. Ensuring the content resonates with audiences of diverse ages and backgrounds. The inclusion of compelling graphics and intuitive icons, fosters an environment of learning and openness, essential for impactful discussions.


6 diapositivas
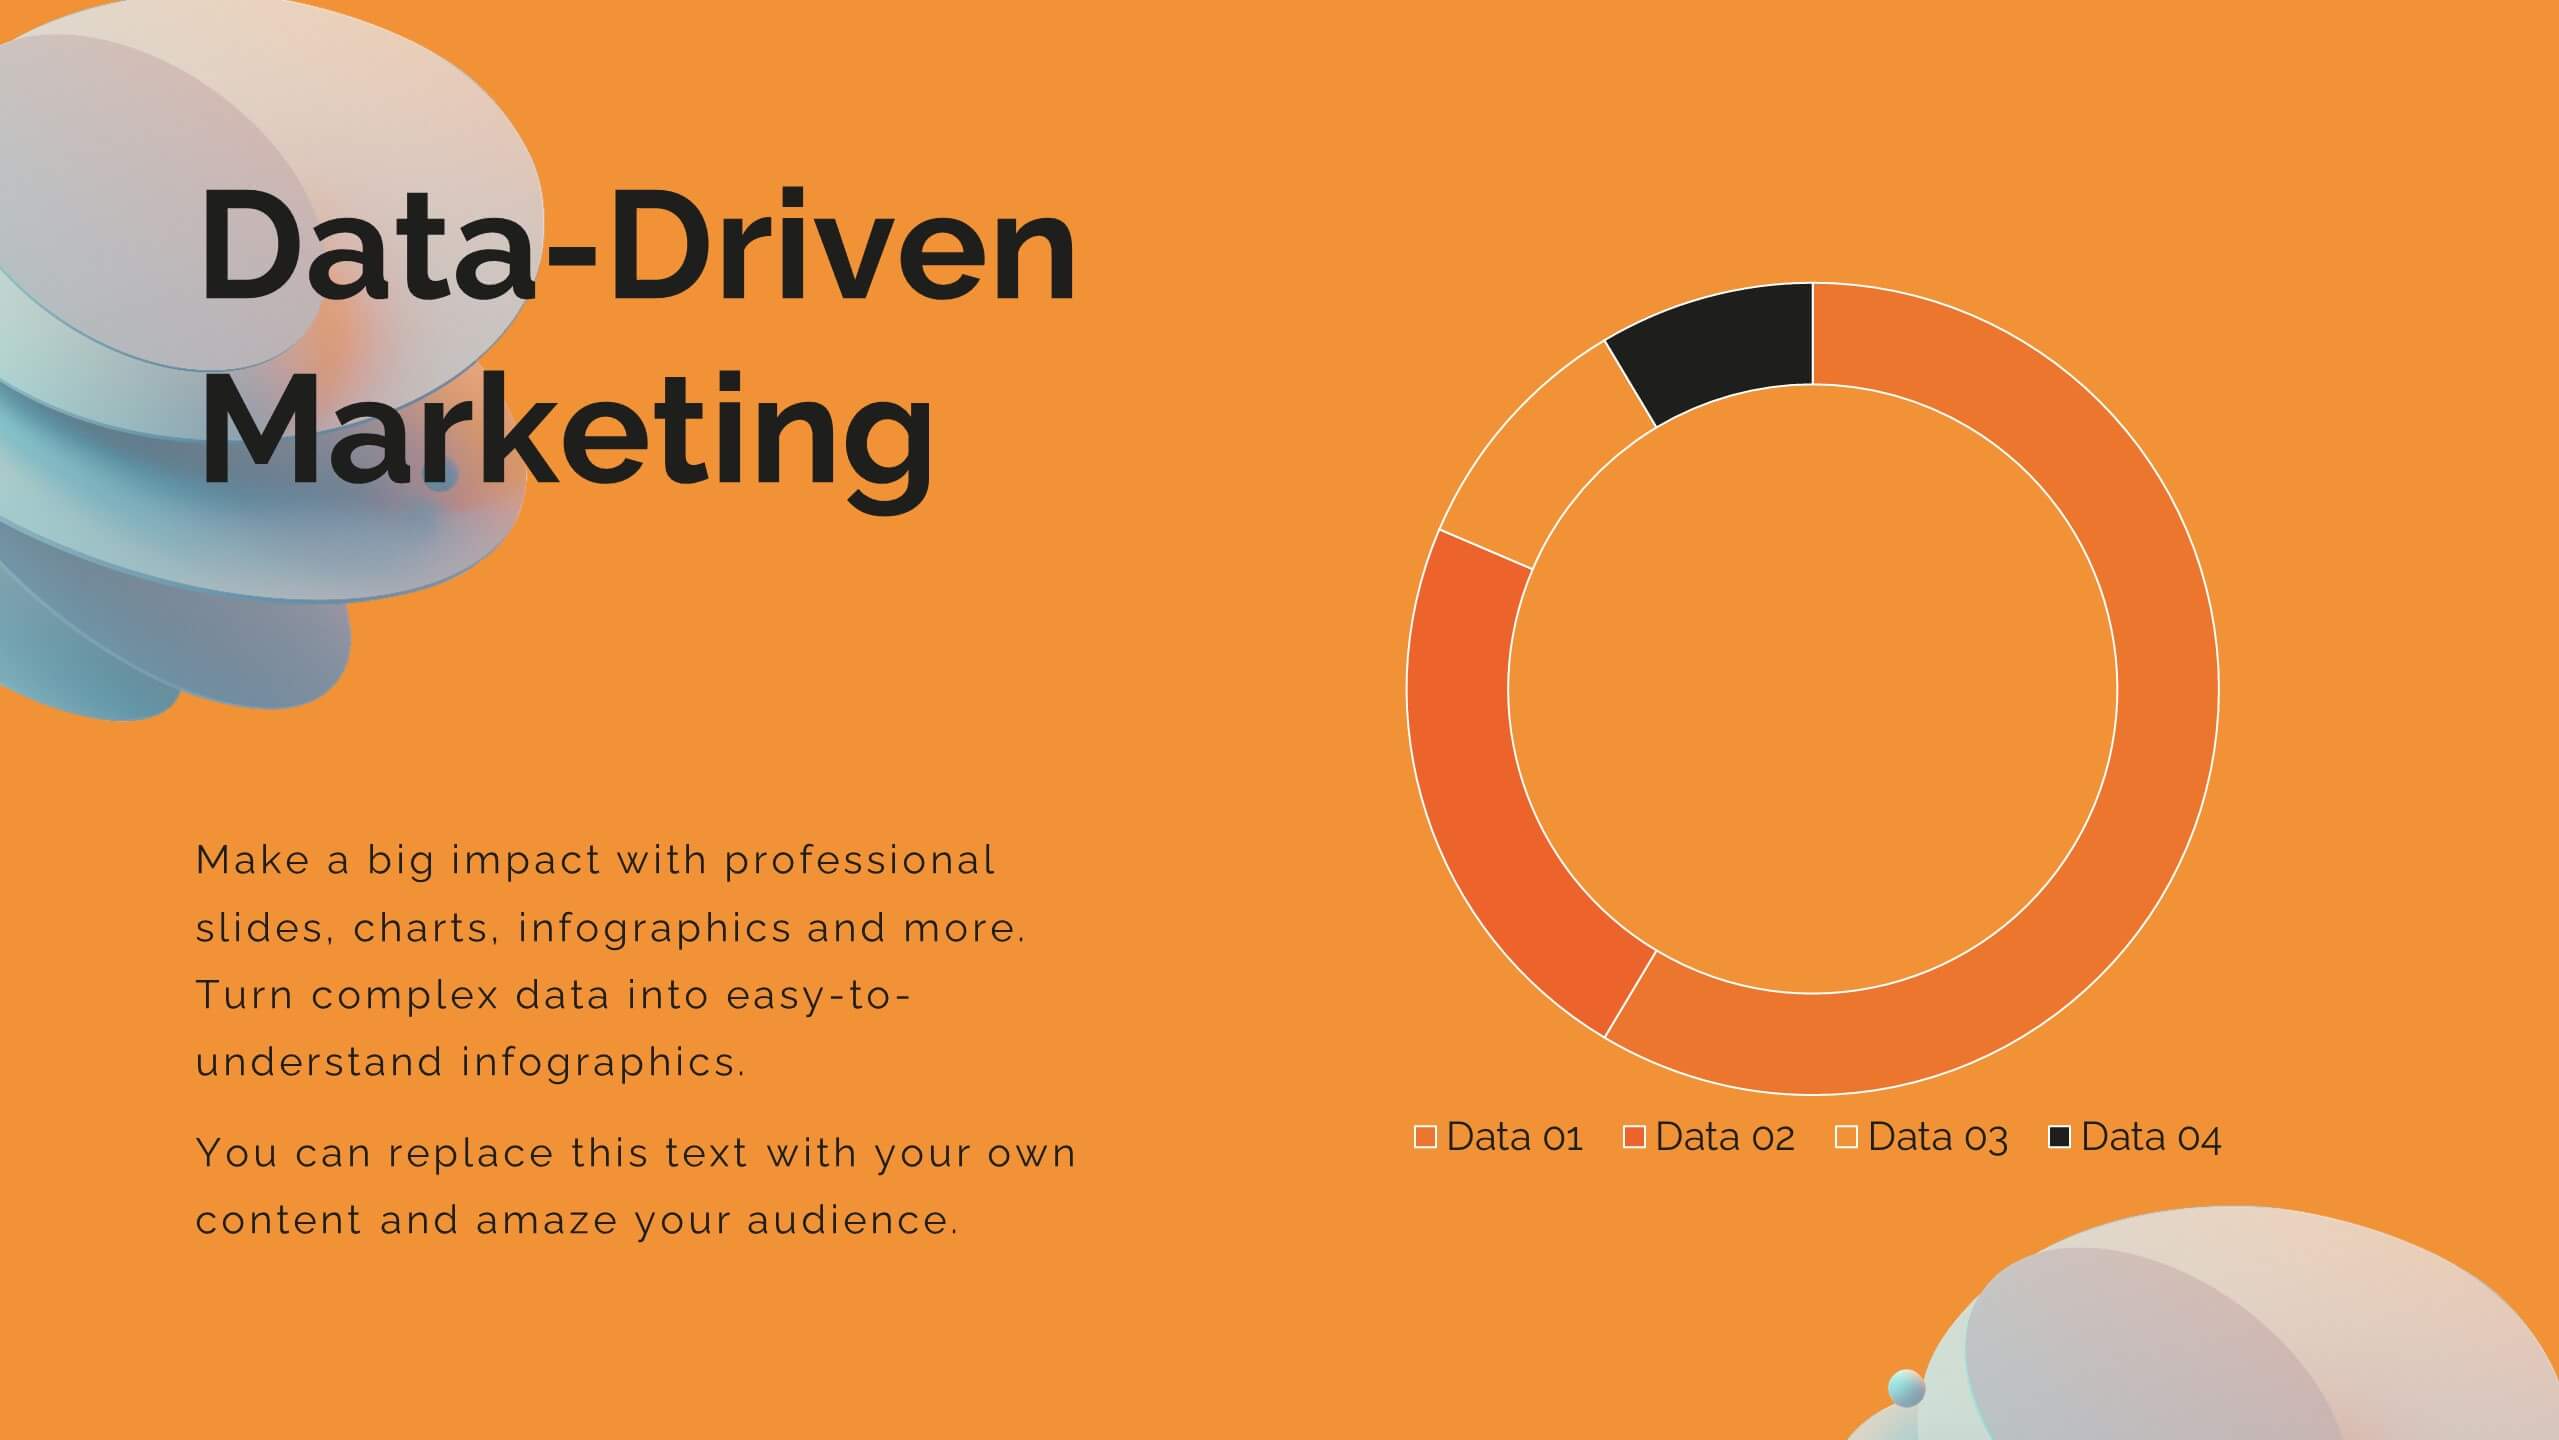
Demographic Data Analysis Presentation
The "Demographic Data Analysis" presentation effectively visualizes demographic splits using a simple yet engaging pie chart. The template features a clean layout with distinct sections labeled for different demographic metrics, represented by the percentage splits of 35% and 65%. Each section includes placeholder text for inserting detailed insights, making it an excellent tool for presentations that need to communicate demographic data clearly and attractively. The design is versatile and can be adapted for various analysis needs in business or research contexts.


21 diapositivas
Ruby Startup Funding Proposal Presentation
Get ready to pitch your startup in style with this vibrant and engaging presentation template! Perfect for showcasing your startup’s founding story, business model, market analysis, and financial overview, this template ensures you’ll impress potential investors. Fully customizable and compatible with PowerPoint, Keynote, and Google Slides, it’s ideal for securing funding and support.


20 diapositivas
Creative Agency Presentation
Showcase your agency’s capabilities with the Magic Coat Creative Agency template. It features slides detailing team introductions, service overviews, case studies, and more. Ideal for creative agencies aiming to impress potential clients, this template supports PowerPoint, Keynote, and Google Slides, enhancing your presentation's professional appeal.


6 diapositivas
Matrix Diagram Business Analysis Infographic
Streamline your business analysis with our Matrix Diagram Infographic Template. This versatile tool is designed for clarity and impact, helping you compare and contrast various data points. Whether you're assessing risks, evaluating performance, or categorizing information, our template provides a visually appealing and easy-to-understand matrix layout. Compatible with PowerPoint, Google Slides, and Keynote, it's the perfect addition to your business presentations. With its customizable design, you can tailor the colors, shapes, and text to fit your specific needs. Use this template to bring a professional edge to your strategic planning and stakeholder communication.


21 diapositivas
Slumbera Product Roadmap Presentation
Plan and showcase your product strategy with this clean and professional template. Cover key aspects such as product overview, target market, competitive analysis, and marketing strategy to align stakeholders and drive success. Fully customizable and compatible with PowerPoint, Keynote, and Google Slides.


4 diapositivas
IT Network Infrastructure Presentation
Optimize your IT infrastructure with this IT Network Infrastructure template. Designed with a cloud-based network architecture layout, this slide helps illustrate data flow, system components, and key IT connections in a structured format. Perfect for IT professionals, network engineers, and tech strategists, this fully customizable slide works seamlessly with PowerPoint, Keynote, and Google Slides.


5 diapositivas
Innovative Business Solutions Presentation
Elevate your strategy discussions with the Innovative Business Solutions template, providing a visually engaging framework designed to present complex business solutions clearly and effectively. It features a unique puzzle design that integrates up to five key business insights, ensuring each piece contributes to a holistic understanding of strategies or solutions. It is compatible with PowerPoint, Keynote and Google Slides, providing flexibility and ease of use across different platforms.


4 diapositivas
Daily Time Planning and Scheduling Presentation
Stay organized and maximize productivity with this Daily Time Planning and Scheduling template. Featuring a structured hourly schedule, task folders for tomorrow’s plans and to-do lists, and a dedicated notes section, this slide is designed for professionals, students, and busy individuals. Customize effortlessly to track daily tasks, set priorities, and manage time effectively. Fully compatible with PowerPoint, Keynote, and Google Slides for seamless integration.


21 diapositivas
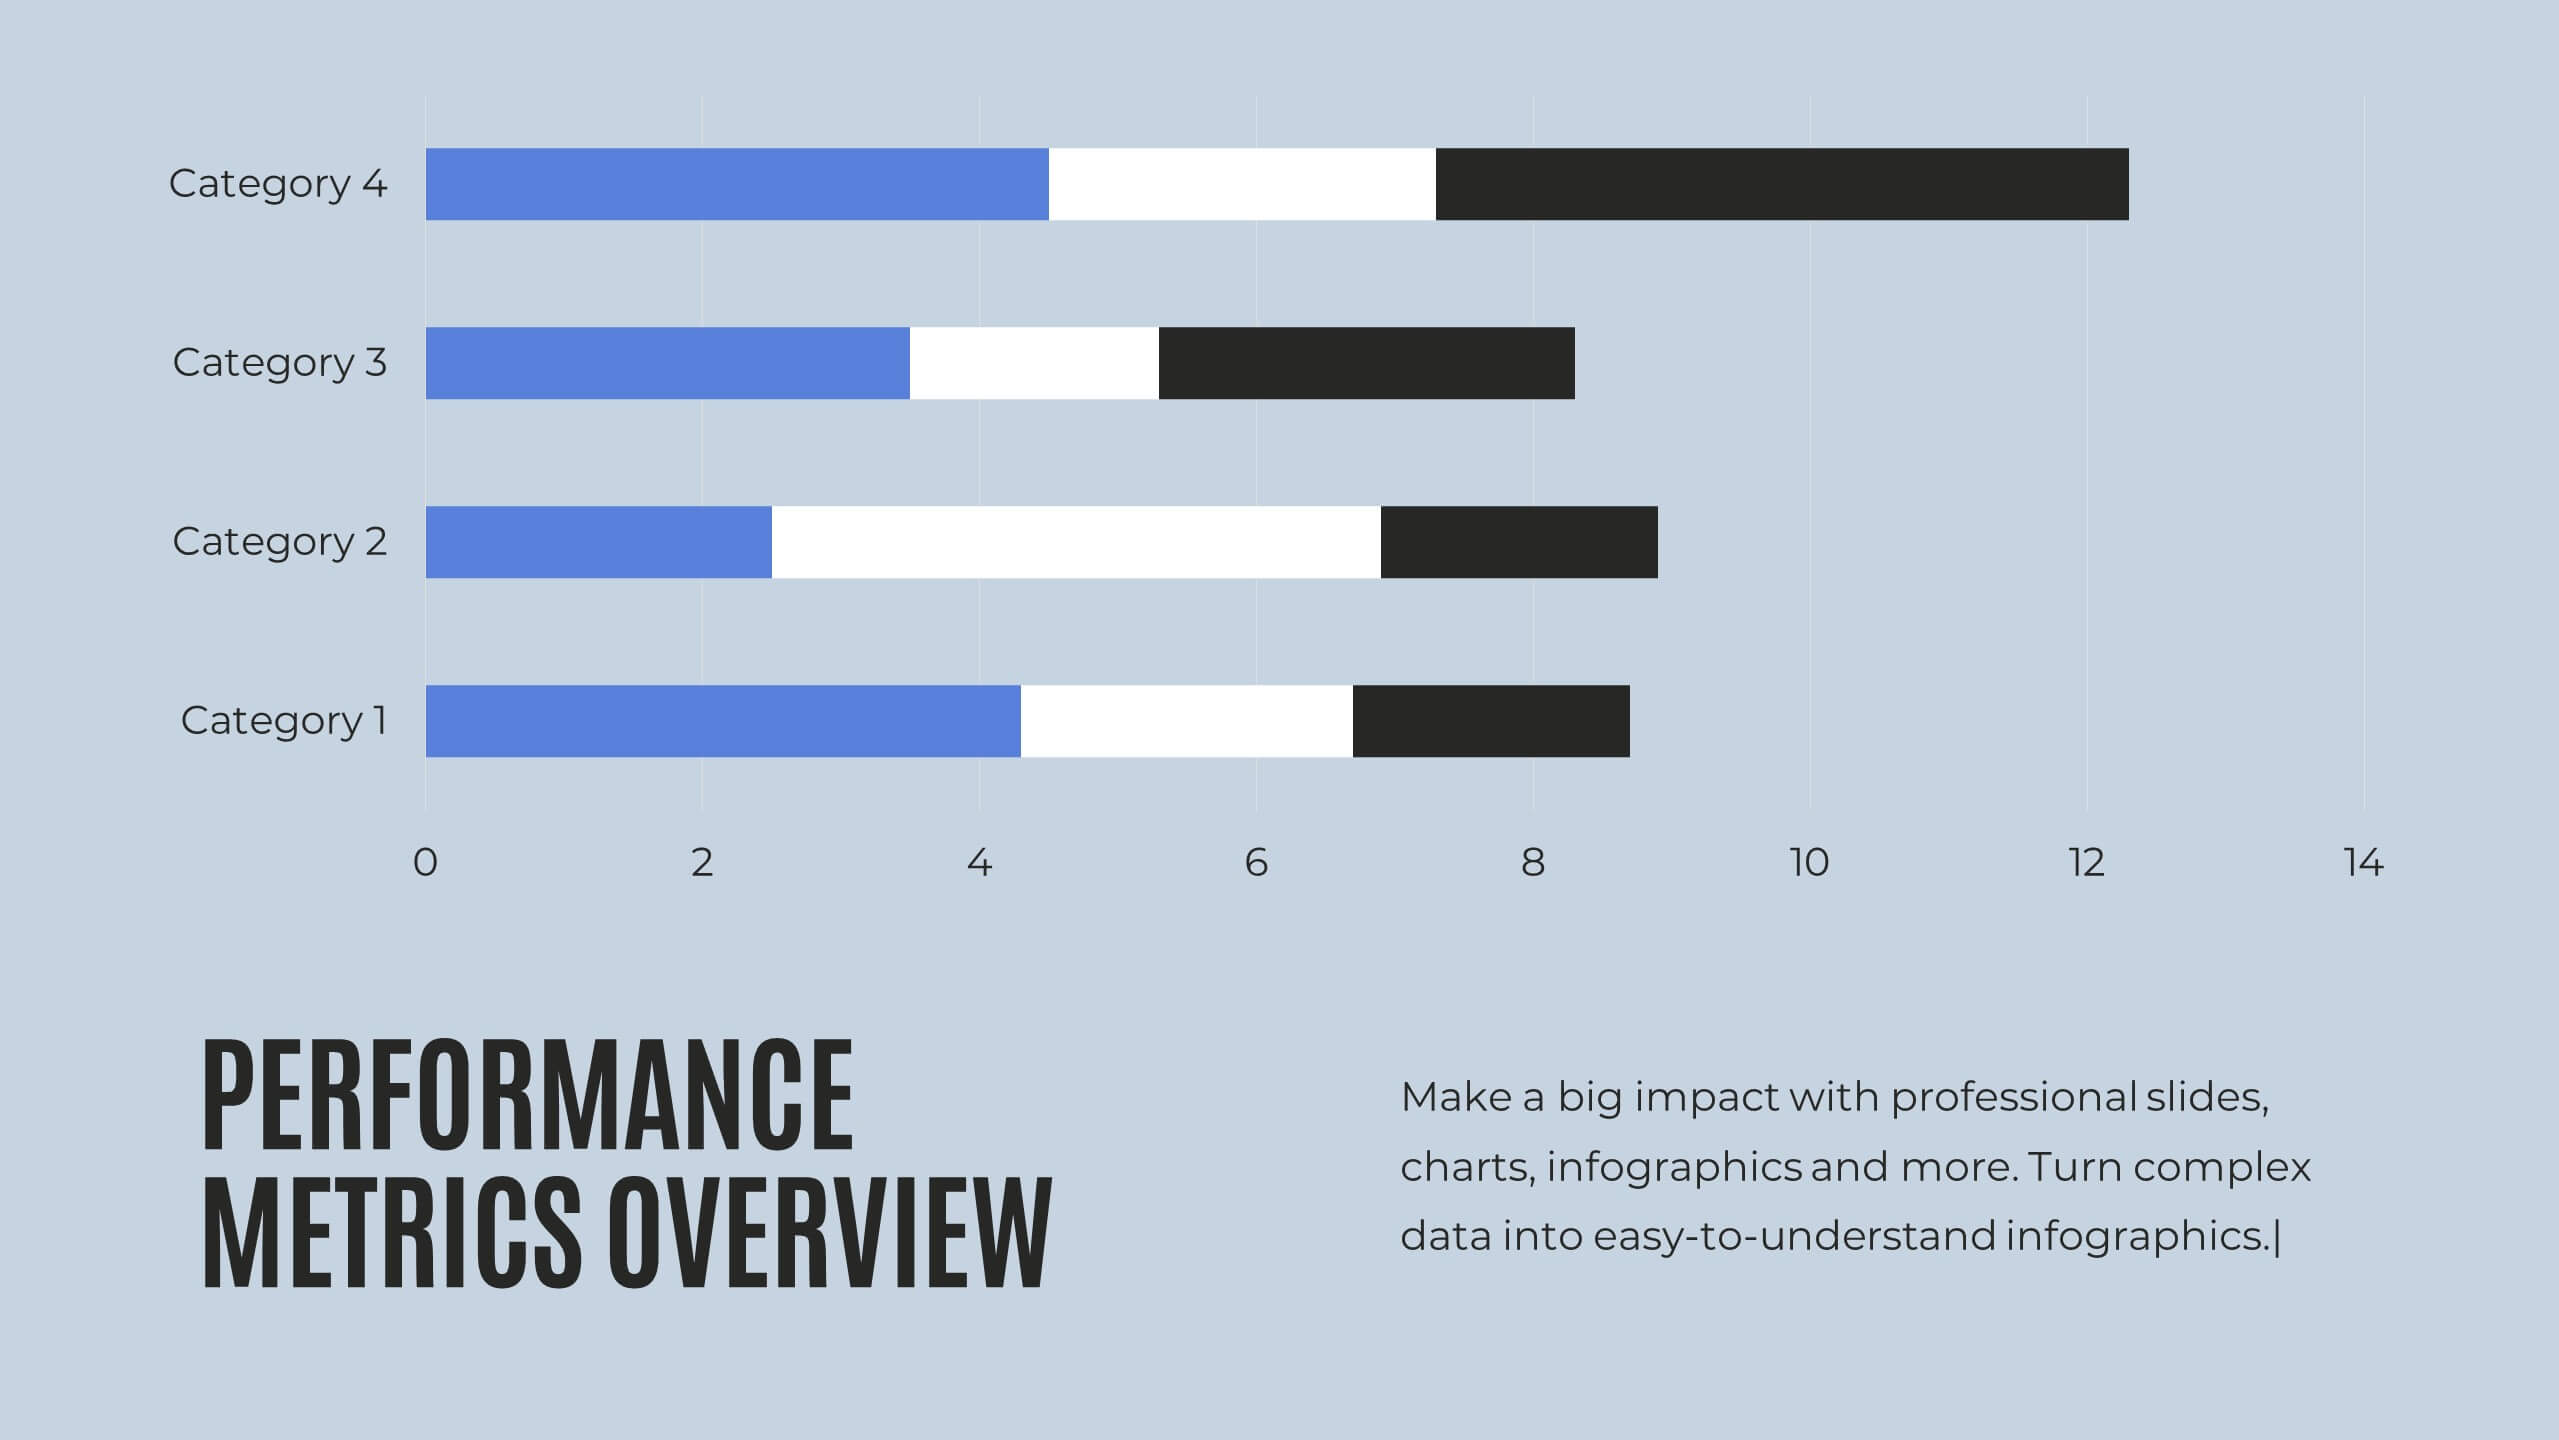
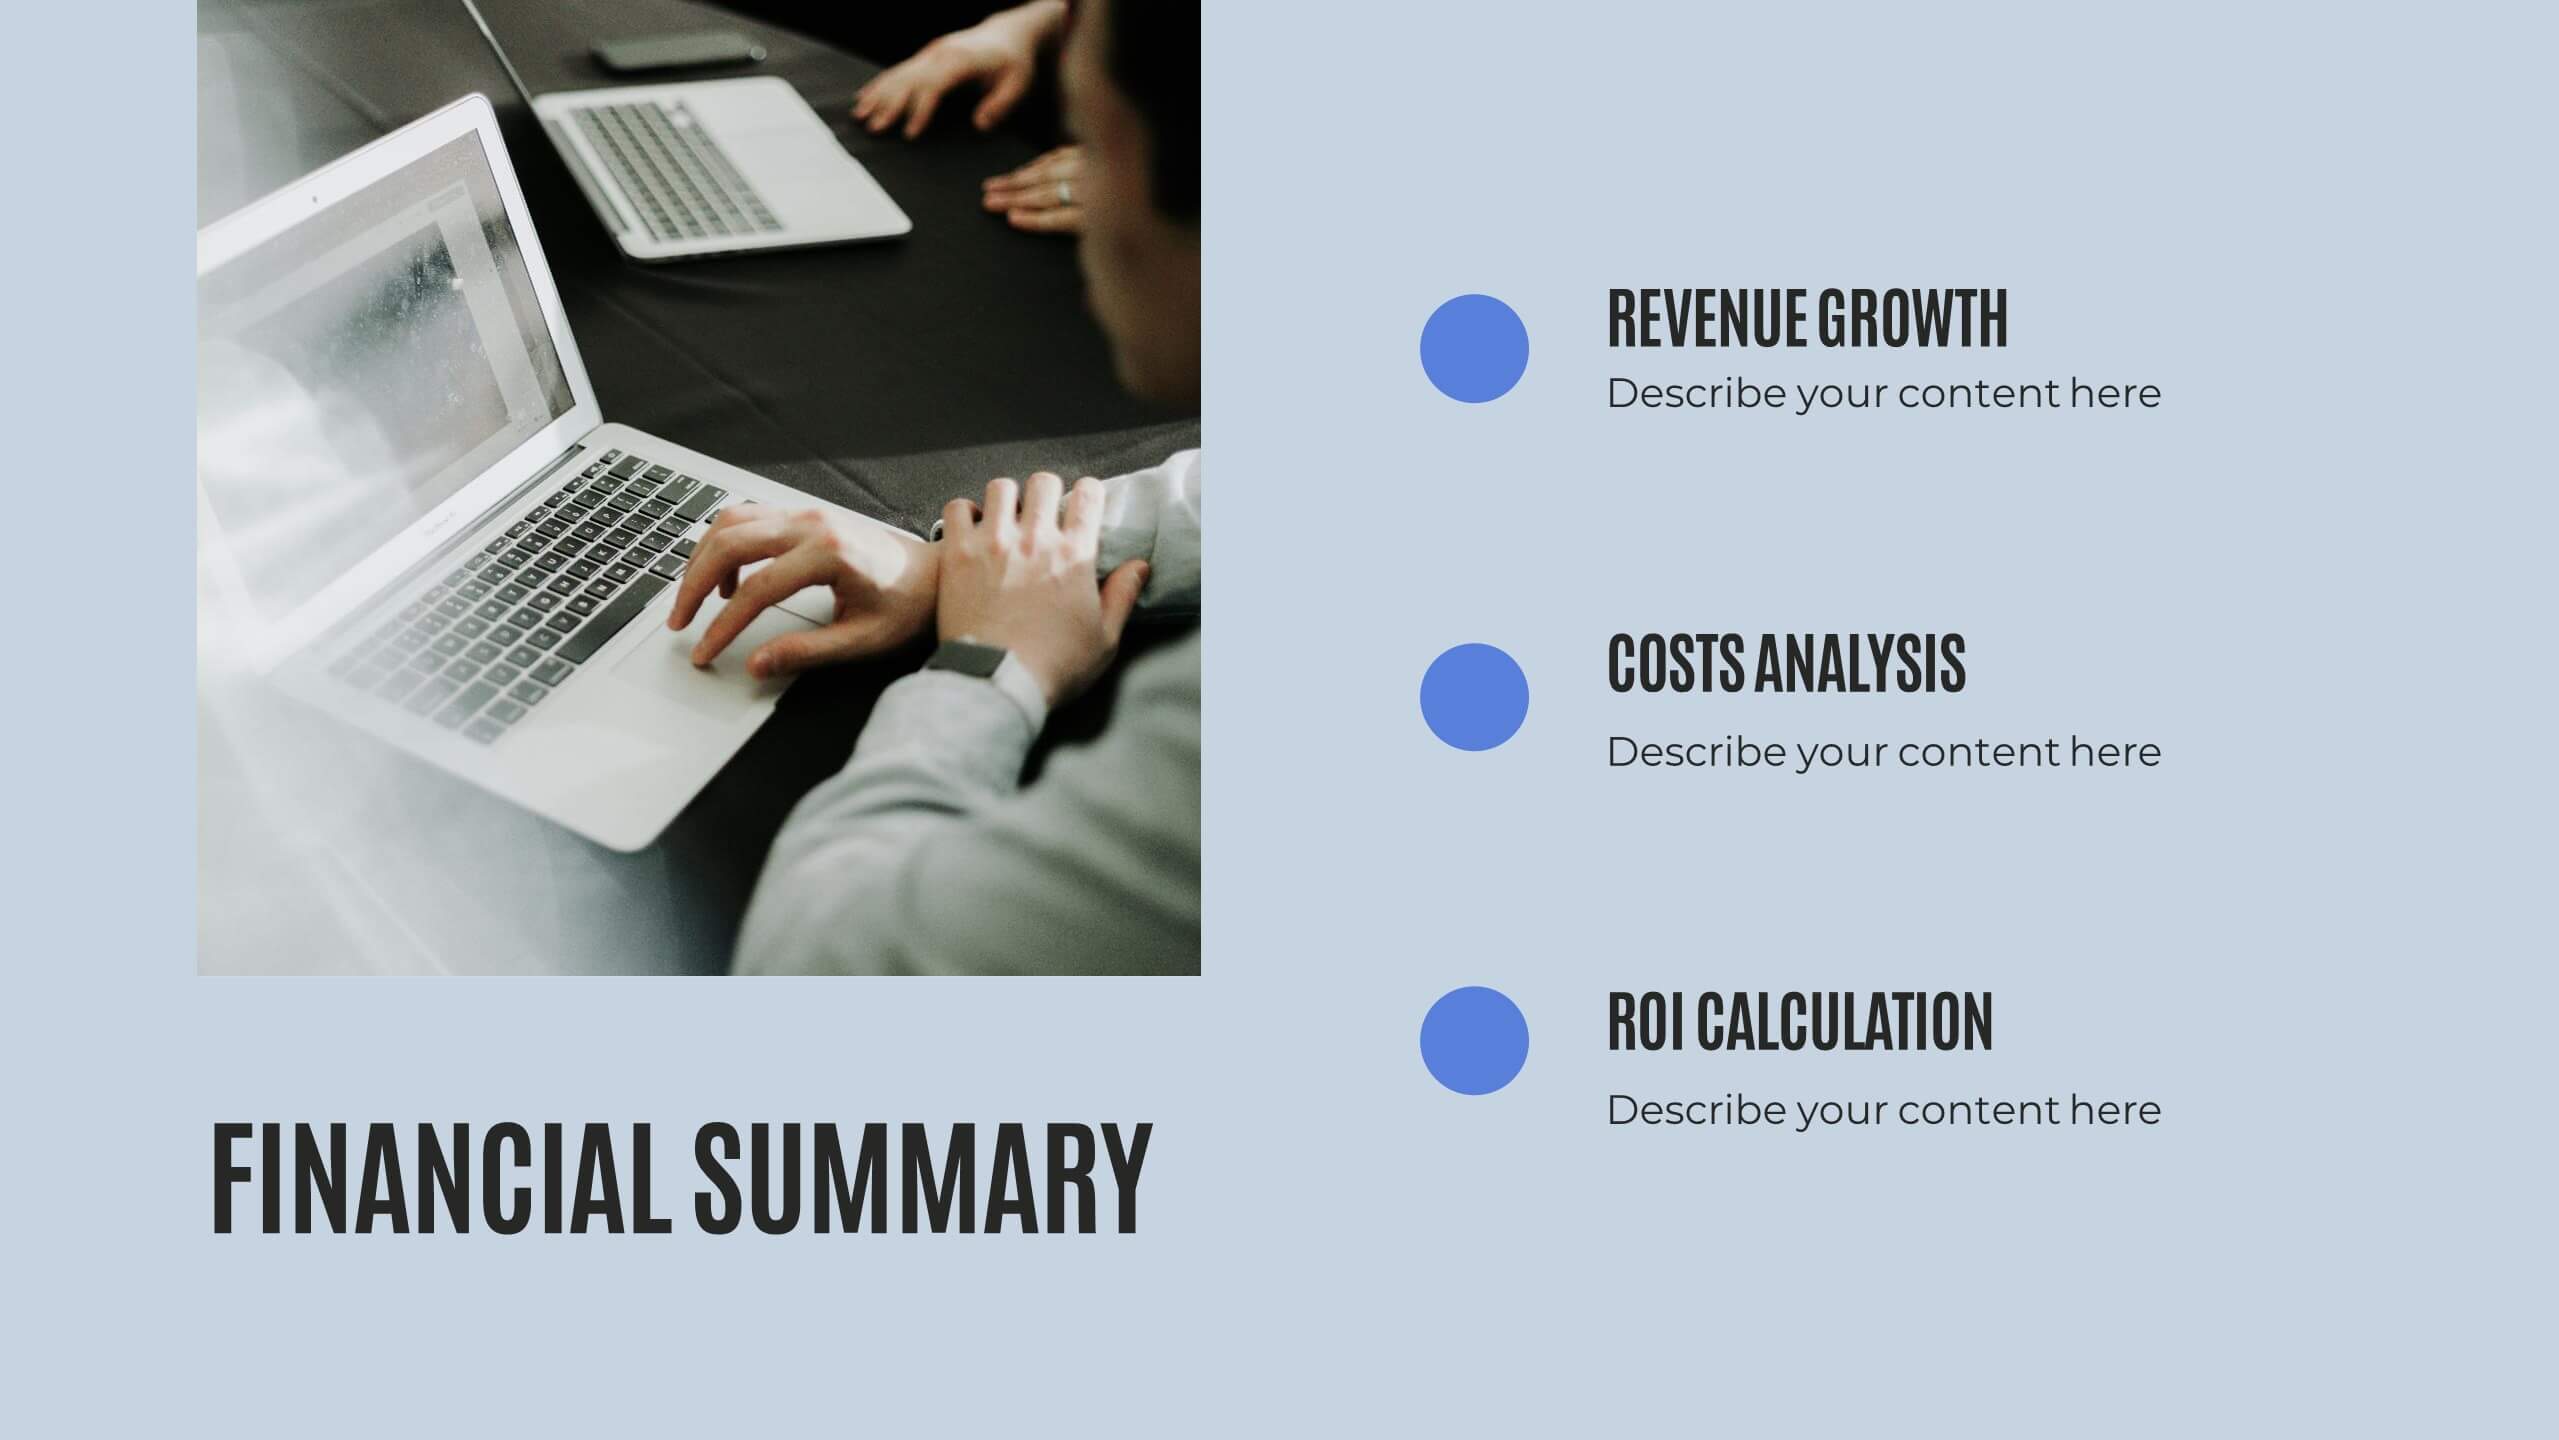
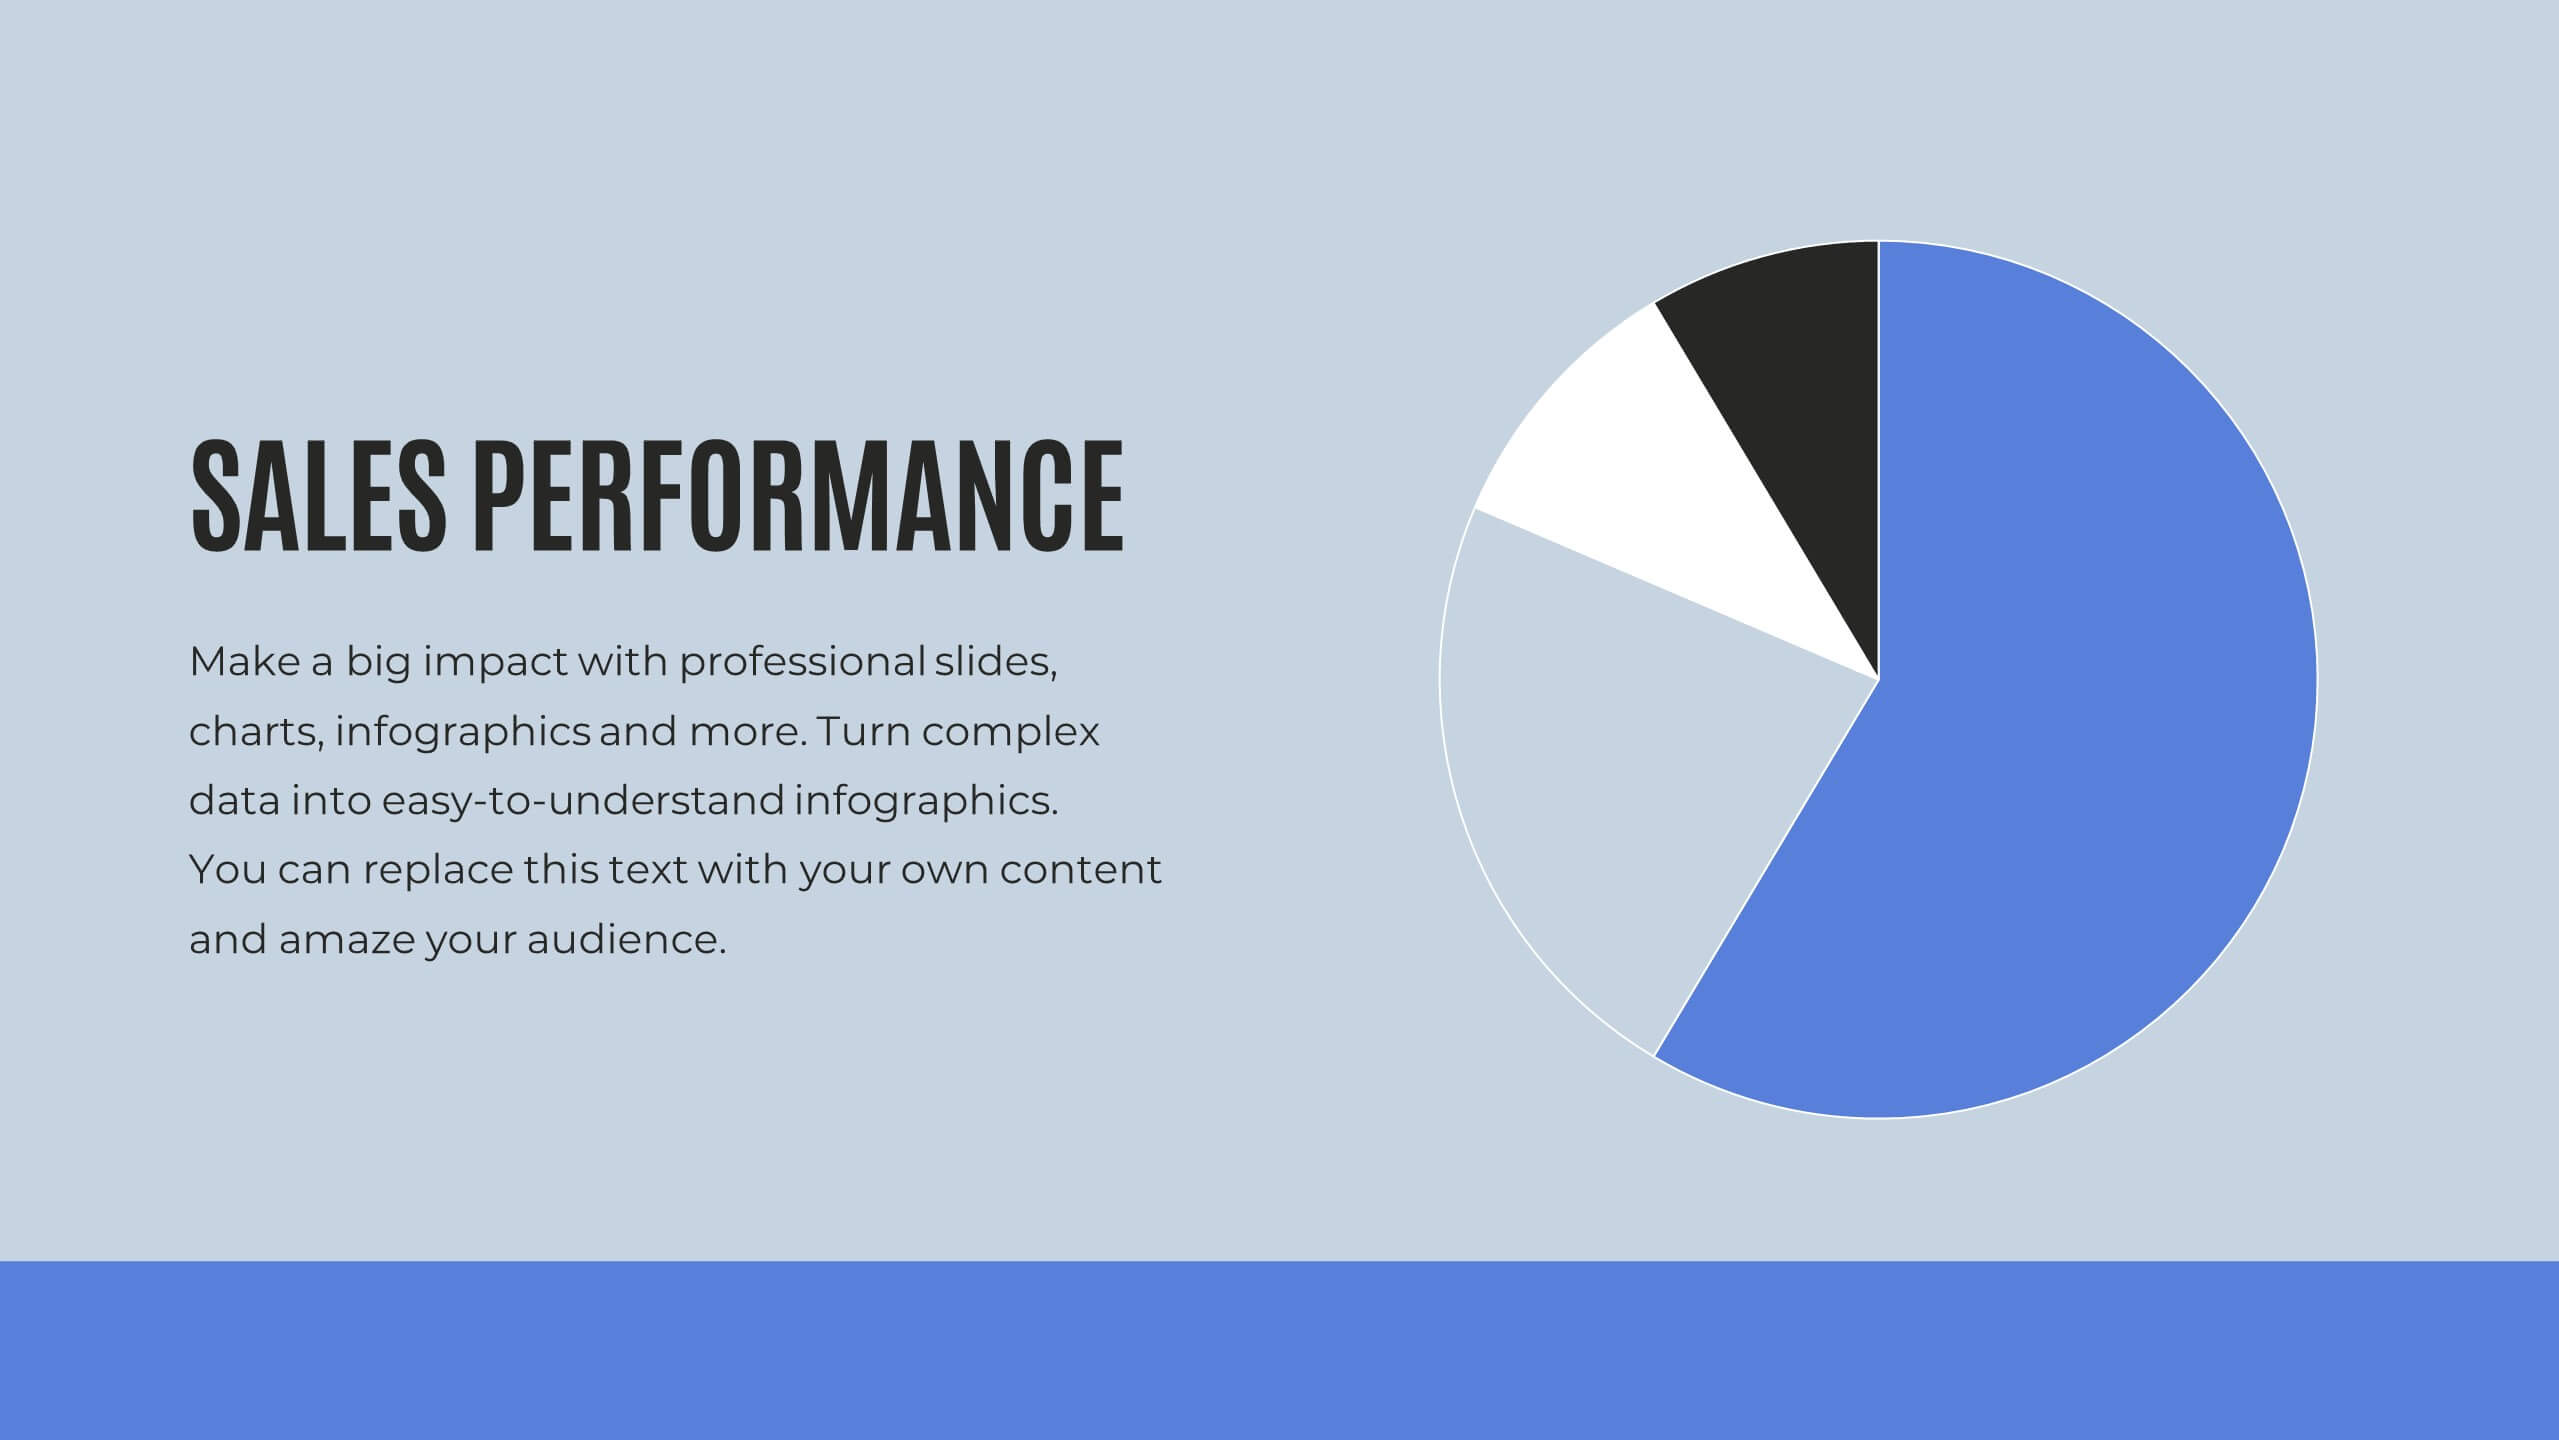
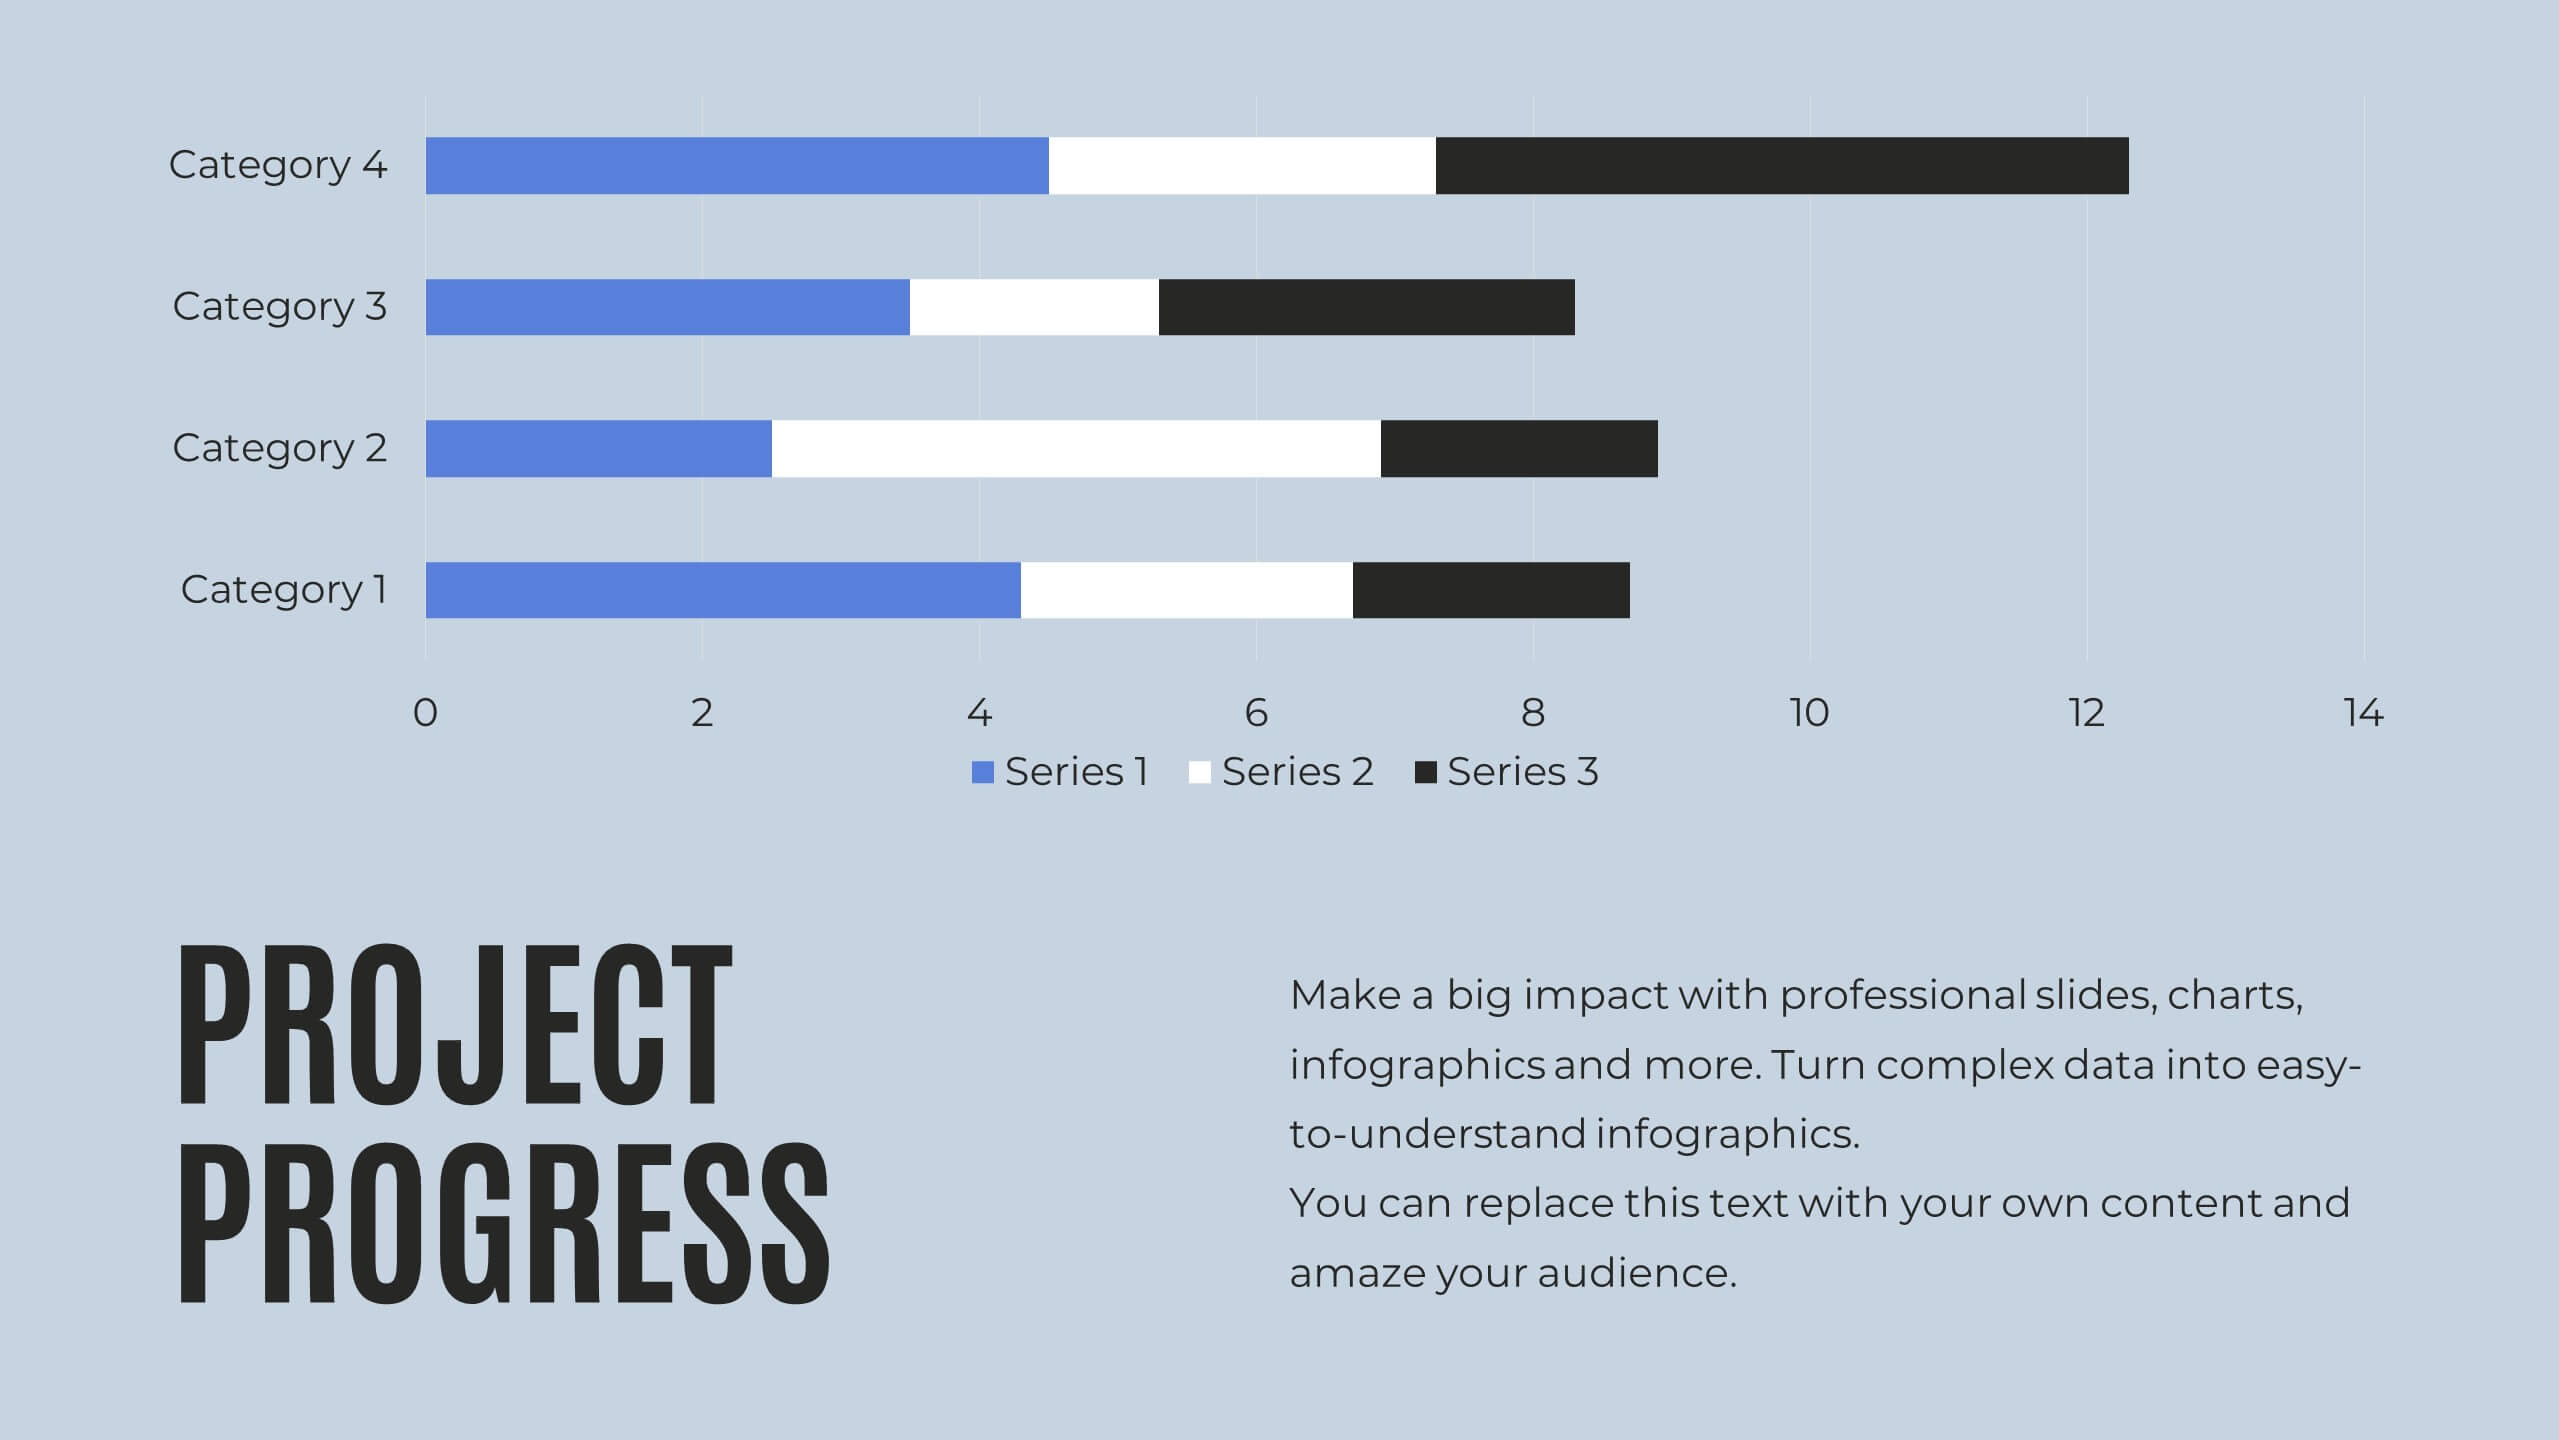
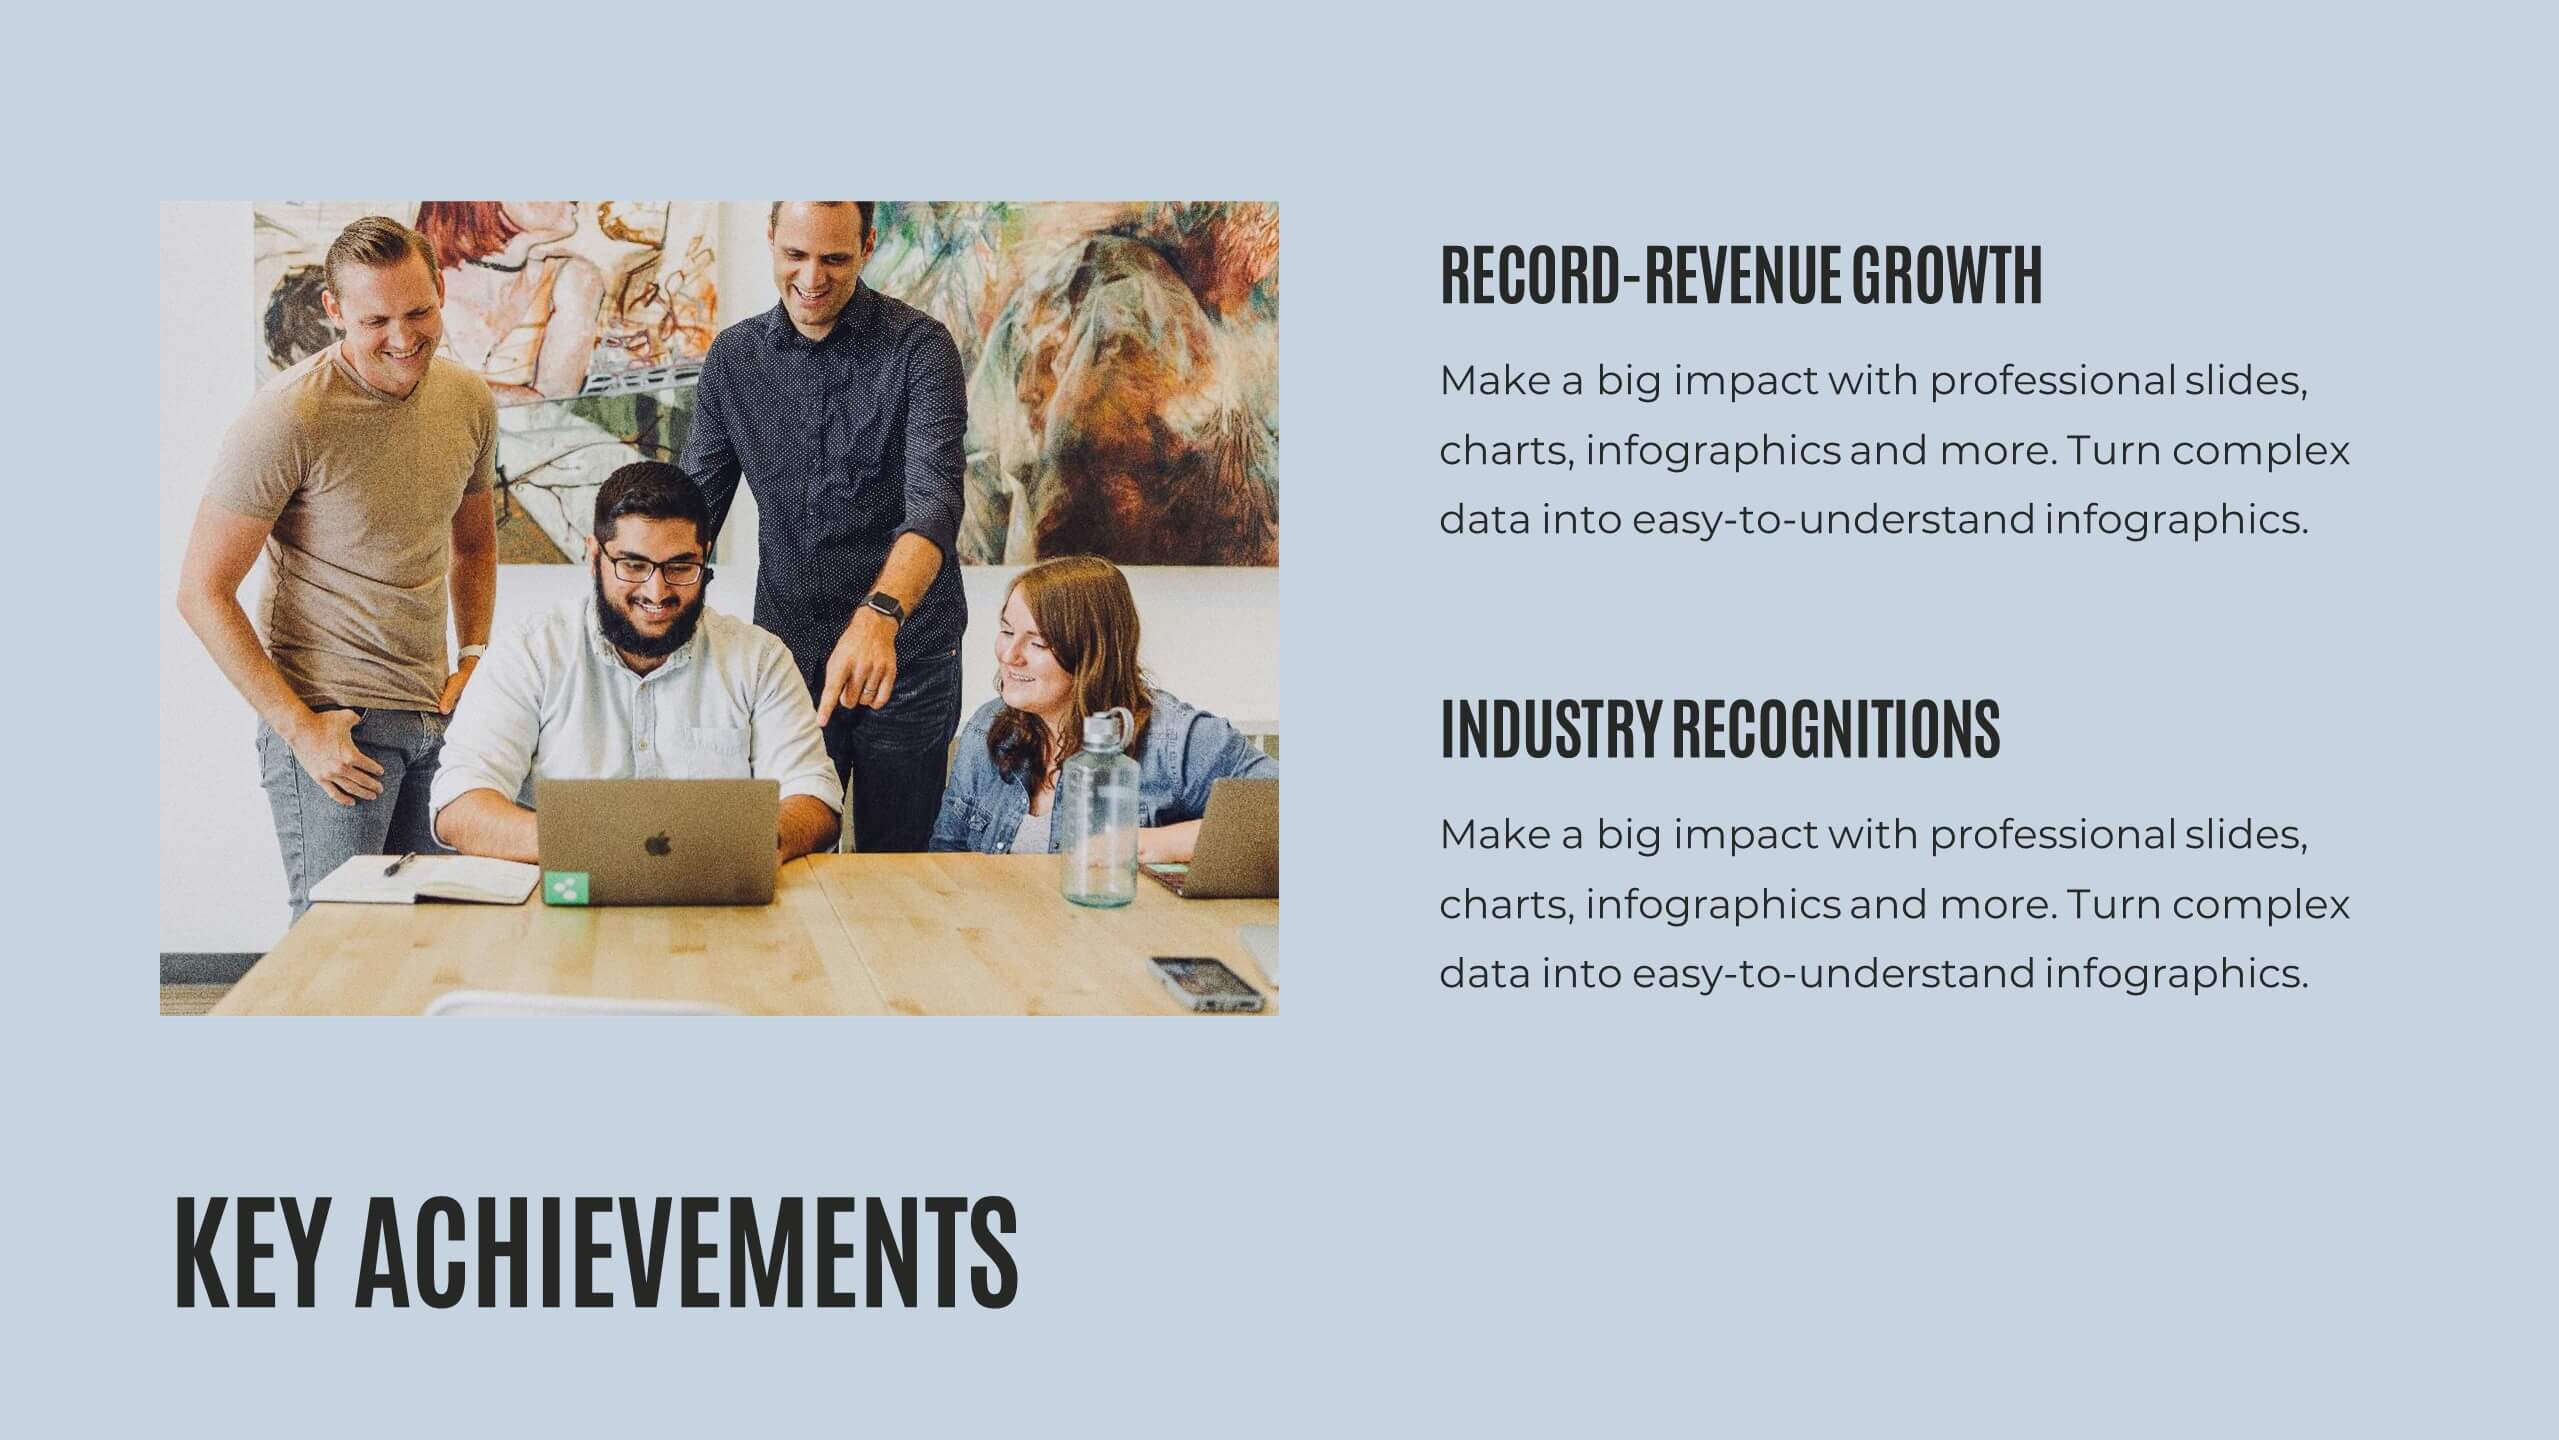
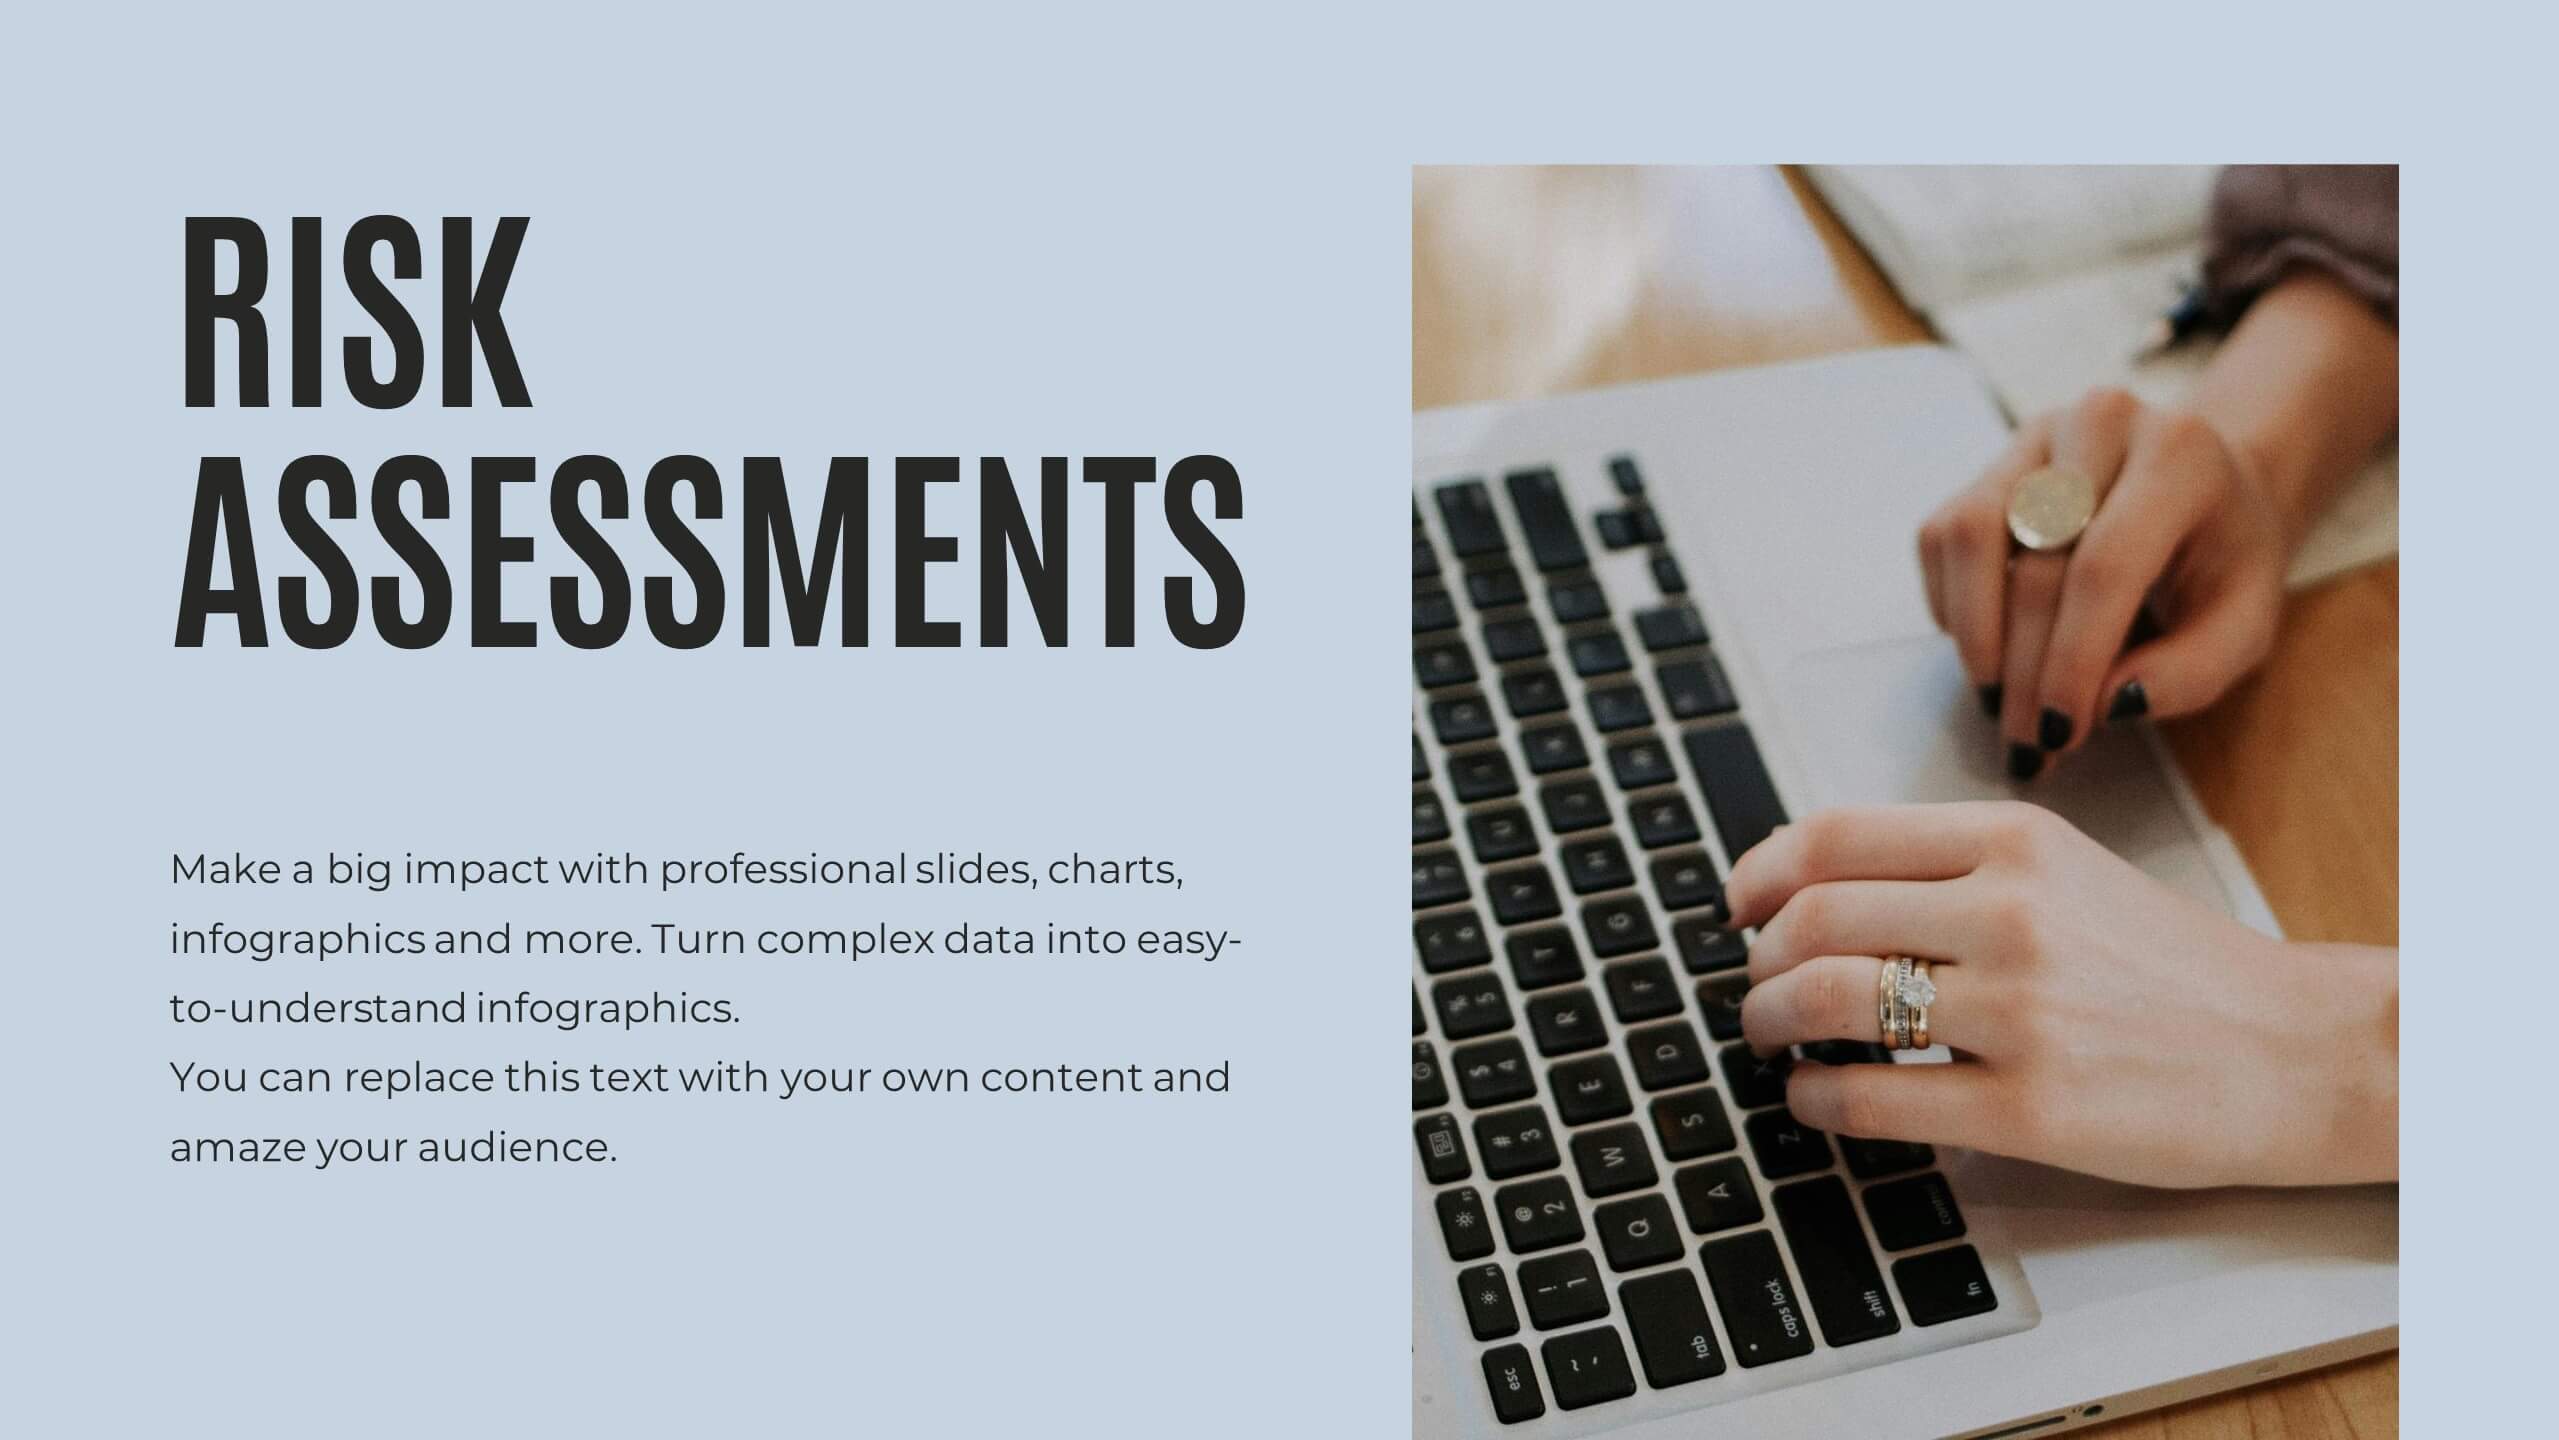
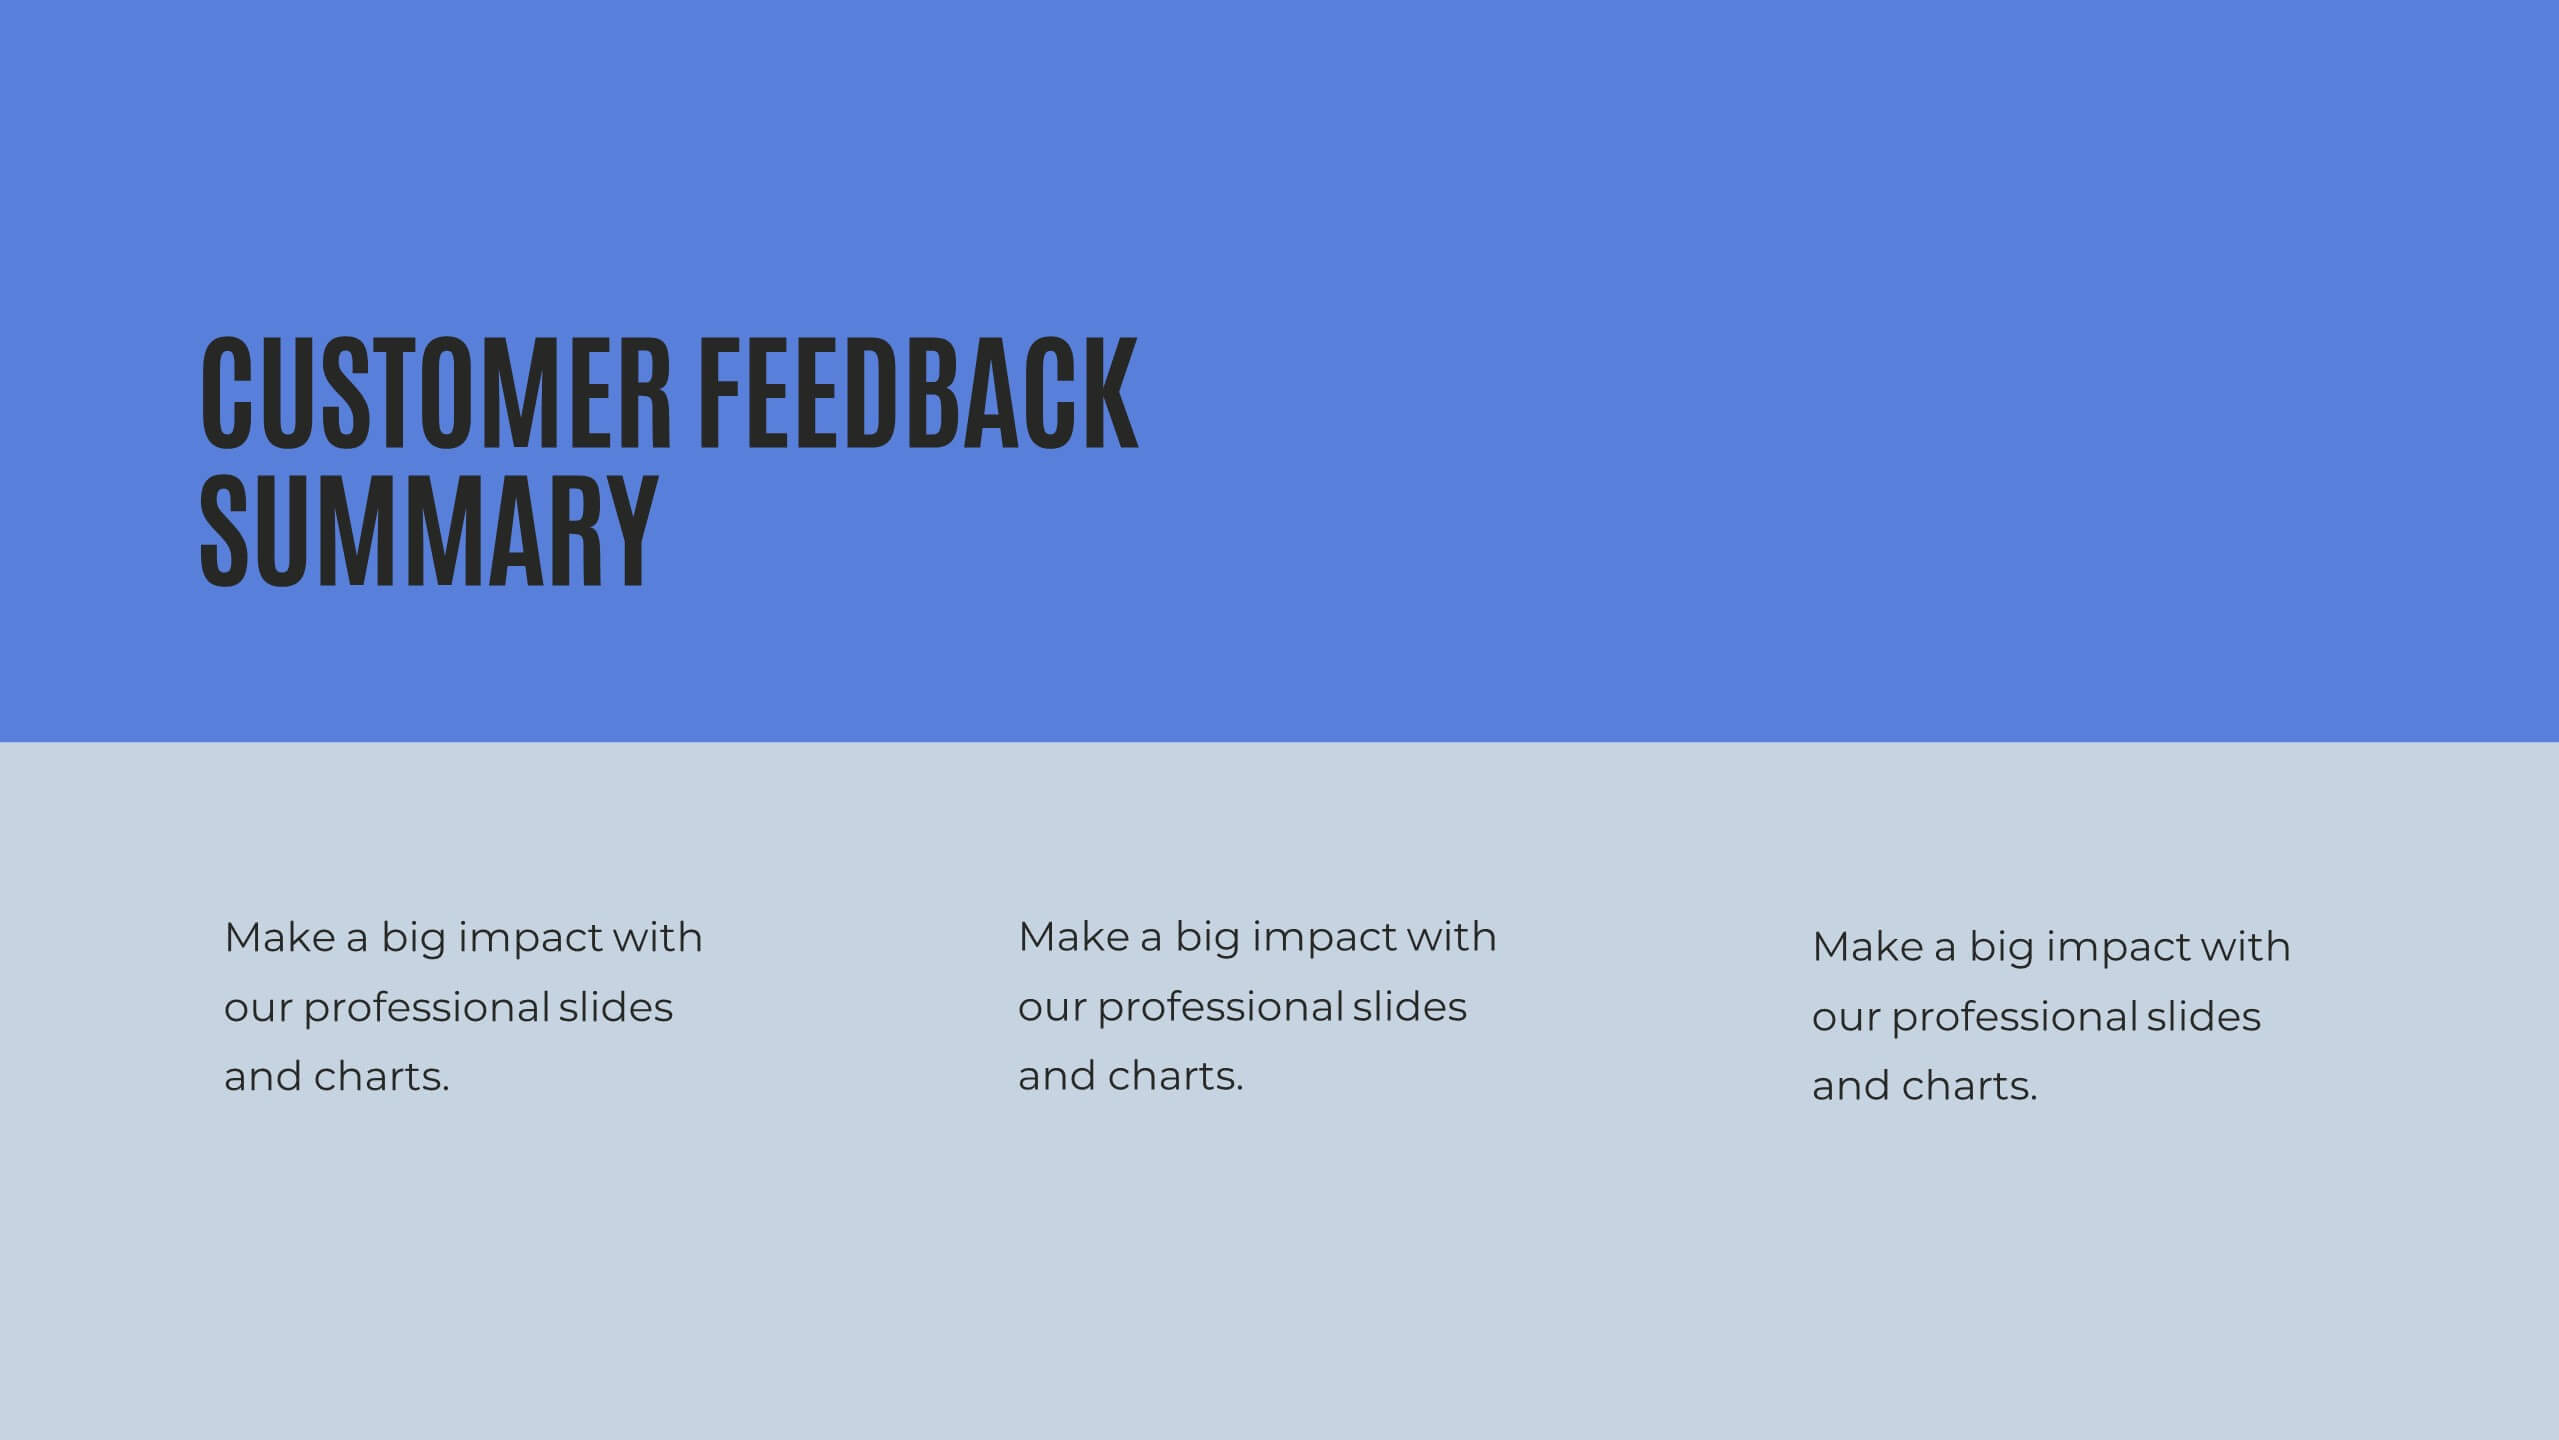
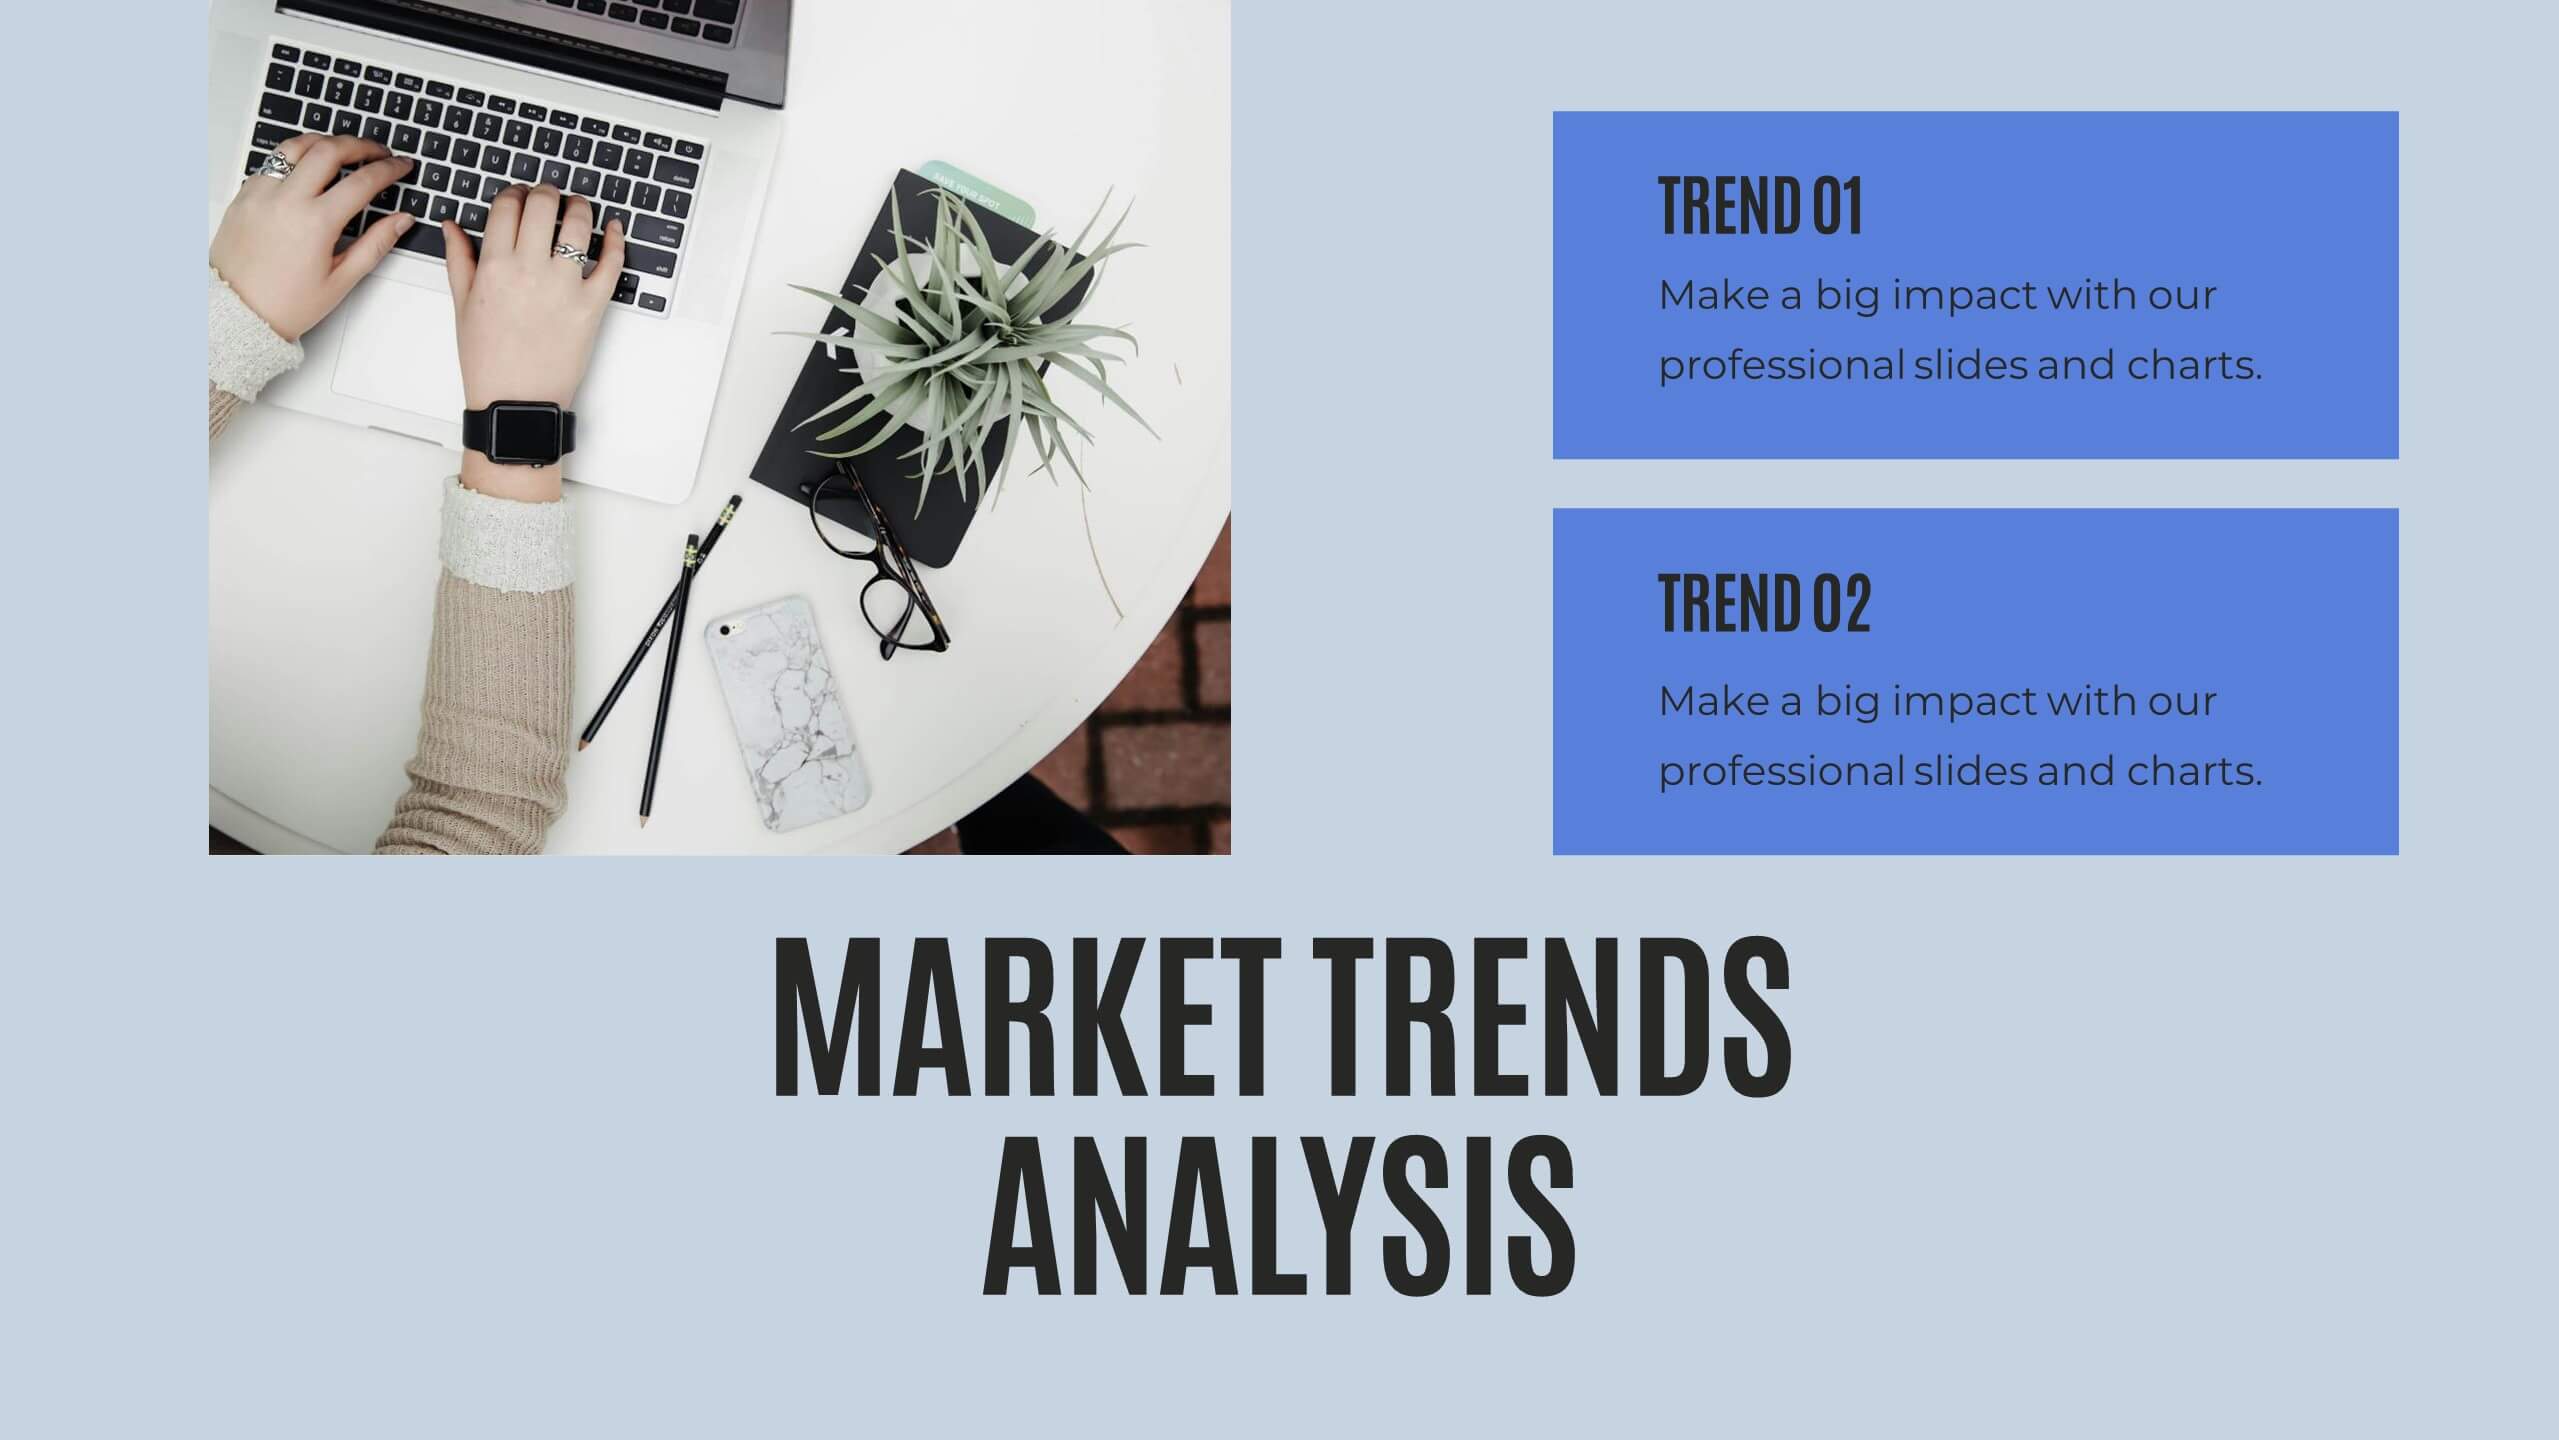
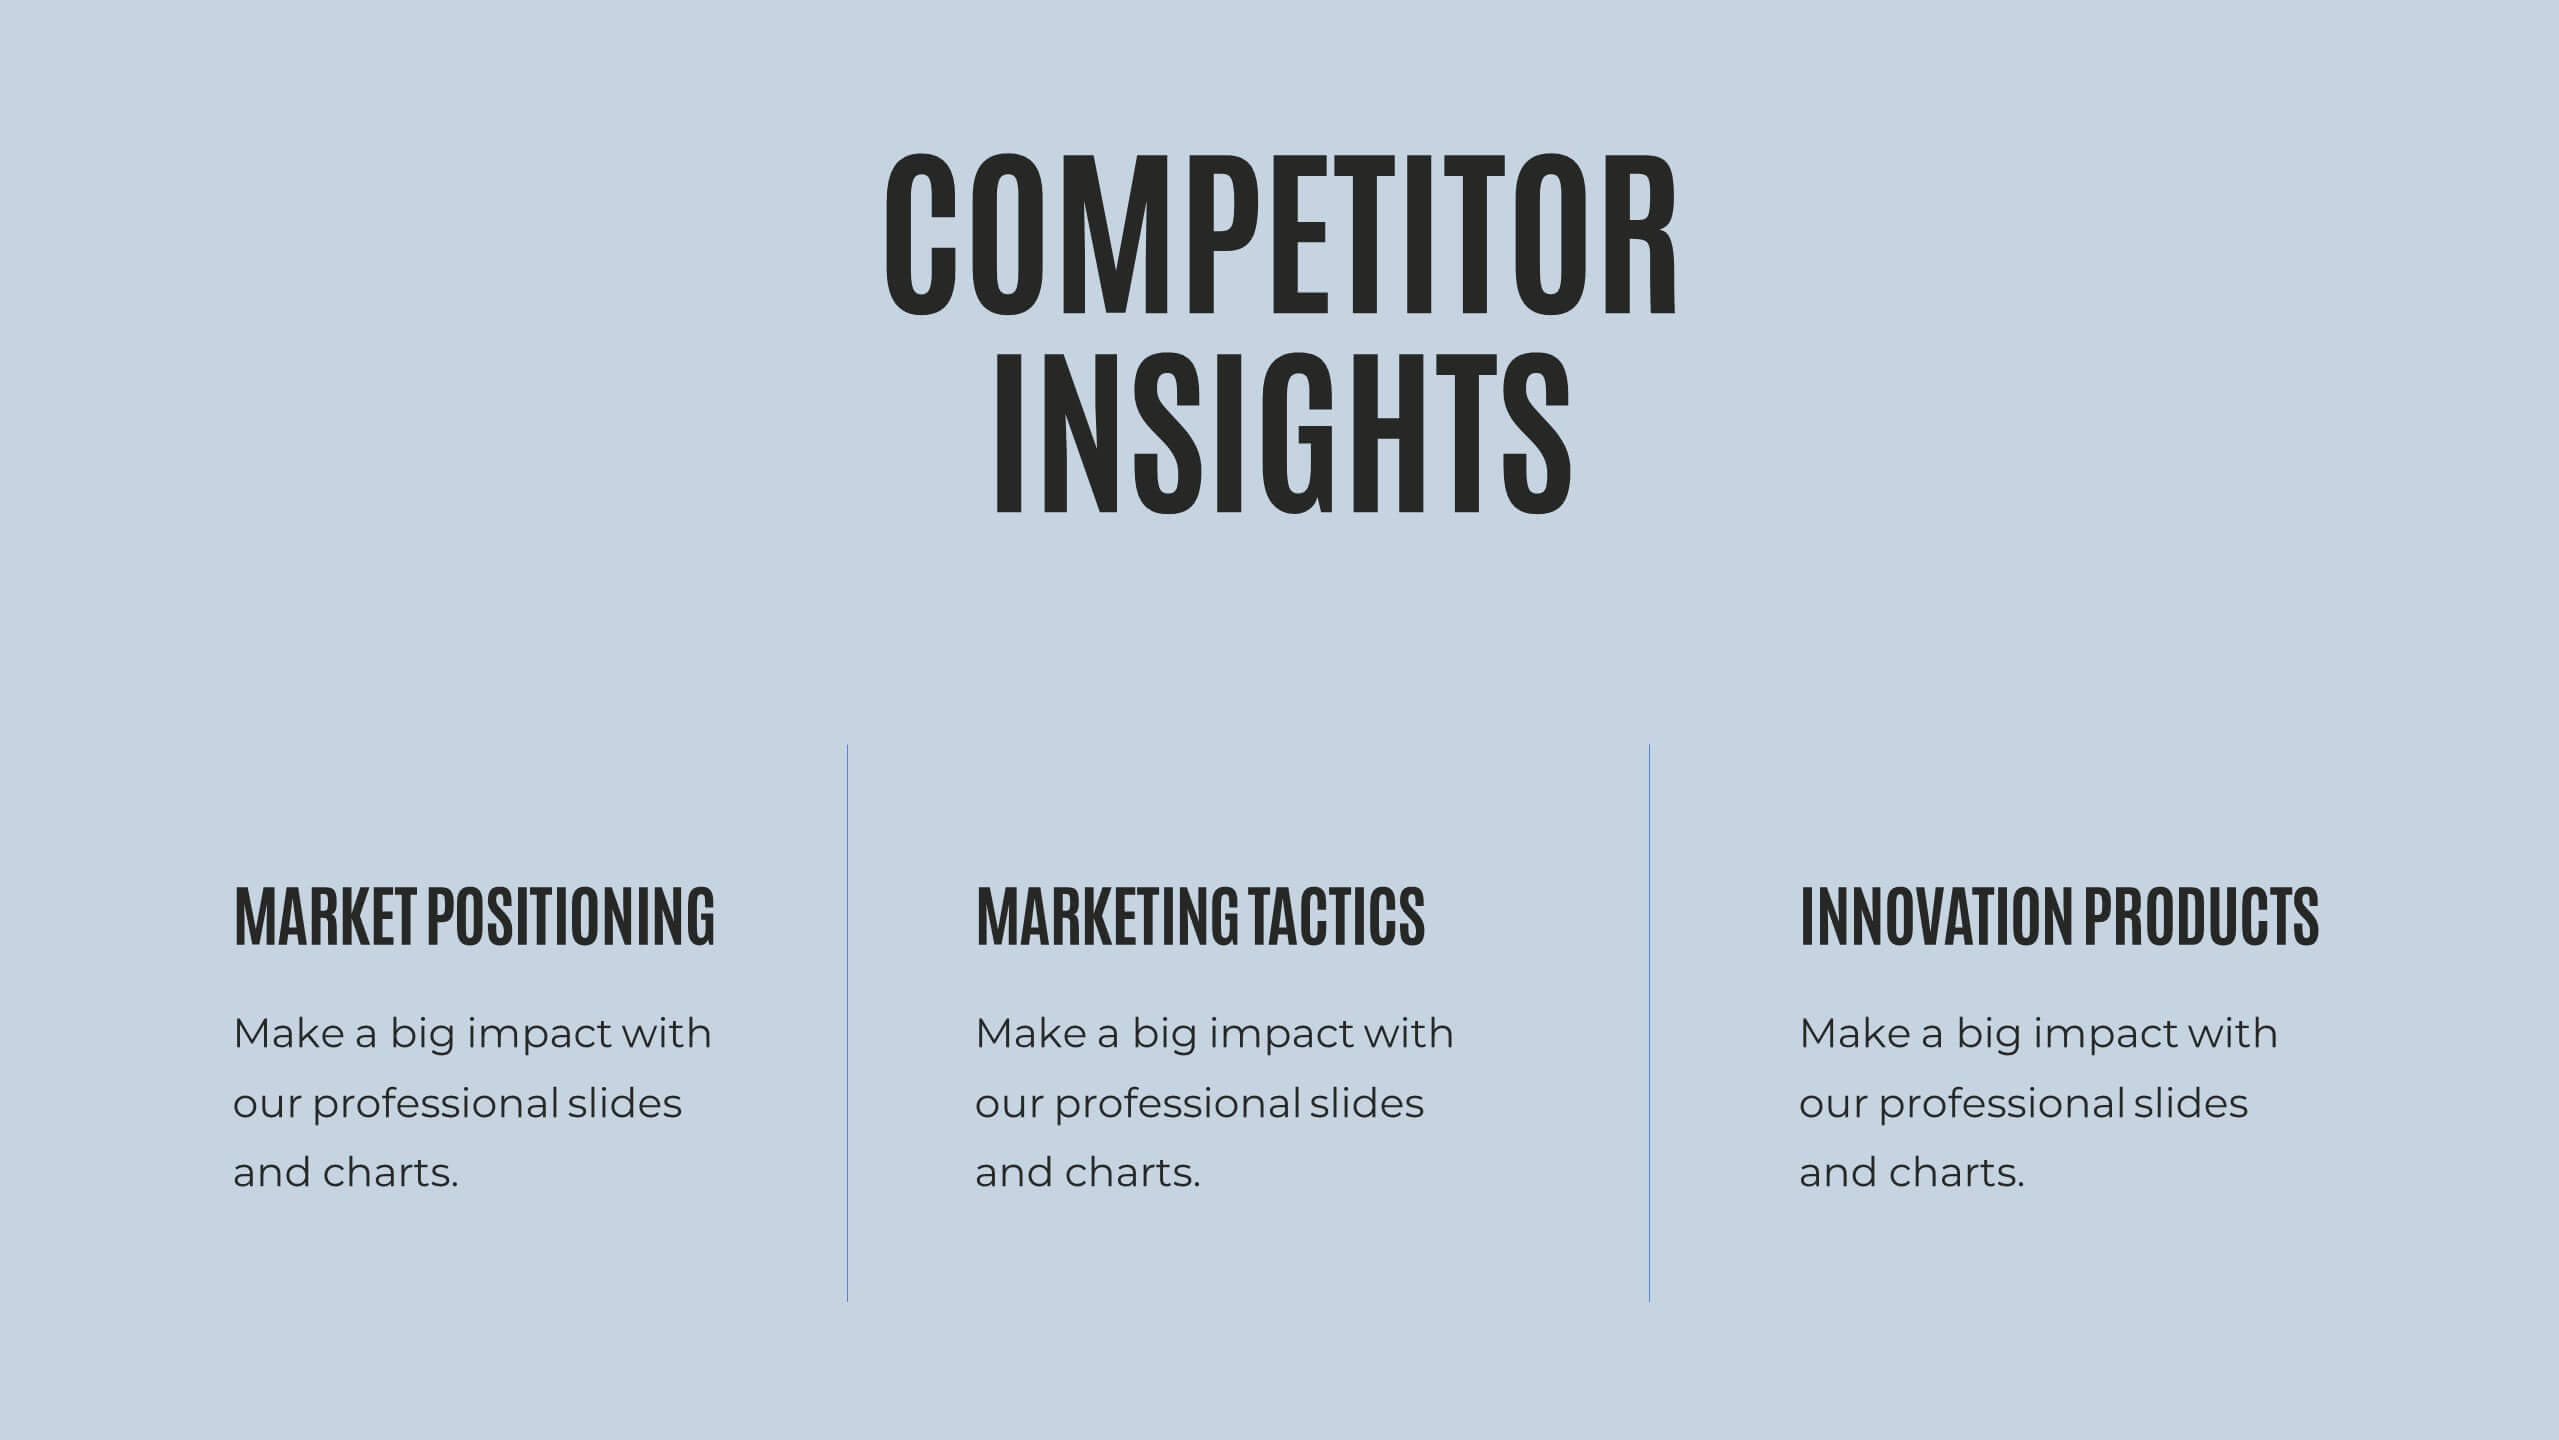
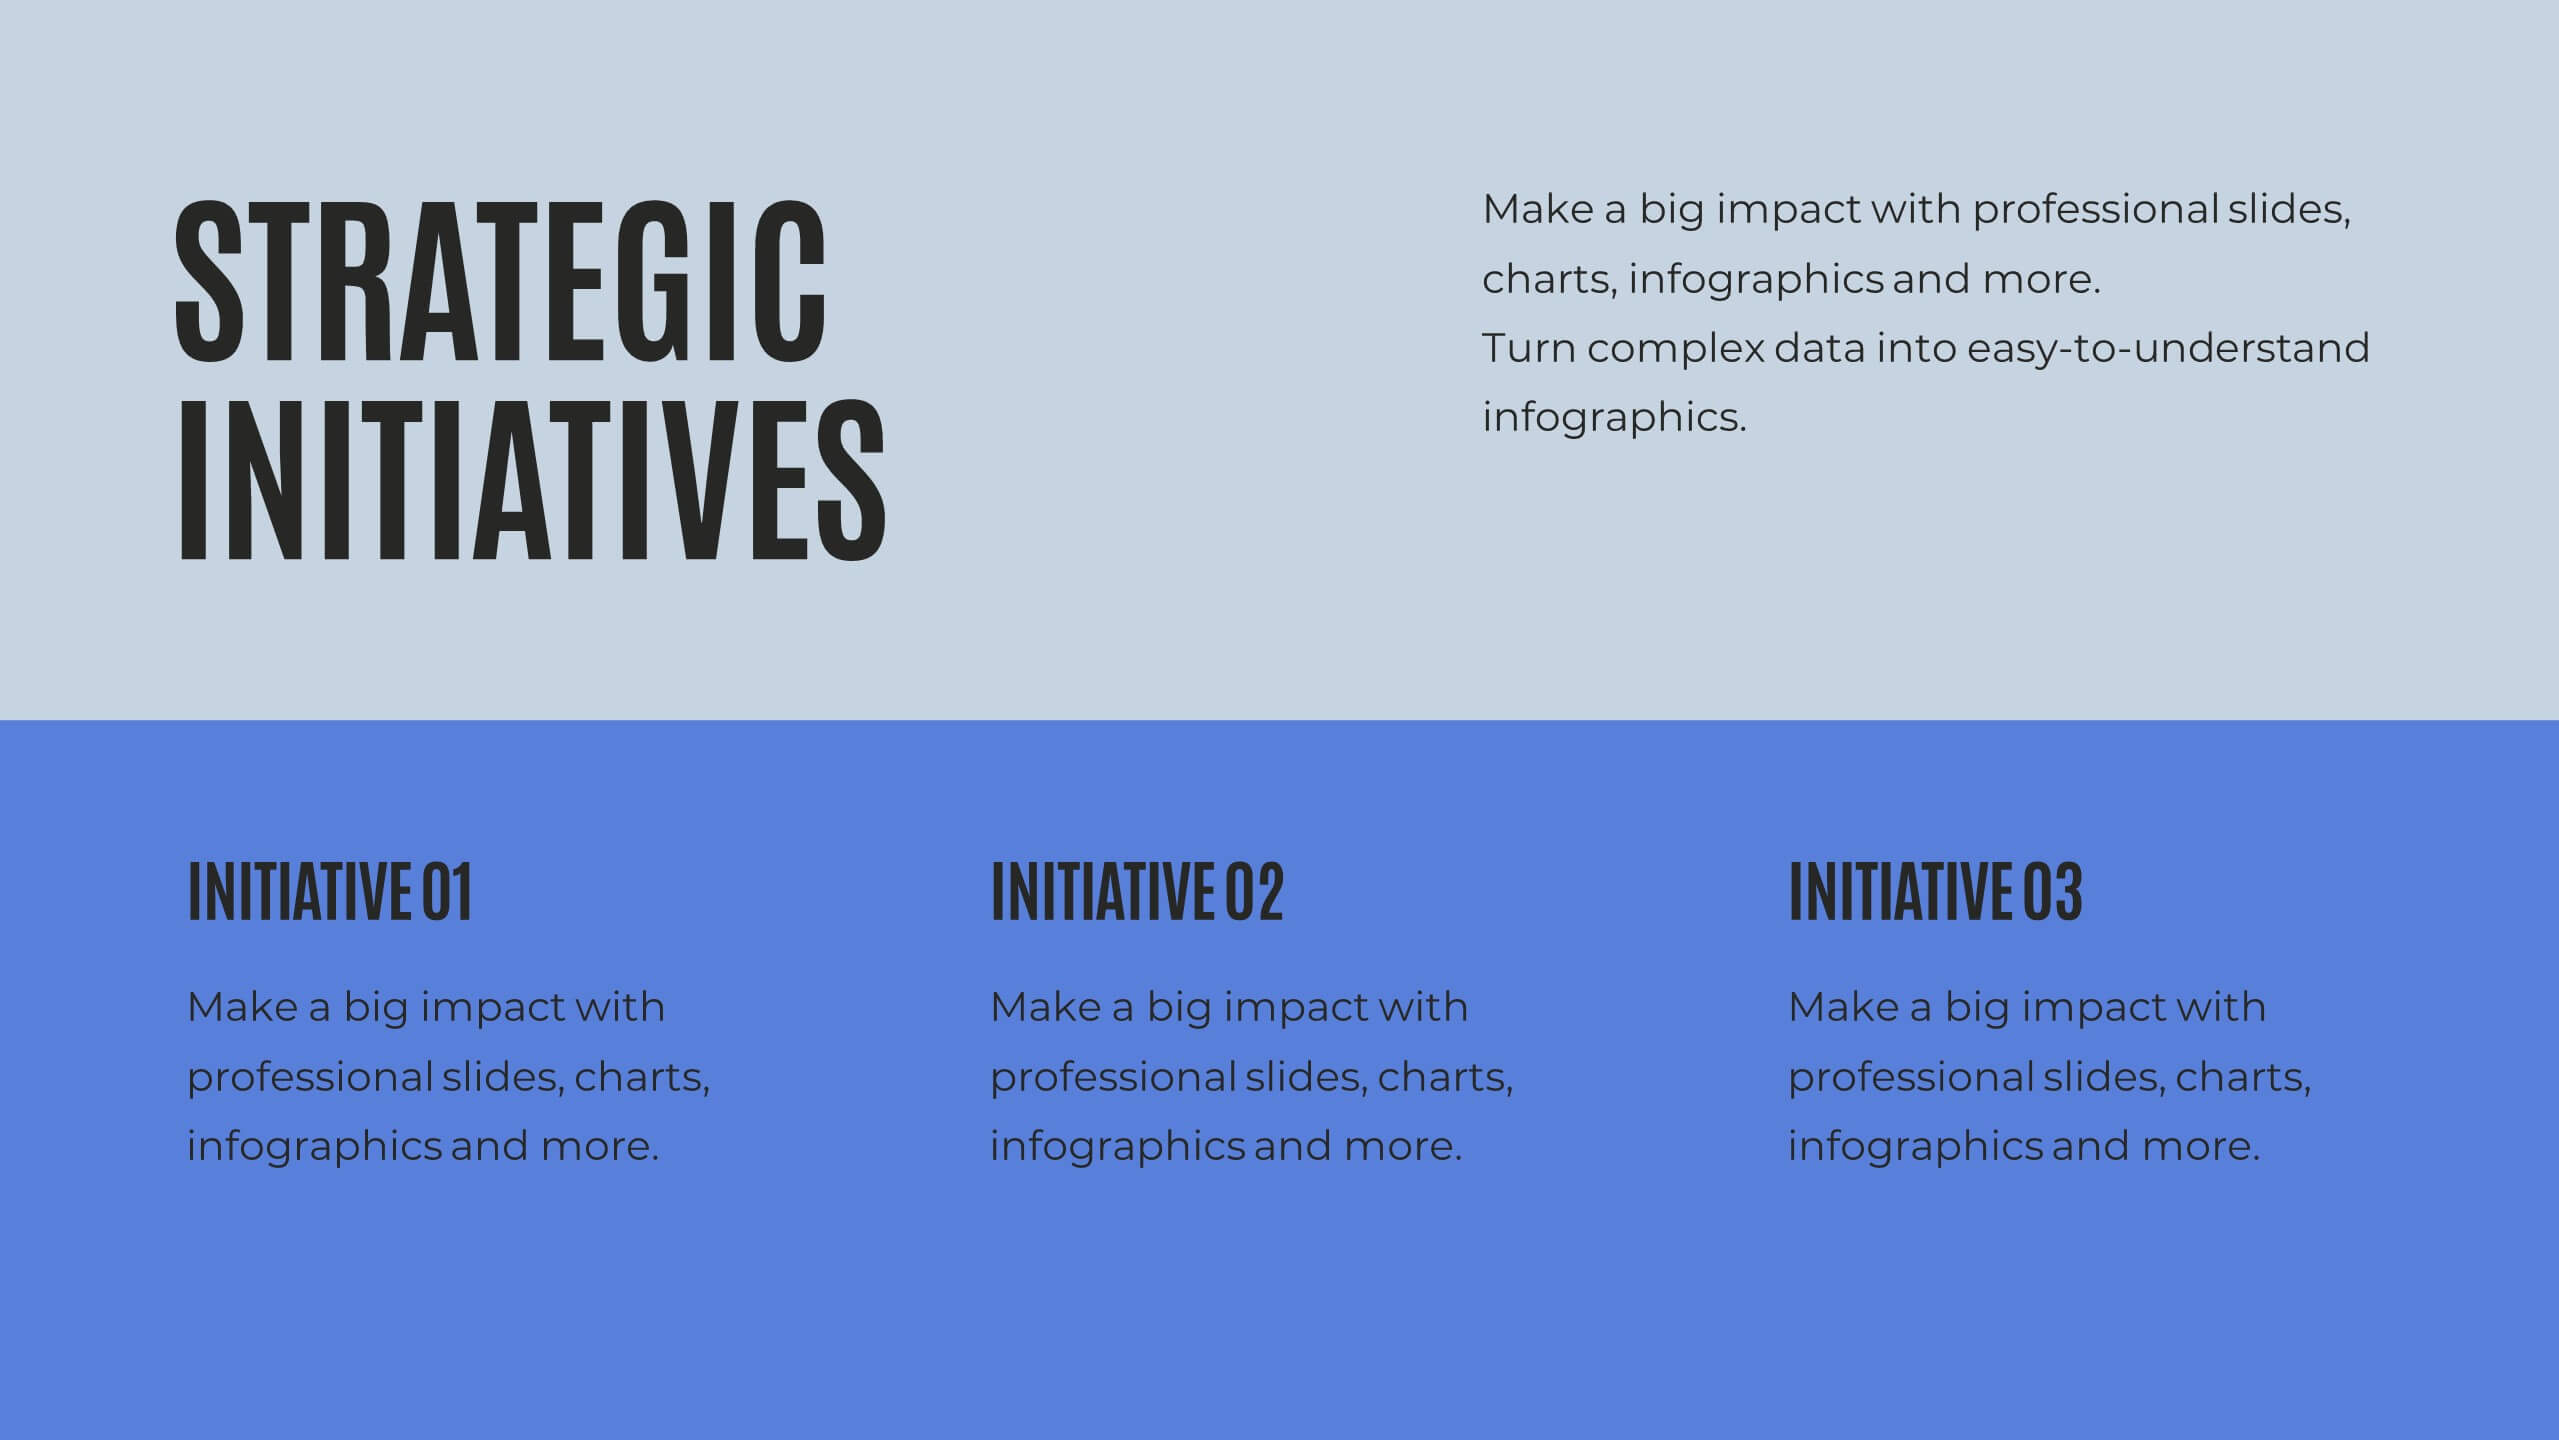
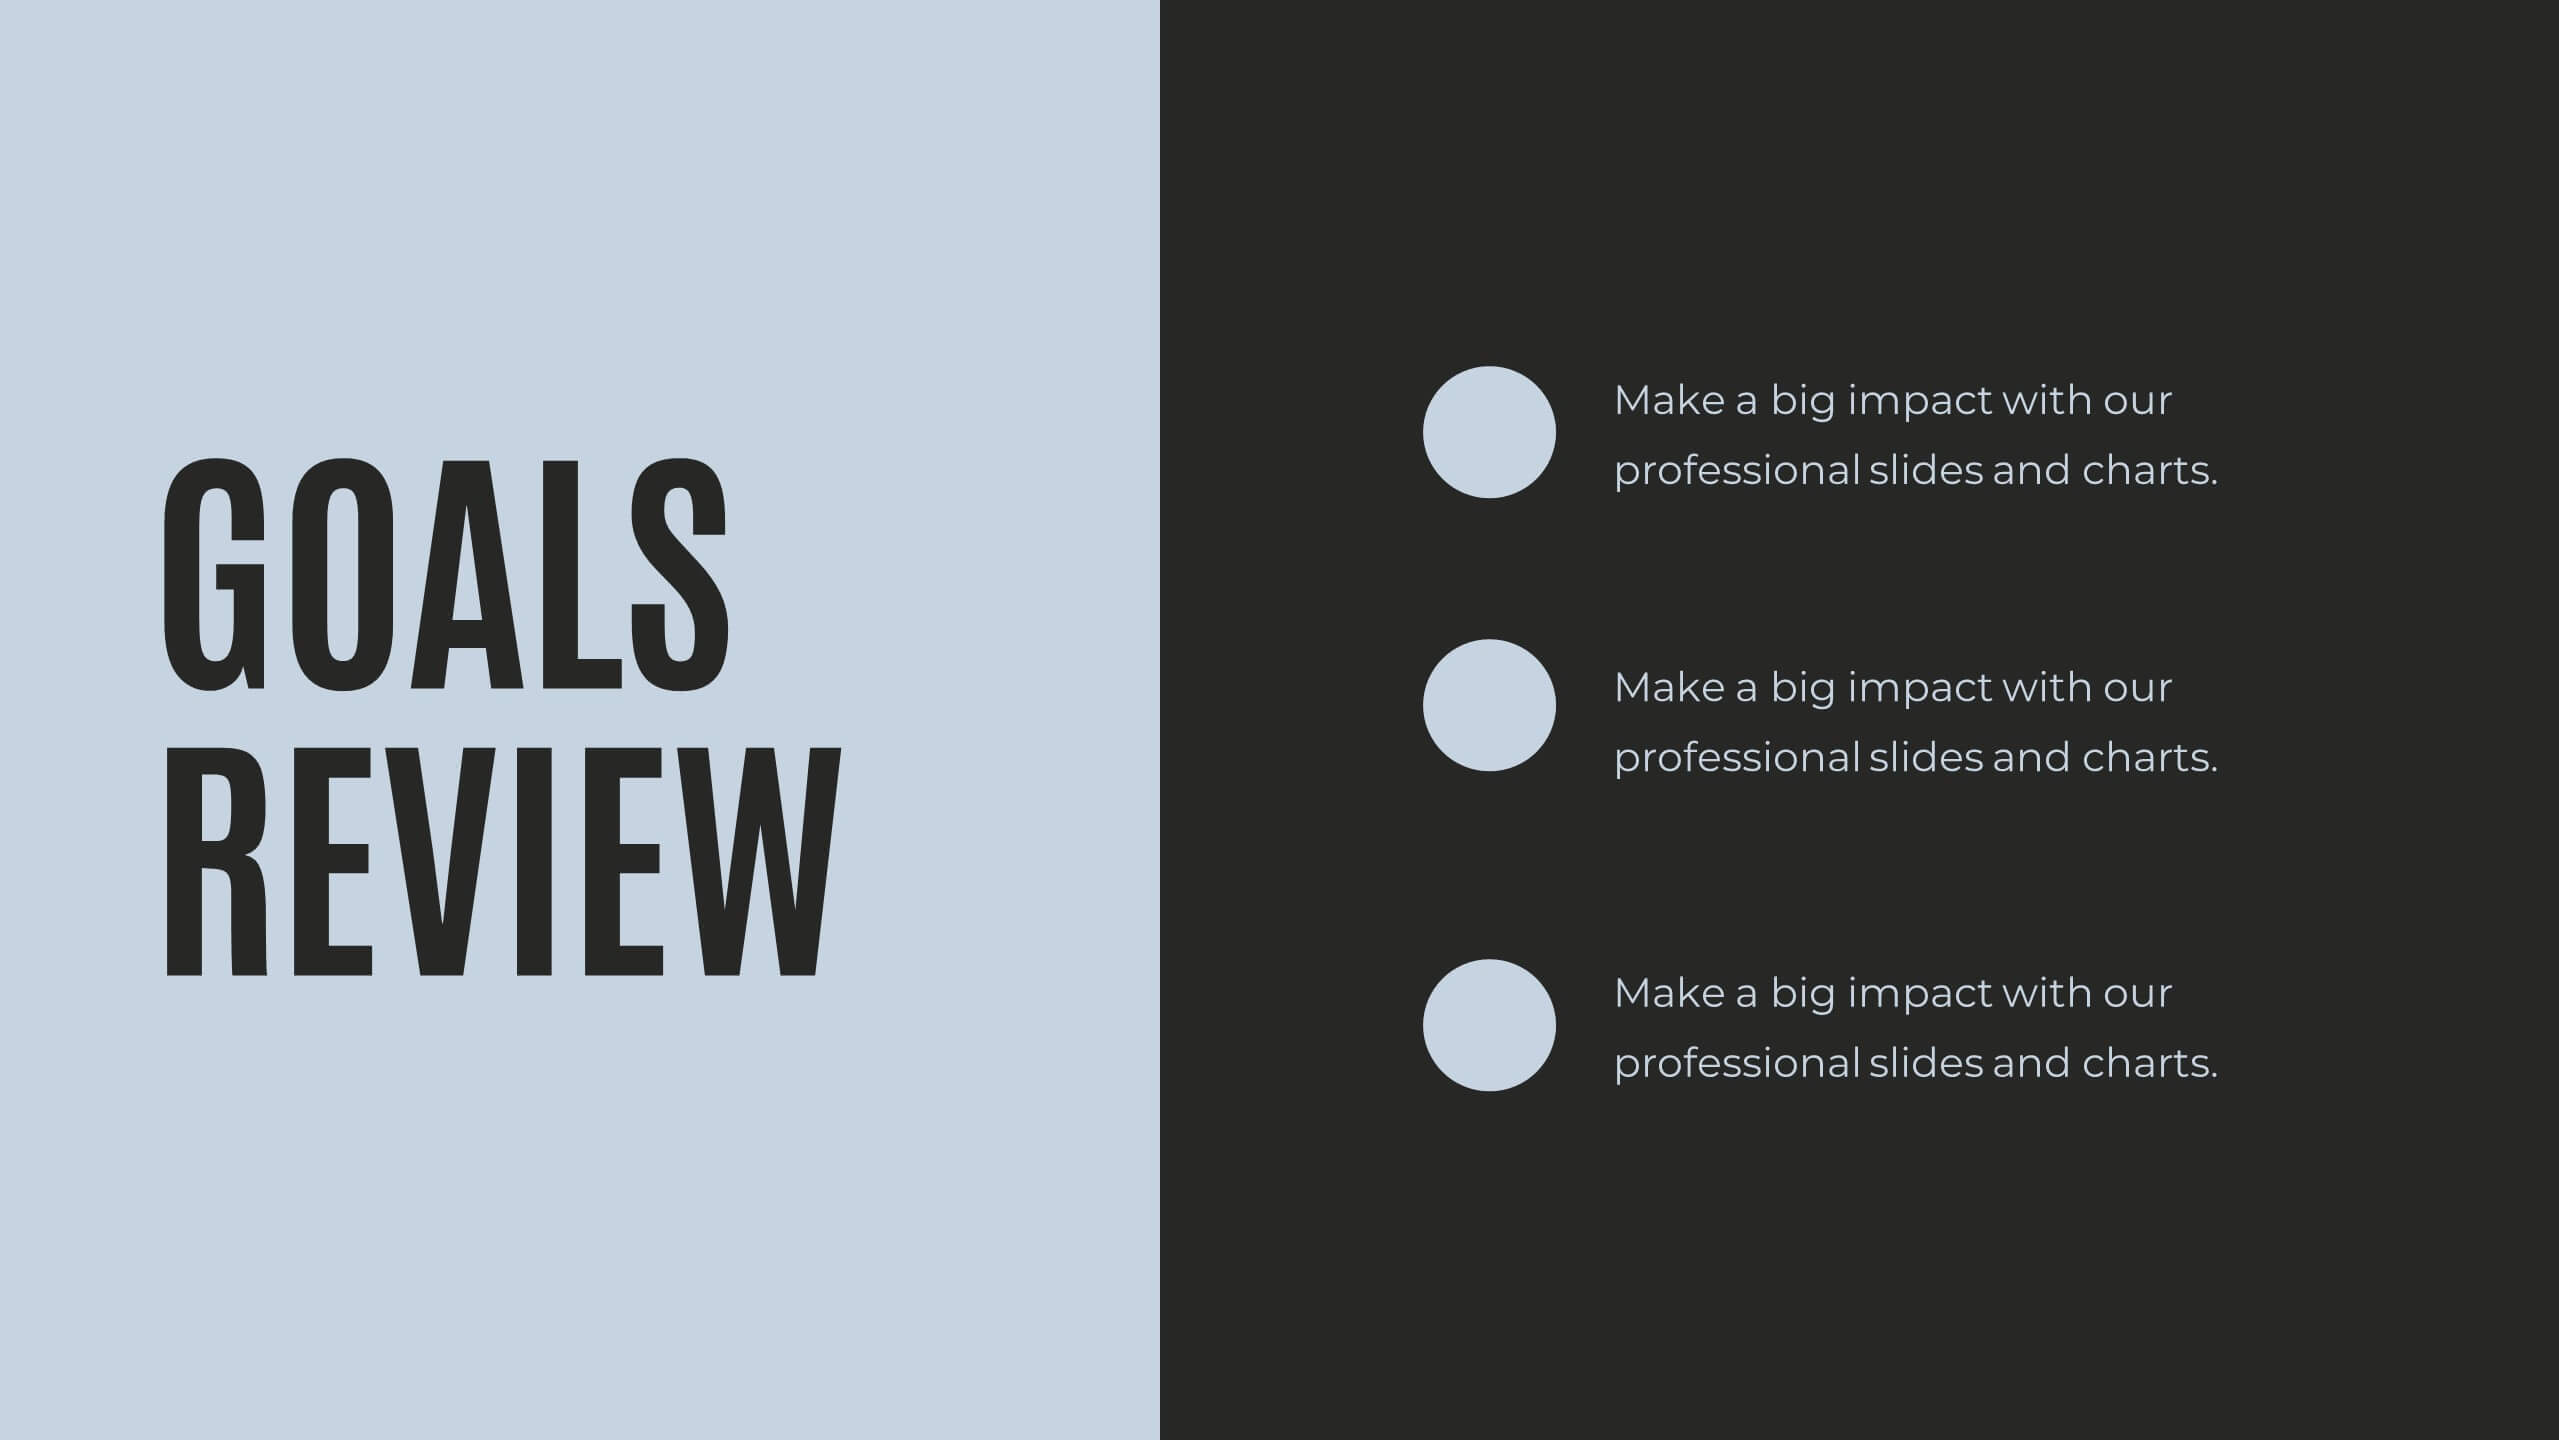
Quill Research Findings Report Presentation
Illuminate your findings with this comprehensive research report template! Perfect for presenting key highlights, performance metrics, and financial summaries, it features professional slides for project progress, risk assessments, and market trends analysis. Engage your audience with clear visuals and detailed content. Compatible with PowerPoint, Keynote, and Google Slides for seamless presentations on any platform.


6 diapositivas
World Map Regions Infographic
The world can be divided into several regions based on various factors such as geography, culture, politics, and economics. This presentation template showcases different regions of the world. It provides an overview of the continents, countries, and key geographic features, allowing viewers to gain a better understanding of global geography and the distribution of regions. The visually appealing design and concise information make it easy for viewers to grasp the geographic layout of the world and appreciate the diversity of regions. Compatible with Powerpoint, Keynote, and Google Slides.