


Características


¿Tienes alguna pregunta?
Recomendar


8 diapositivas
Monthly and Weekly Planning Calendar Presentation
Stay ahead of your schedule with this all-in-one monthly and weekly planner template. Designed for professionals and teams who need to balance long-term goals with daily priorities, this presentation offers a 6-week overview, to-do list, notes section, and weekday breakdown. With sleek color-coded tabs and editable labels, it’s perfect for time-blocking, campaign tracking, or event coordination. Easily customizable in PowerPoint, Keynote, and Google Slides.


2 diapositivas
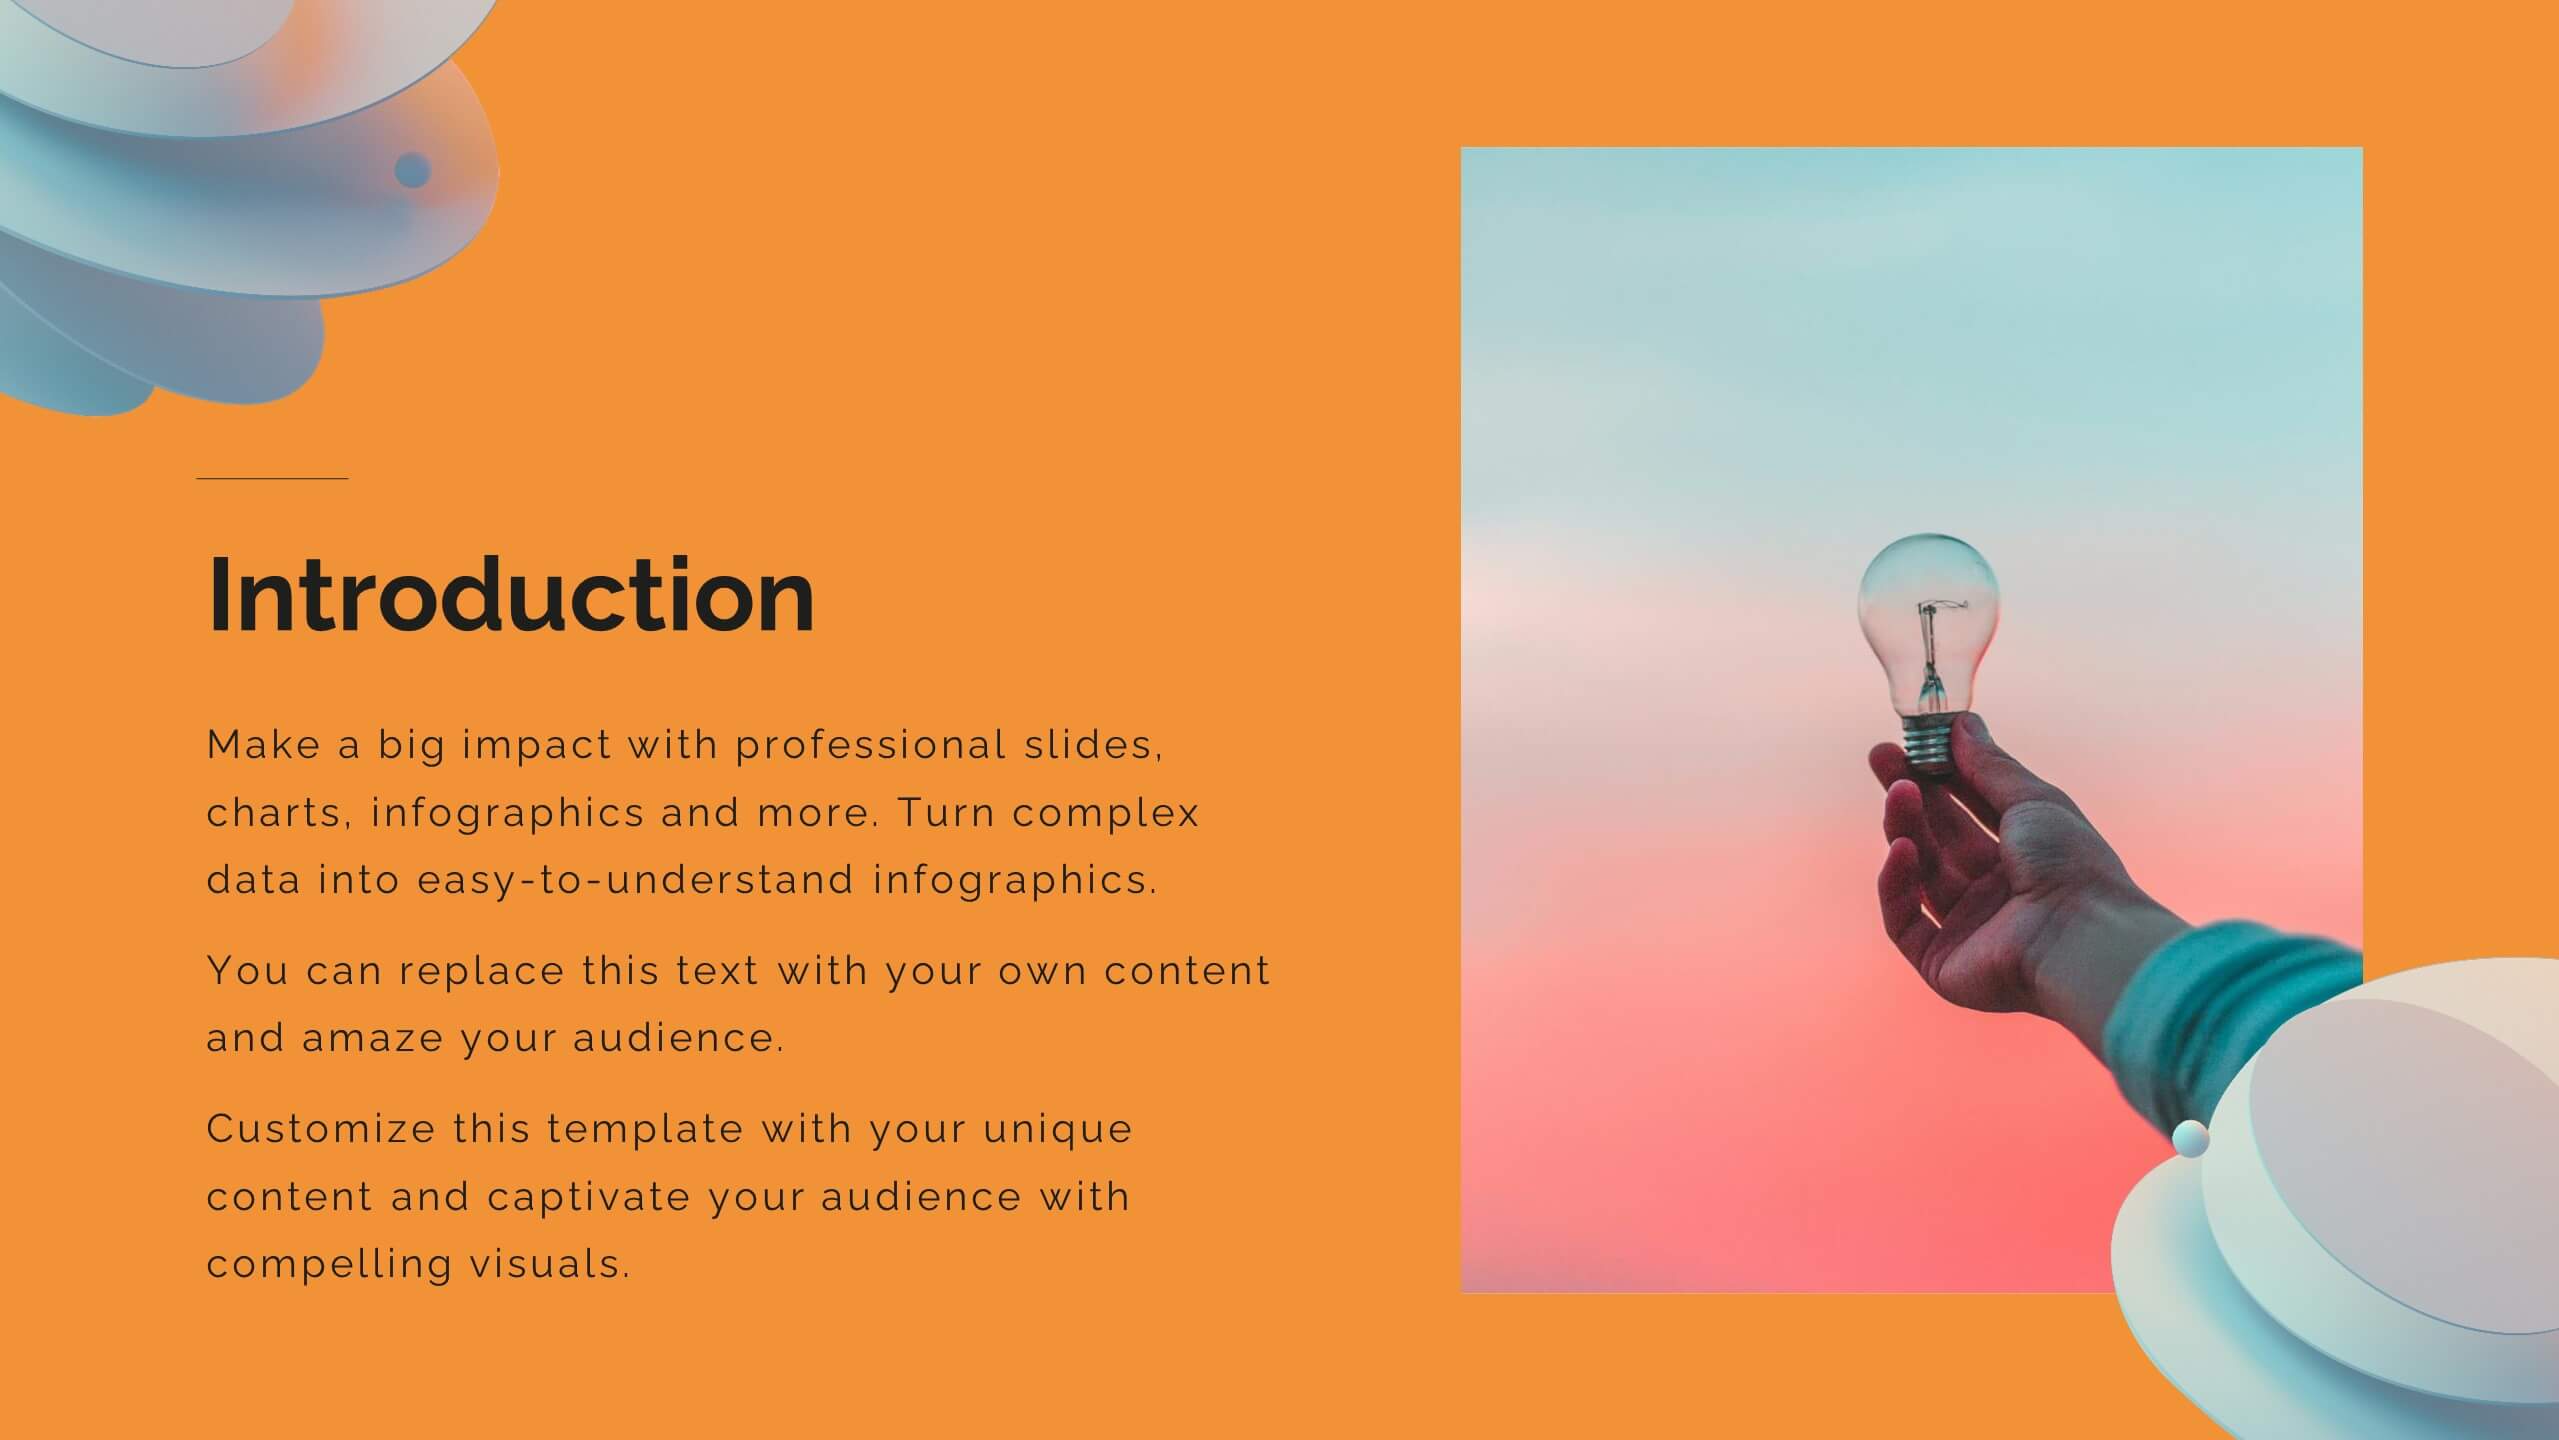
Modern Business Cover Slide Presentation
Stand out with this bold and contemporary cover slide. The layout features dynamic geometric shapes and an integrated photo section, perfect for making a memorable first impression. Whether you're presenting to clients or stakeholders, this slide combines style and structure to deliver your brand message clearly. Fully customizable and easy to edit in PowerPoint, Keynote, and Google Slides.


20 diapositivas
Windsong Sales Proposal Presentation
Craft a persuasive sales proposal with this sleek and professional template. Perfectly suited for communicating your value proposition, this design includes slides for introductions, company overviews, and a detailed service summary. Address critical business factors with sections for target markets, competitive analysis, and clearly defined sales objectives. Highlight your sales process, showcase the team's expertise, and build trust through customer testimonials. Dedicated slides for pricing strategies, promotions, and discounts allow you to present a compelling financial offer. Wrap up with an actionable next steps plan and a feedback section to reinforce client engagement. Fully customizable and compatible with PowerPoint, Google Slides, and Keynote, this template combines modern design with functional layouts to ensure your proposal stands out. Ideal for creating a lasting impression.


20 diapositivas
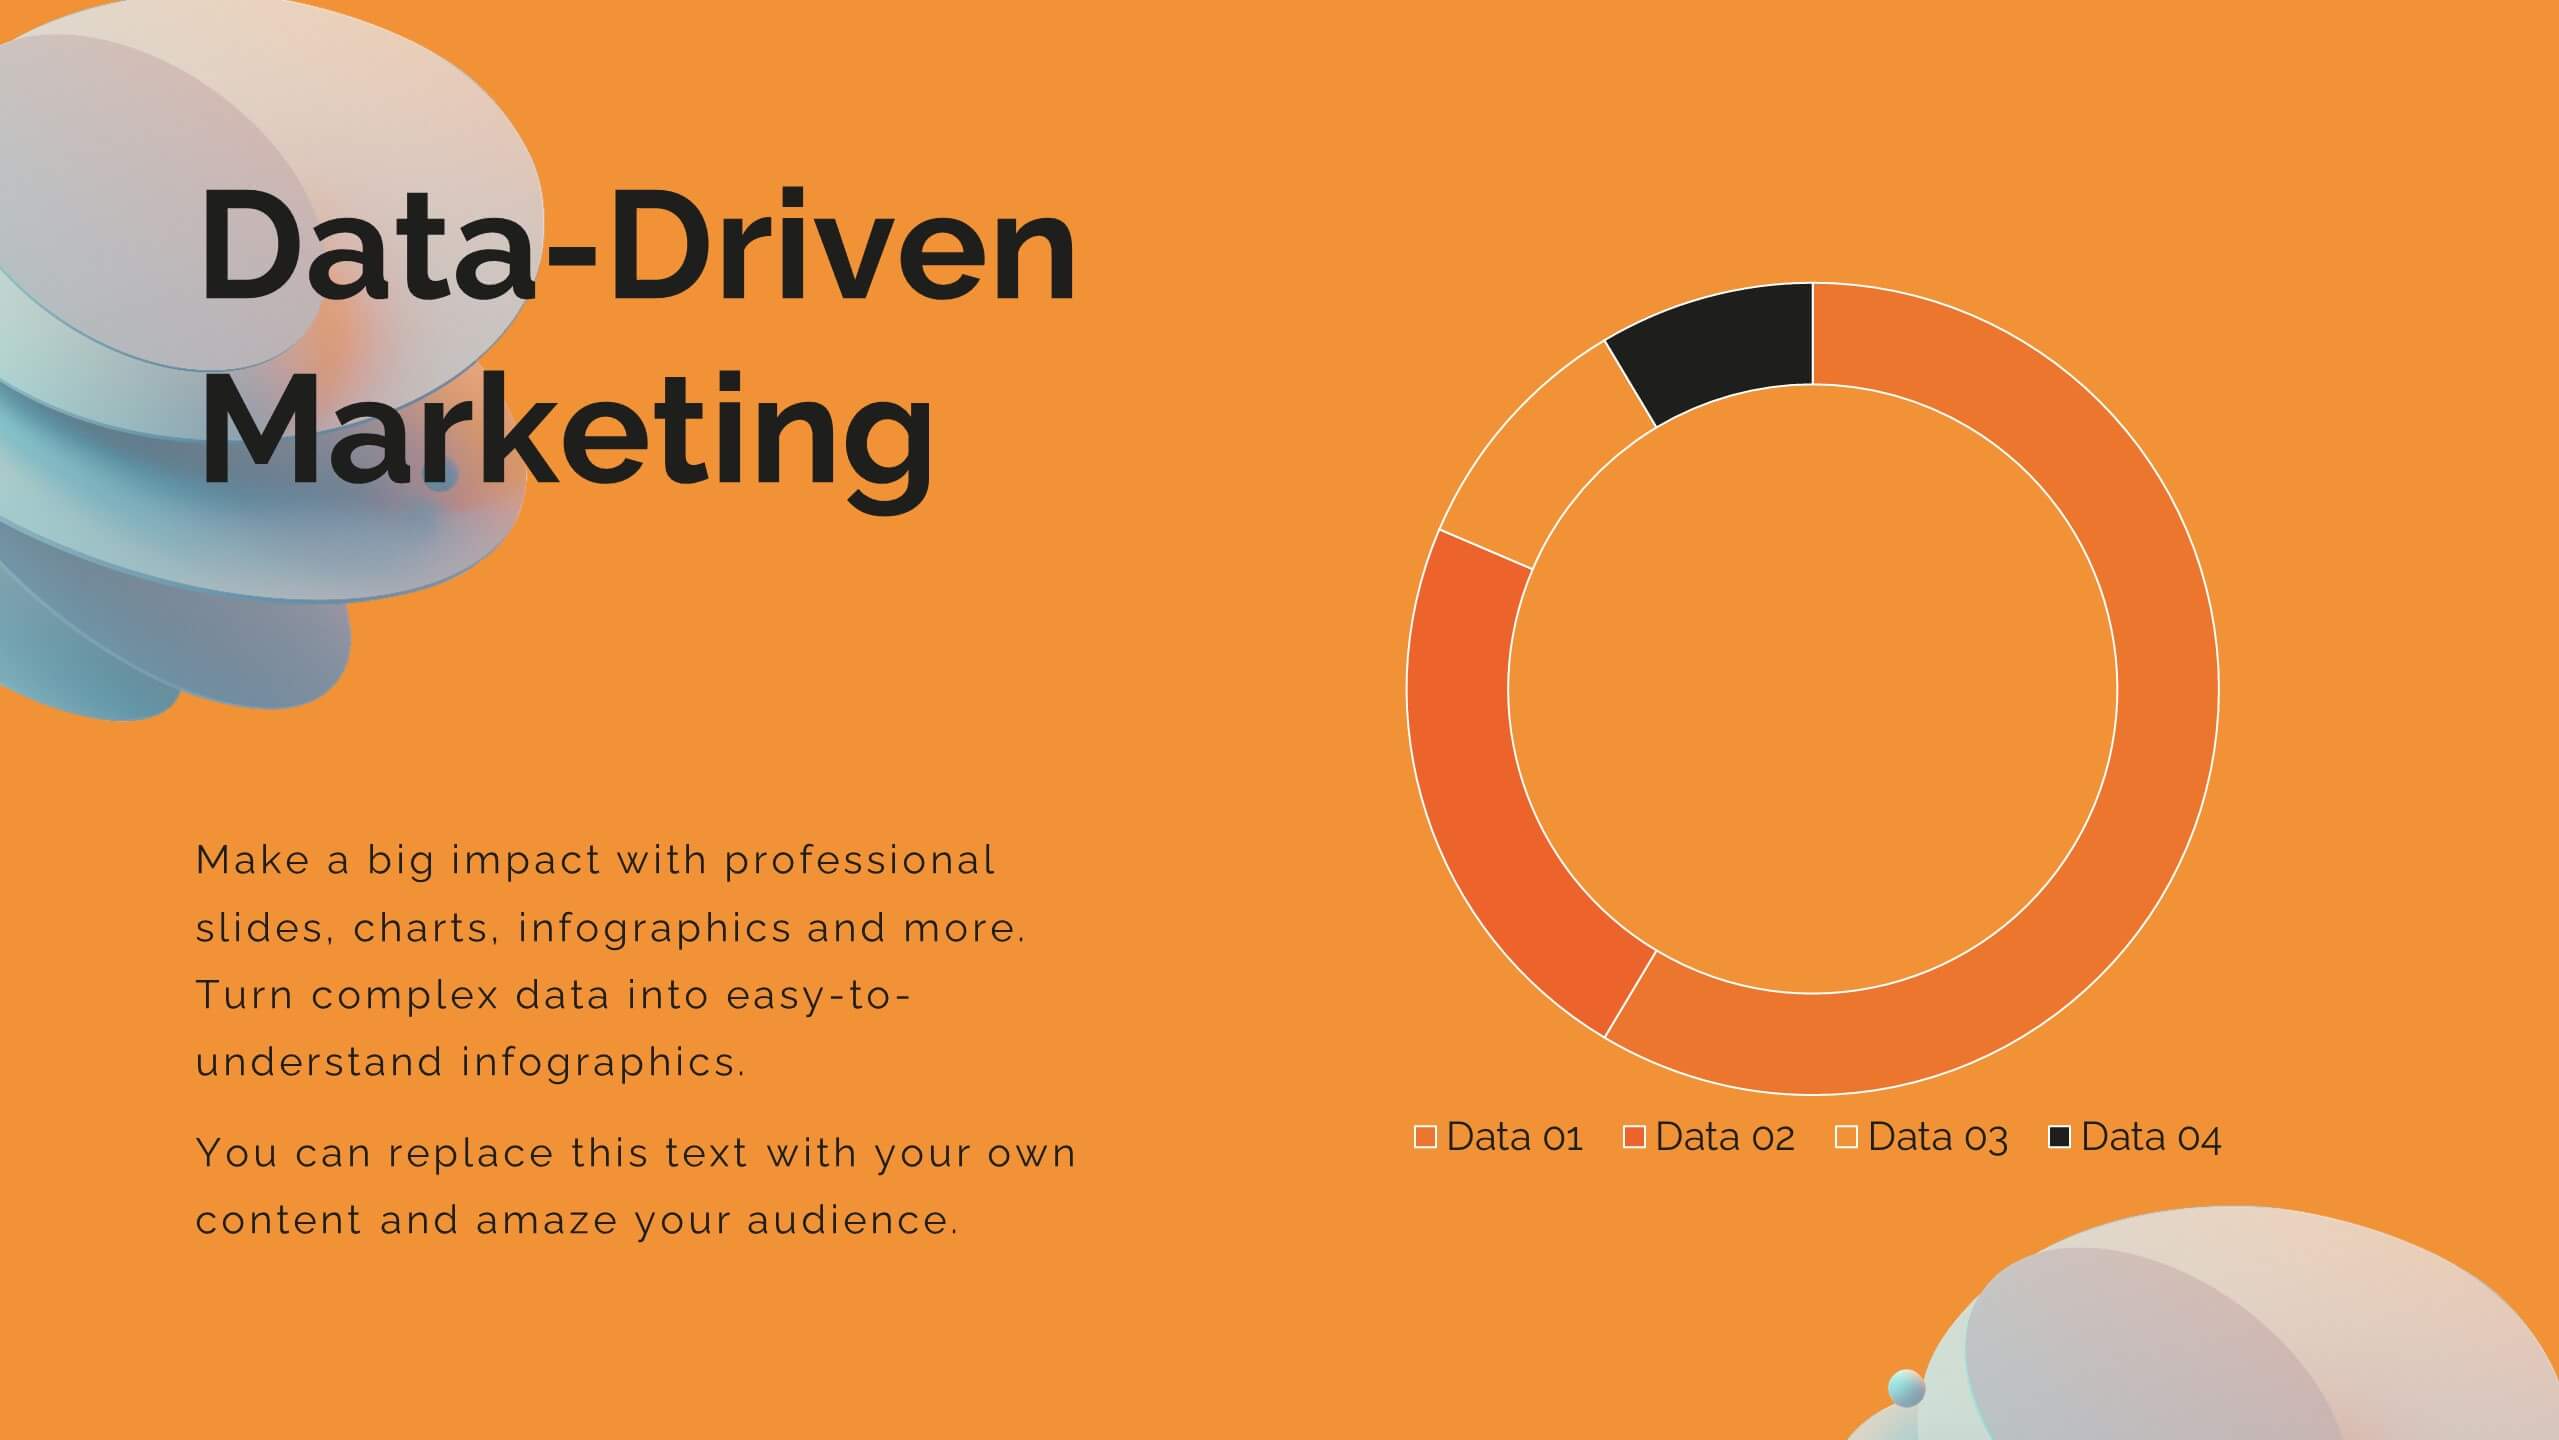
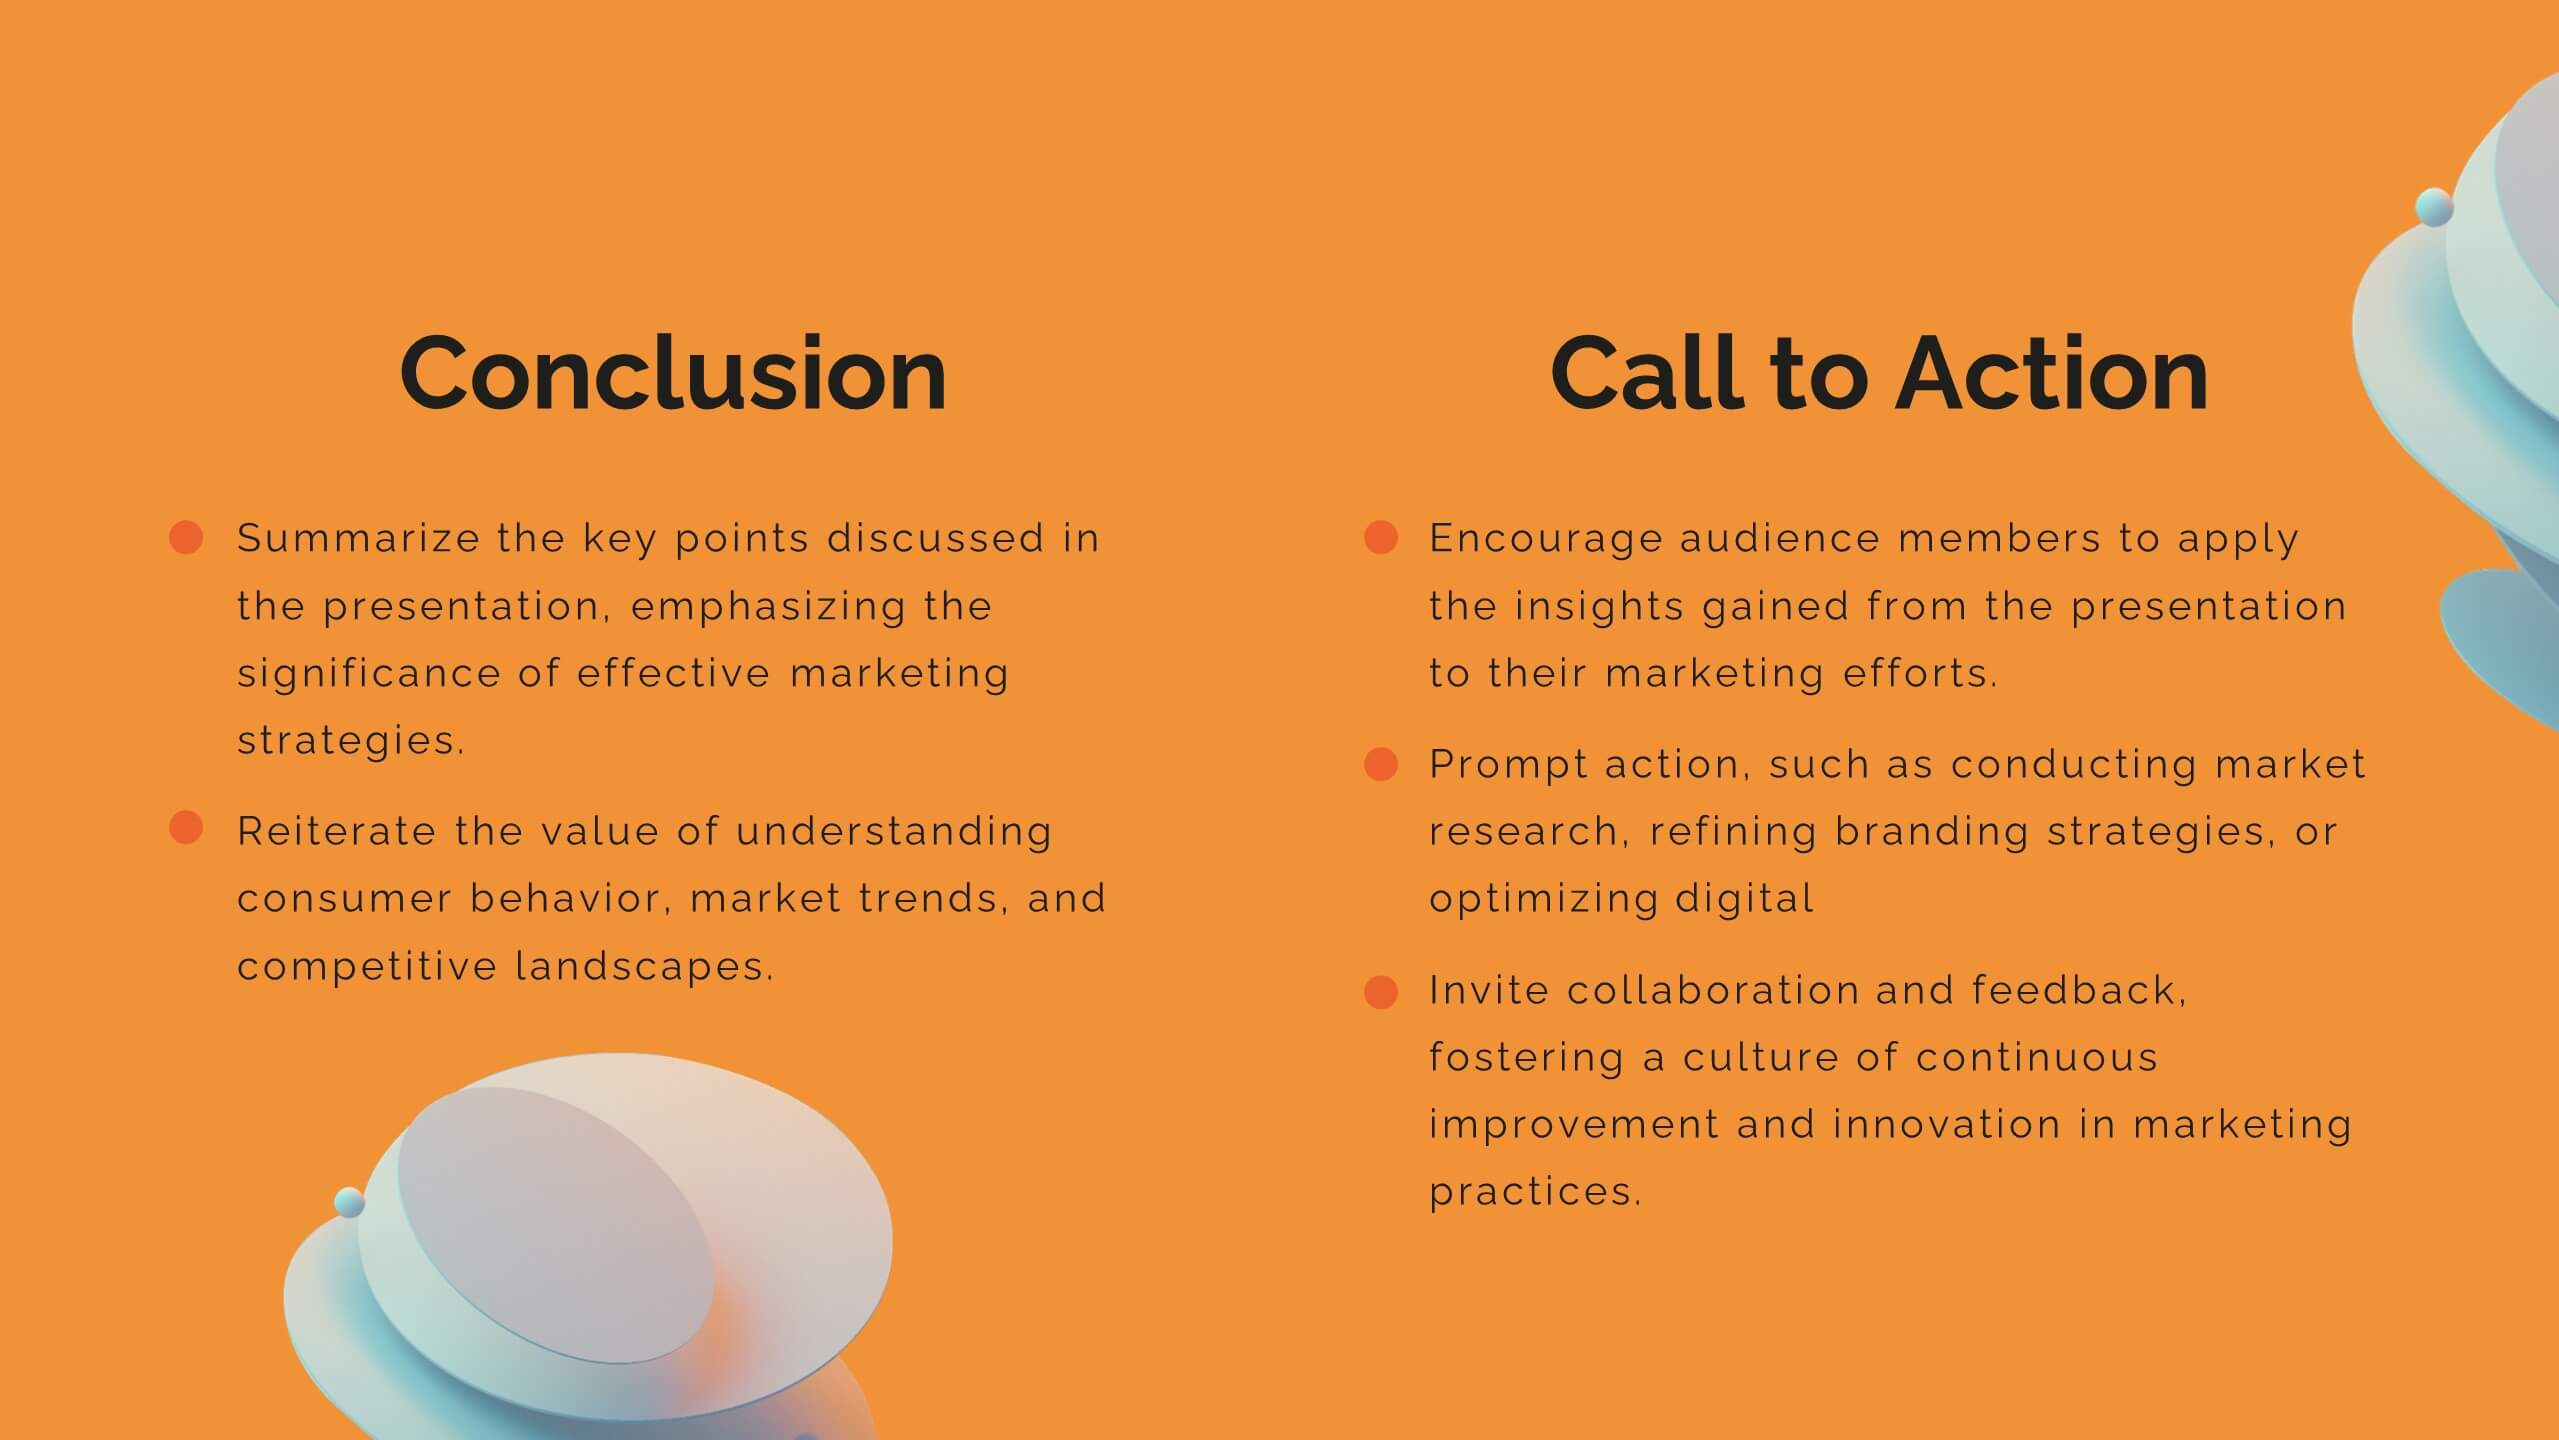
Galaxion Marketing Proposal Presentation
This Marketing Proposal Presentation template offers a comprehensive structure to showcase your strategies, goals, and financial plans effectively. Covering key sections such as objectives, budget breakdown, and timeline, it's perfect for making a strong impression. Fully customizable and compatible with PowerPoint, Keynote, and Google Slides for seamless adaptation to your needs.


6 diapositivas
IT Security Policy Presentation
A bold, clean layout brings your message to life with clarity and confidence. This presentation helps you outline essential guidelines, communicate security expectations, and explain key protective measures in a way your audience can easily follow. Designed for professionalism and simplicity, it works seamlessly in PowerPoint, Keynote, and Google Slides.


5 diapositivas
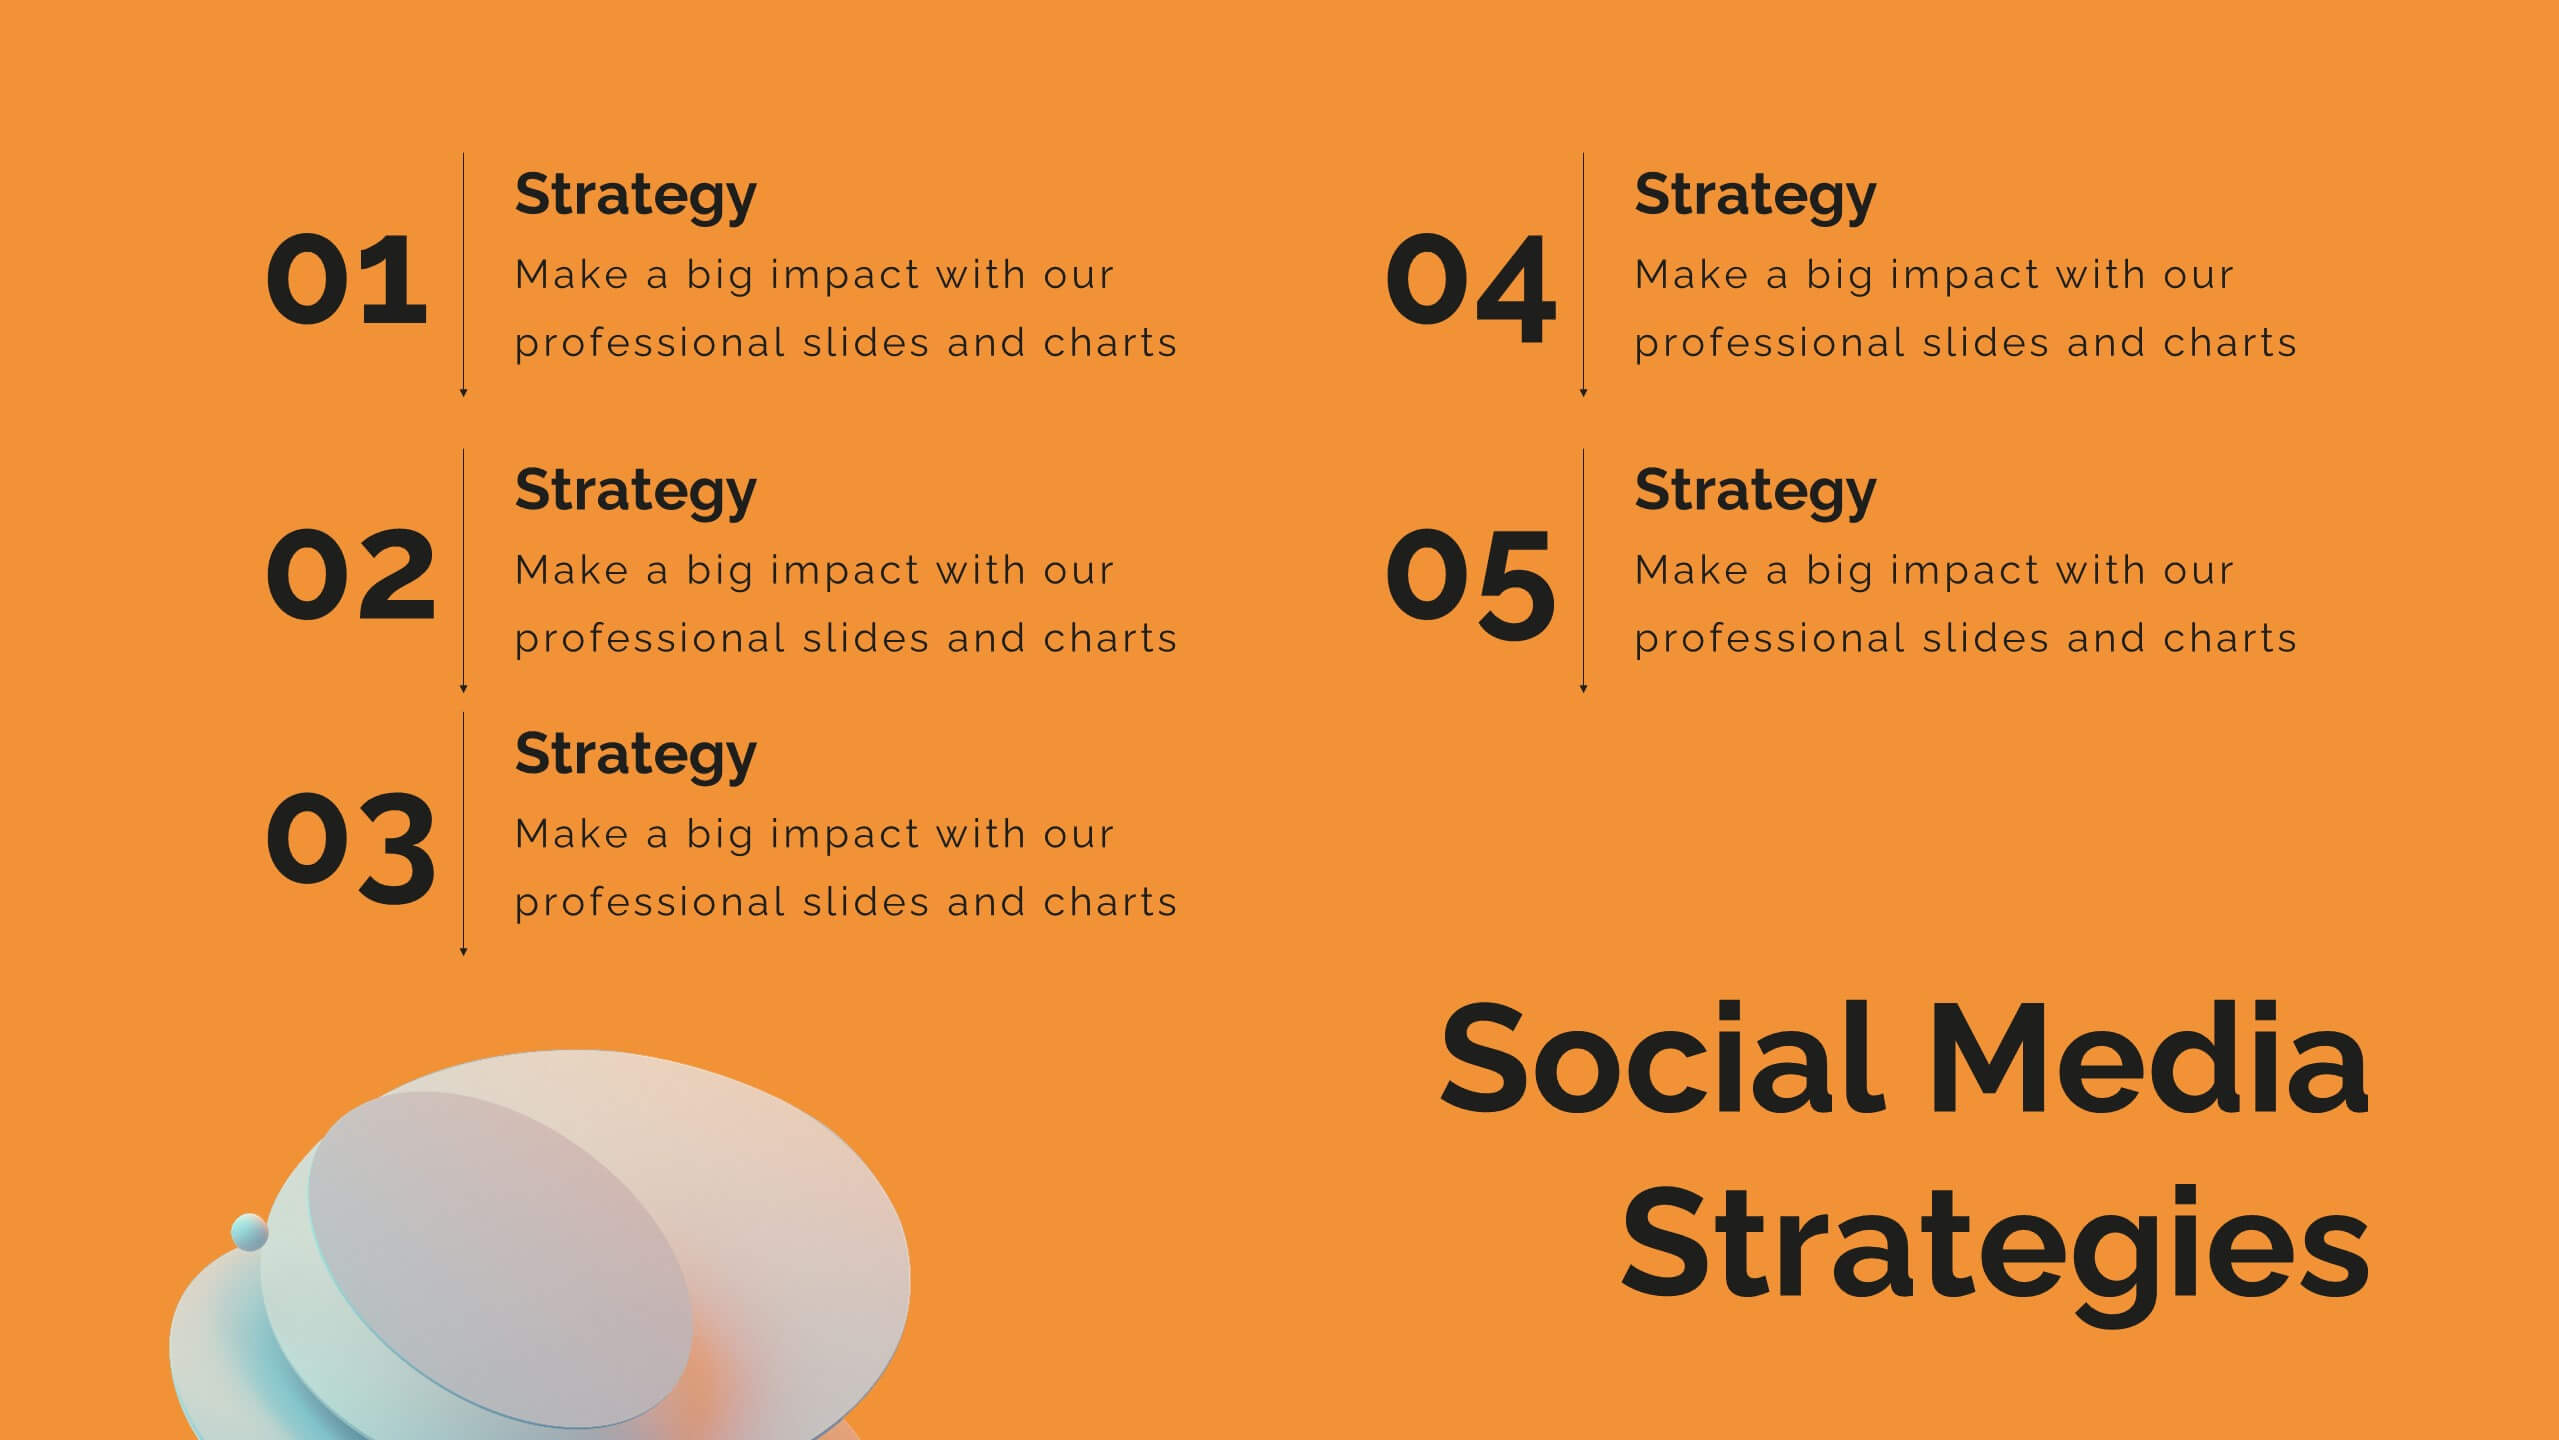
Business Planning and Execution Presentation
Align your business objectives and execution plan with this modern, arrow-themed presentation slide. Featuring four sequential sections with bold icons and customizable titles, this layout is perfect for showcasing milestones, KPIs, or phases of a strategic process. Designed for clarity and impact, it's compatible with PowerPoint, Keynote, and Google Slides.


3 diapositivas
Remote Work Culture and Guidelines Presentation
Bring remote teamwork to life with visuals that speak your culture. This presentation template simplifies how you communicate expectations, structure, and values for virtual teams. Perfect for onboarding, policy updates, or outlining collaboration tools, it’s designed to keep your message clear and consistent. Fully compatible with PowerPoint, Keynote, and Google Slides.


6 diapositivas
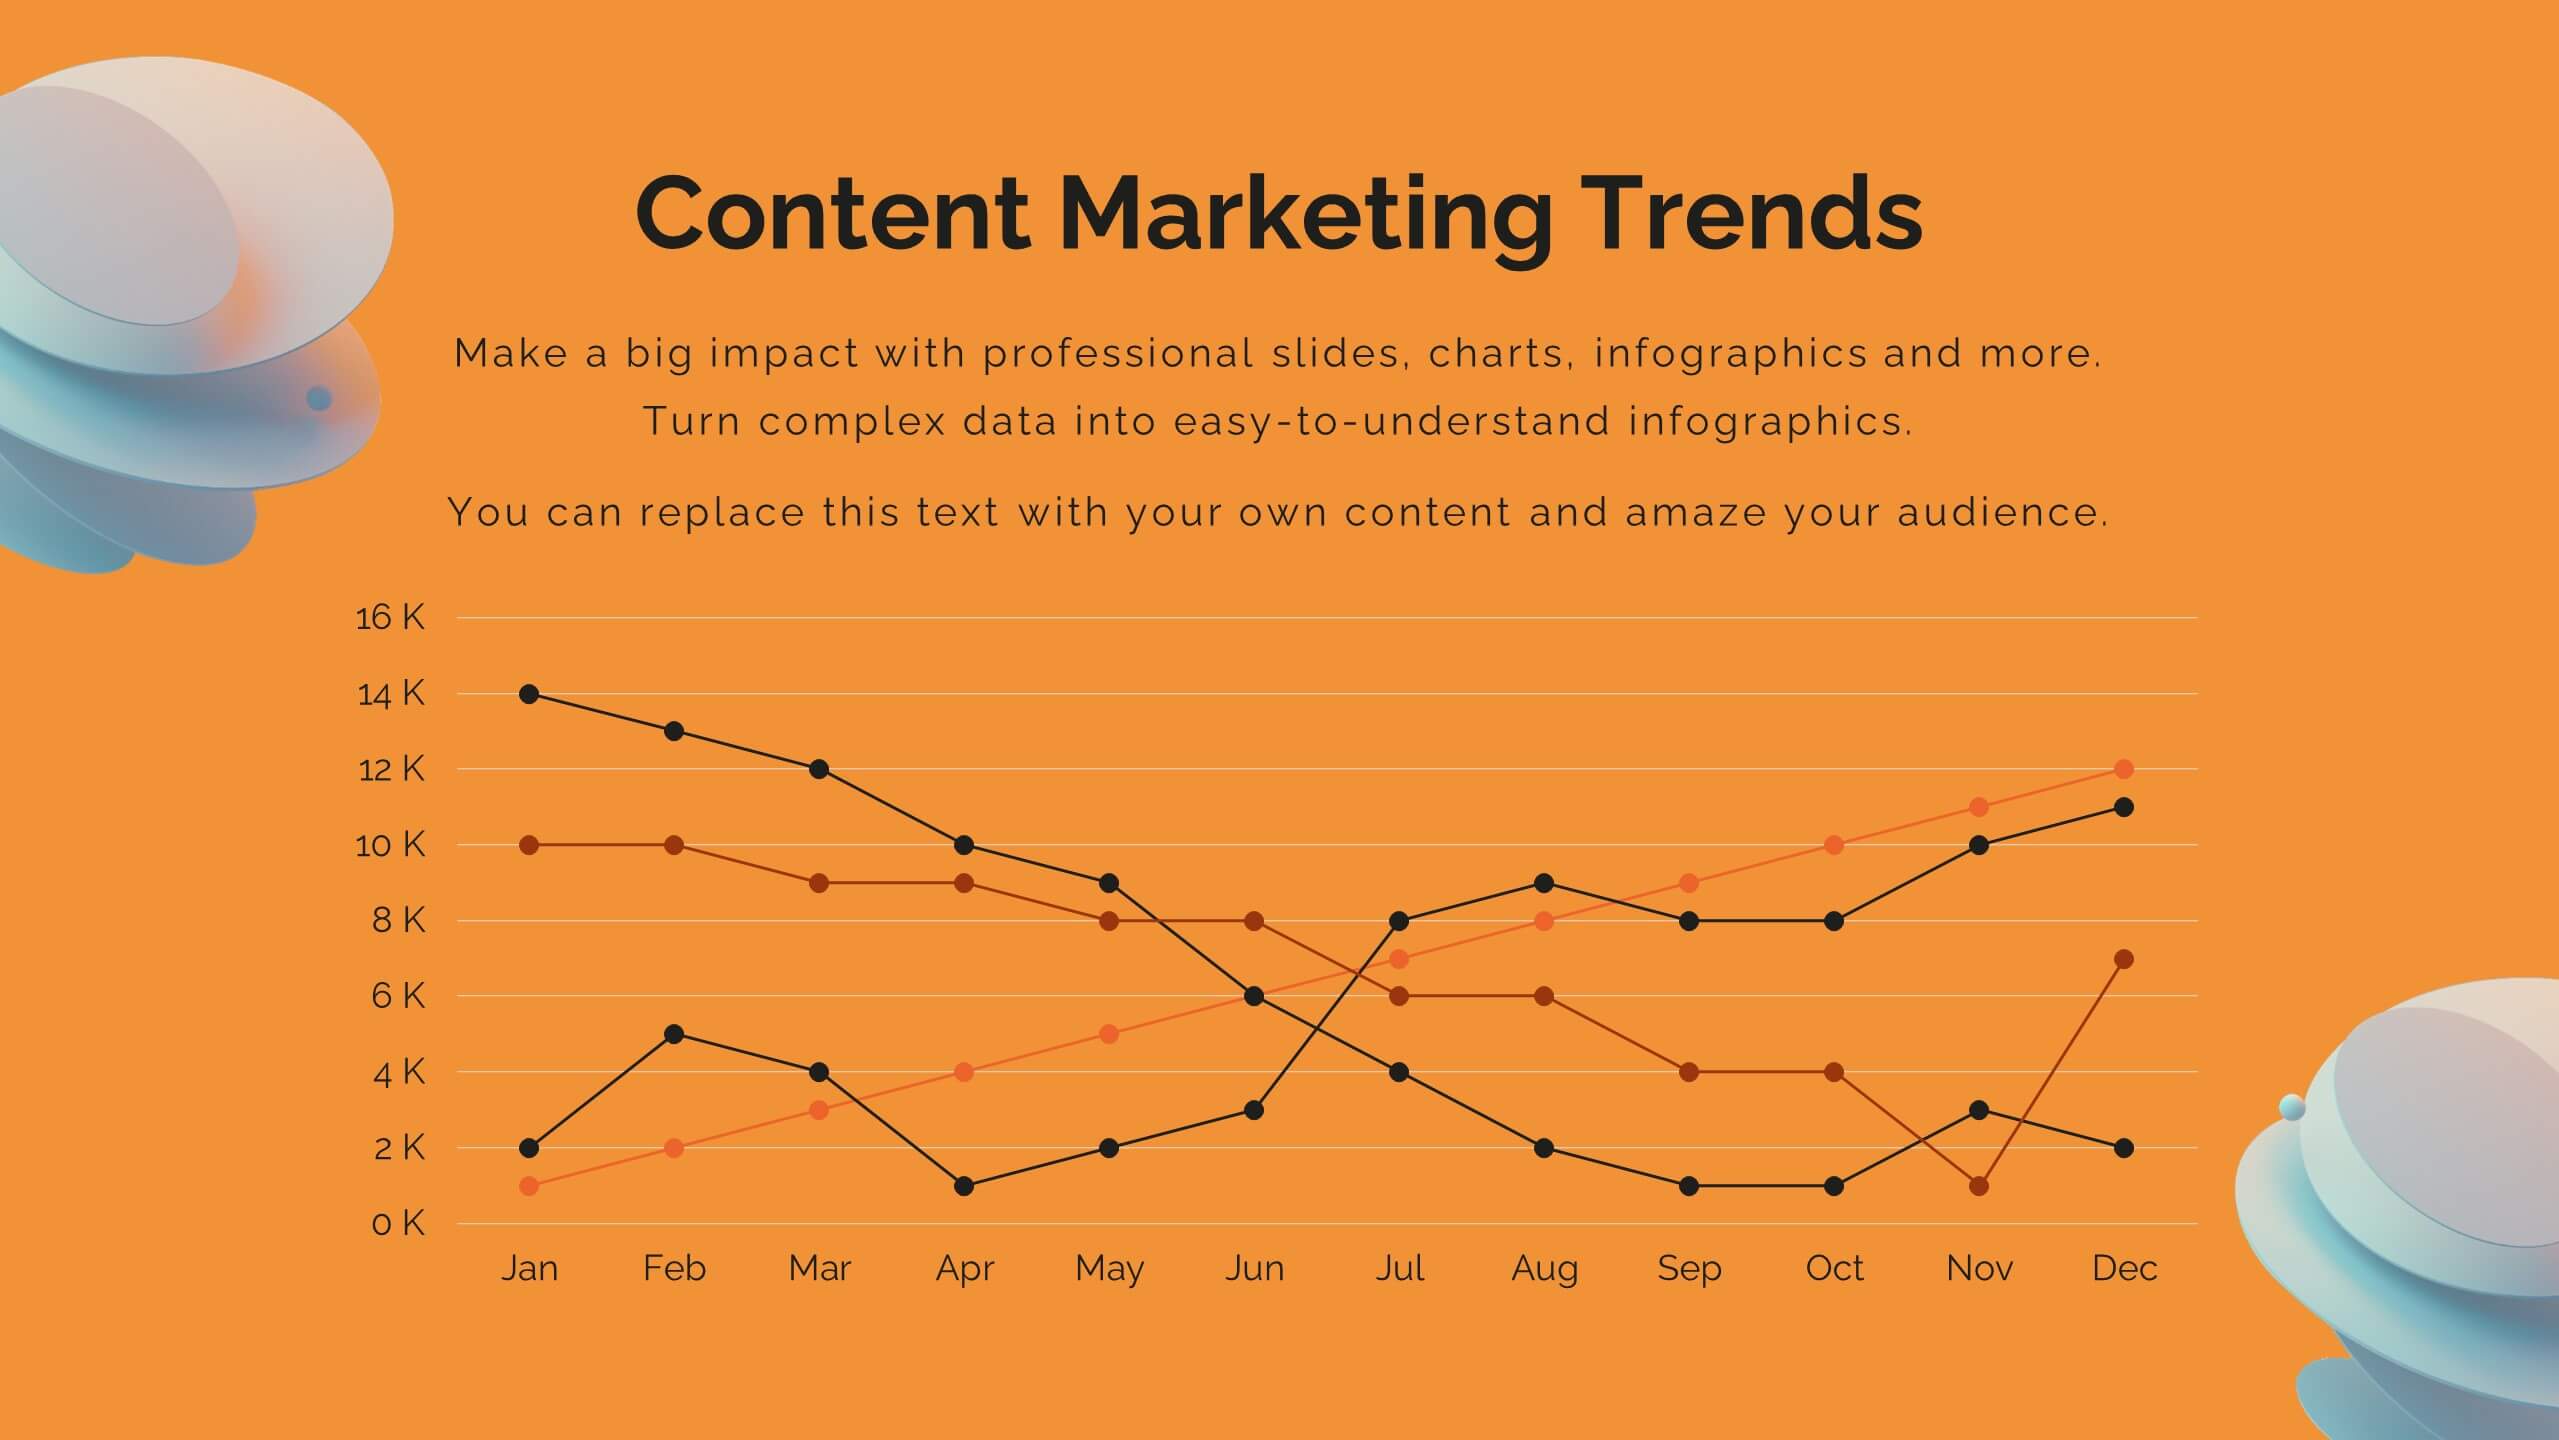
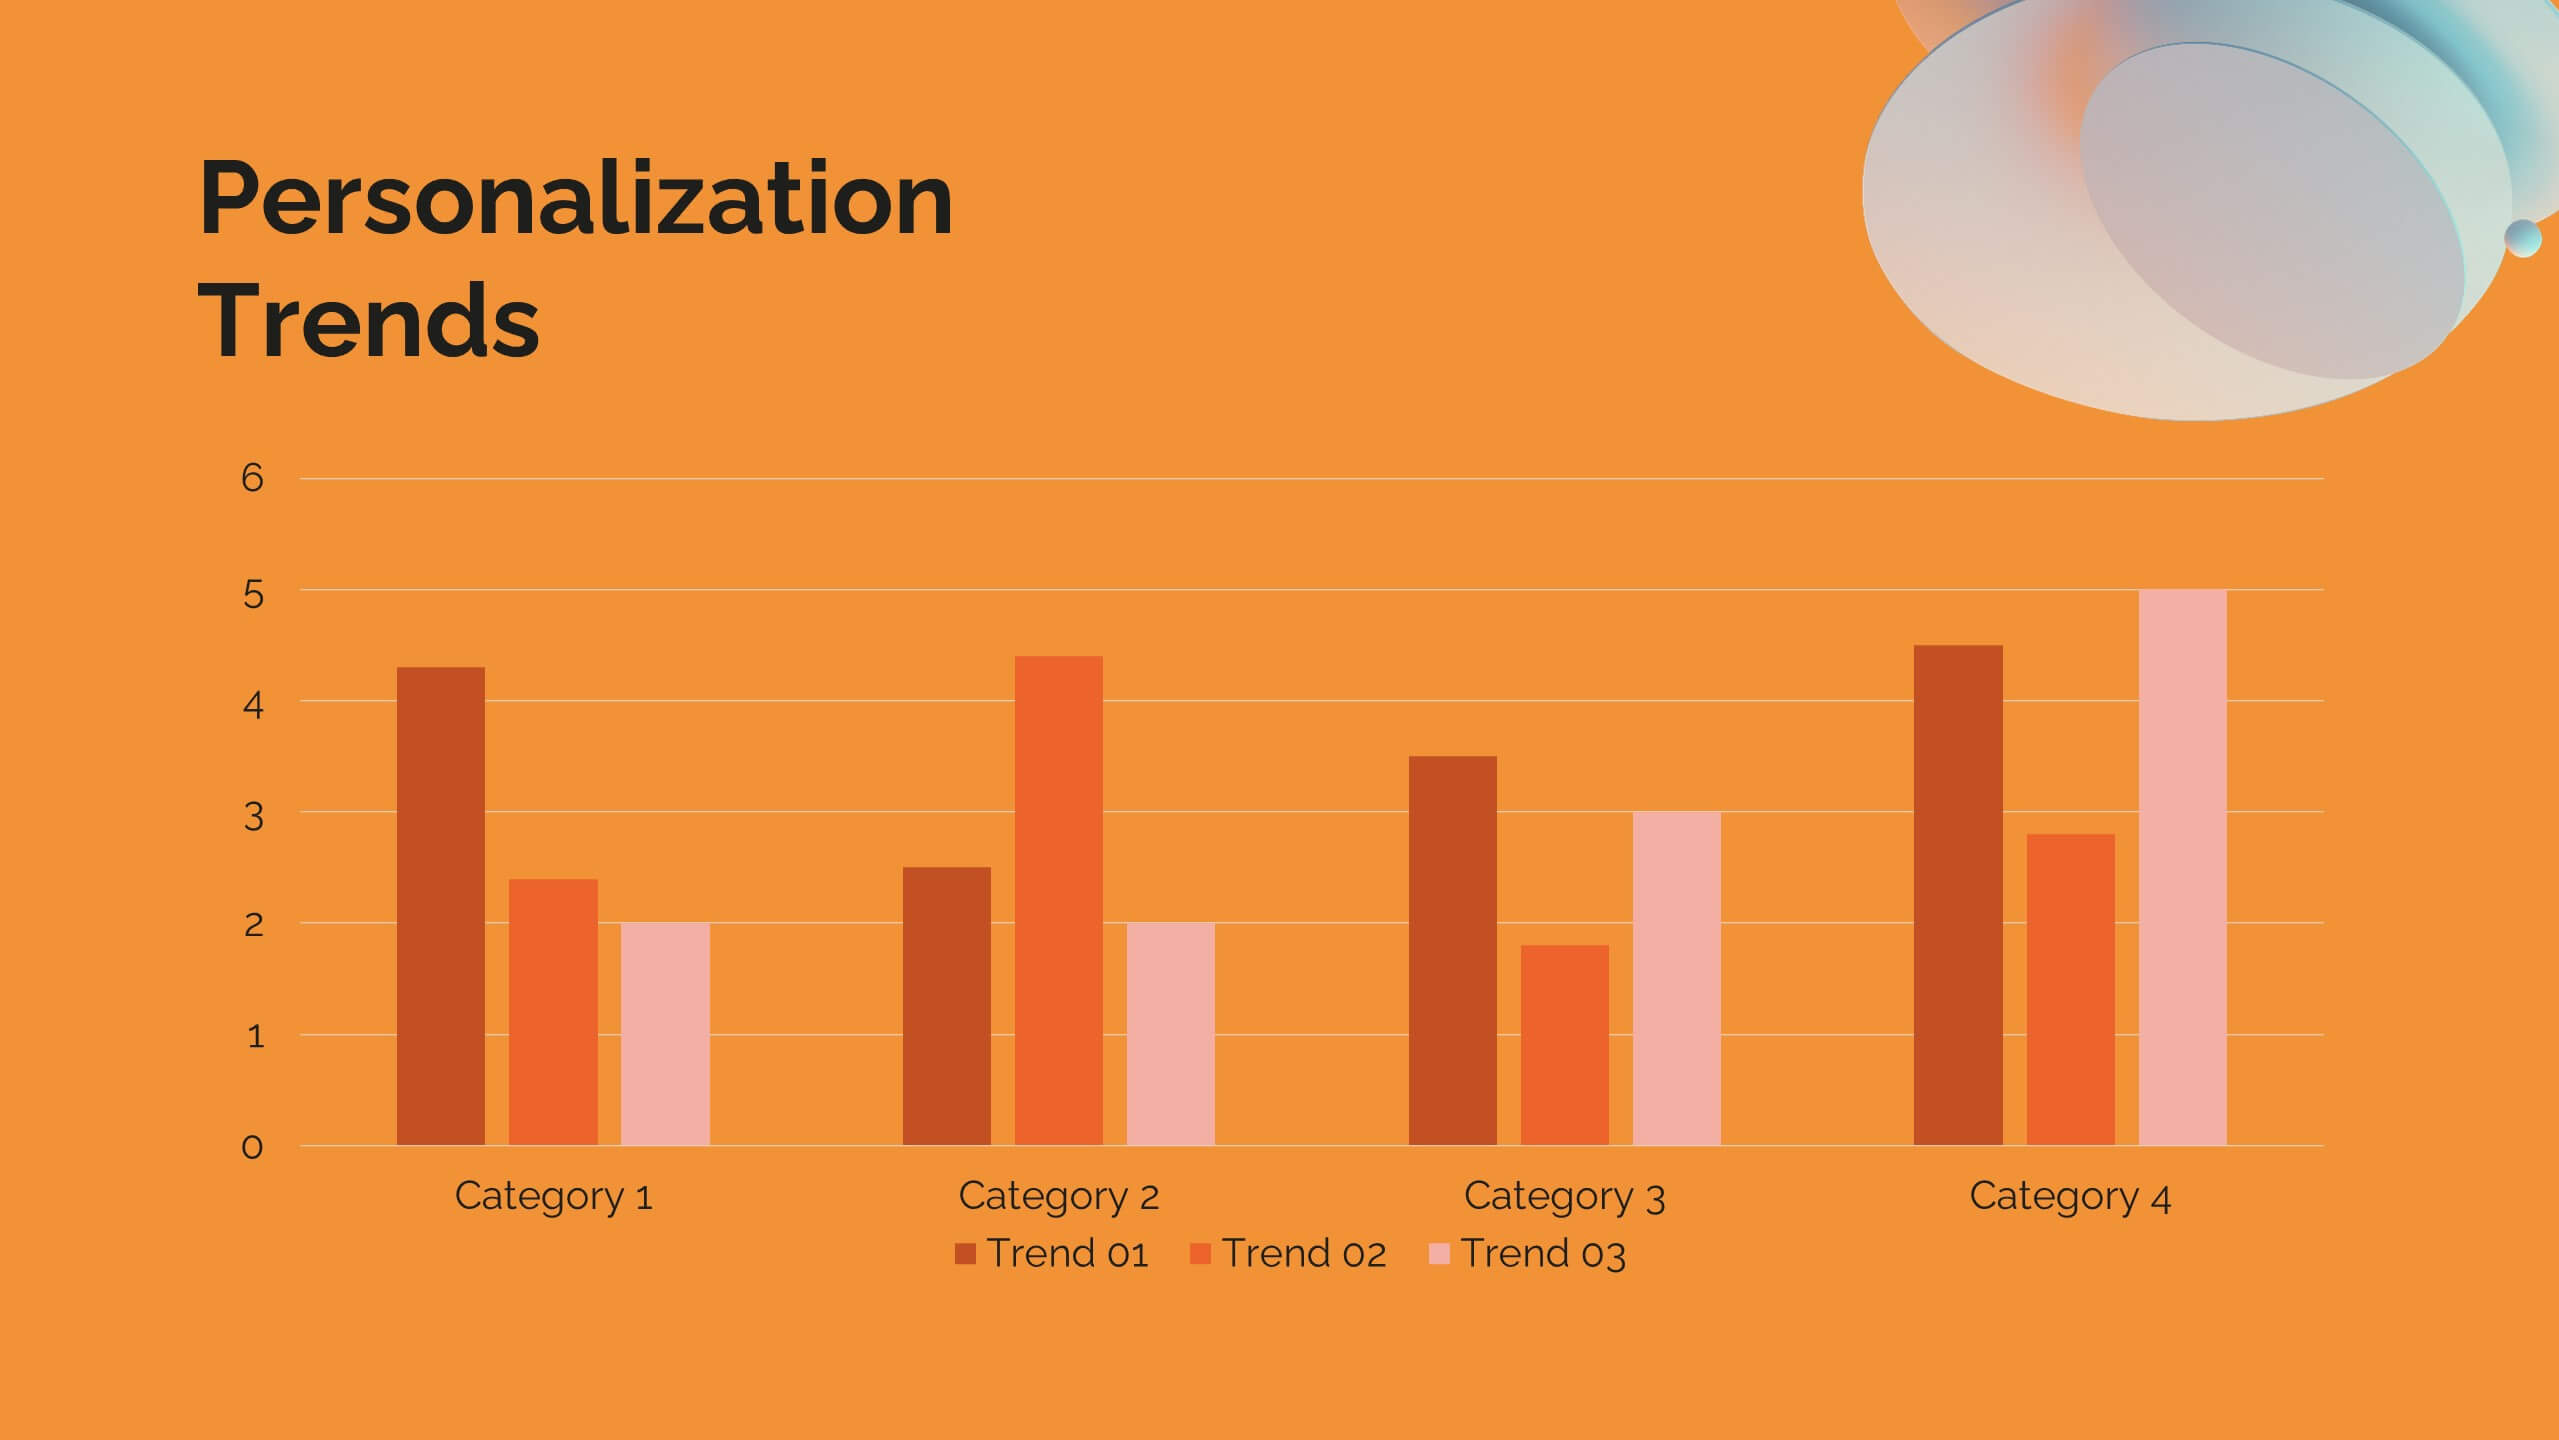
Business Revenue Break-Even Strategy
Visualize profitability with clarity using this dynamic break-even strategy template. Ideal for business analysts, finance teams, and consultants, this diagram highlights the balance between cost, loss, and profit at the break-even point. With intuitive icons and space for key metrics, it's fully editable in PowerPoint, Keynote, and Google Slides.


6 diapositivas
How to Master Time Management Presentation
Make every minute count with this sleek and dynamic template built to visualize productivity, efficiency, and planning. Perfect for showcasing workflows, priorities, or time allocation, it helps communicate structure with clarity and style. Fully customizable and compatible with PowerPoint, Keynote, and Google Slides for effortless editing and presentation.


5 diapositivas
Visionary Leadership Models in Business
Illustrate transformative leadership approaches with the Visionary Leadership Models in Business Presentation. This slide features a central vertical timeline with bold icons and text areas that highlight four key principles or stages of leadership. Ideal for strategy sessions, keynote addresses, or leadership training programs. Fully compatible with PowerPoint, Keynote, and Google Slides.


4 diapositivas
Resource Mapping in African Regions Presentation
Visualize regional distribution clearly with the Resource Mapping in African Regions Presentation. This engaging slide highlights key areas using color-coded map segments, helping you present data like resource allocation, project focus, or regional analysis with clarity. Ideal for NGOs, researchers, or government briefings. Compatible with PowerPoint, Keynote, Canva, and Google Slides.


4 diapositivas
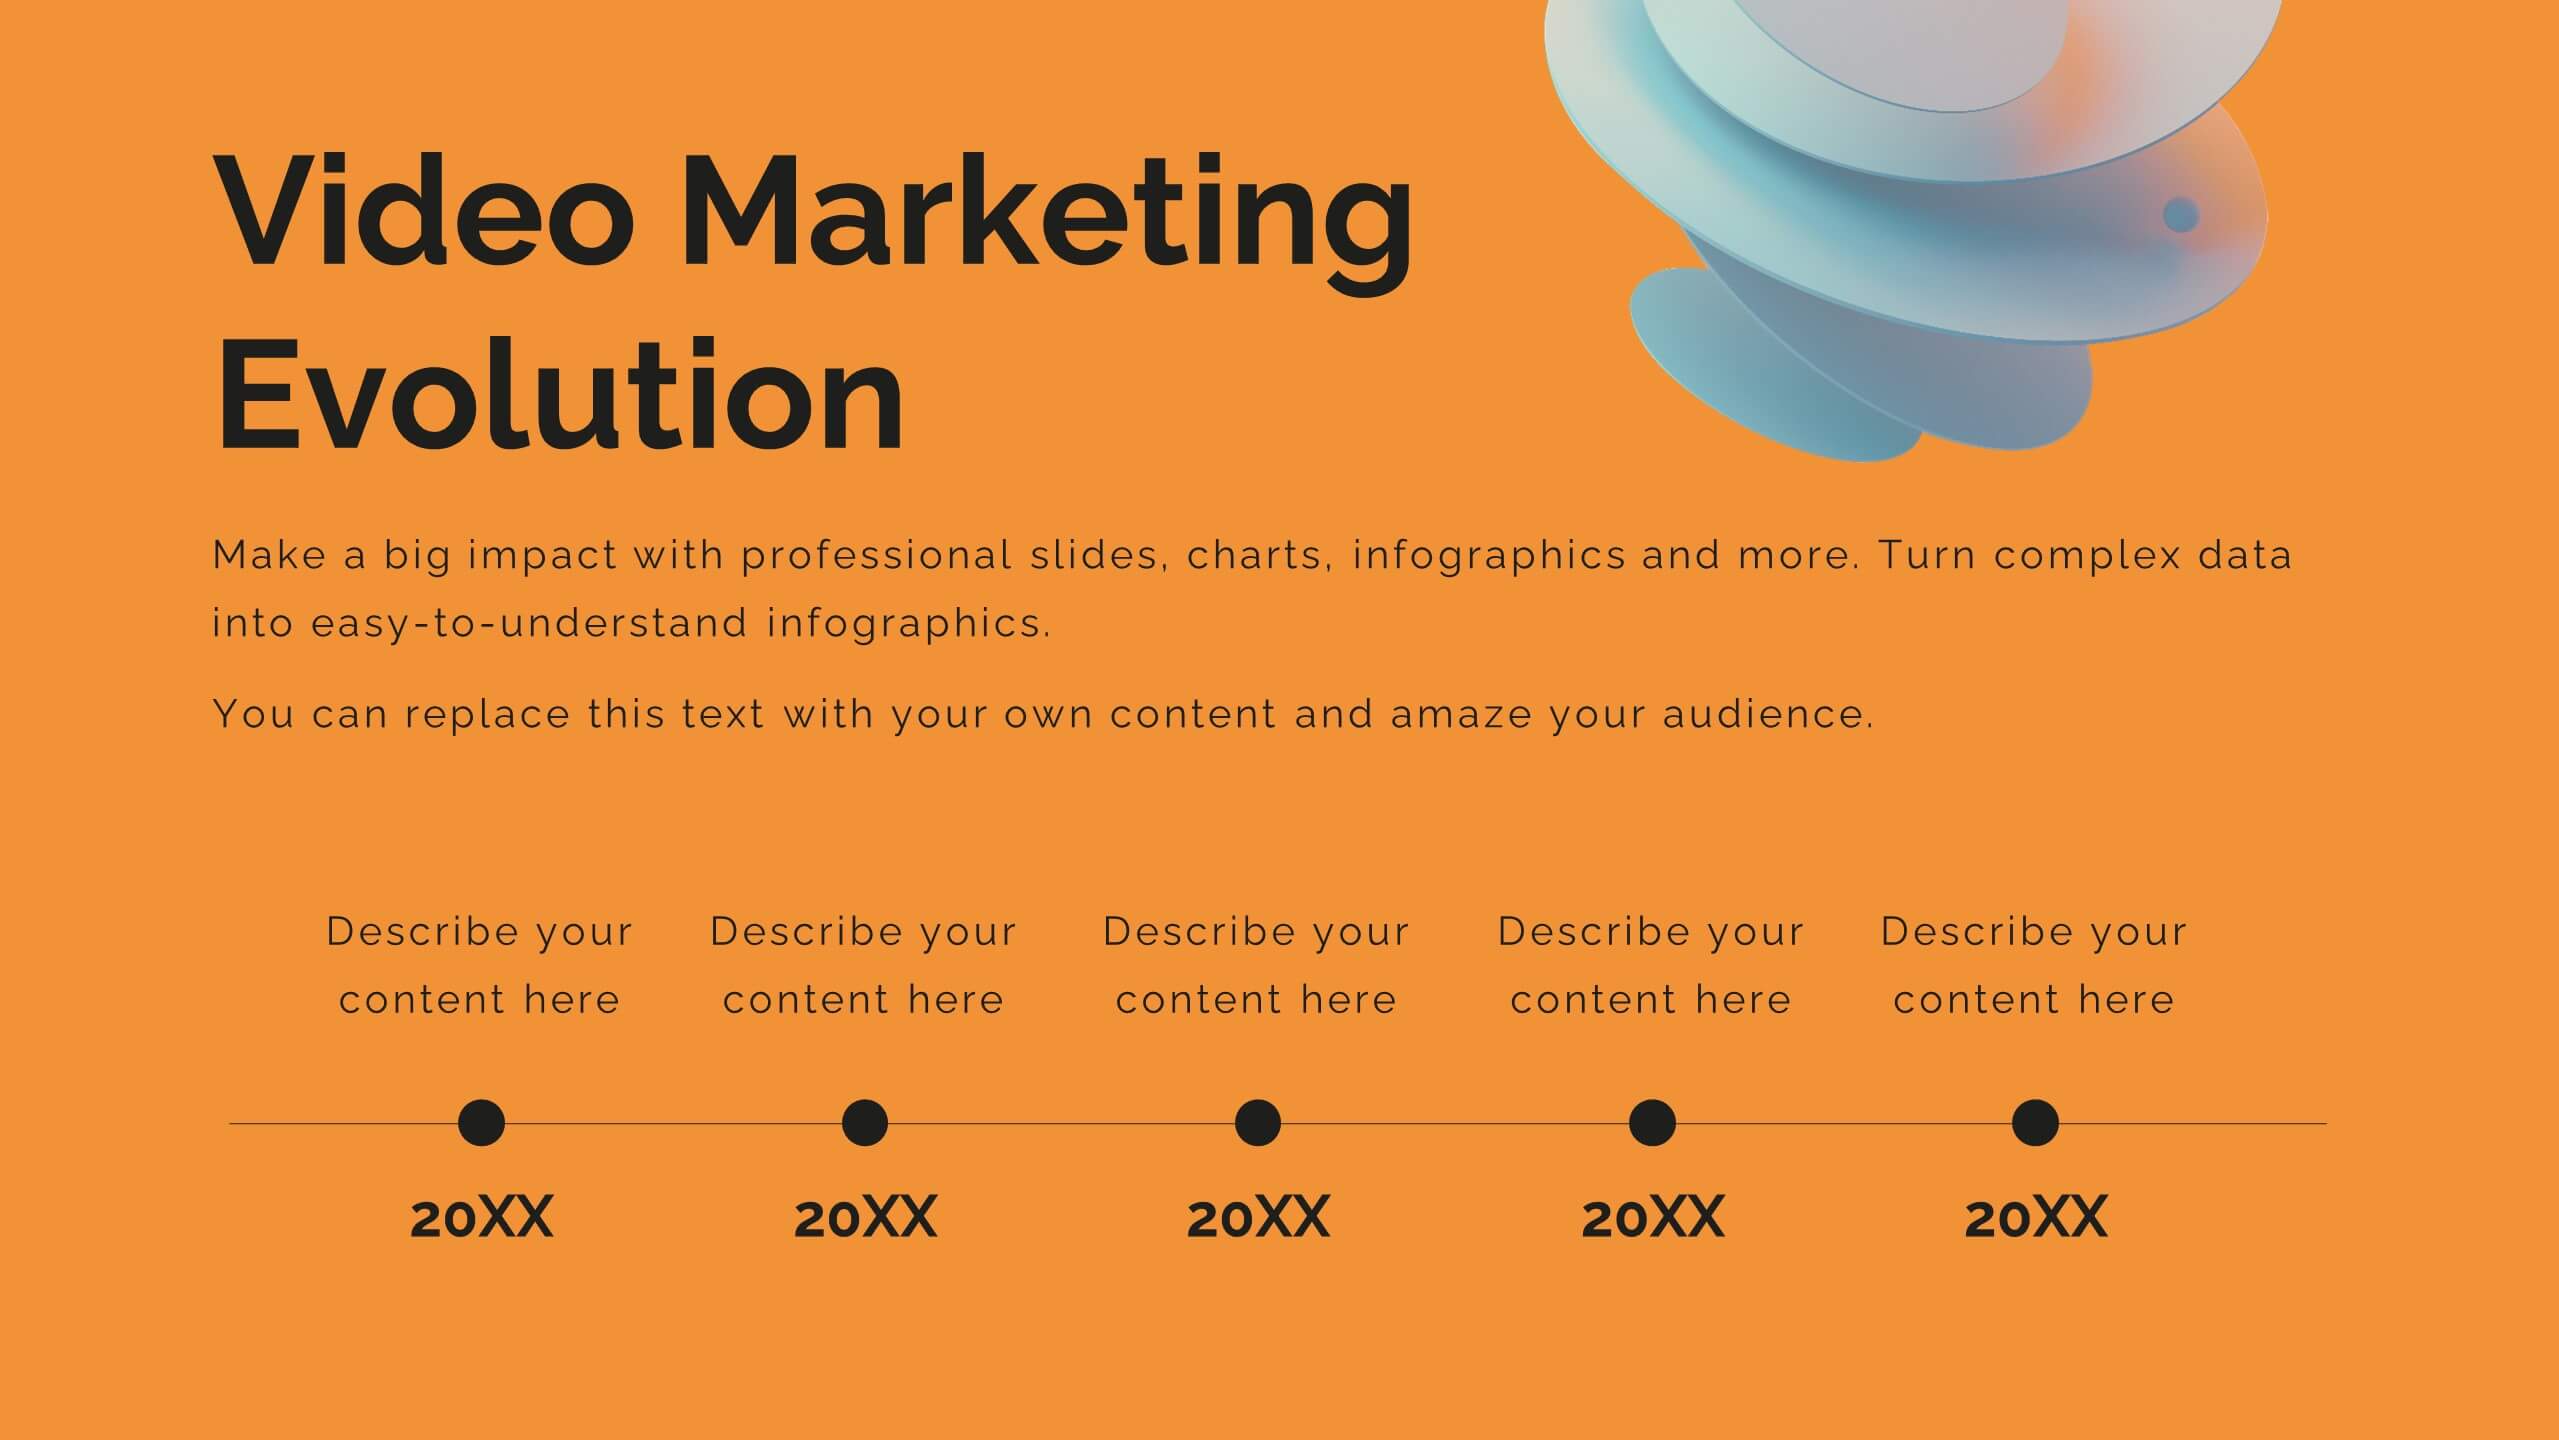
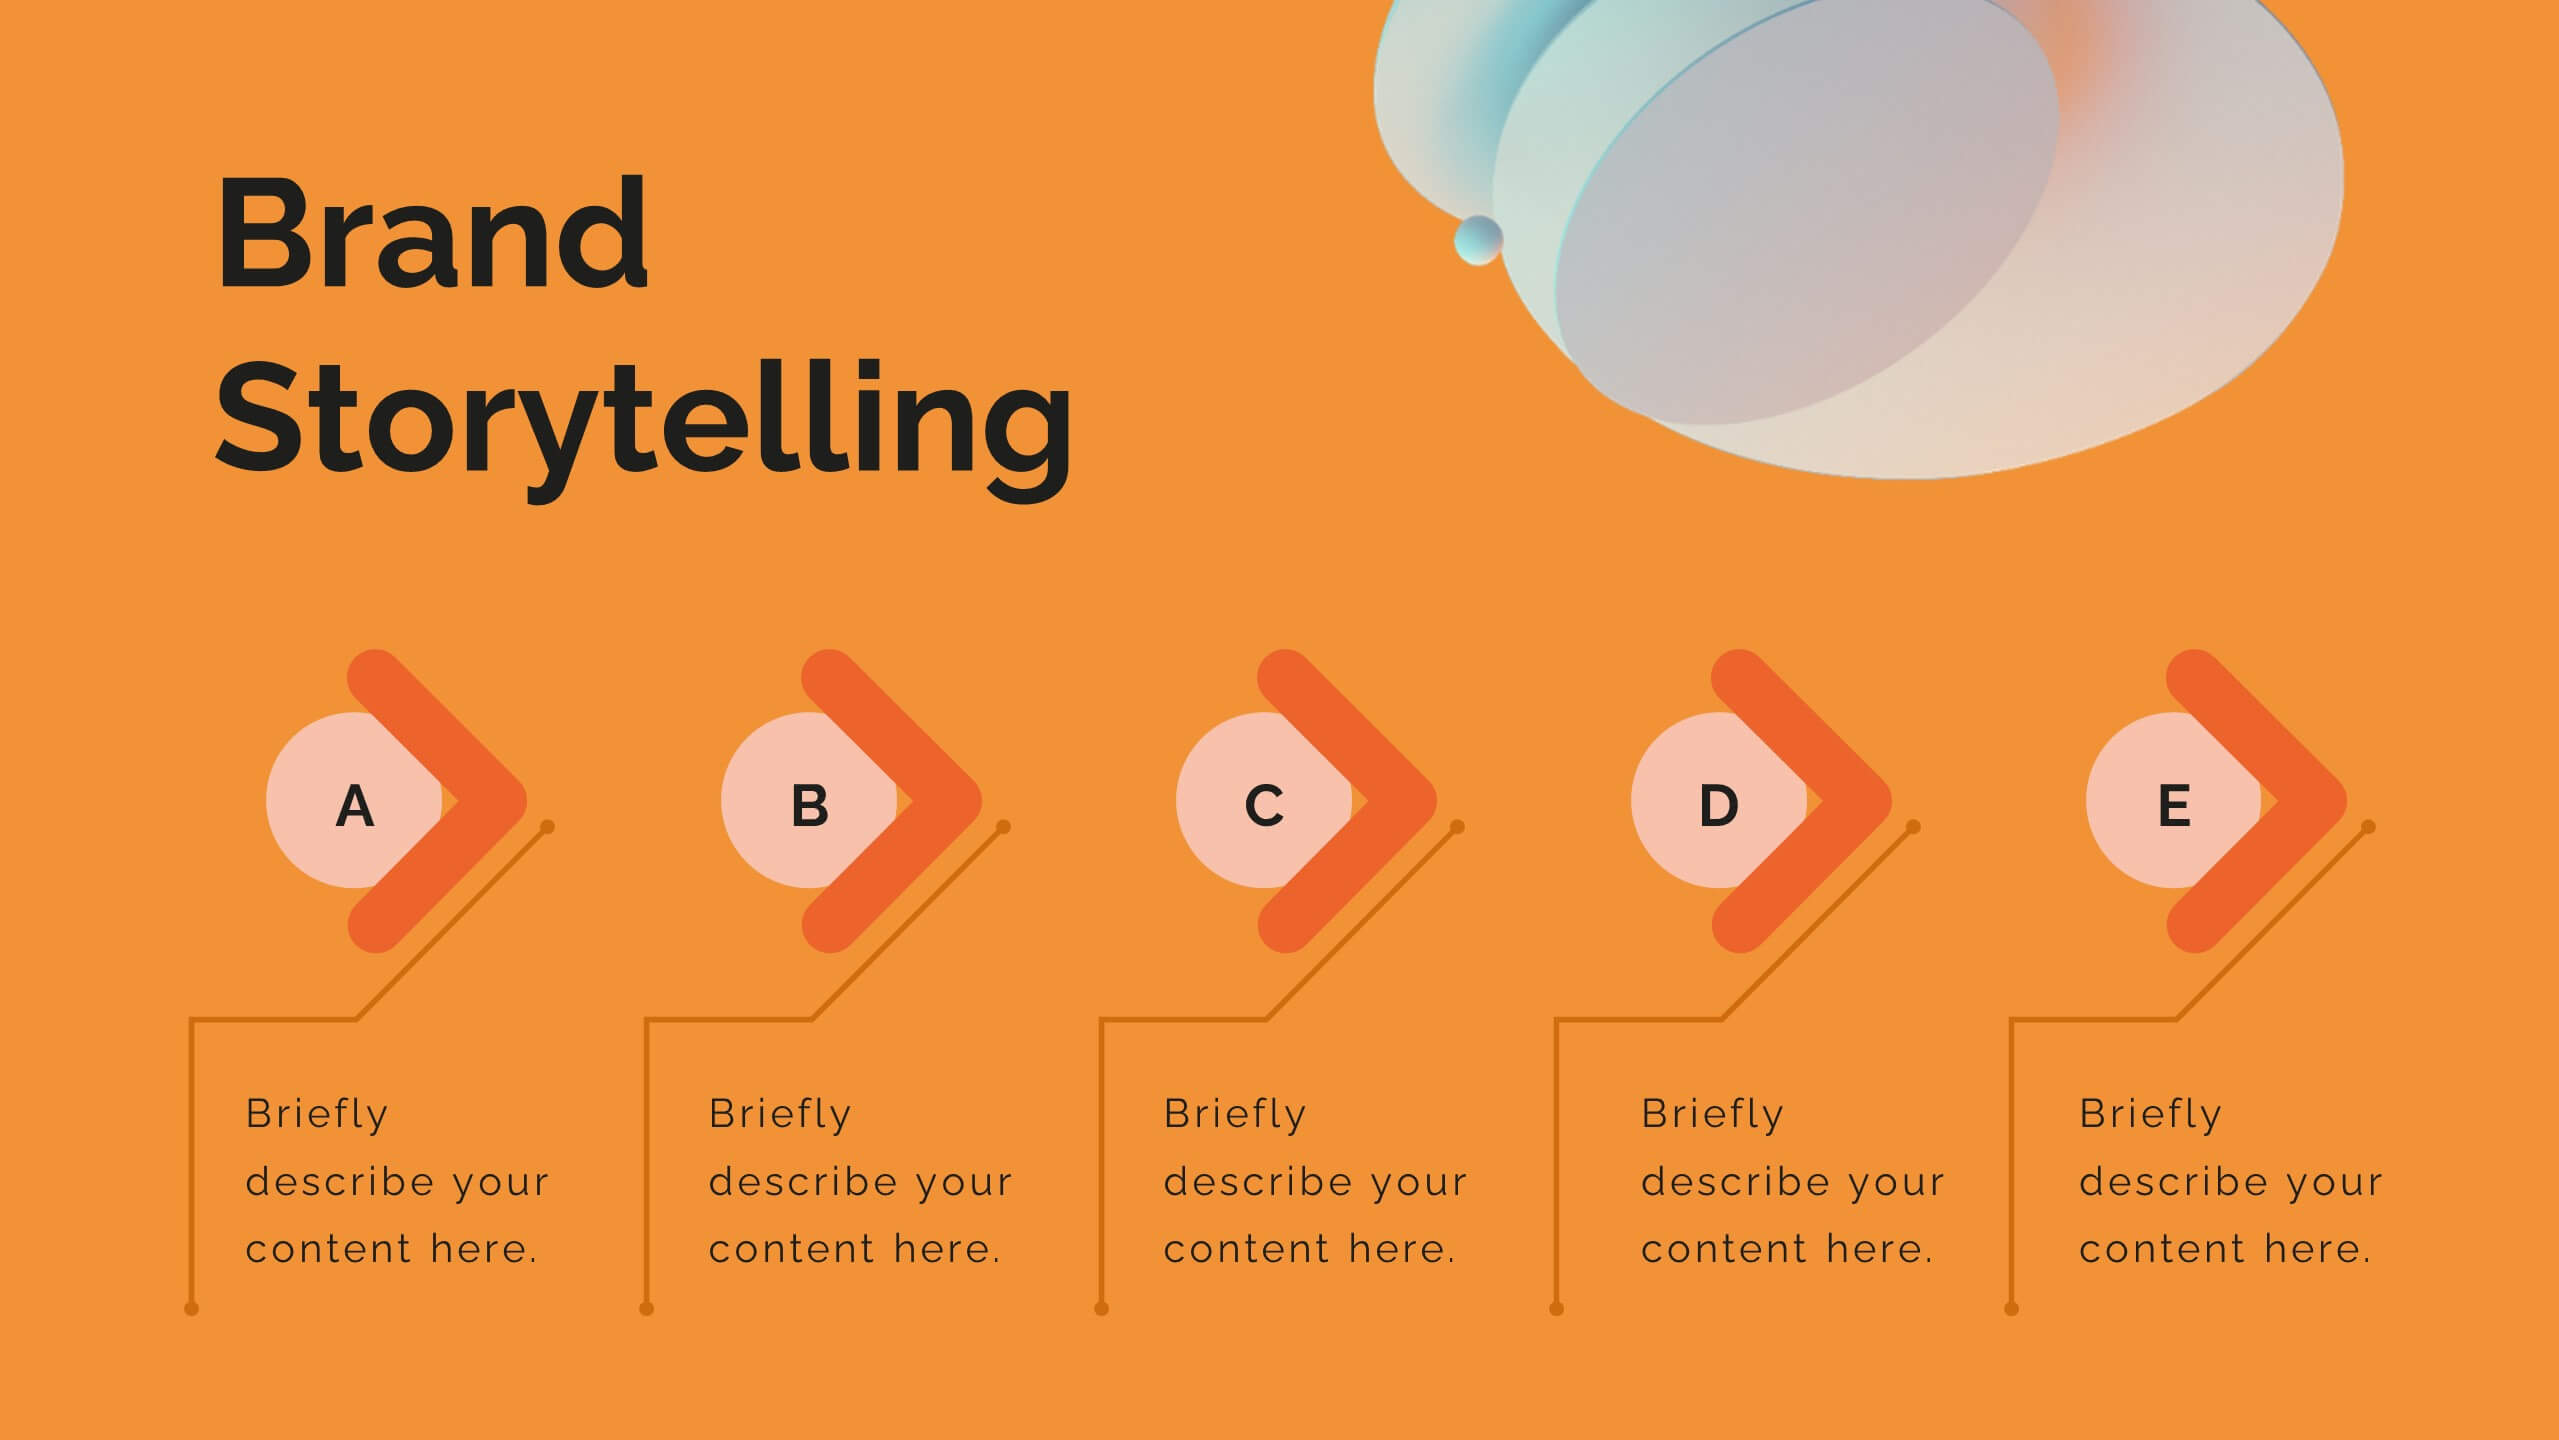
Sequential Roadmap Planning Timeline Presentation
Guide your audience through each milestone with the Sequential Roadmap Planning Timeline Presentation. This sleek layout is perfect for showing linear progress over time—ideal for strategic plans, product rollouts, or project phases. Each step is clearly marked with editable years and titles, ensuring clarity and easy customization. Fully compatible with PowerPoint, Google Slides, and Canva.


5 diapositivas
Rental Business Milestone Timeline Presentation
Showcase your company's growth journey with this clean Rental Business Milestone Timeline layout. Designed for tracking key achievements, it features a horizontal timeline with icons and customizable date markers. Perfect for business reviews or investor updates, it’s fully editable in PowerPoint, Keynote, and Google Slides for a professional presentation


20 diapositivas
Solar Beam Sales Proposal Presentation
Supercharge your sales presentation with the Solar Beam Sales Proposal template! This vibrant and dynamic template is designed to capture attention and drive home your key points with flair. Start with a bold introduction, then seamlessly guide your audience through your company overview, product/service details, and target market analysis. Highlight your sales objectives, showcase your team, and provide compelling customer testimonials. With dedicated slides for pricing strategies, sales collateral, and performance metrics, you’ll have all the tools you need to make a persuasive pitch. The template also includes sections for discussing future opportunities, action plans, and a Q&A session to address any final questions. Its modern, professional design ensures that your proposal stands out in any setting. Fully customizable and compatible with PowerPoint, Keynote, and Google Slides, this template is your go-to for creating impactful sales presentations that leave a lasting impression.


6 diapositivas
Effective Team Structure Guide Presentation
Visualize your team's structure with clarity using this team guide presentation. Designed for highlighting roles, connections, and reporting lines, each slide helps communicate responsibilities and hierarchy efficiently. Ideal for HR, managers, and team leads. Fully editable in PowerPoint, Keynote, and Google Slides—customize colors, names, and positions with ease.


5 diapositivas
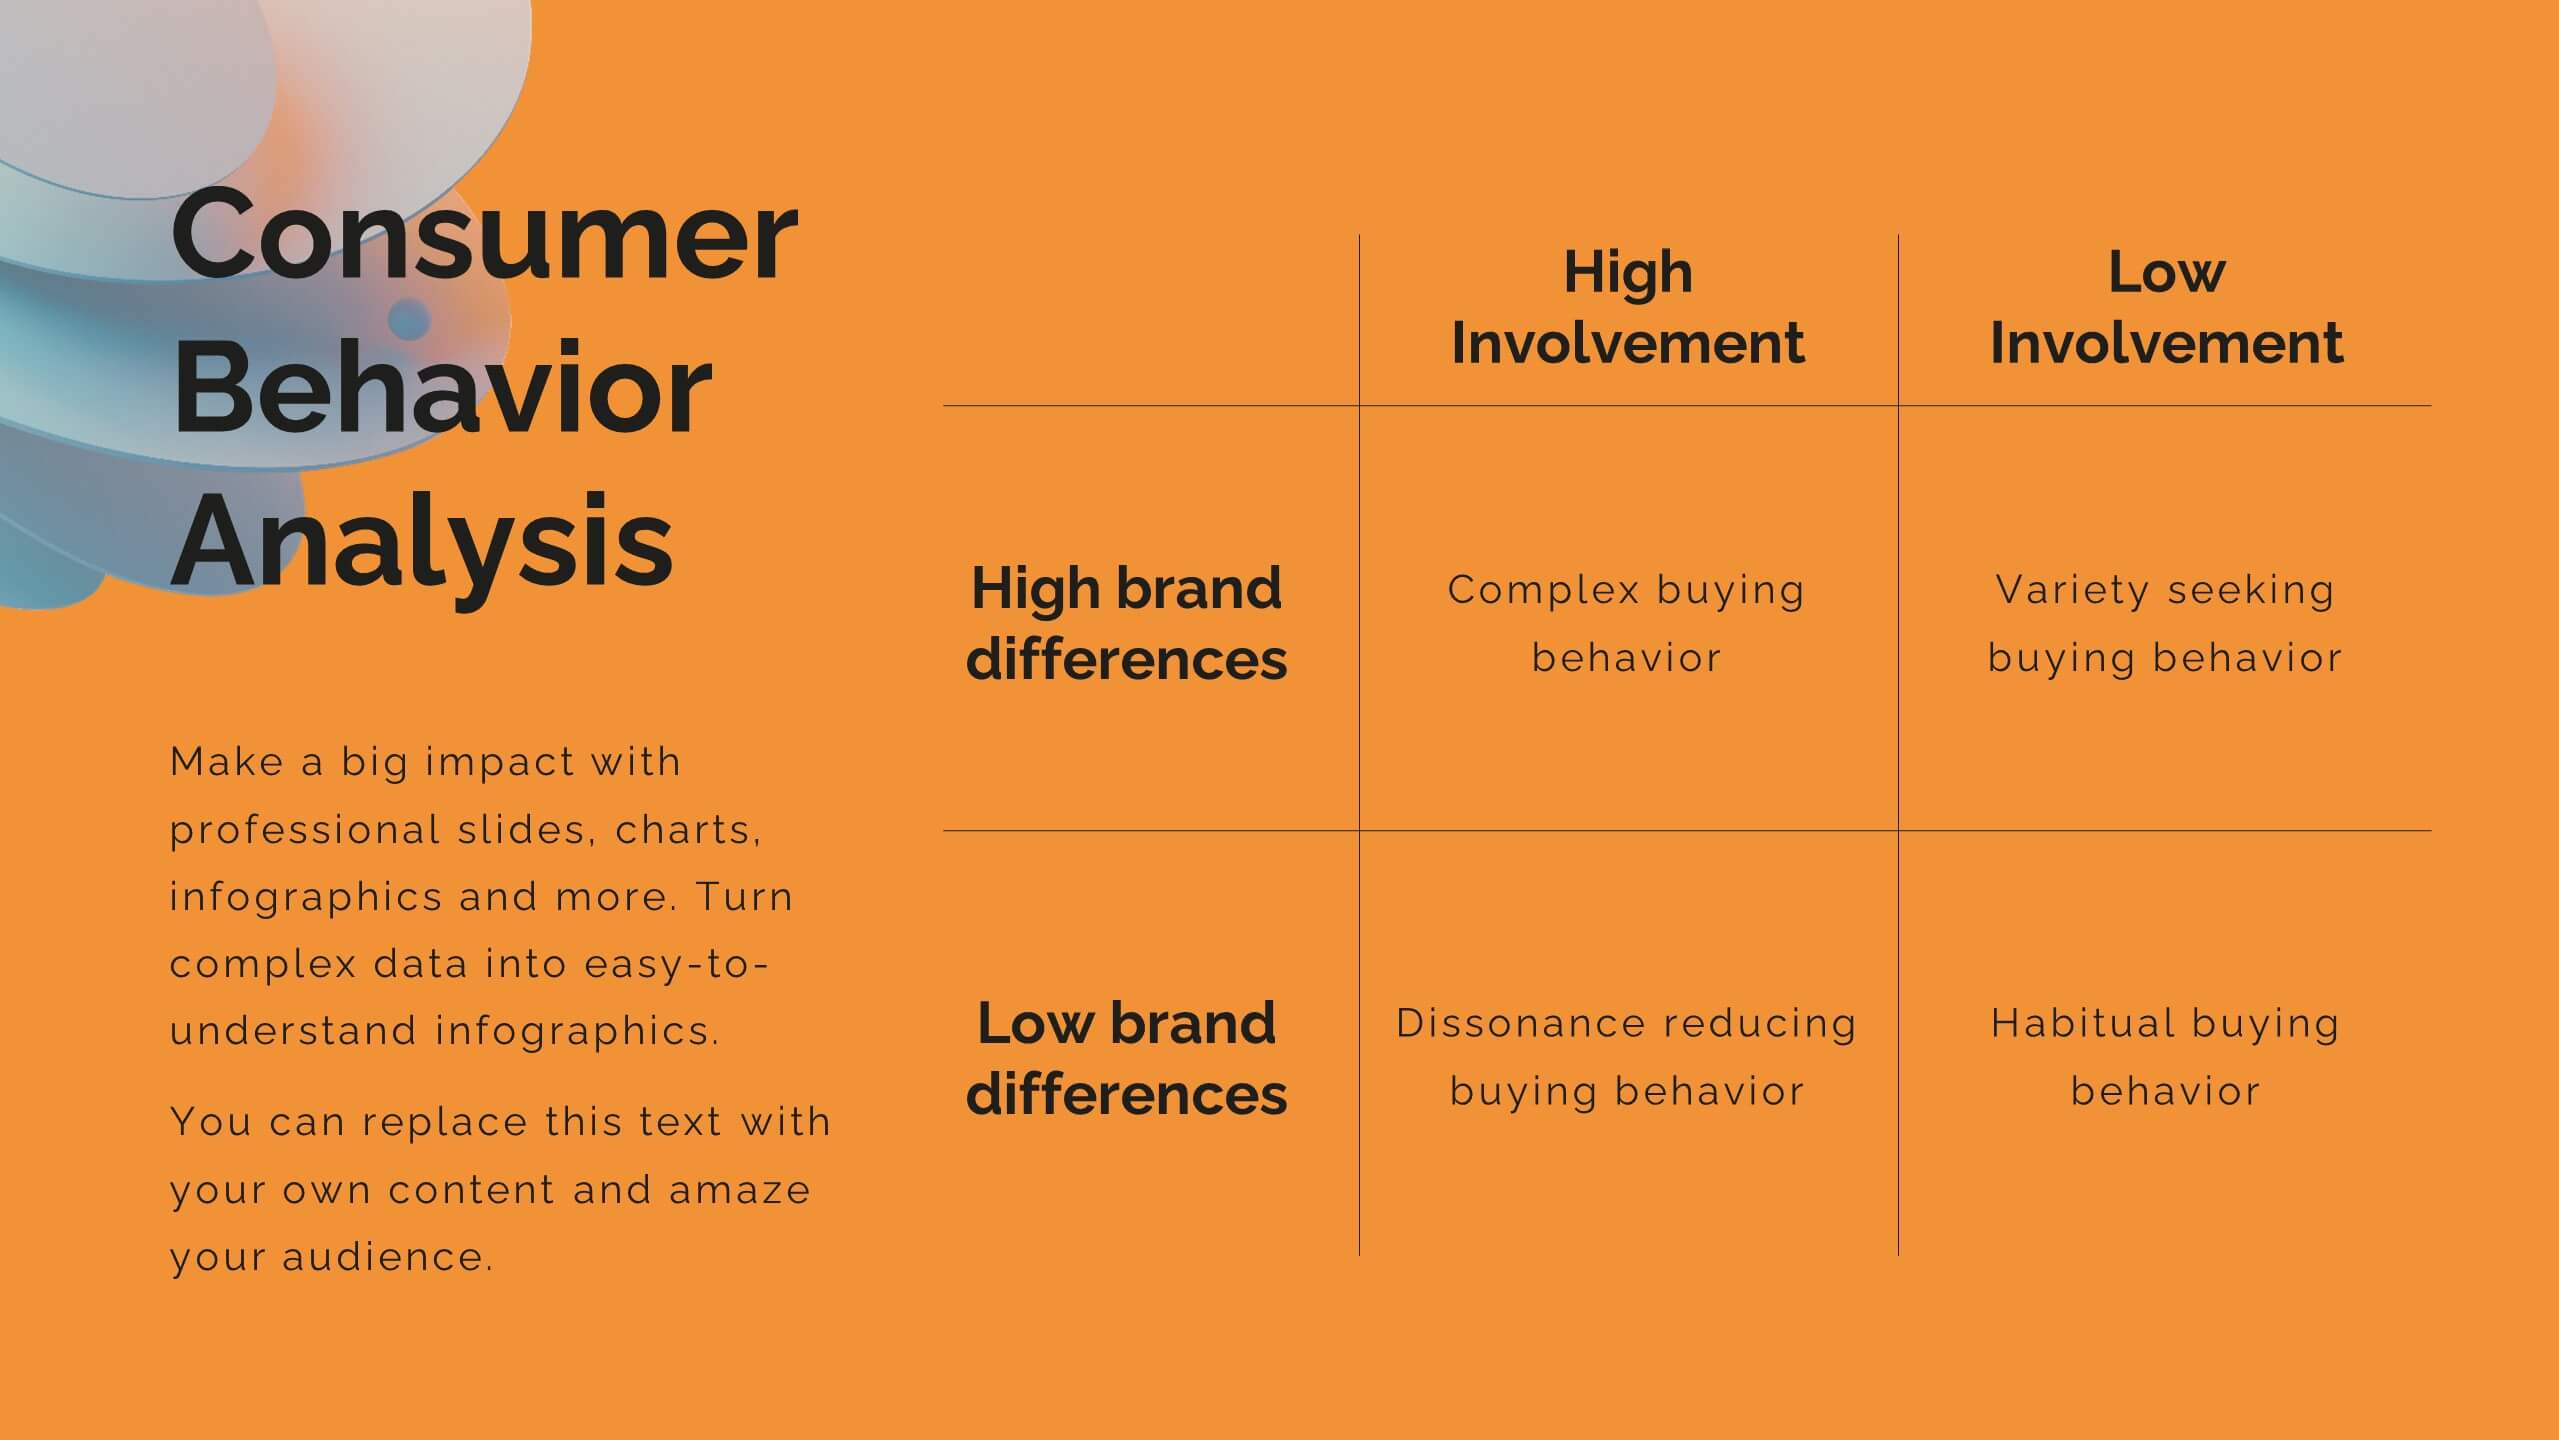
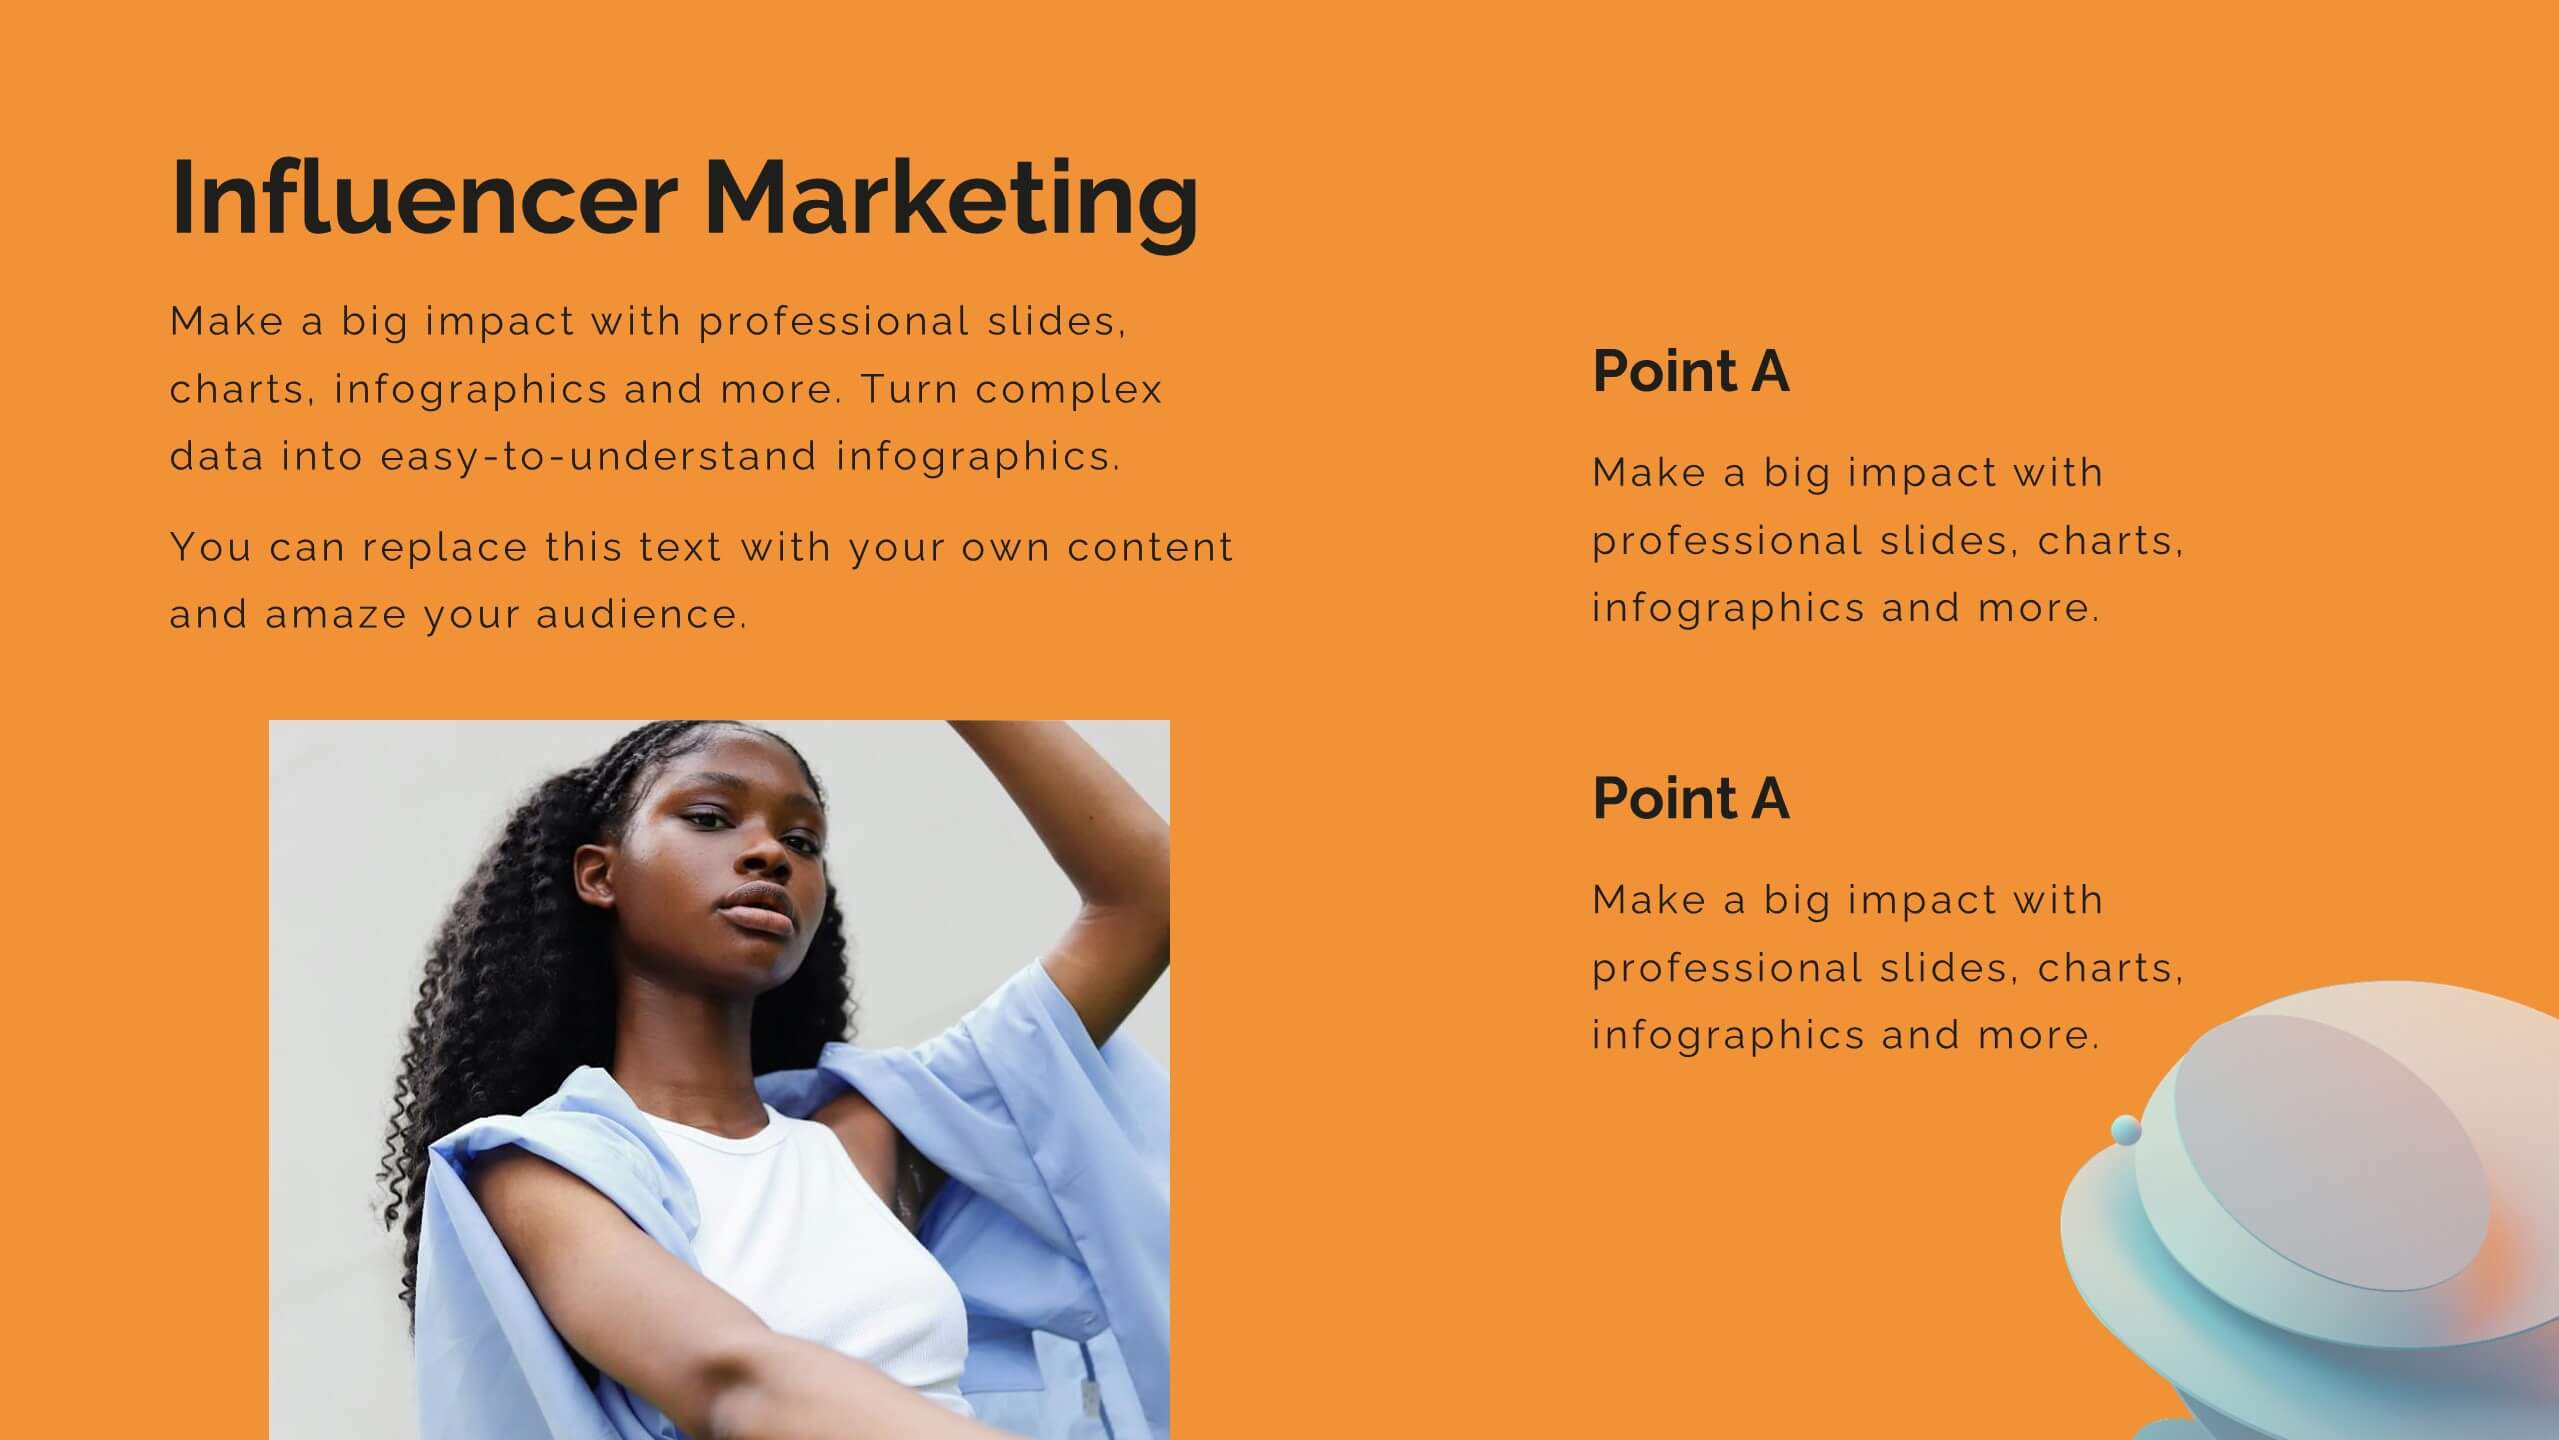
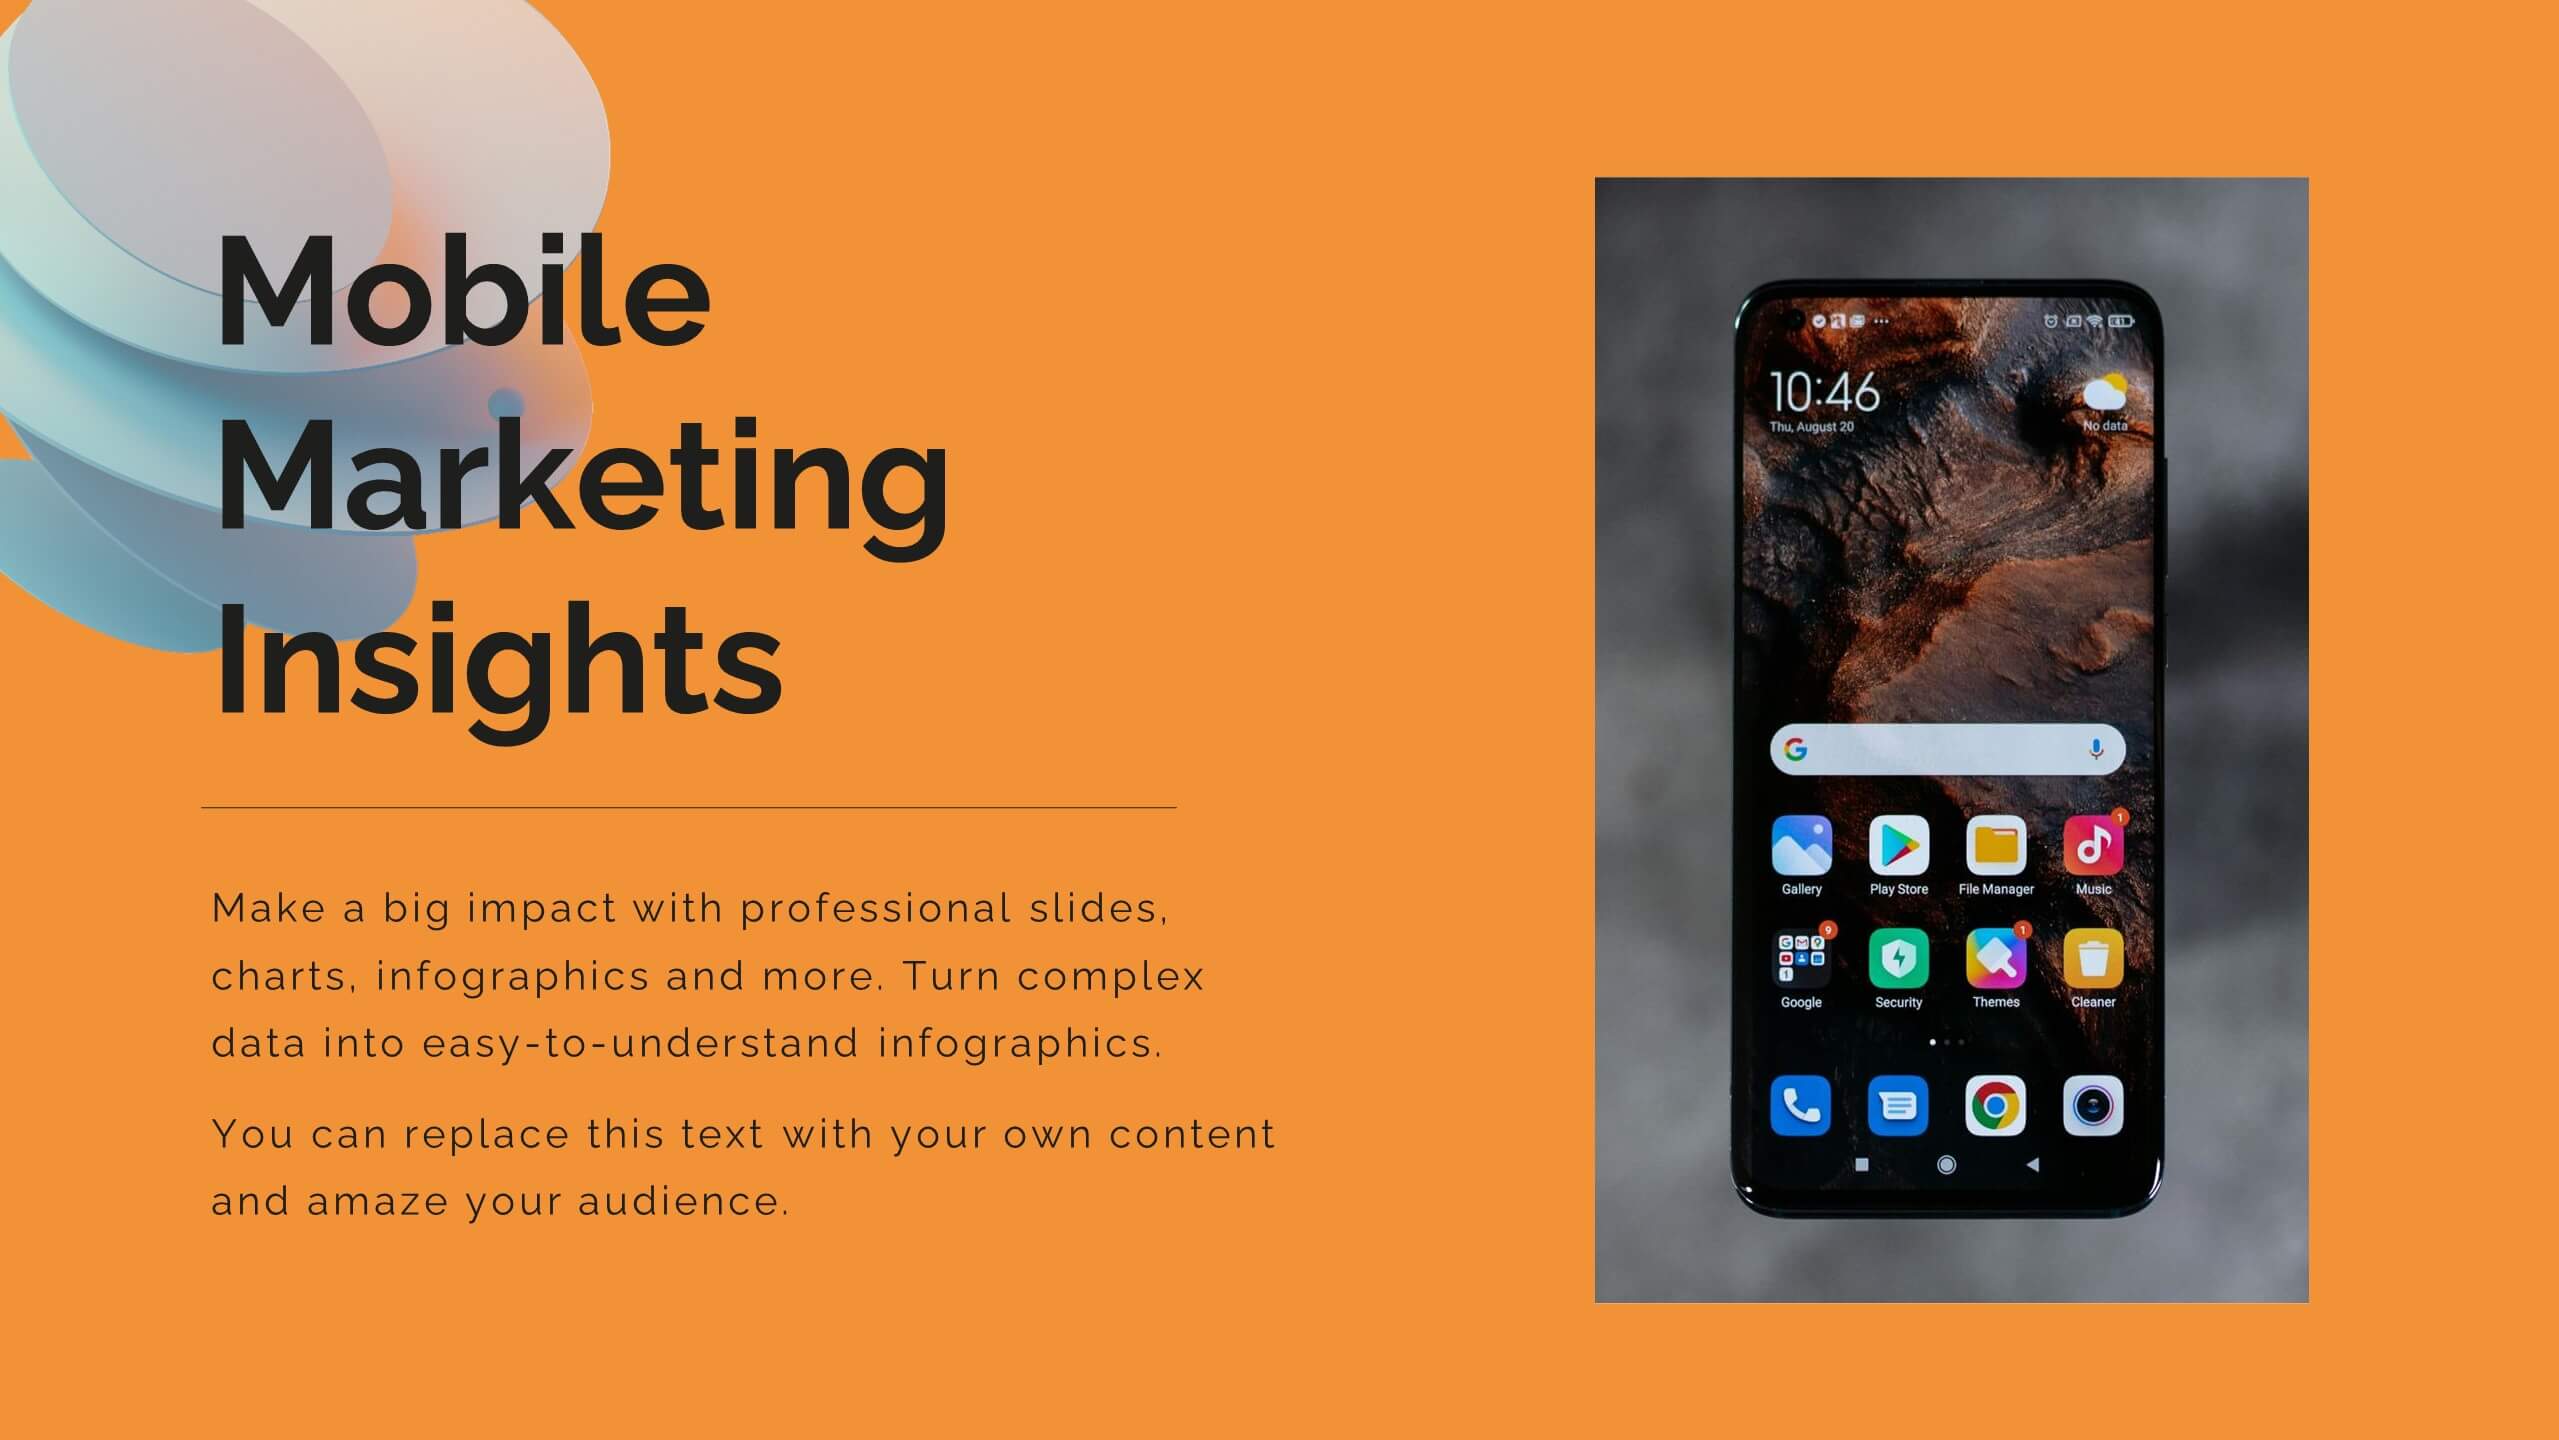
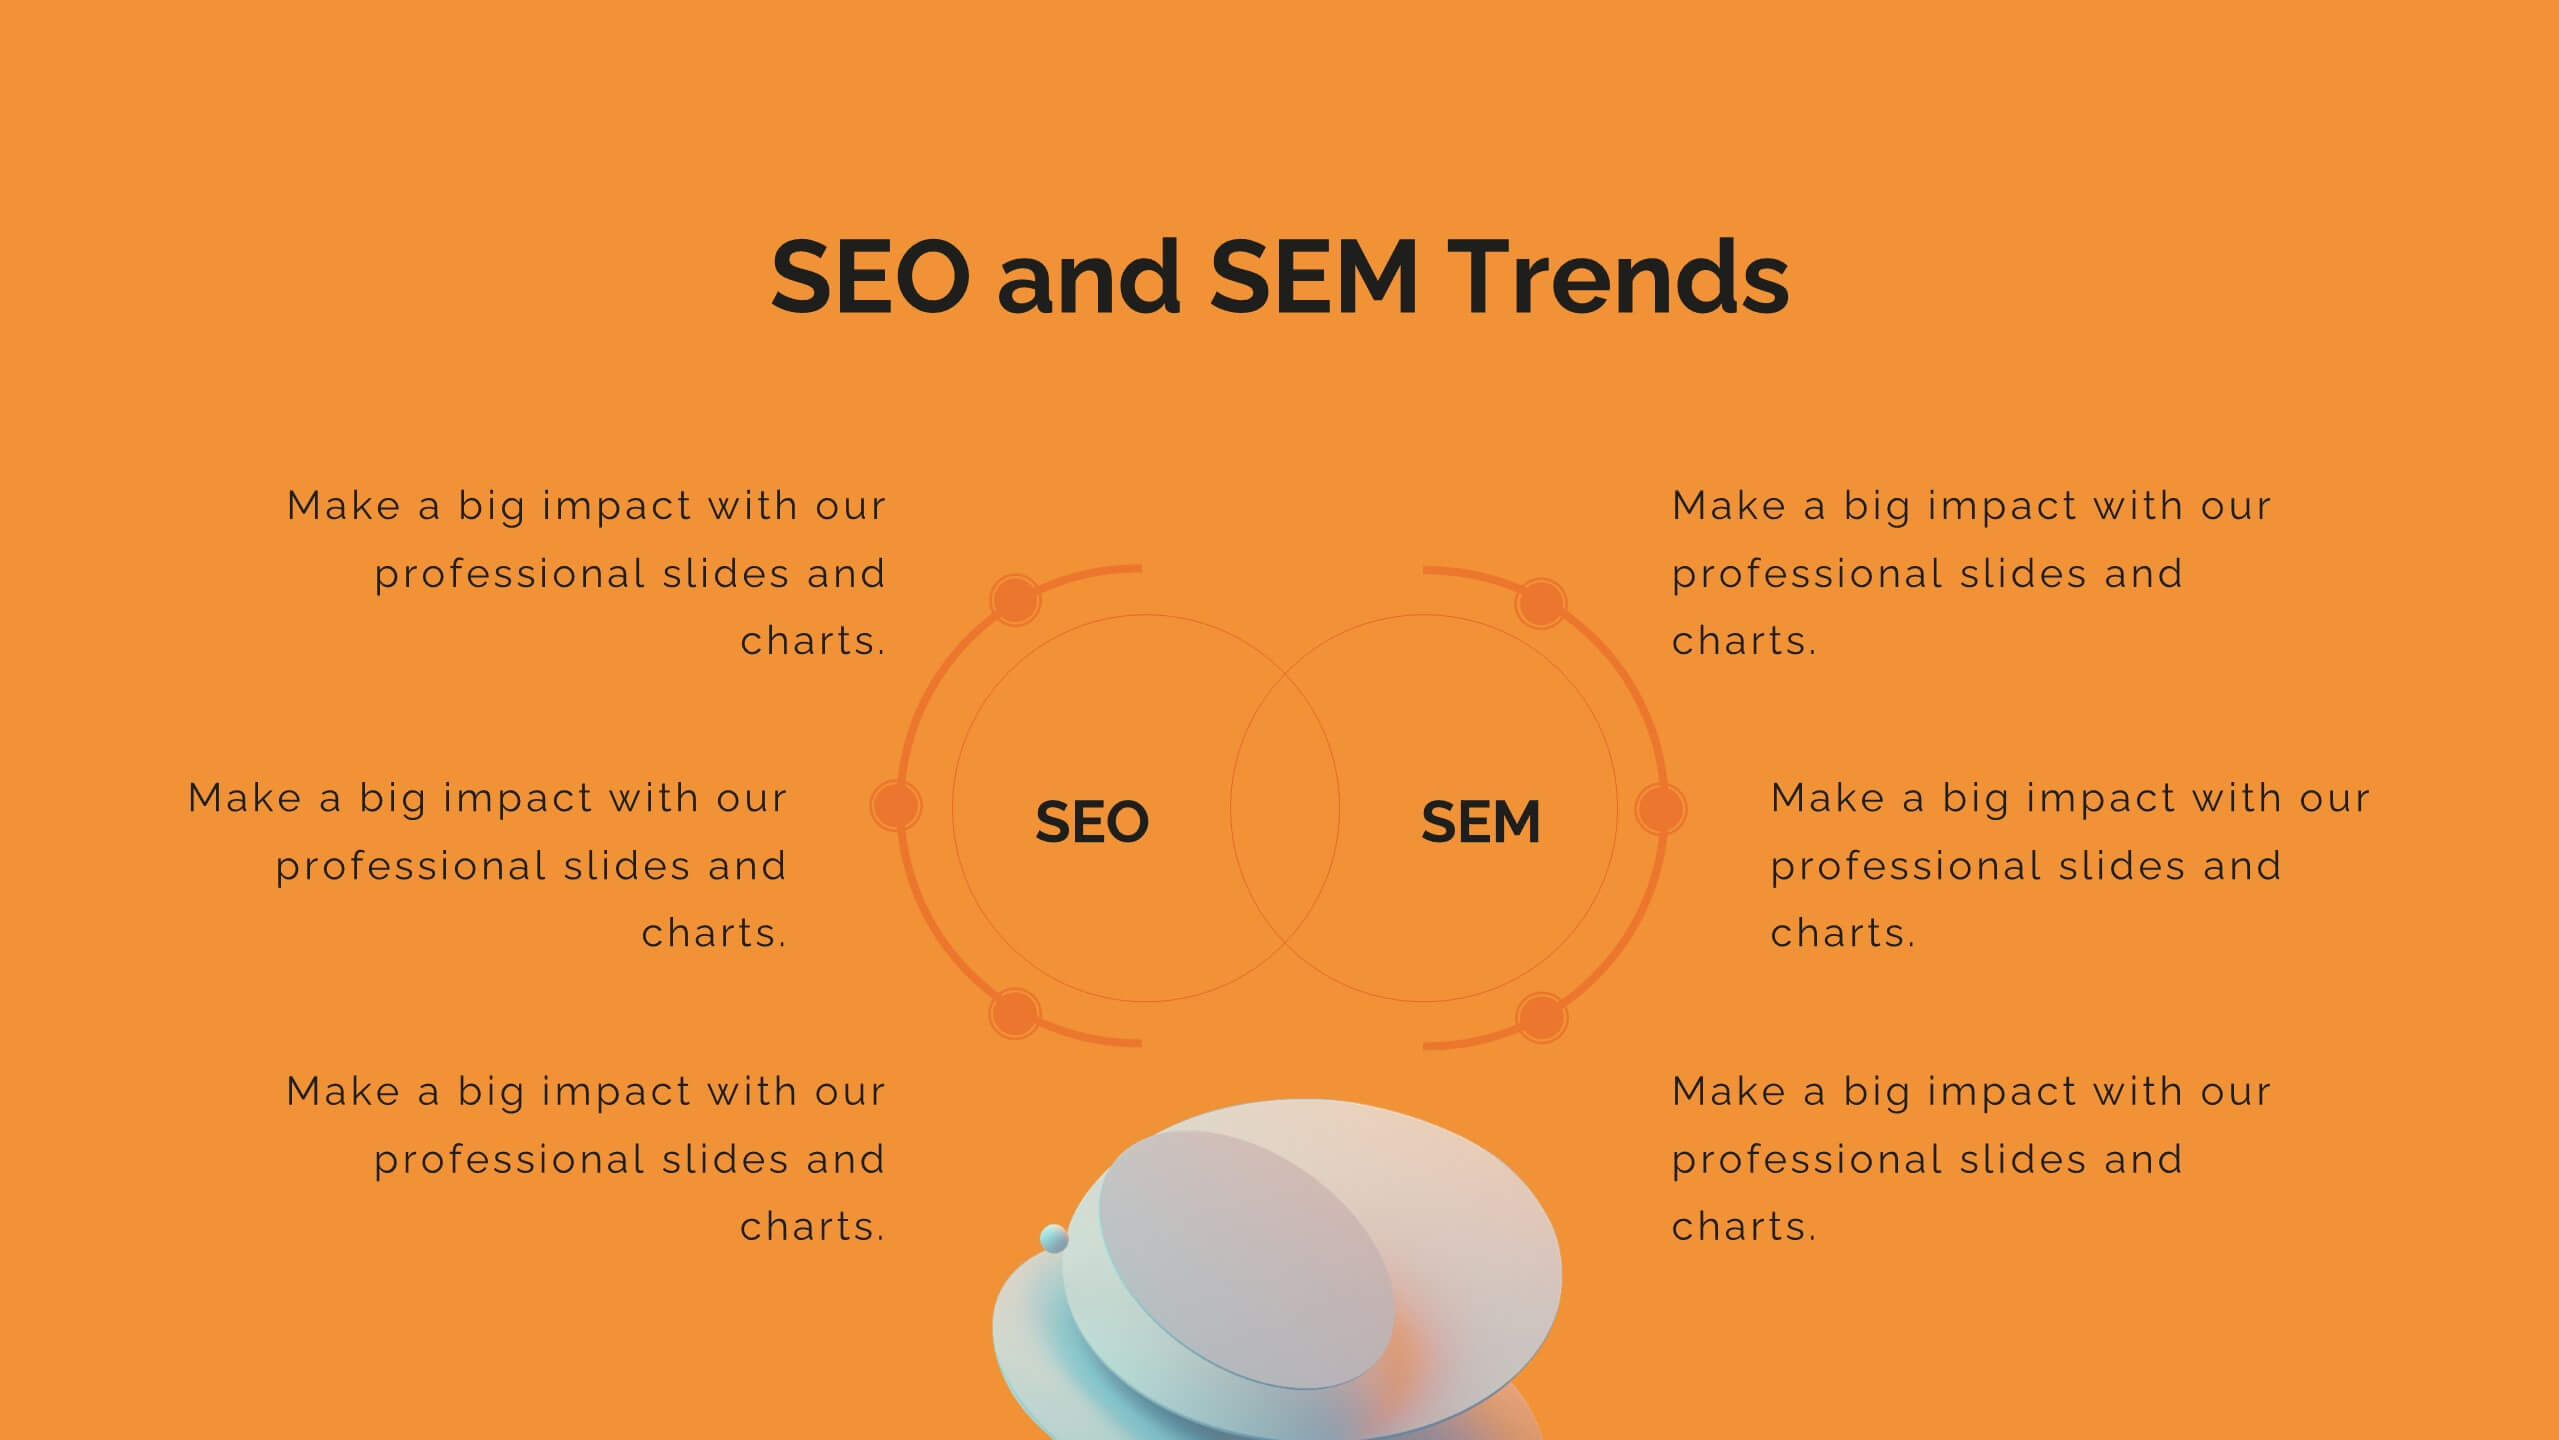
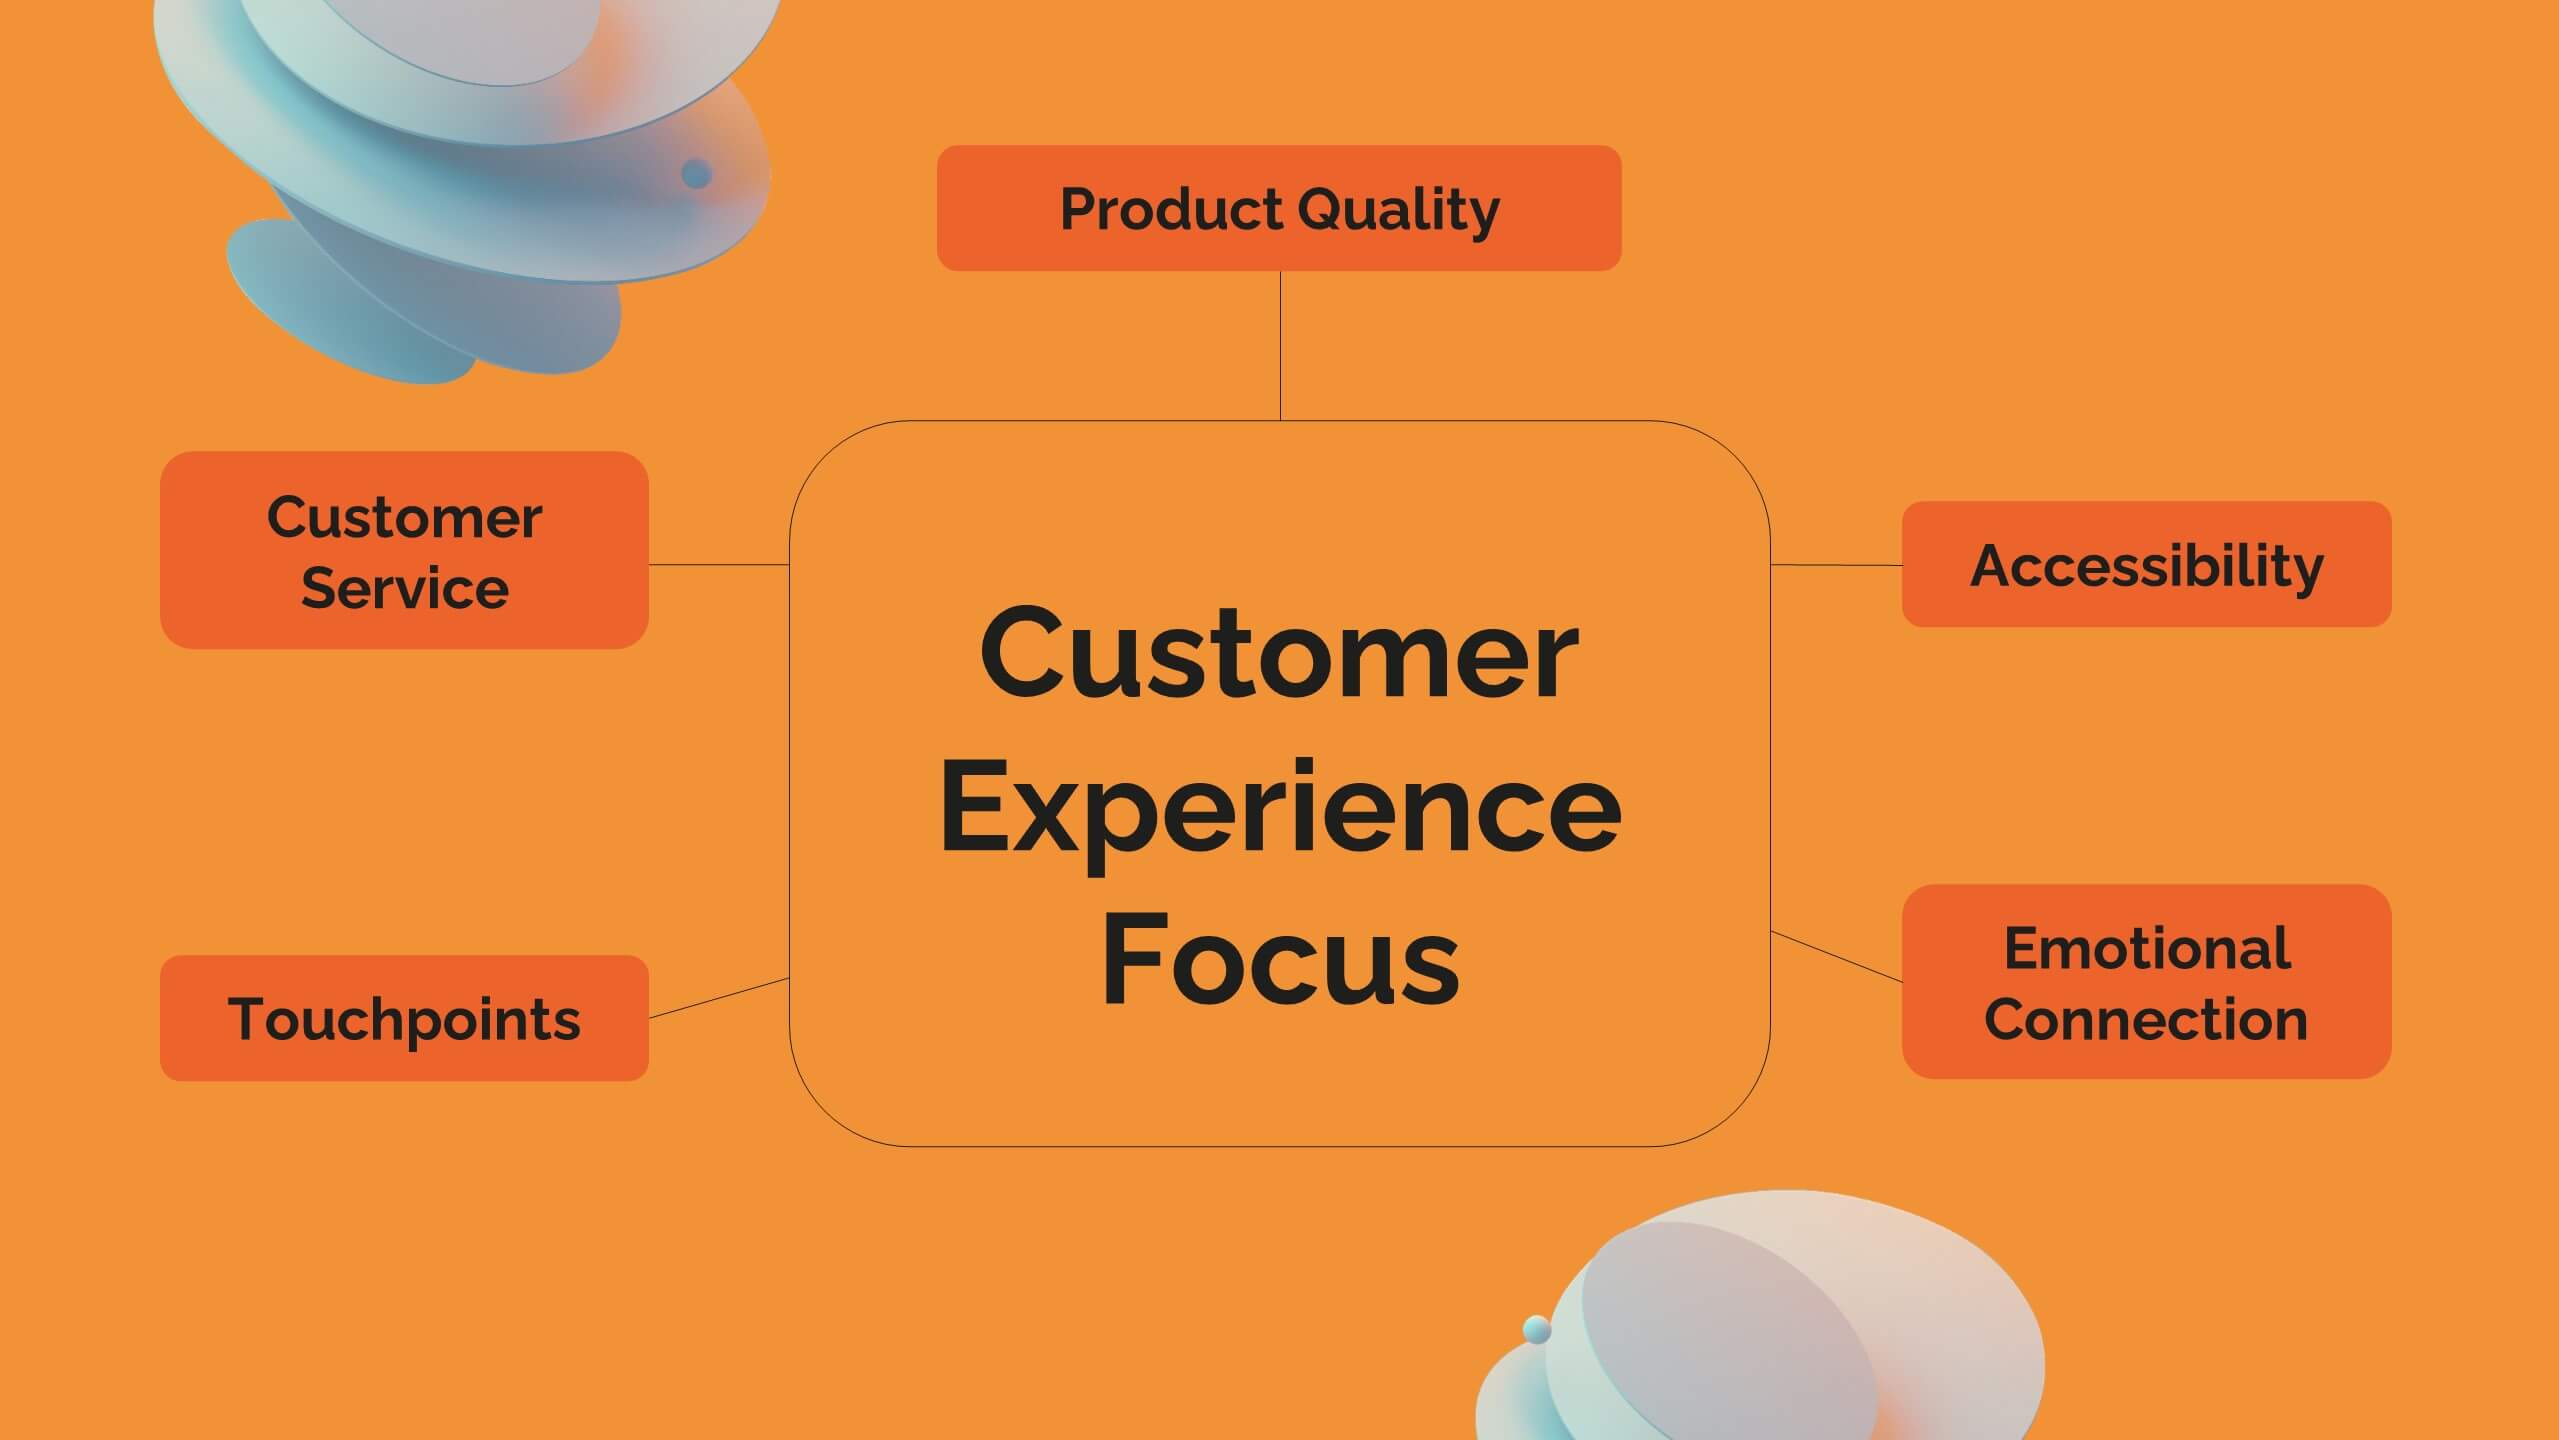
Customer Behavior Pathway Visualization Presentation
Illustrate each step in the decision-making journey with this Customer Behavior Pathway Visualization presentation. Designed with directional arrows and dotted flow markers, this slide helps you map behavioral patterns across key stages—from awareness to loyalty. Ideal for sales, marketing, or UX teams. Fully editable in PowerPoint, Canva, and Google Slides.


5 diapositivas
Supply Chain Management Plan Presentation
Streamline your presentation with a sleek and organized design built to illustrate process flow and logistics. Perfect for explaining production stages, delivery systems, or business operations, this visual layout brings clarity and structure to your message. Compatible with PowerPoint, Keynote, and Google Slides for effortless customization and use.