


Características


¿Tienes alguna pregunta?
Recomendar


20 diapositivas
Milky Way Design Portfolio Presentation
The Milky Way Design Portfolio template is your ultimate tool for showcasing your creative work with elegance and professionalism. This template combines soft pastel colors with modern design elements, making your projects stand out. Perfect for designers, artists, and creative professionals, it includes sections like portfolio overview, creative process, collaborations, client testimonials, and more. Each slide is carefully designed to highlight your work, achievements, and services in a visually appealing manner. The layout is clean and minimalistic, ensuring that the focus remains on your content. Whether you're presenting a single project or a diverse range of work, this template adapts effortlessly to your needs. It's fully compatible with PowerPoint, Keynote, and Google Slides, offering flexibility and ease of use across platforms. Impress your audience and potential clients with a portfolio presentation that's as polished and creative as your work itself.


8 diapositivas
Health Metrics and Wellbeing Dashboard Presentation
Visualize patient insights with this dashboard-style layout combining human figures, progress bars, and anatomical icons. Ideal for healthcare data, wellness reporting, or gender-based analysis, it balances stats and storytelling effectively. Customize it easily in PowerPoint, Keynote, or Google Slides for your next health-focused presentation.


8 diapositivas
Insurance Market Trends Presentation
Stay Ahead in the Insurance Industry with this Insurance Market Trends Presentation template. Designed with a modern roadmap layout, this slide helps illustrate key trends, policy changes, and industry insights in an engaging and structured way. Ideal for insurance professionals, financial analysts, and business strategists, this fully customizable template is compatible with PowerPoint, Keynote, and Google Slides, making it easy to adapt to your specific needs.


5 diapositivas
Creative Alphabet Display Template
Make your message memorable with the Creative Alphabet Display Template Presentation. This slide uses bold, interlocking letter shapes to showcase four key ideas in a linear, eye-catching format—perfect for step-by-step processes, value breakdowns, or themed concepts. Fully editable in PowerPoint, Keynote, and Google Slides.


23 diapositivas
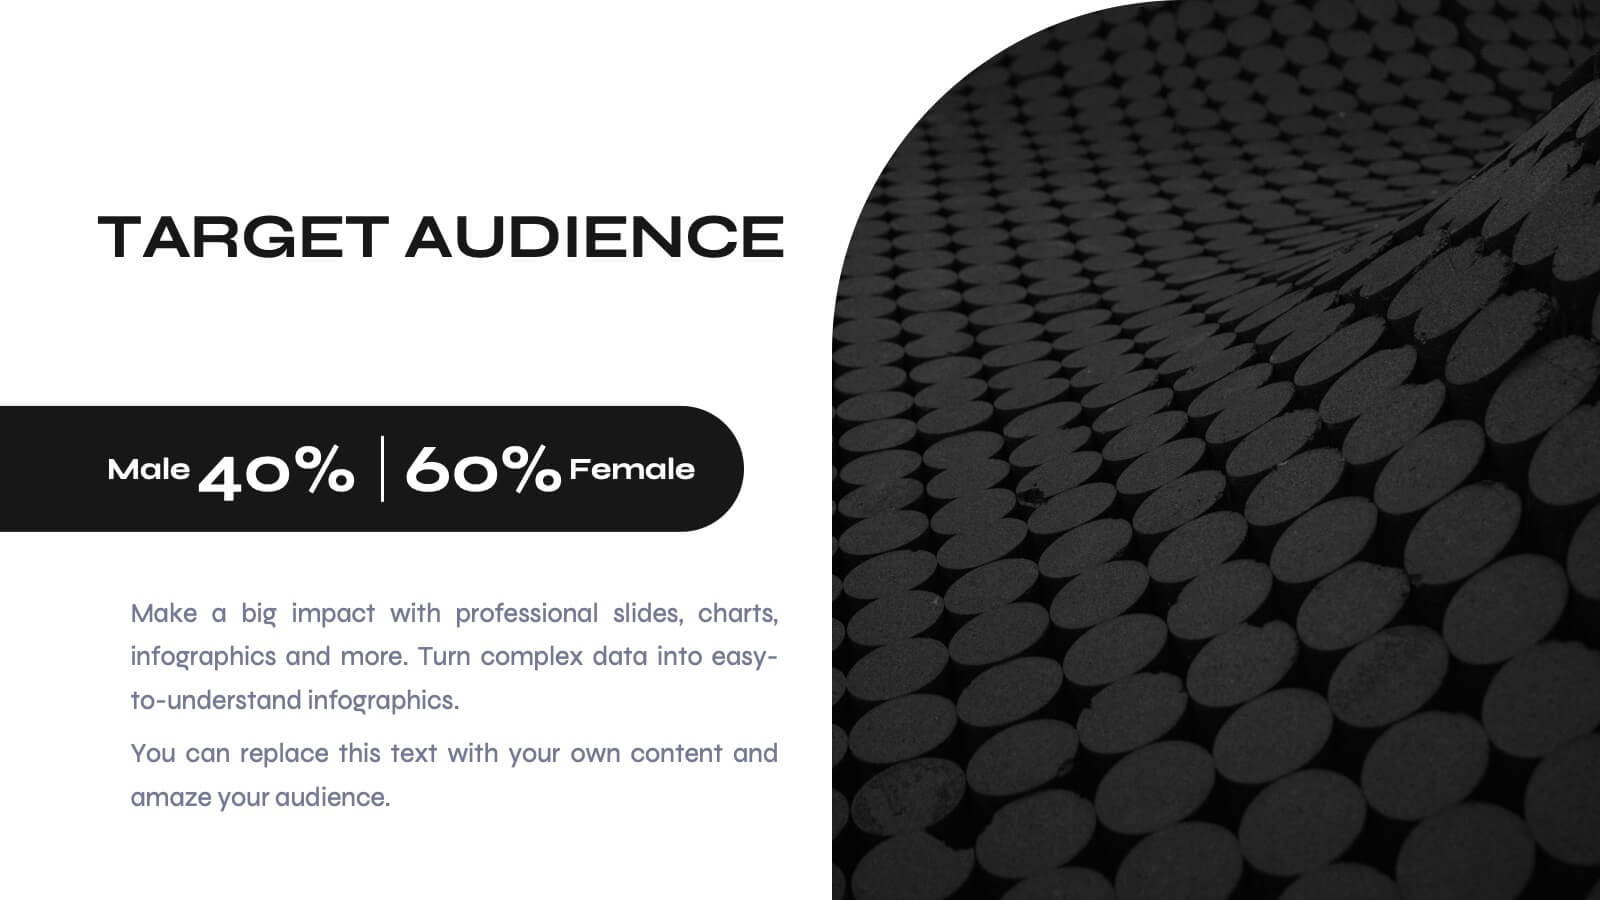
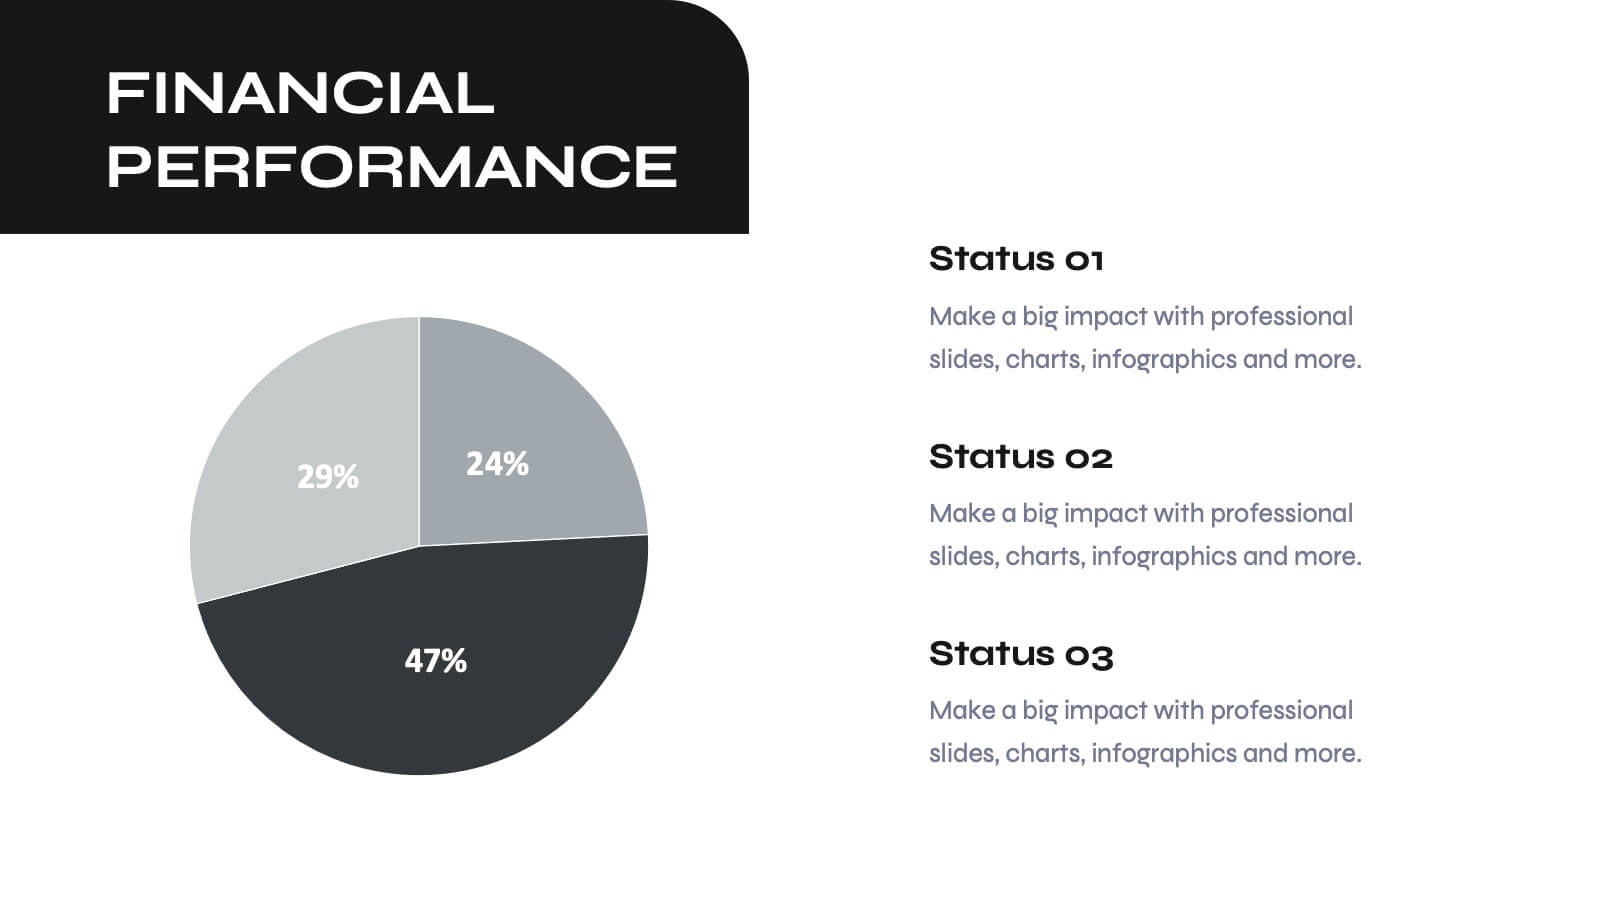
Odyssey Small Business Pitch Deck Presentation
Elevate your business pitch with this sleek, monochrome presentation template. Perfect for presenting company backgrounds, market opportunities, and financial performance, it features a minimalist design that enhances clarity and impact. Highlight your value proposition and strategic plans to captivate investors. Compatible with PowerPoint, Keynote, and Google Slides, it ensures seamless presentations on any platform.

21 diapositivas
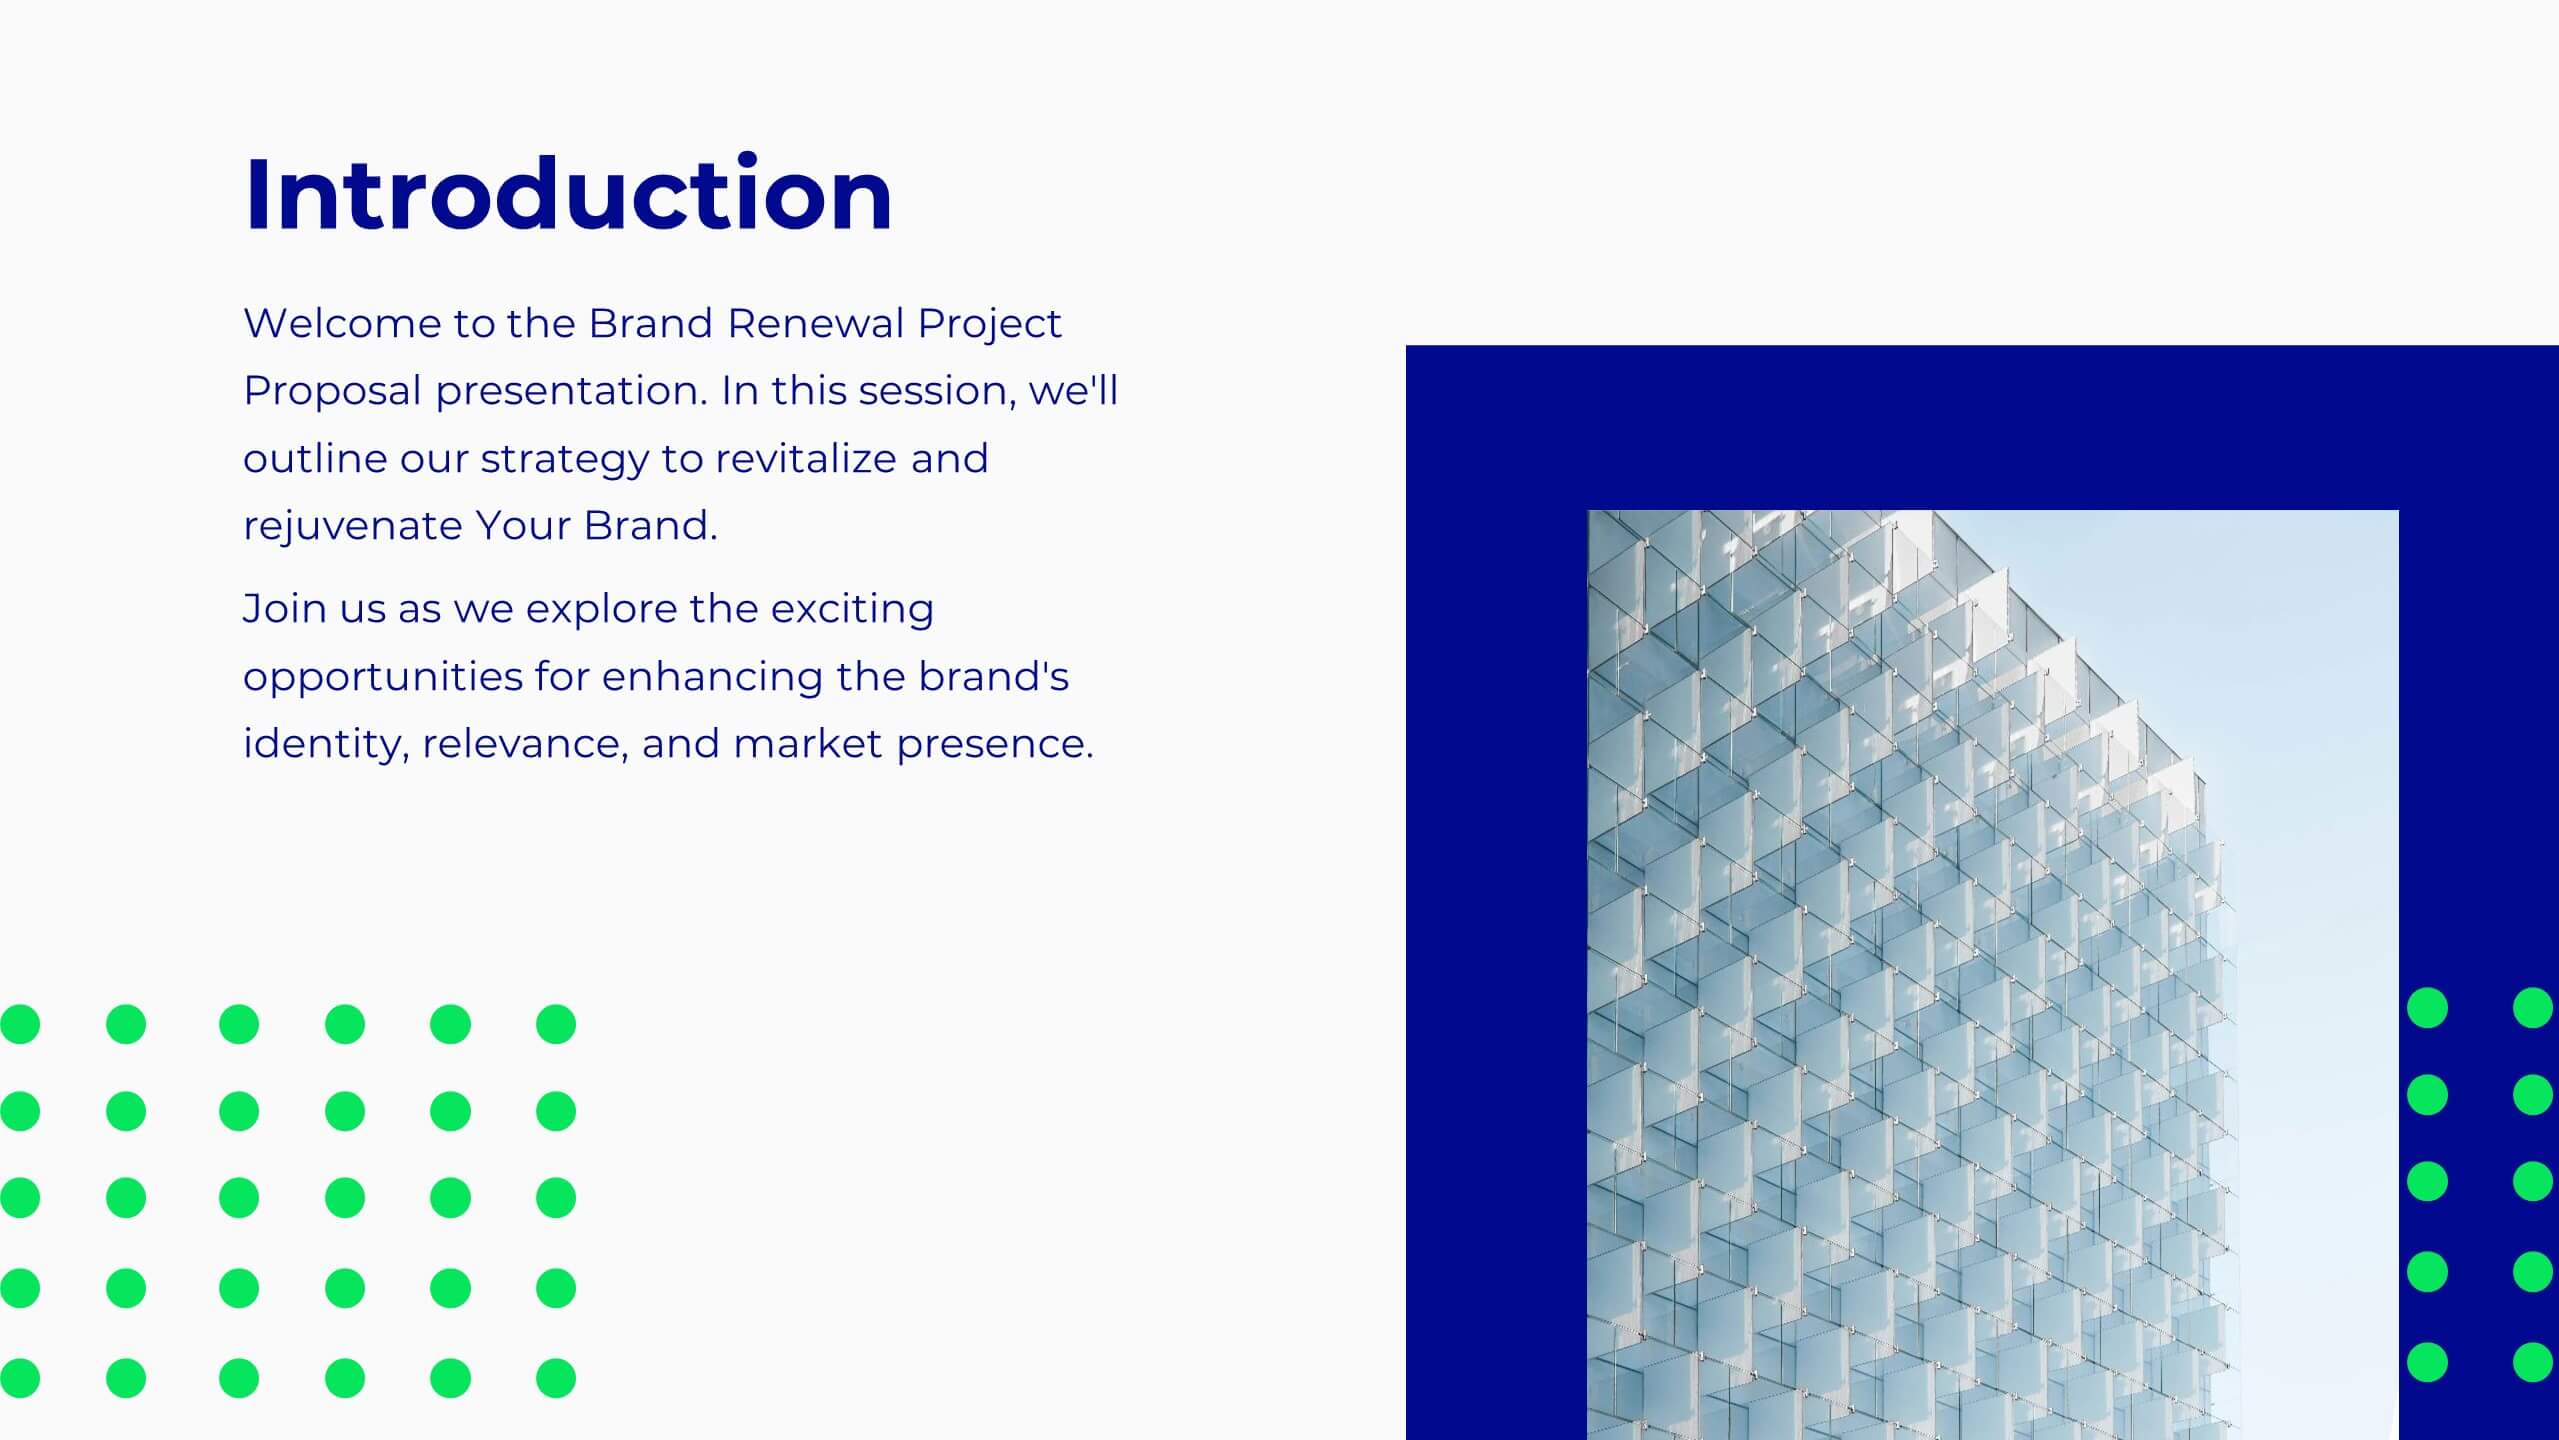
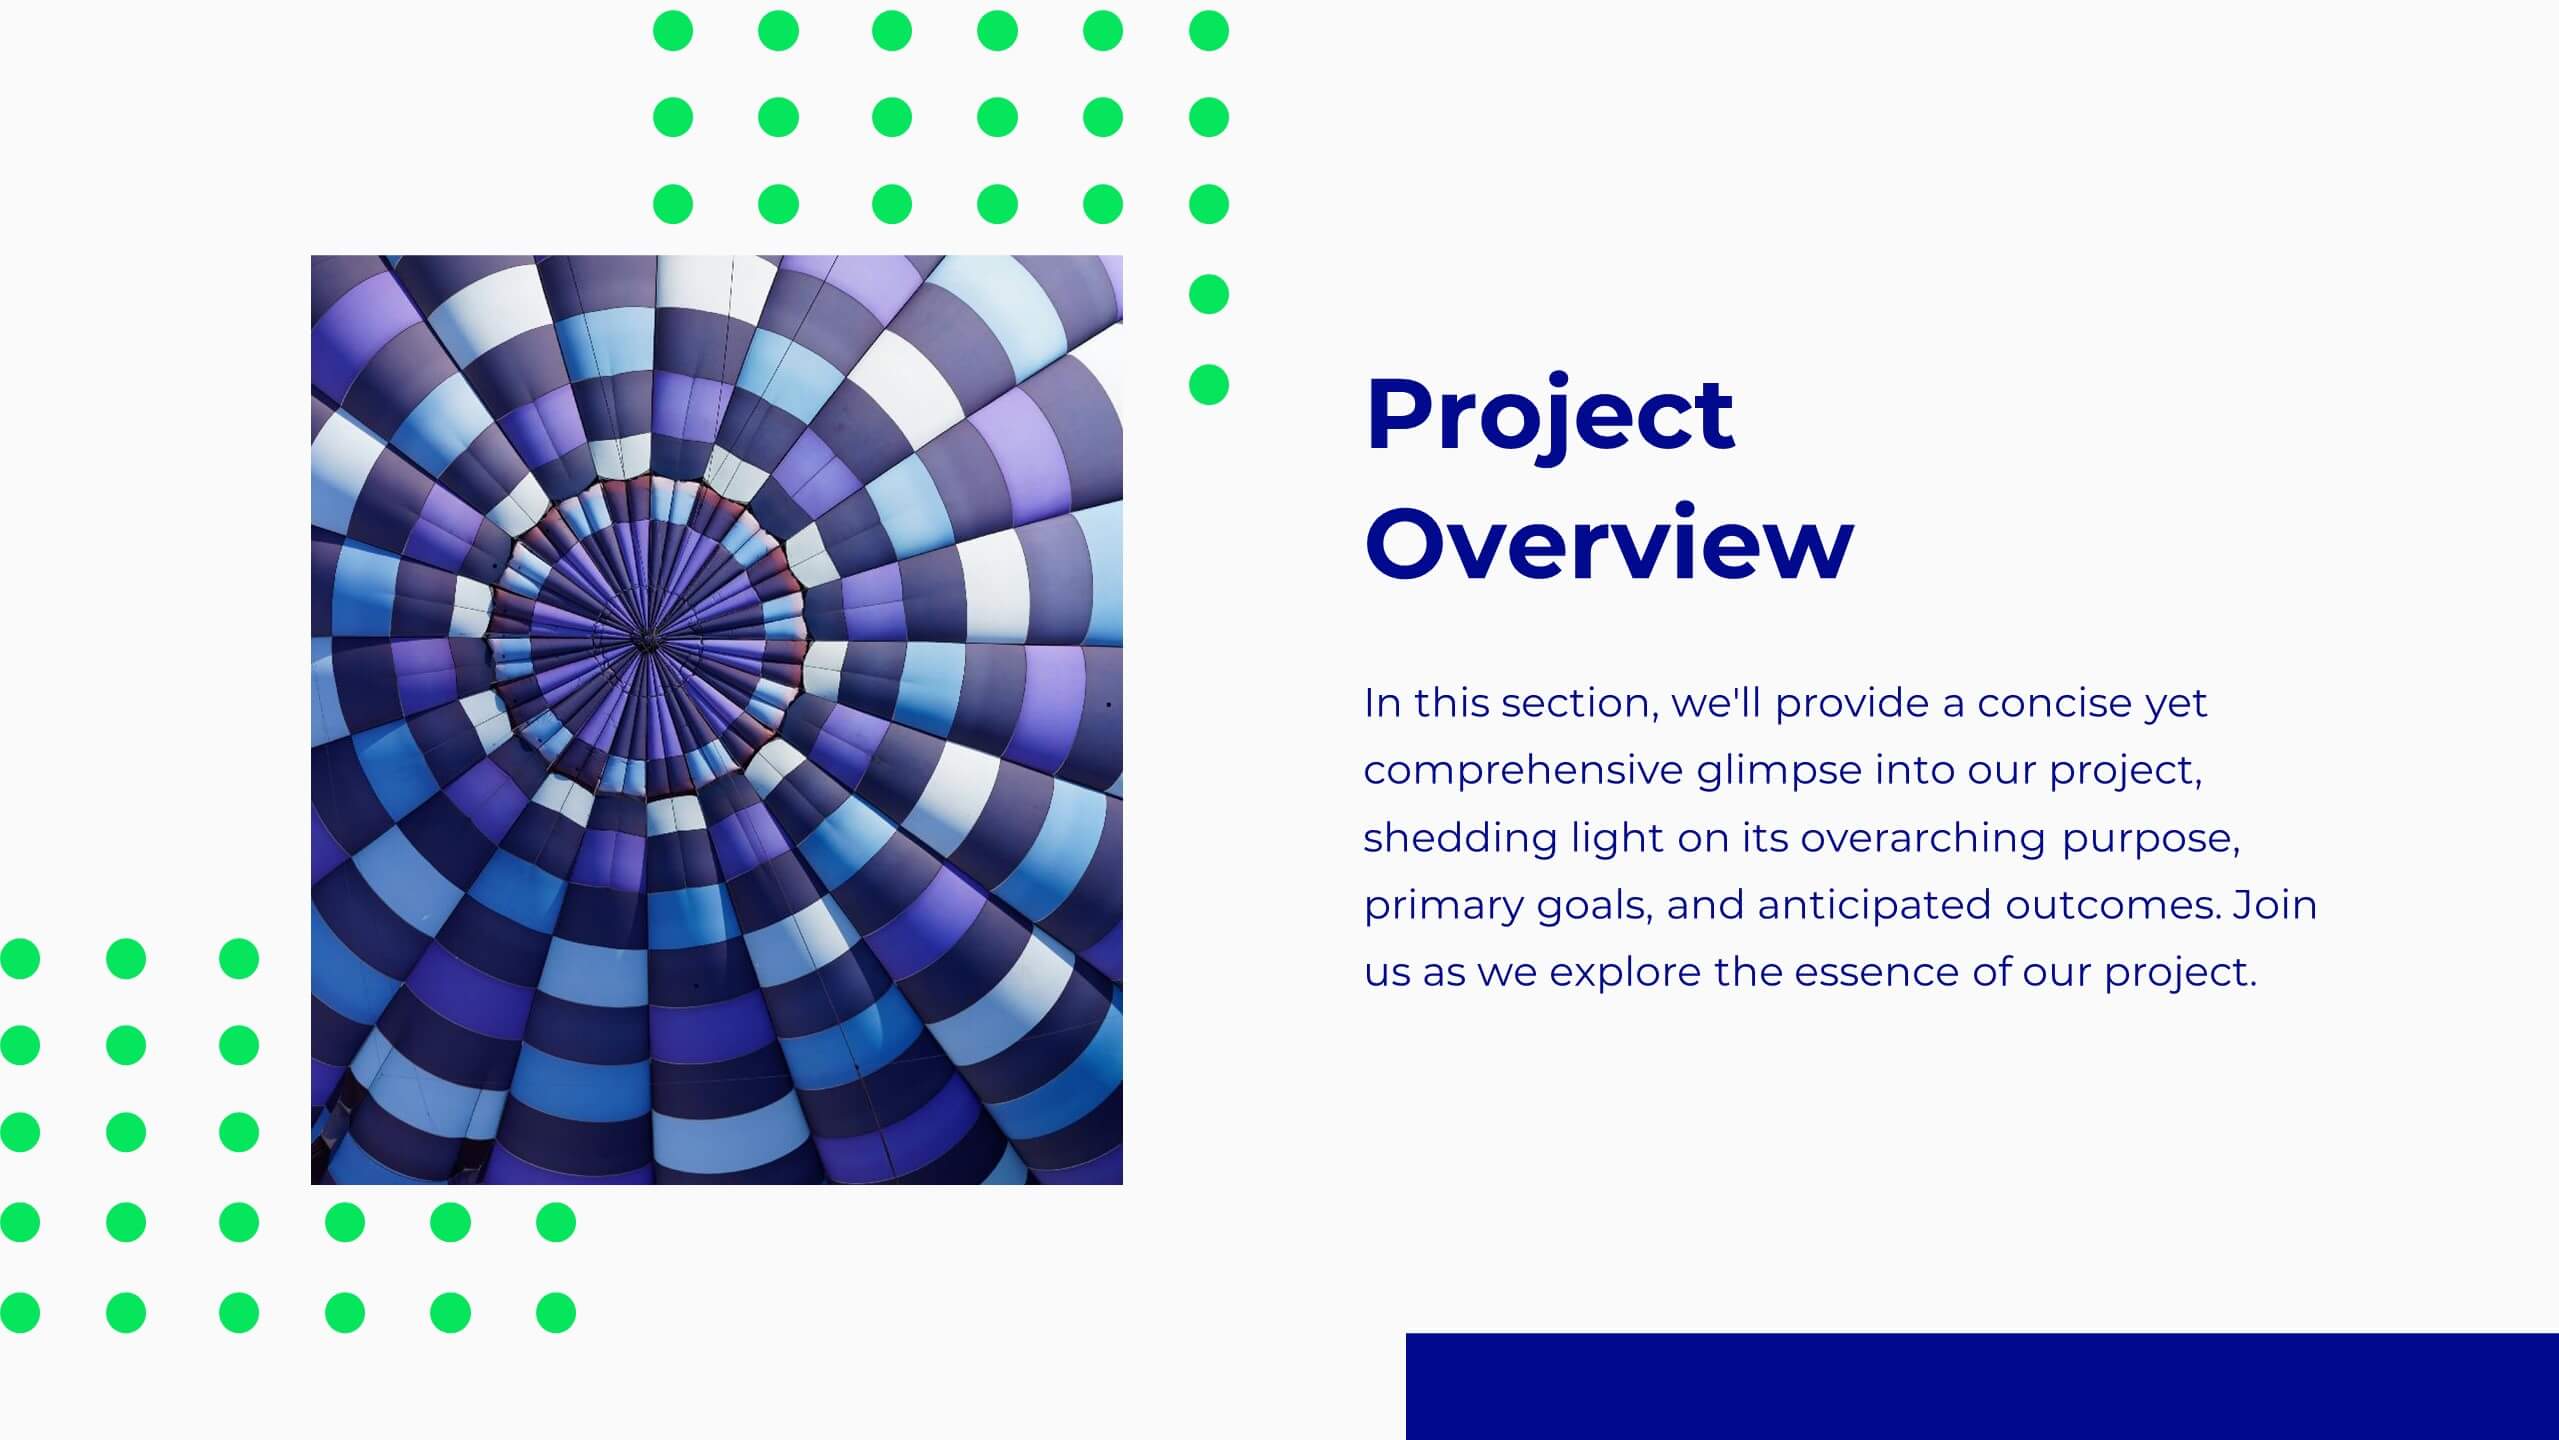
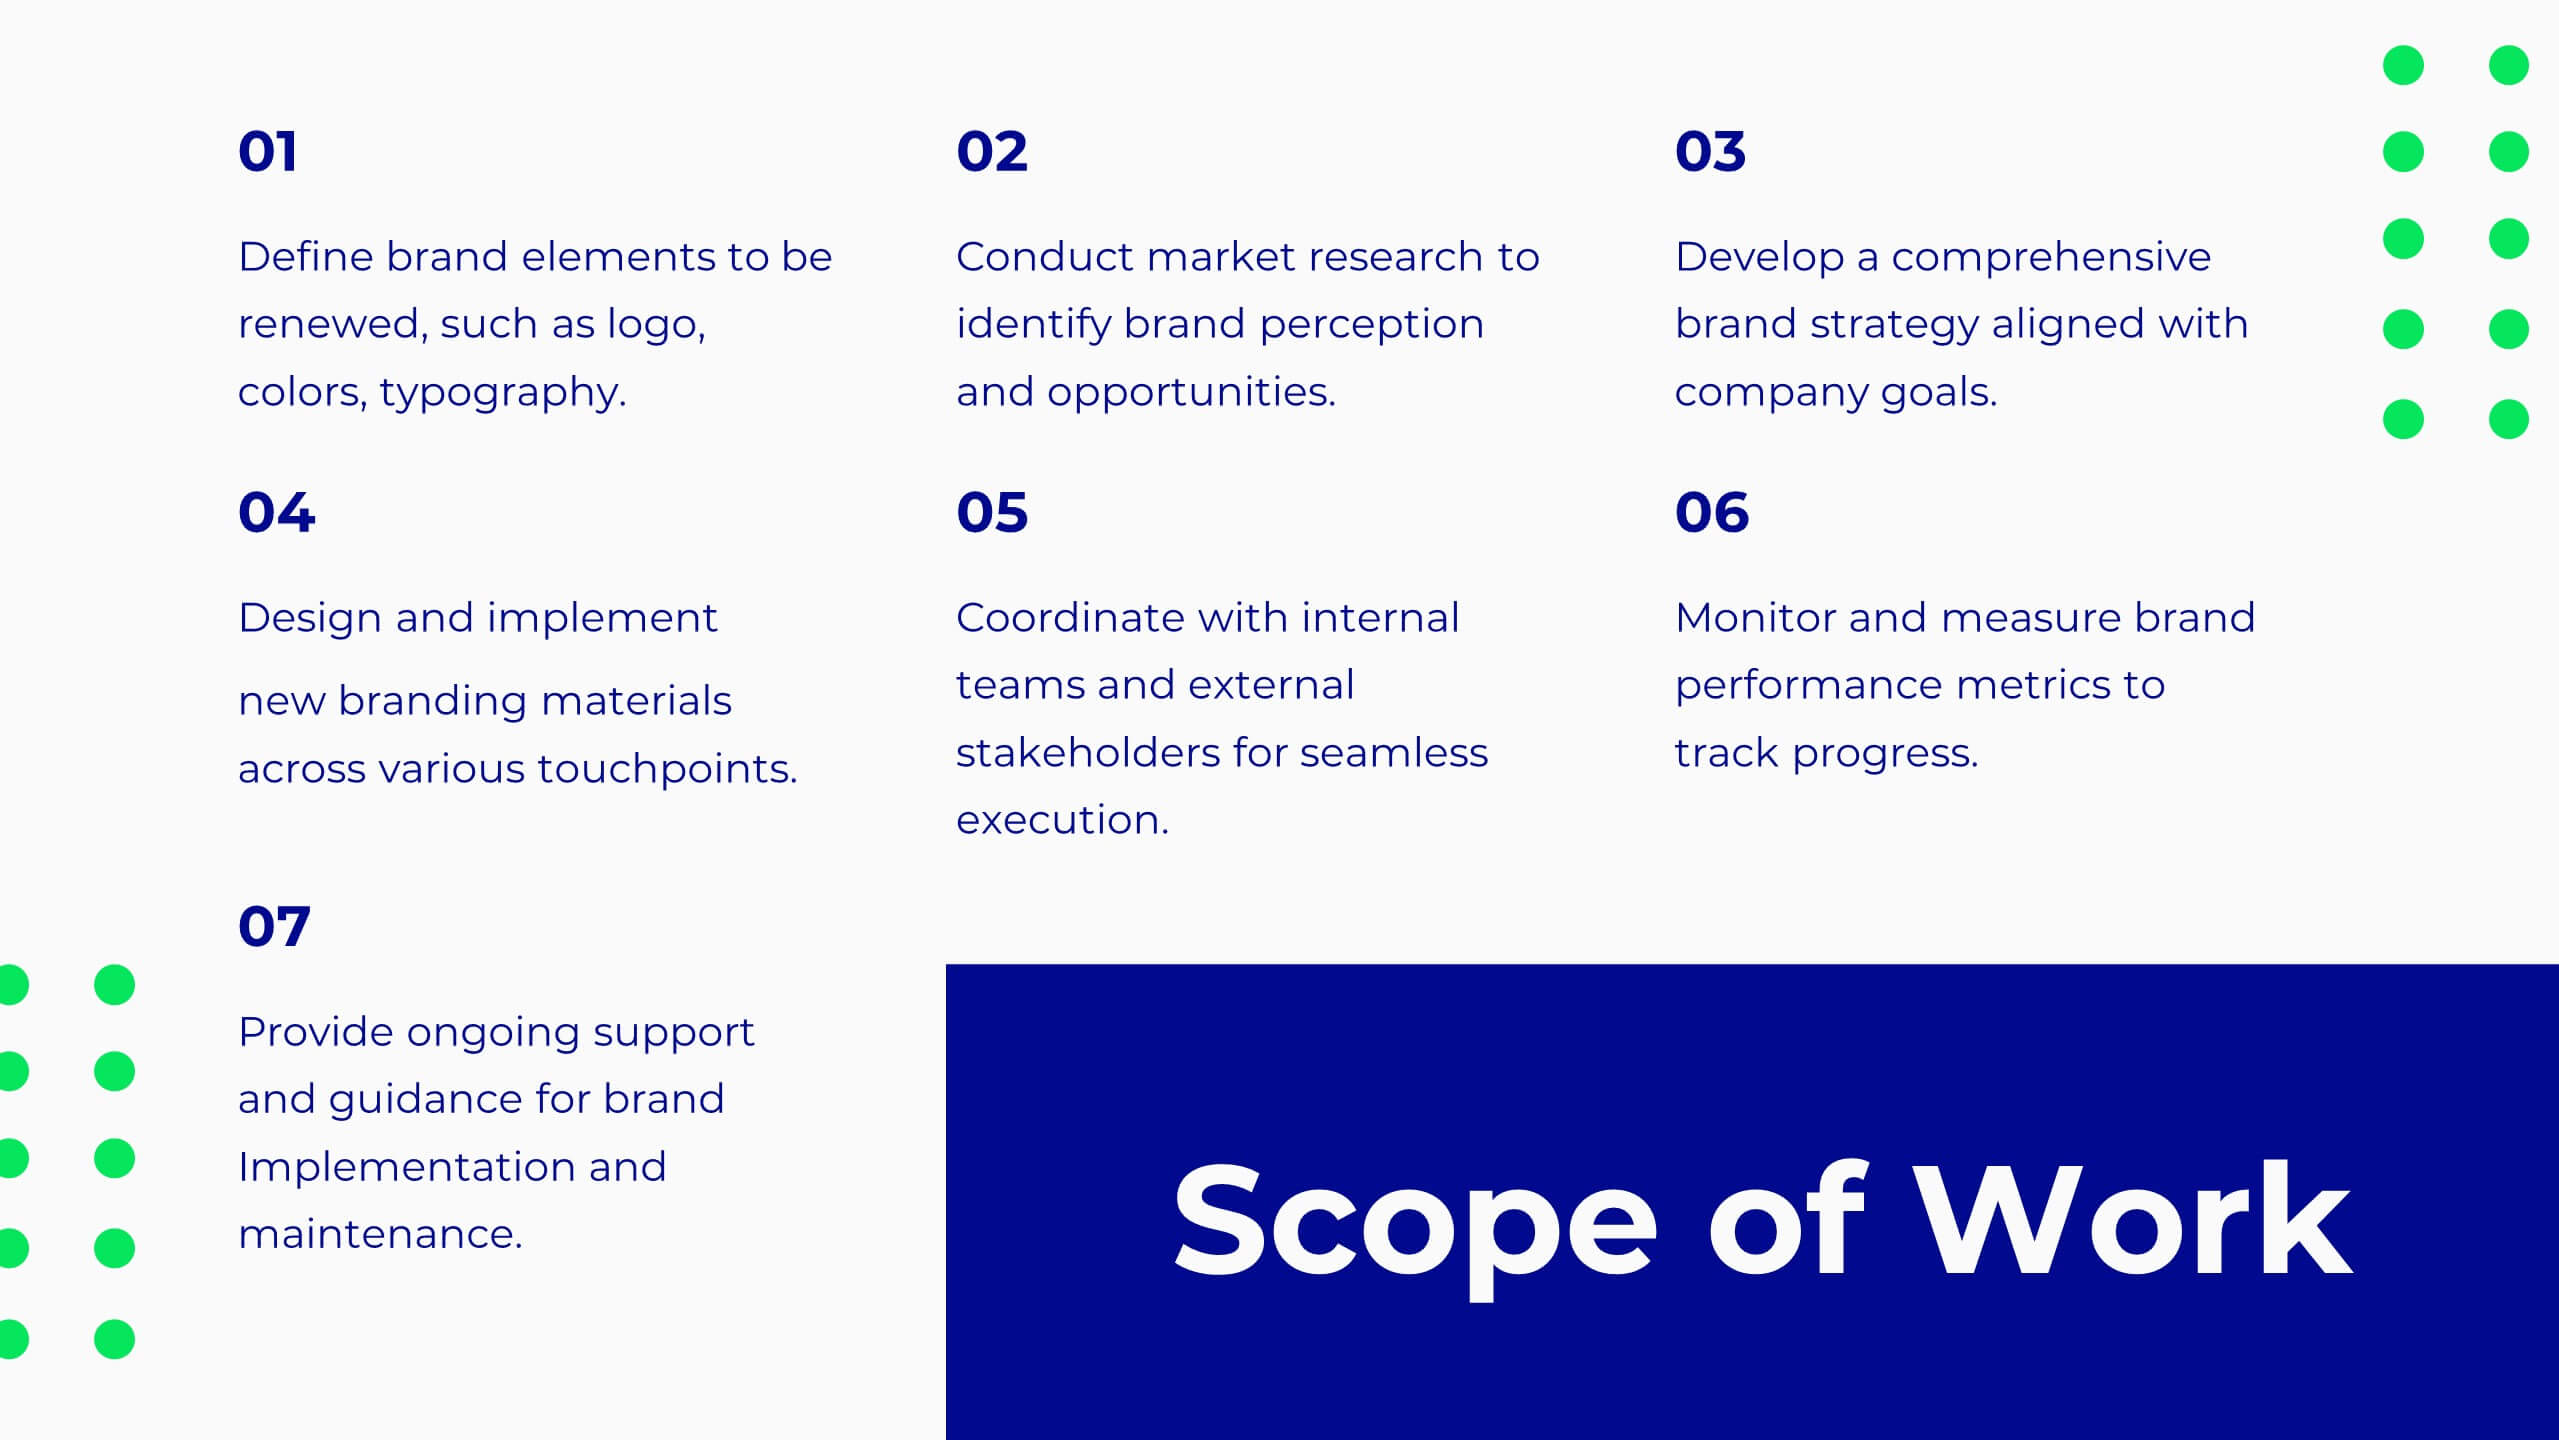
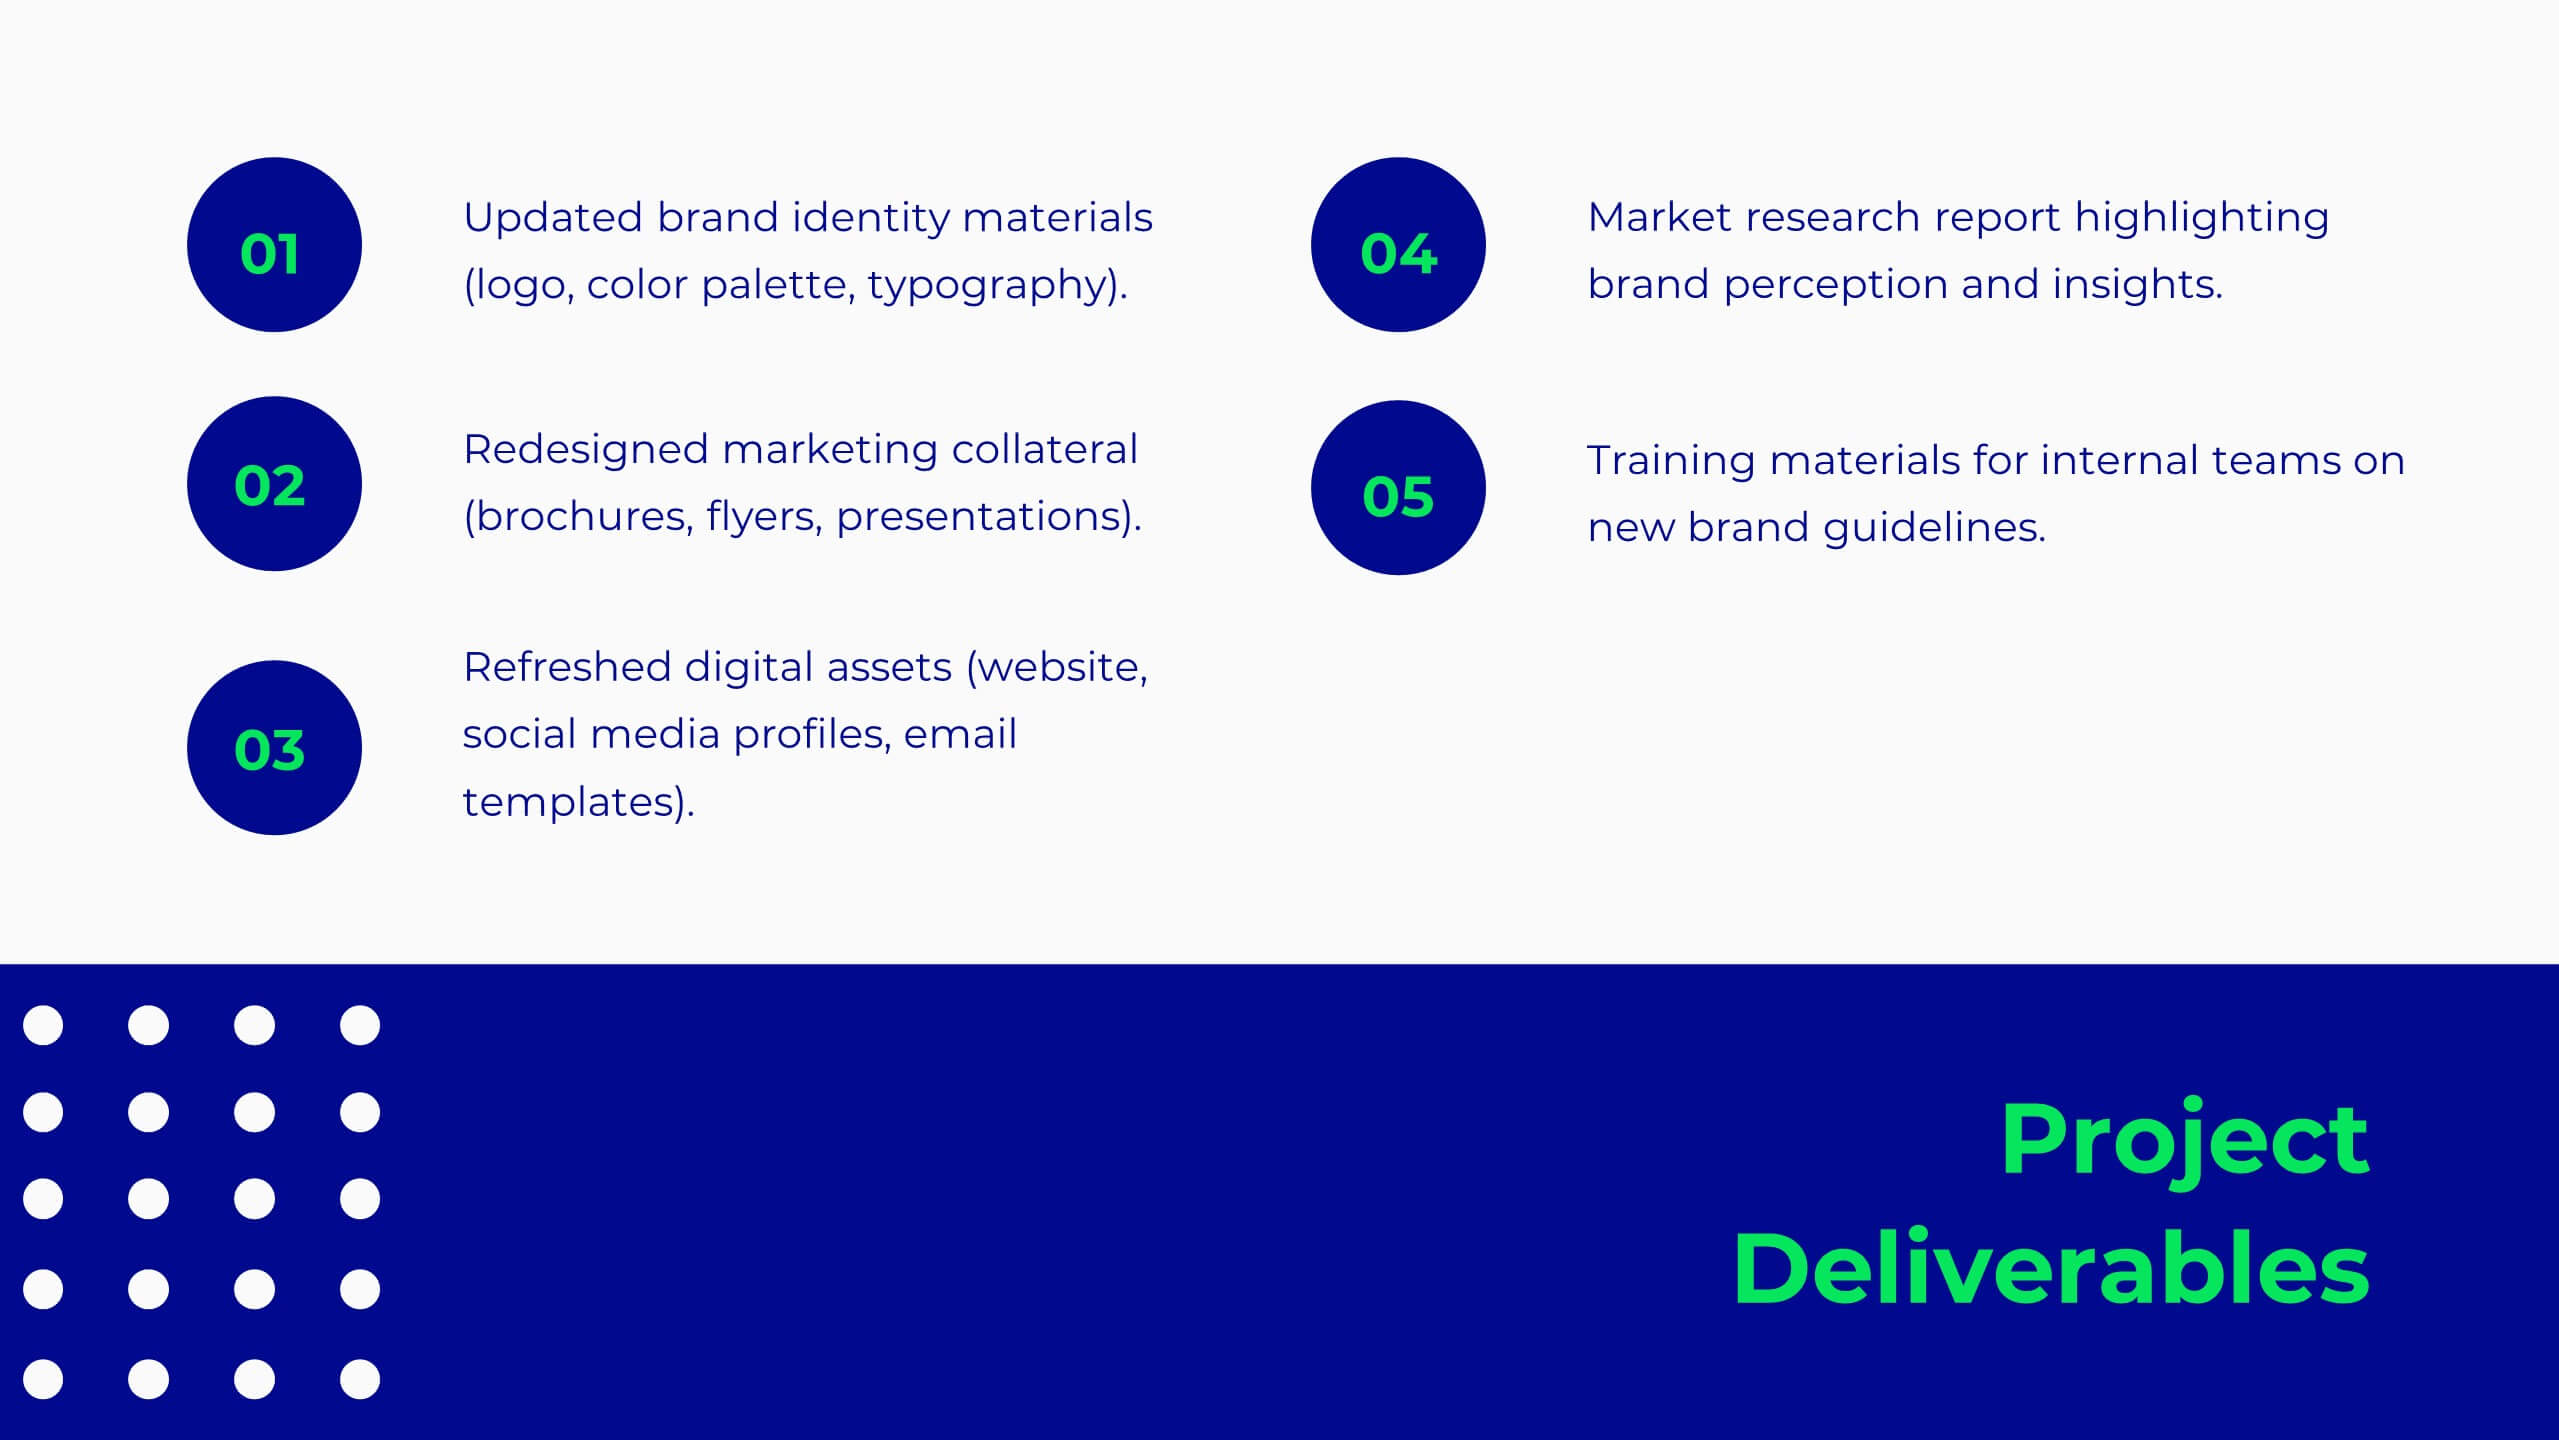
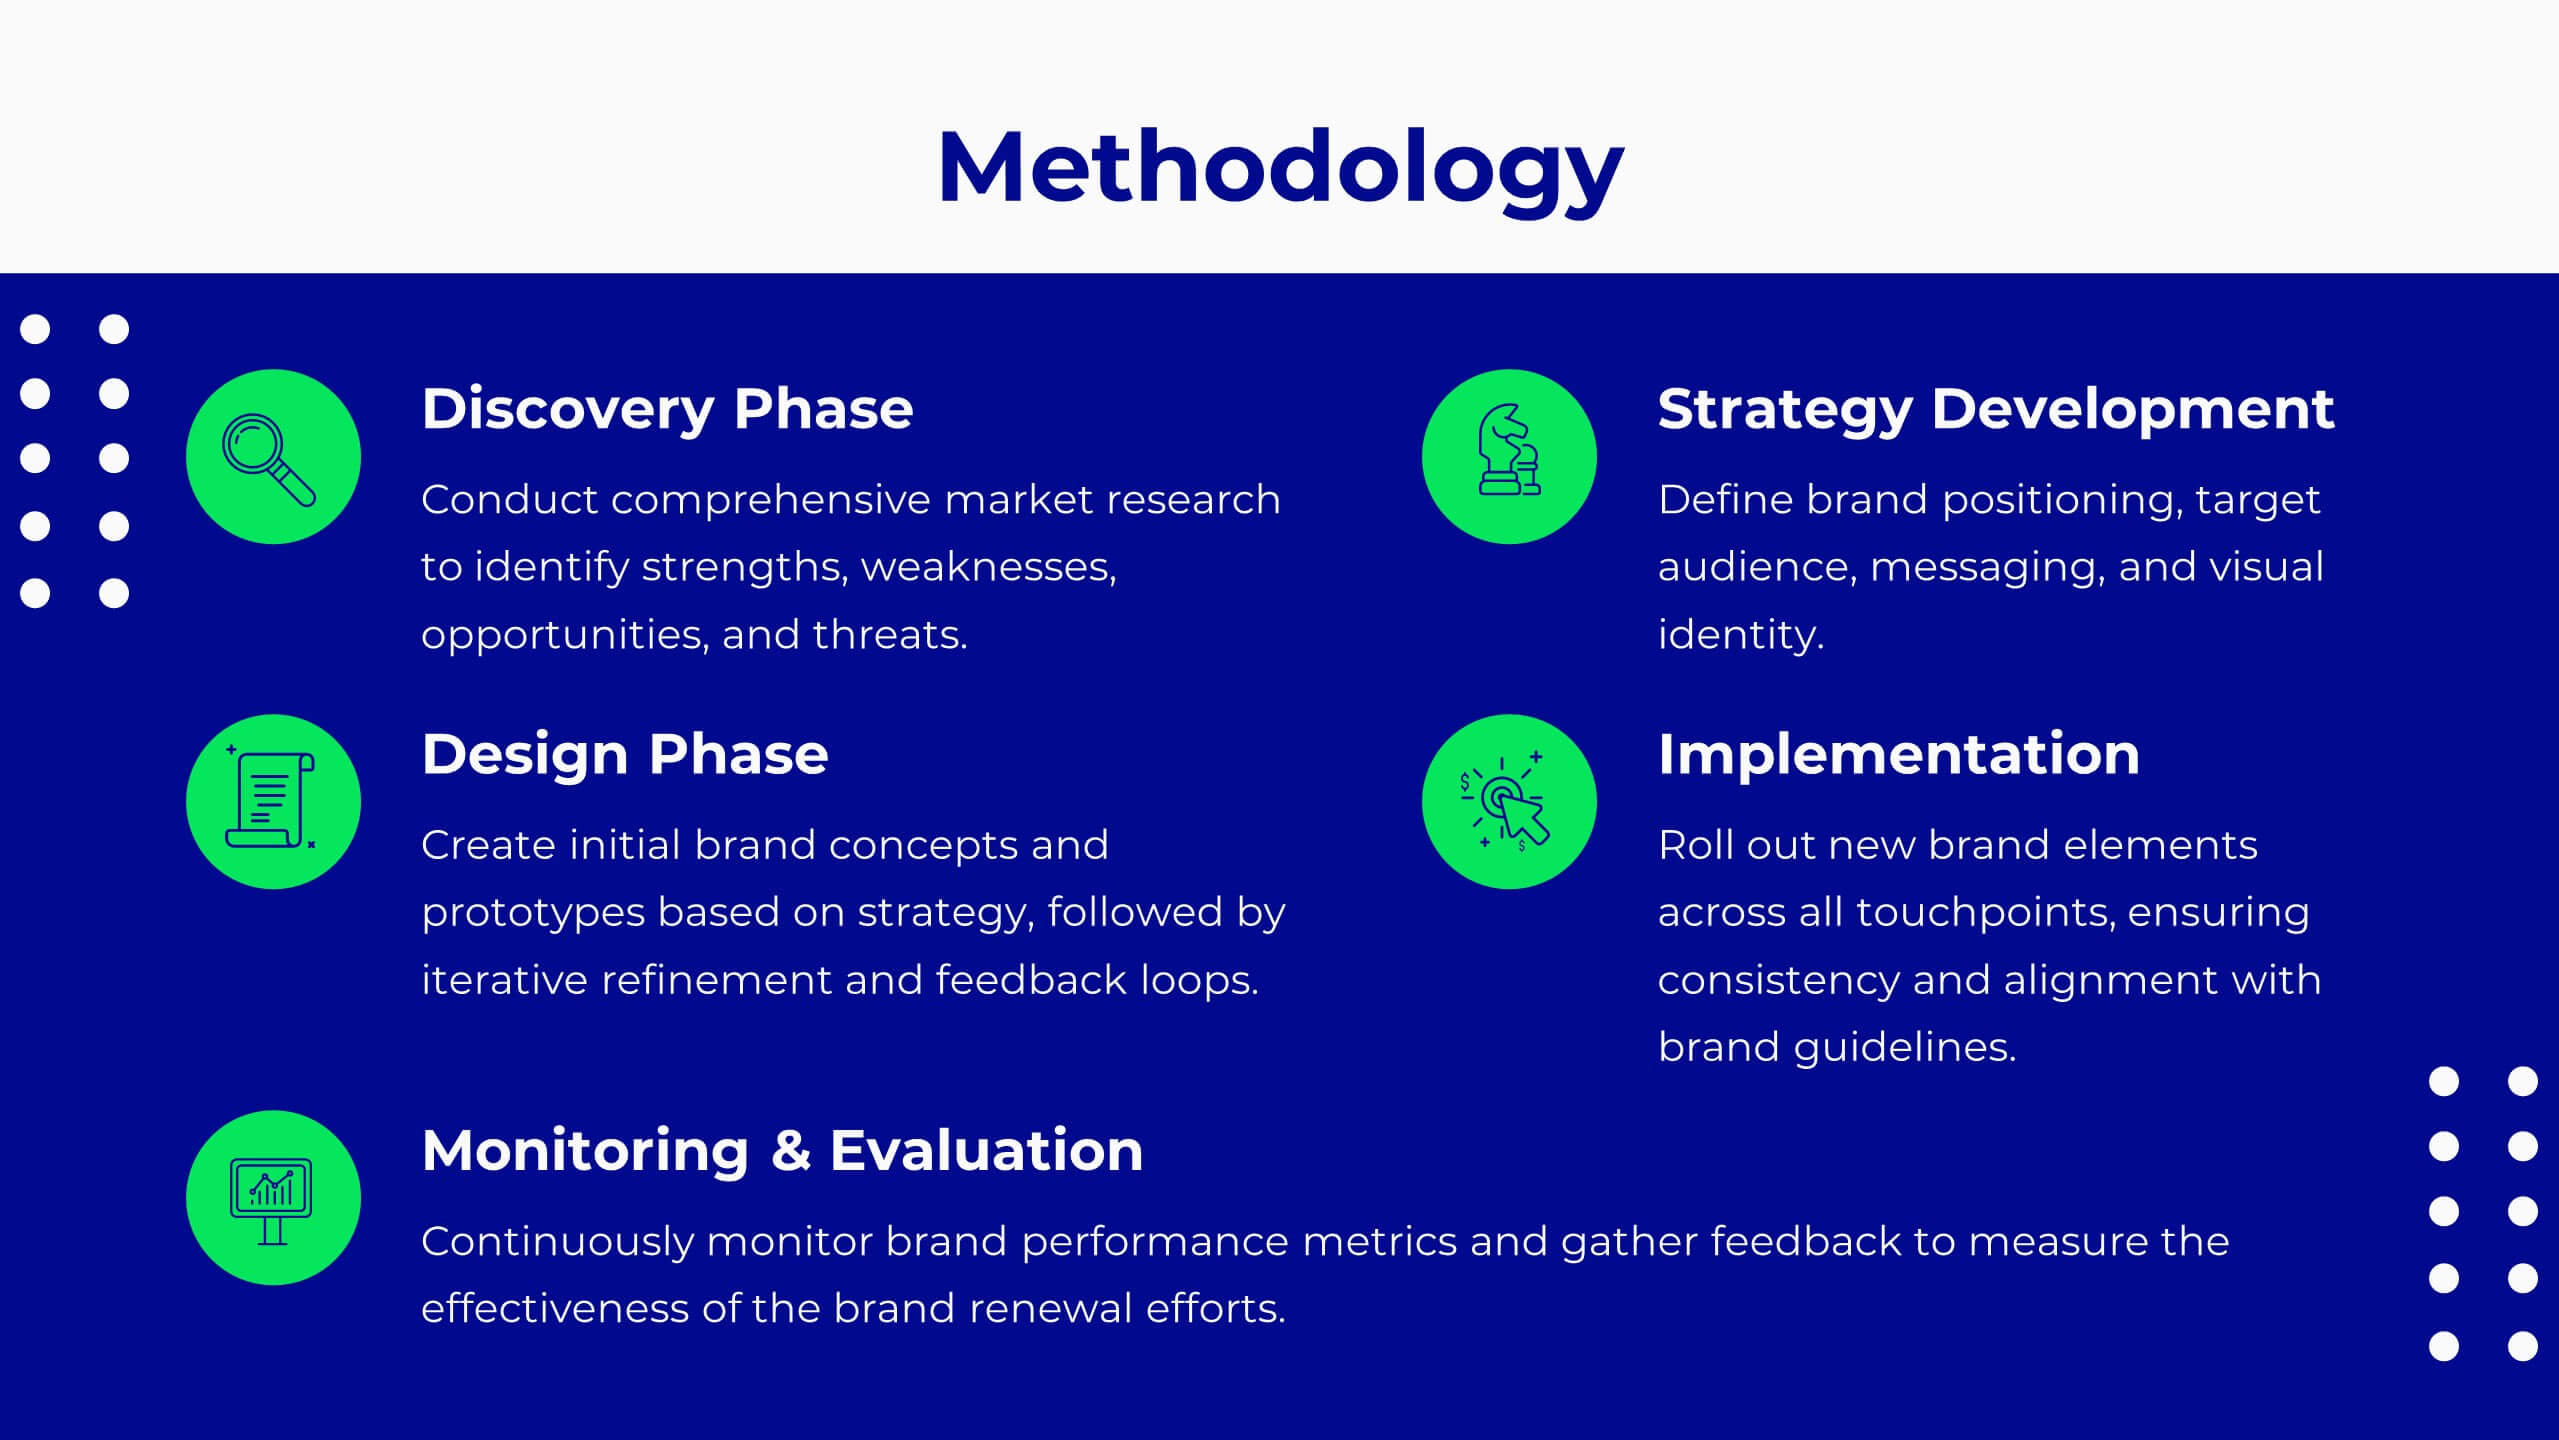
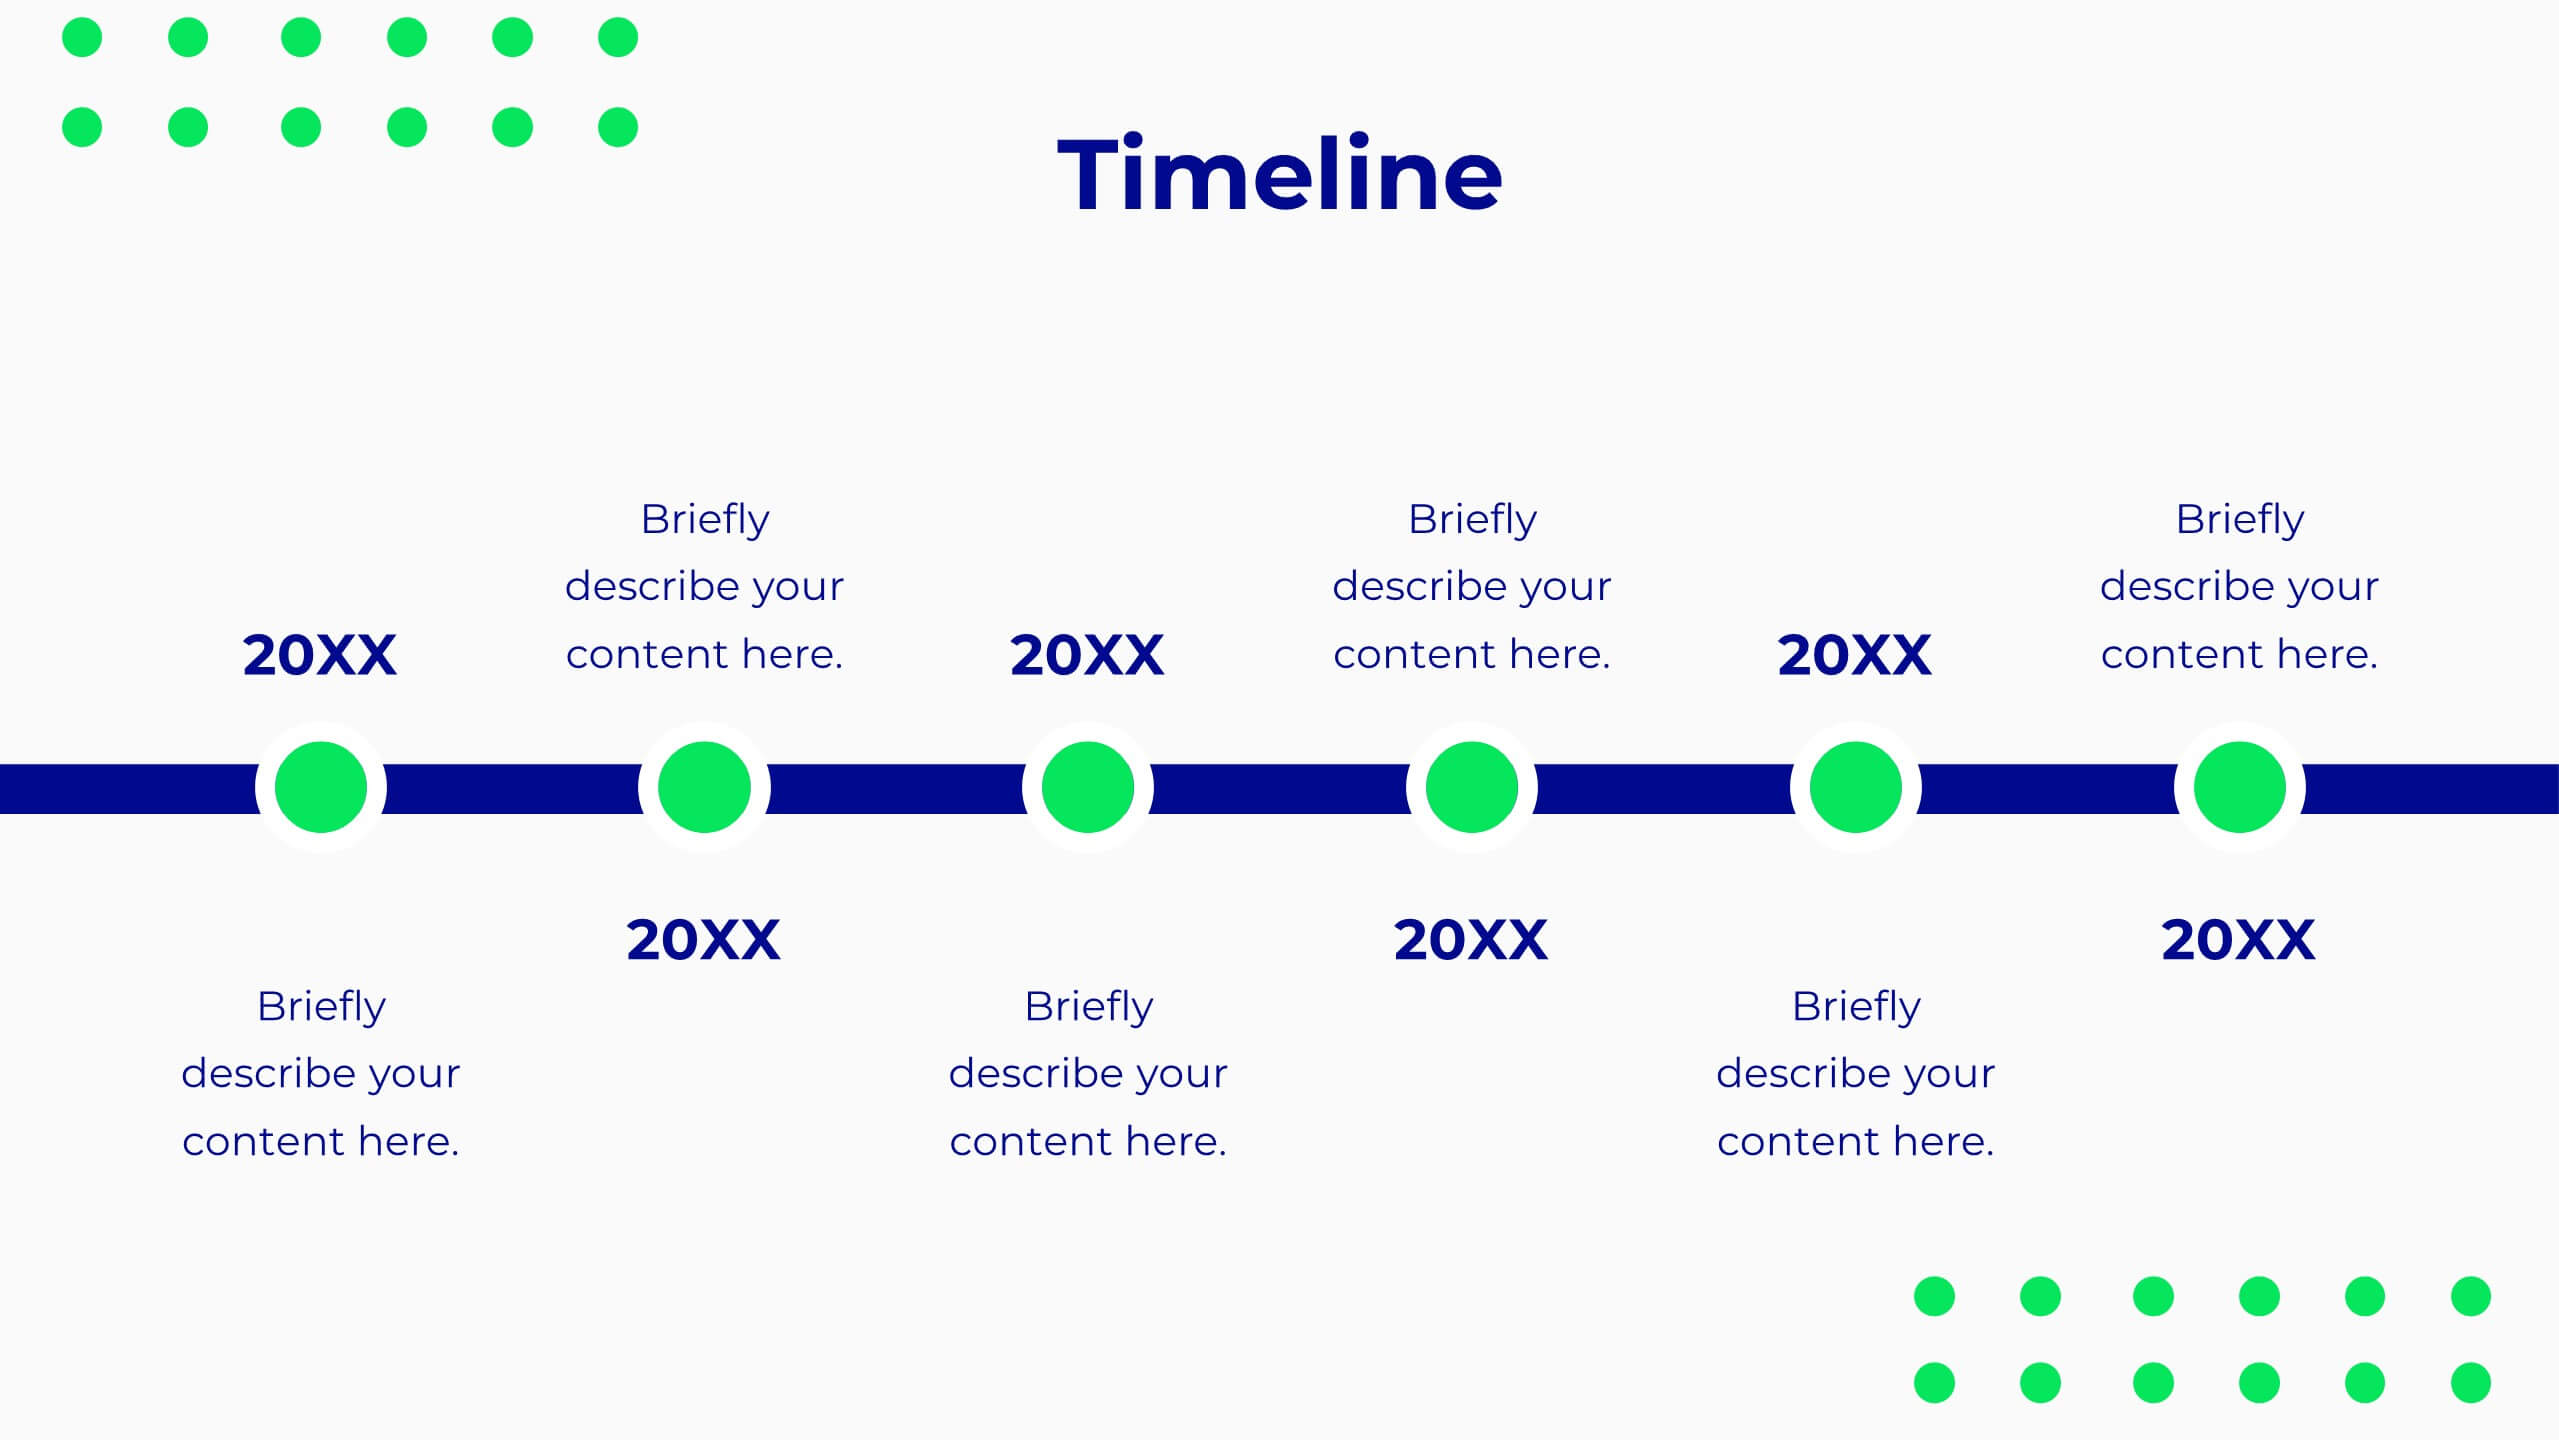
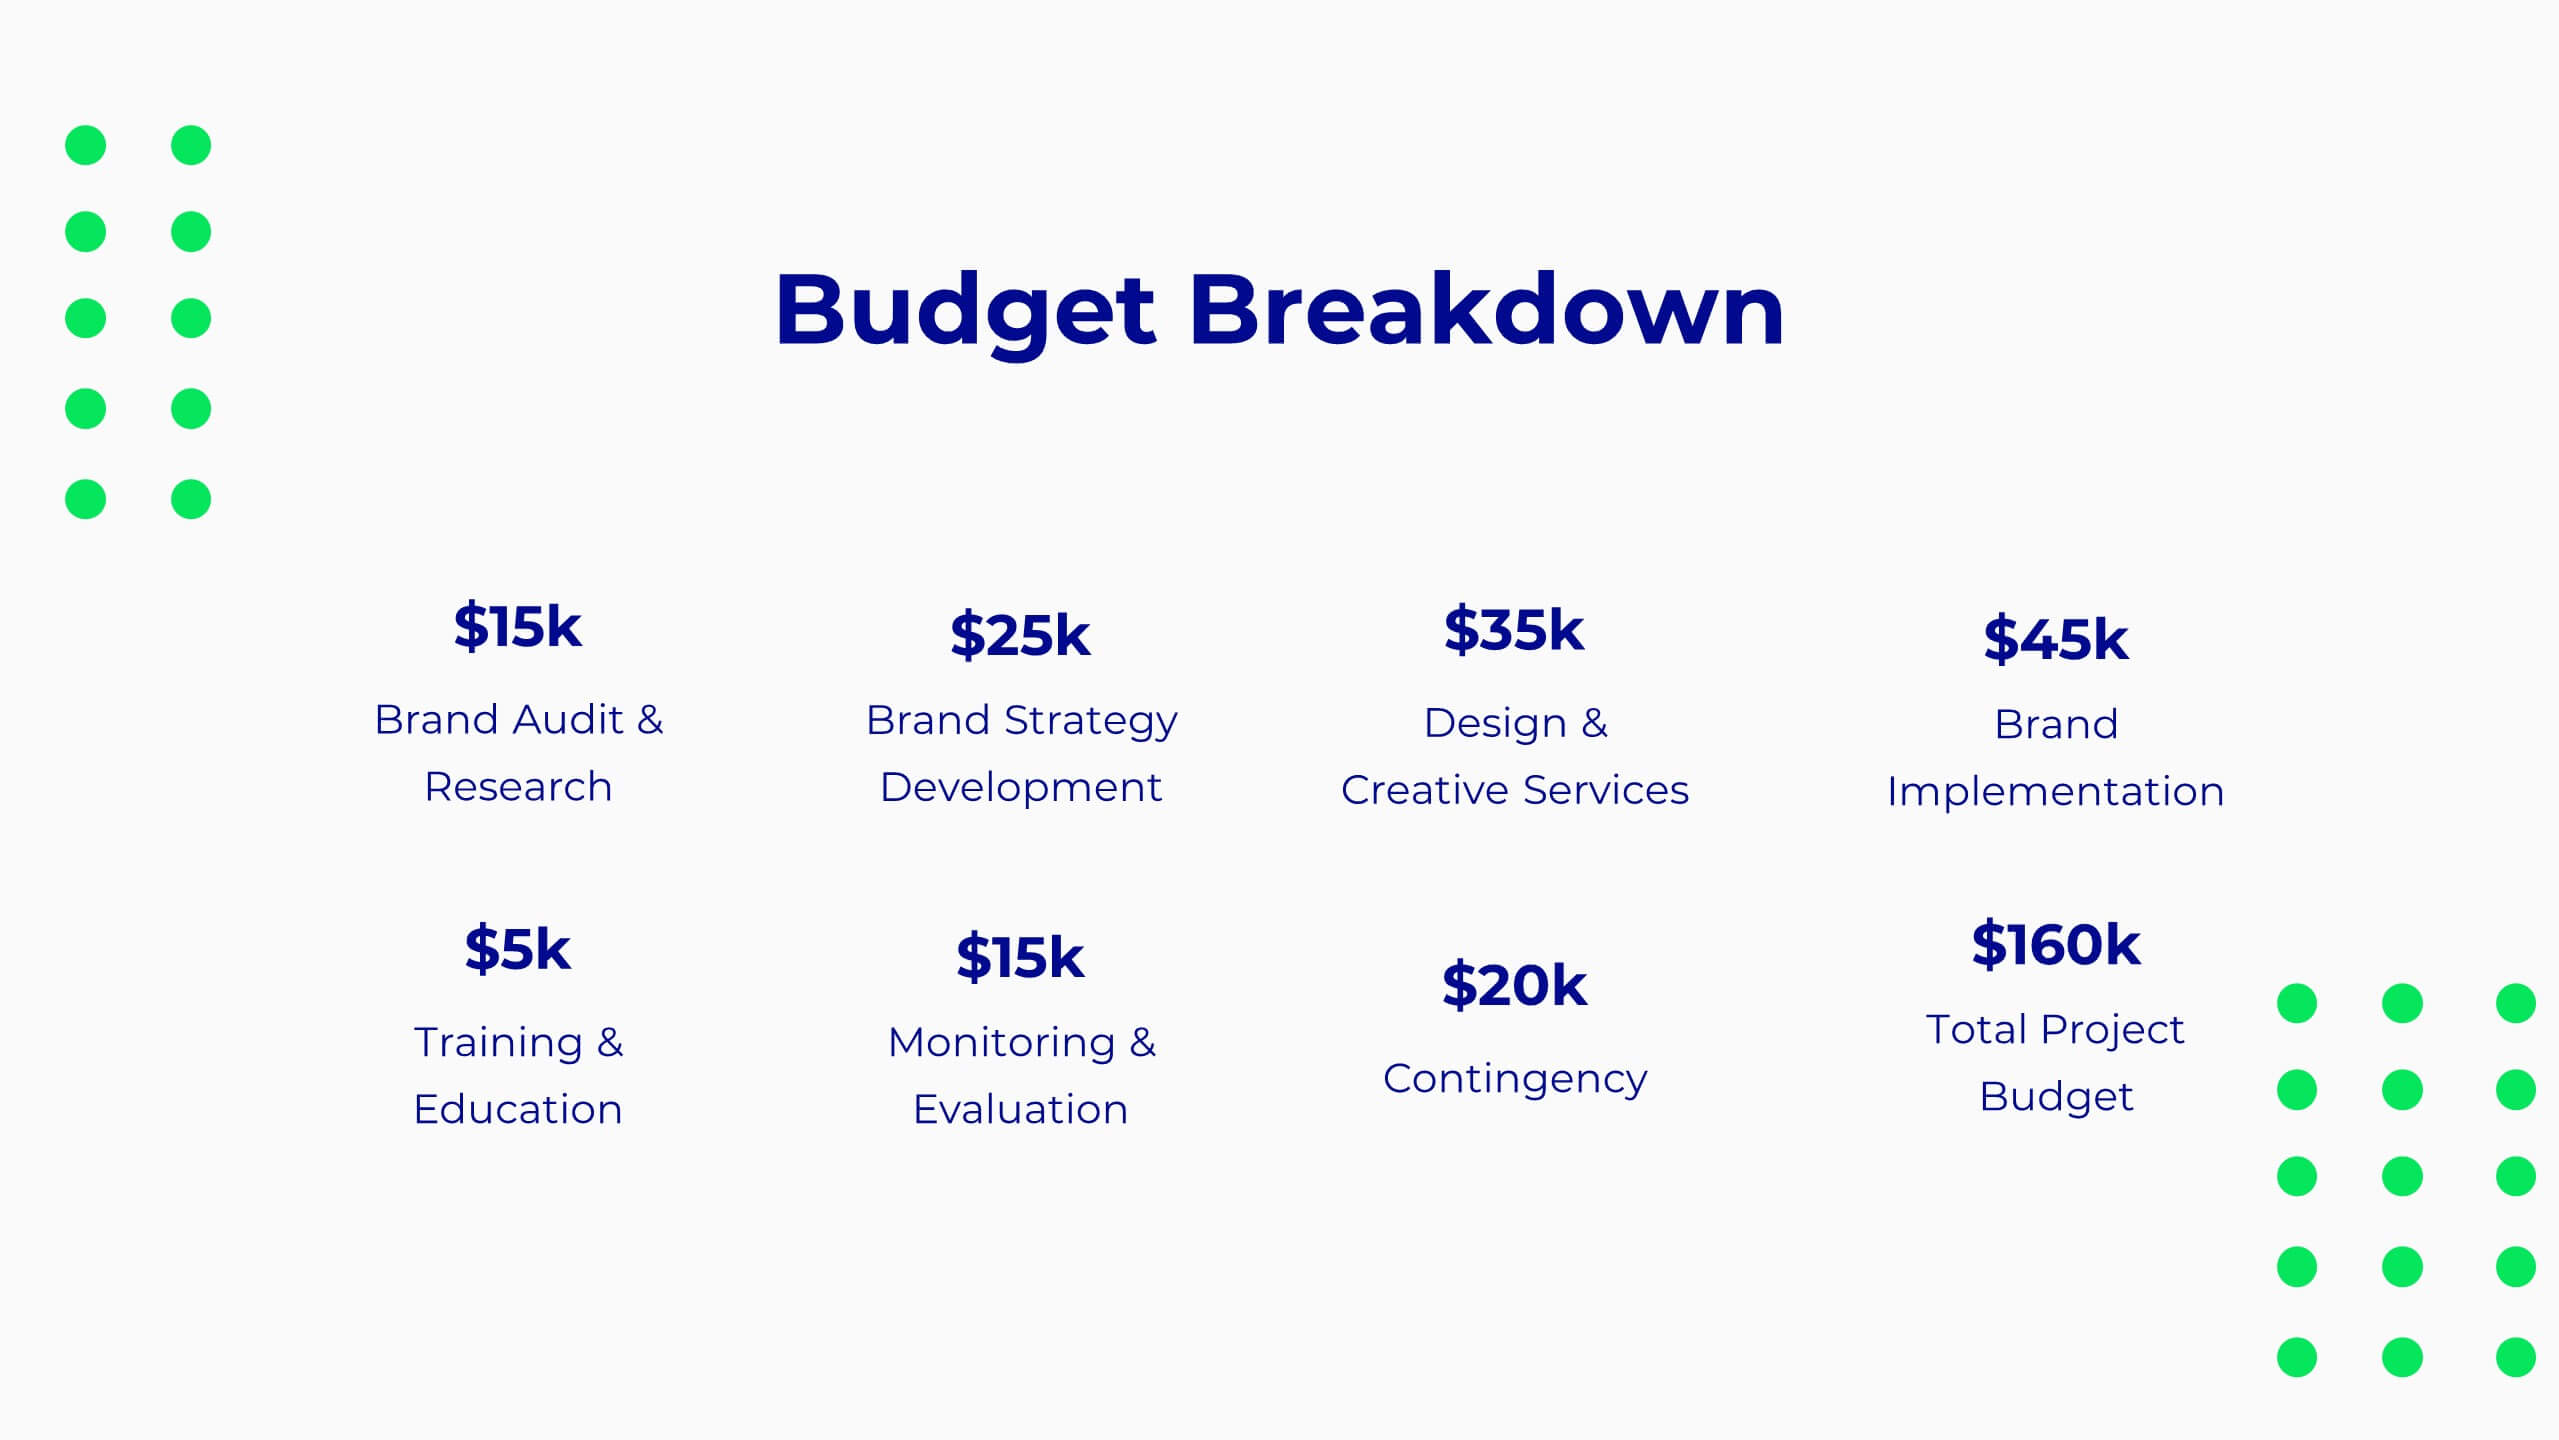
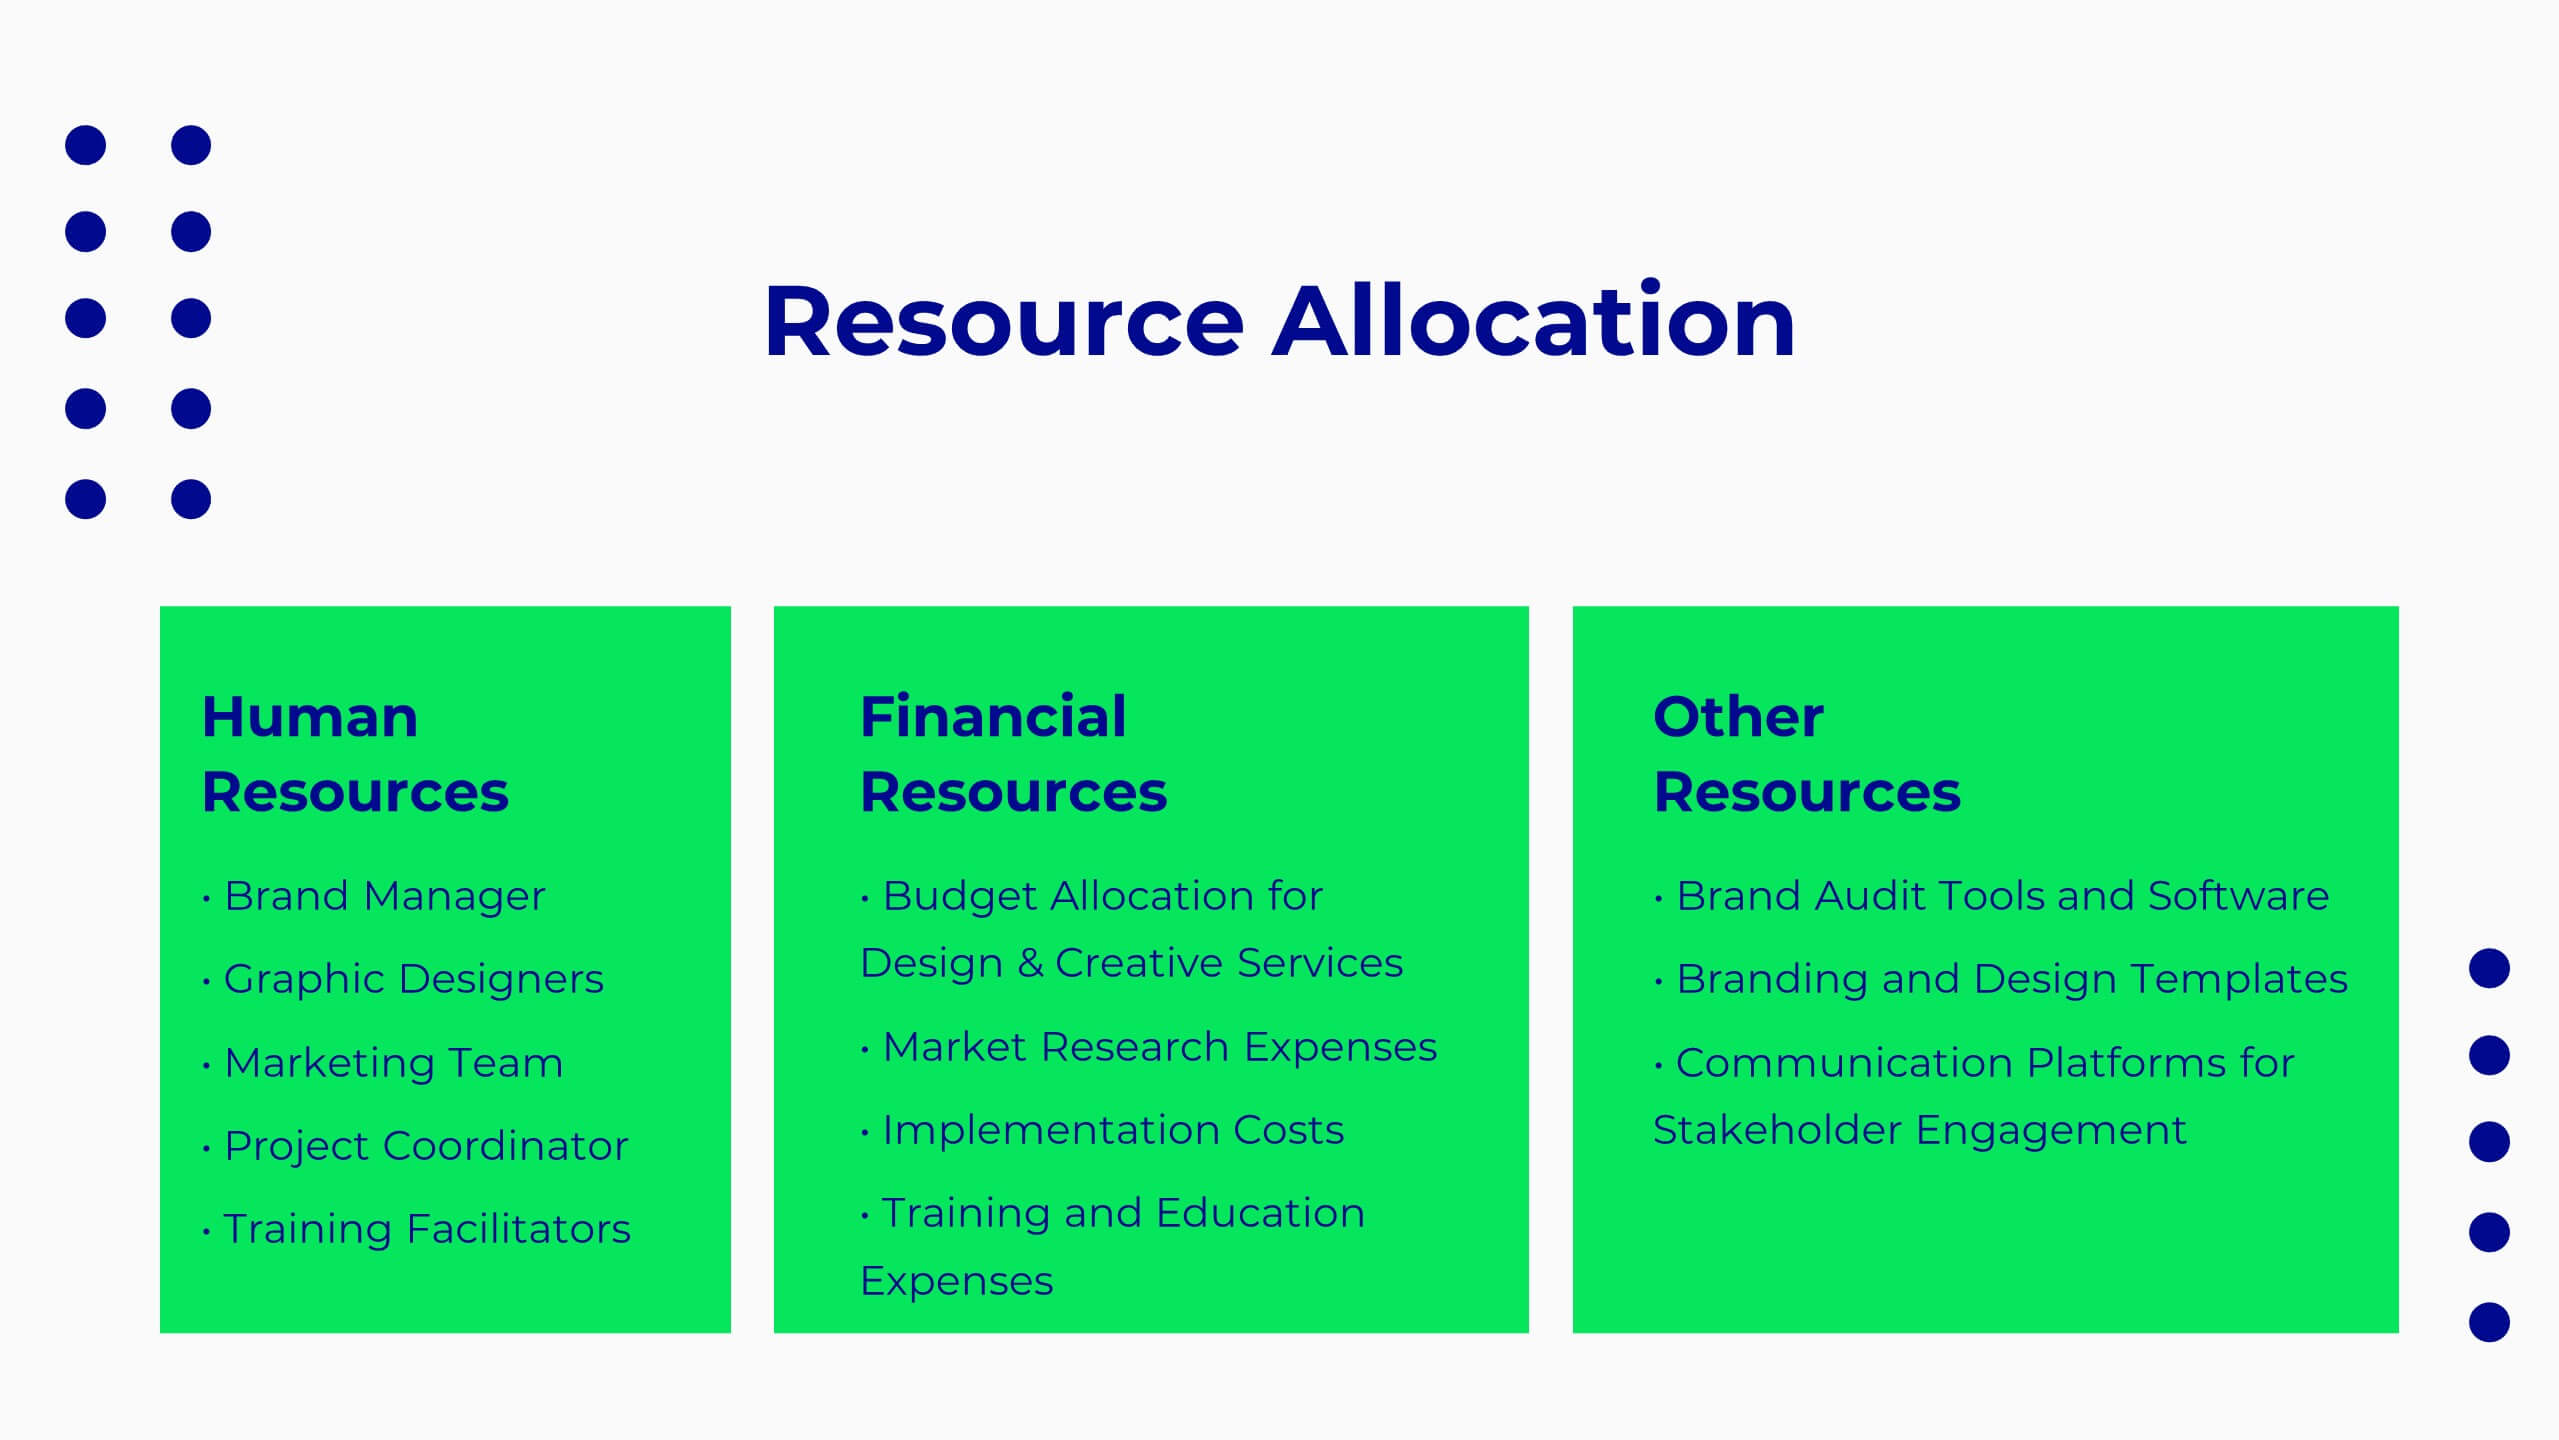
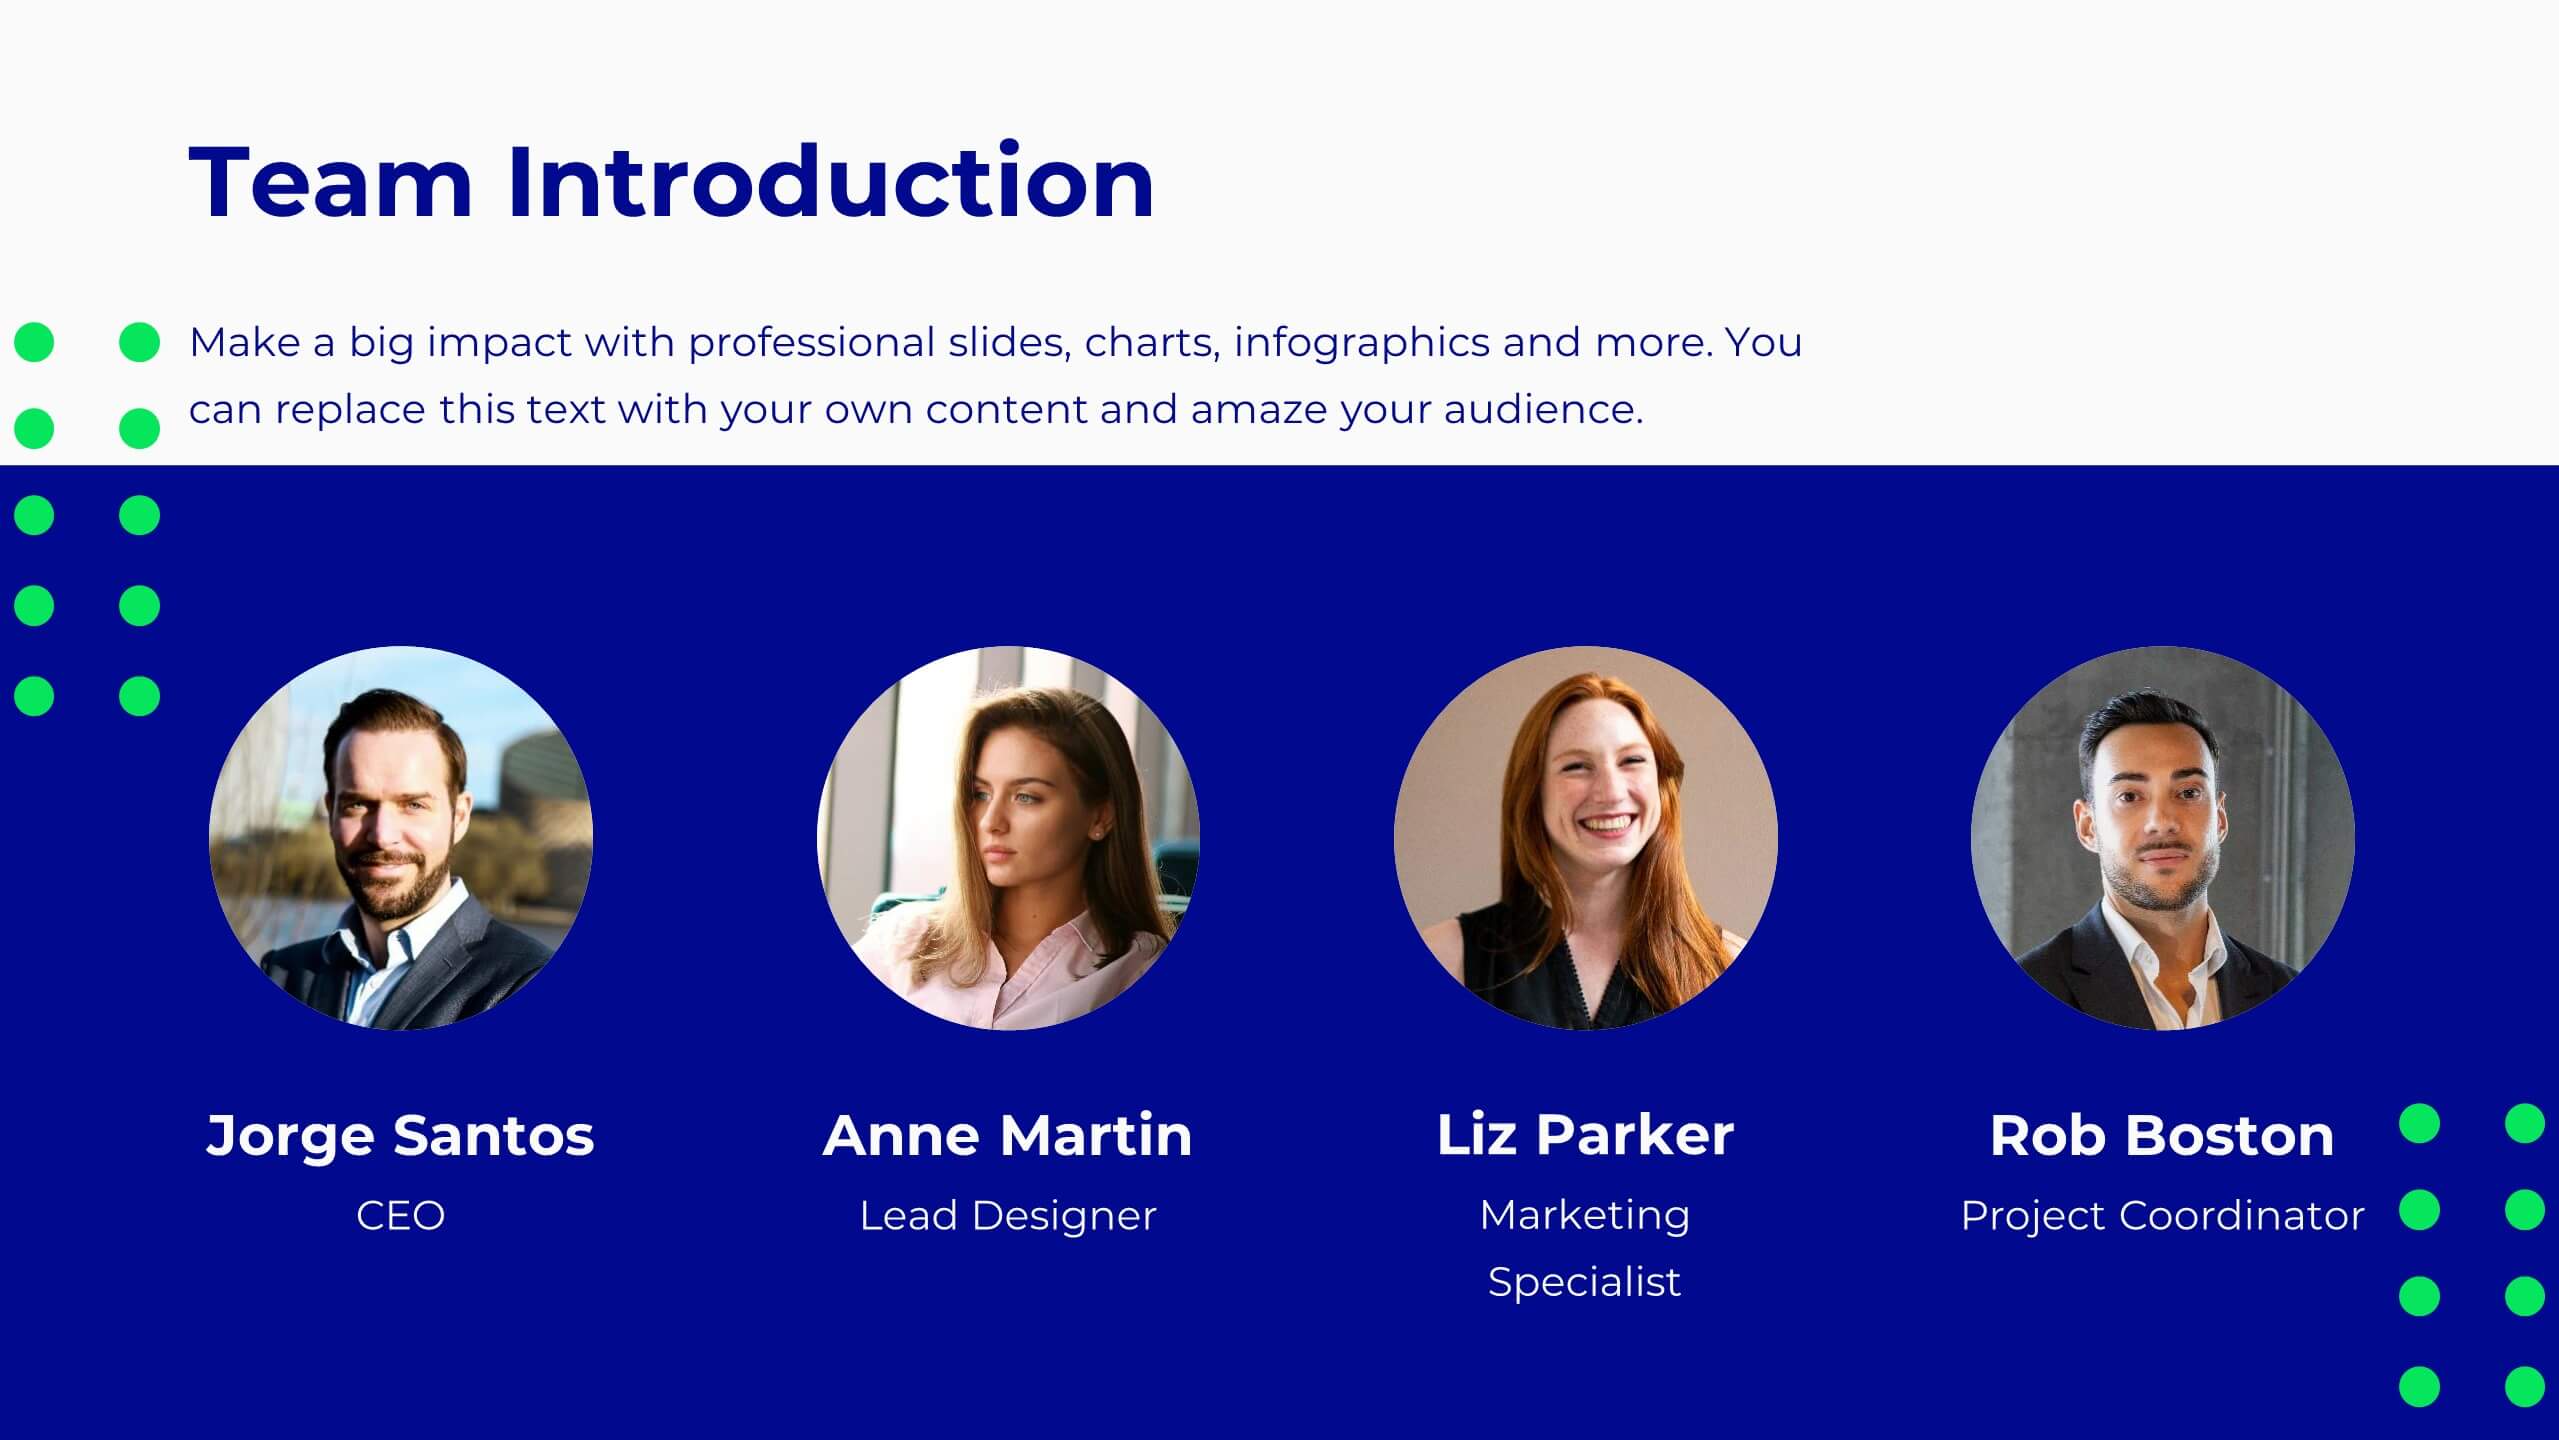
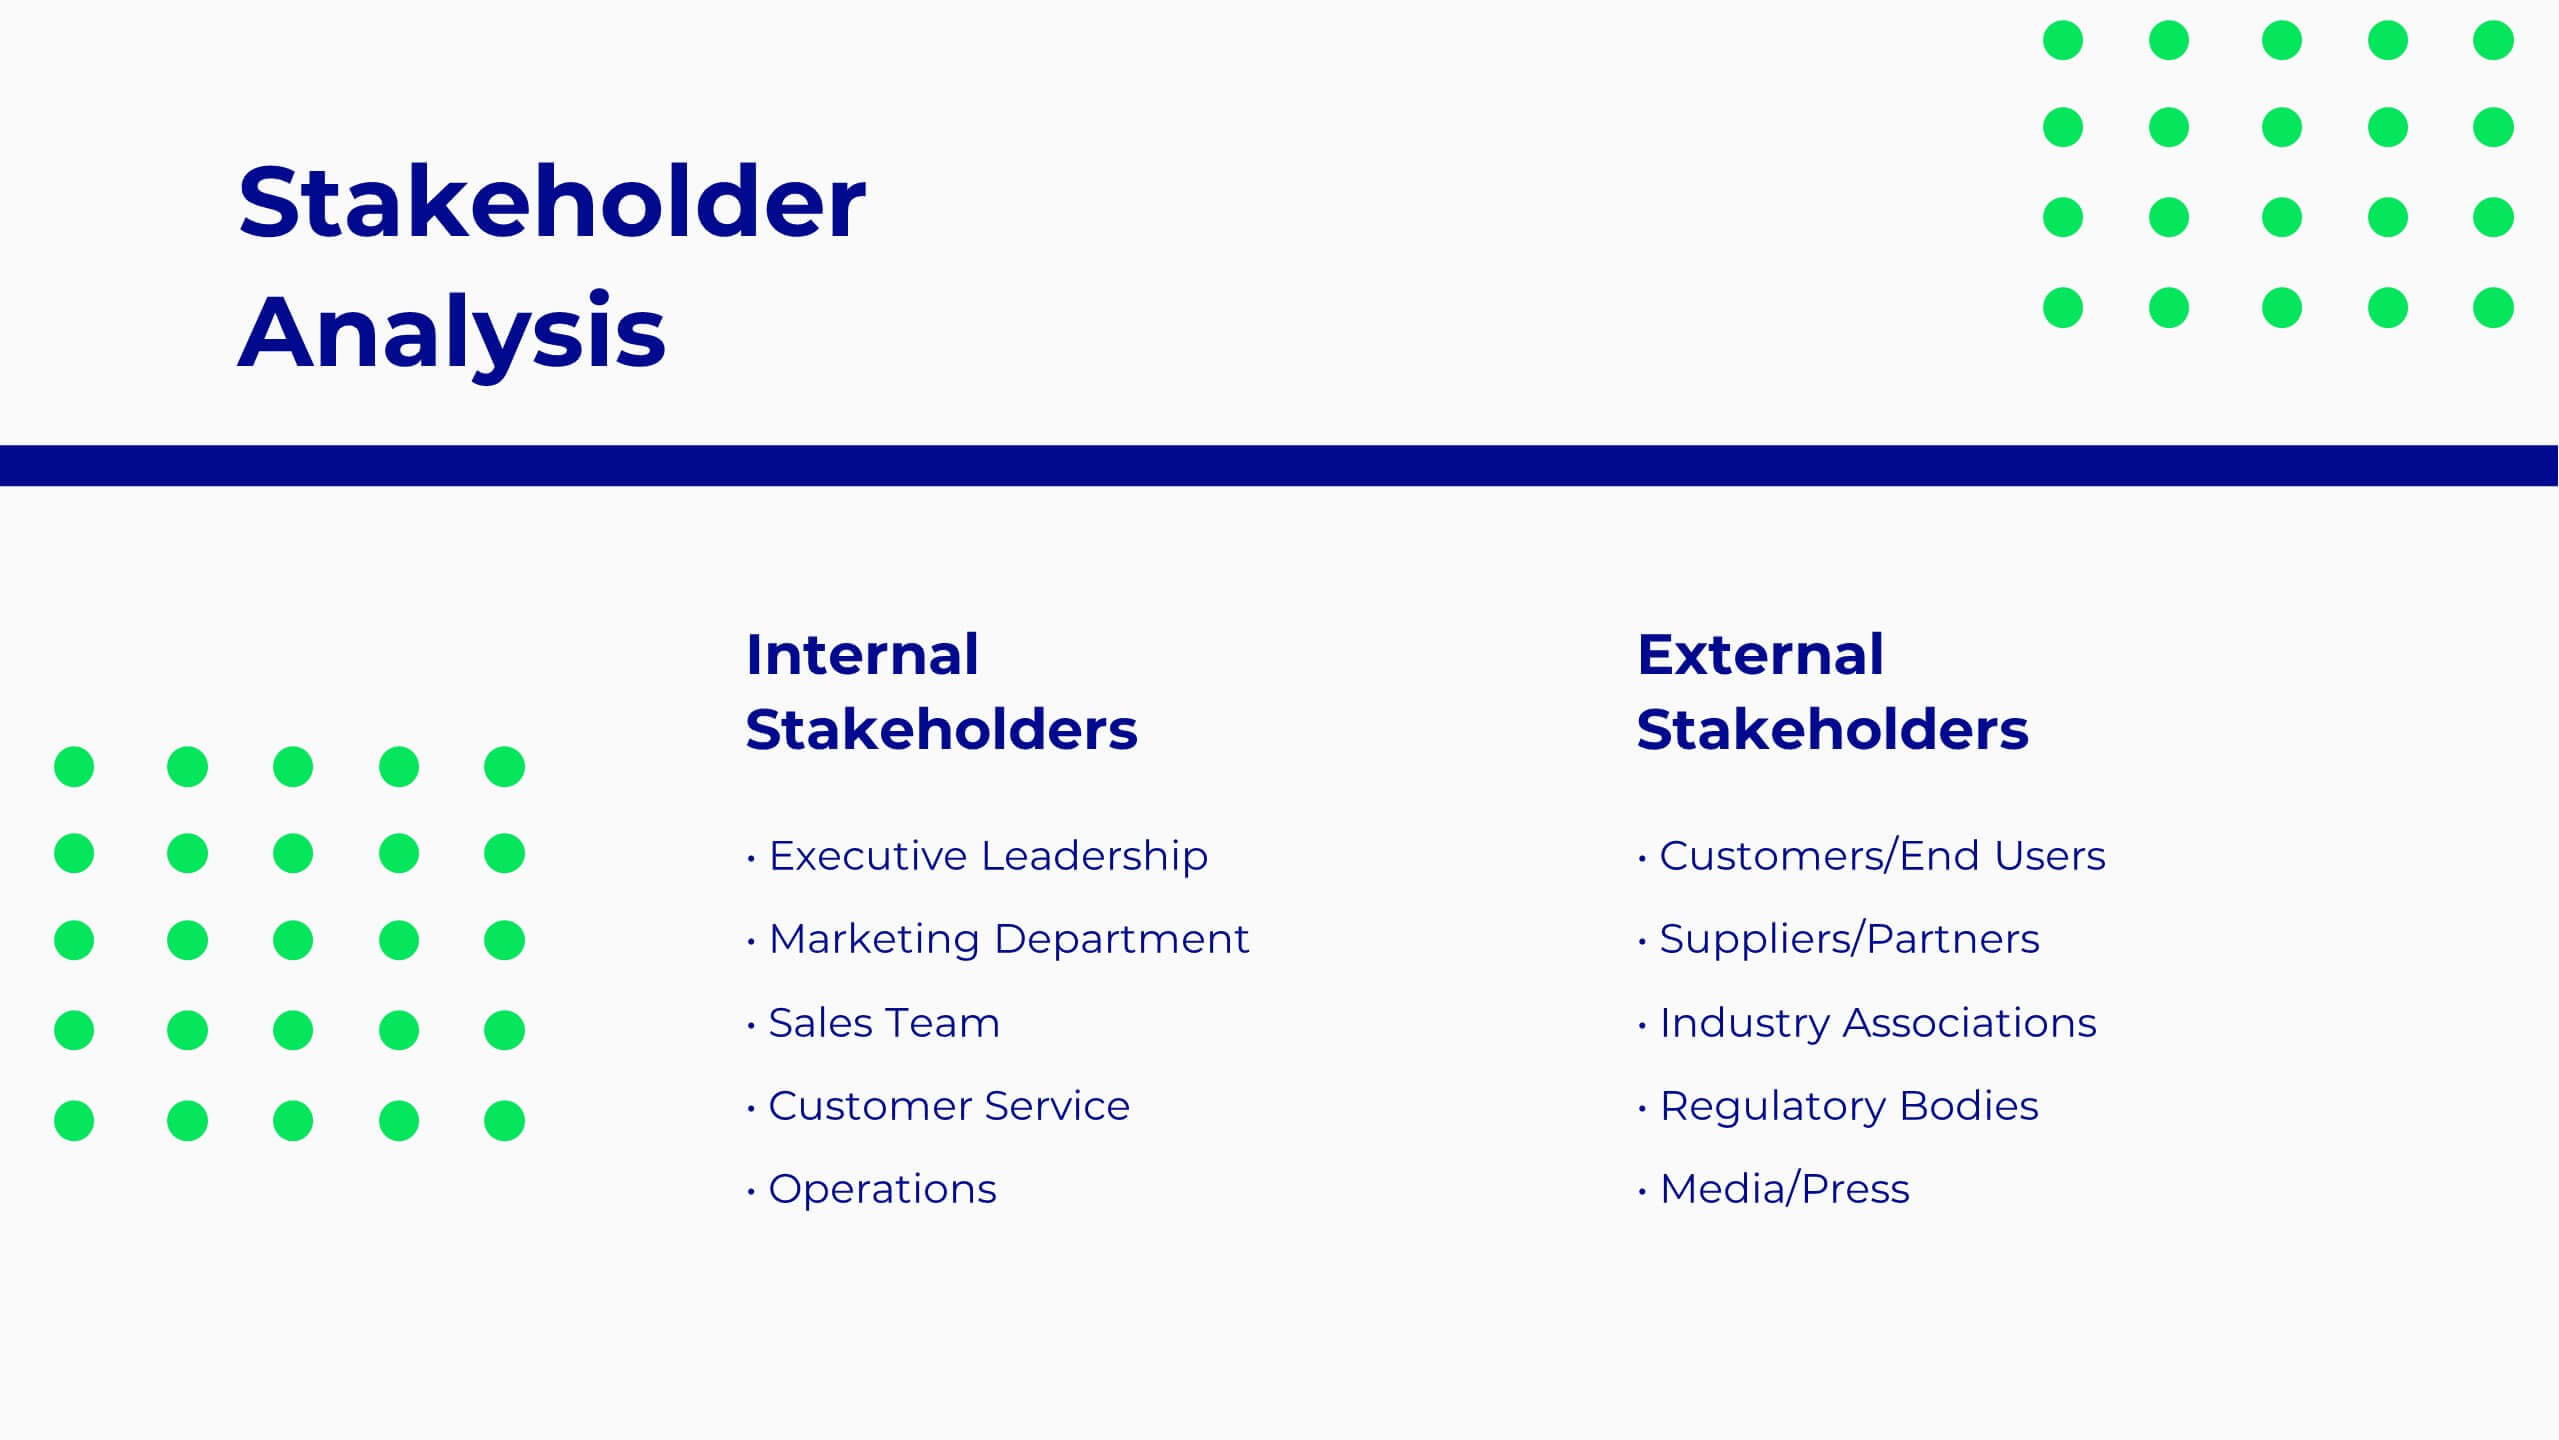
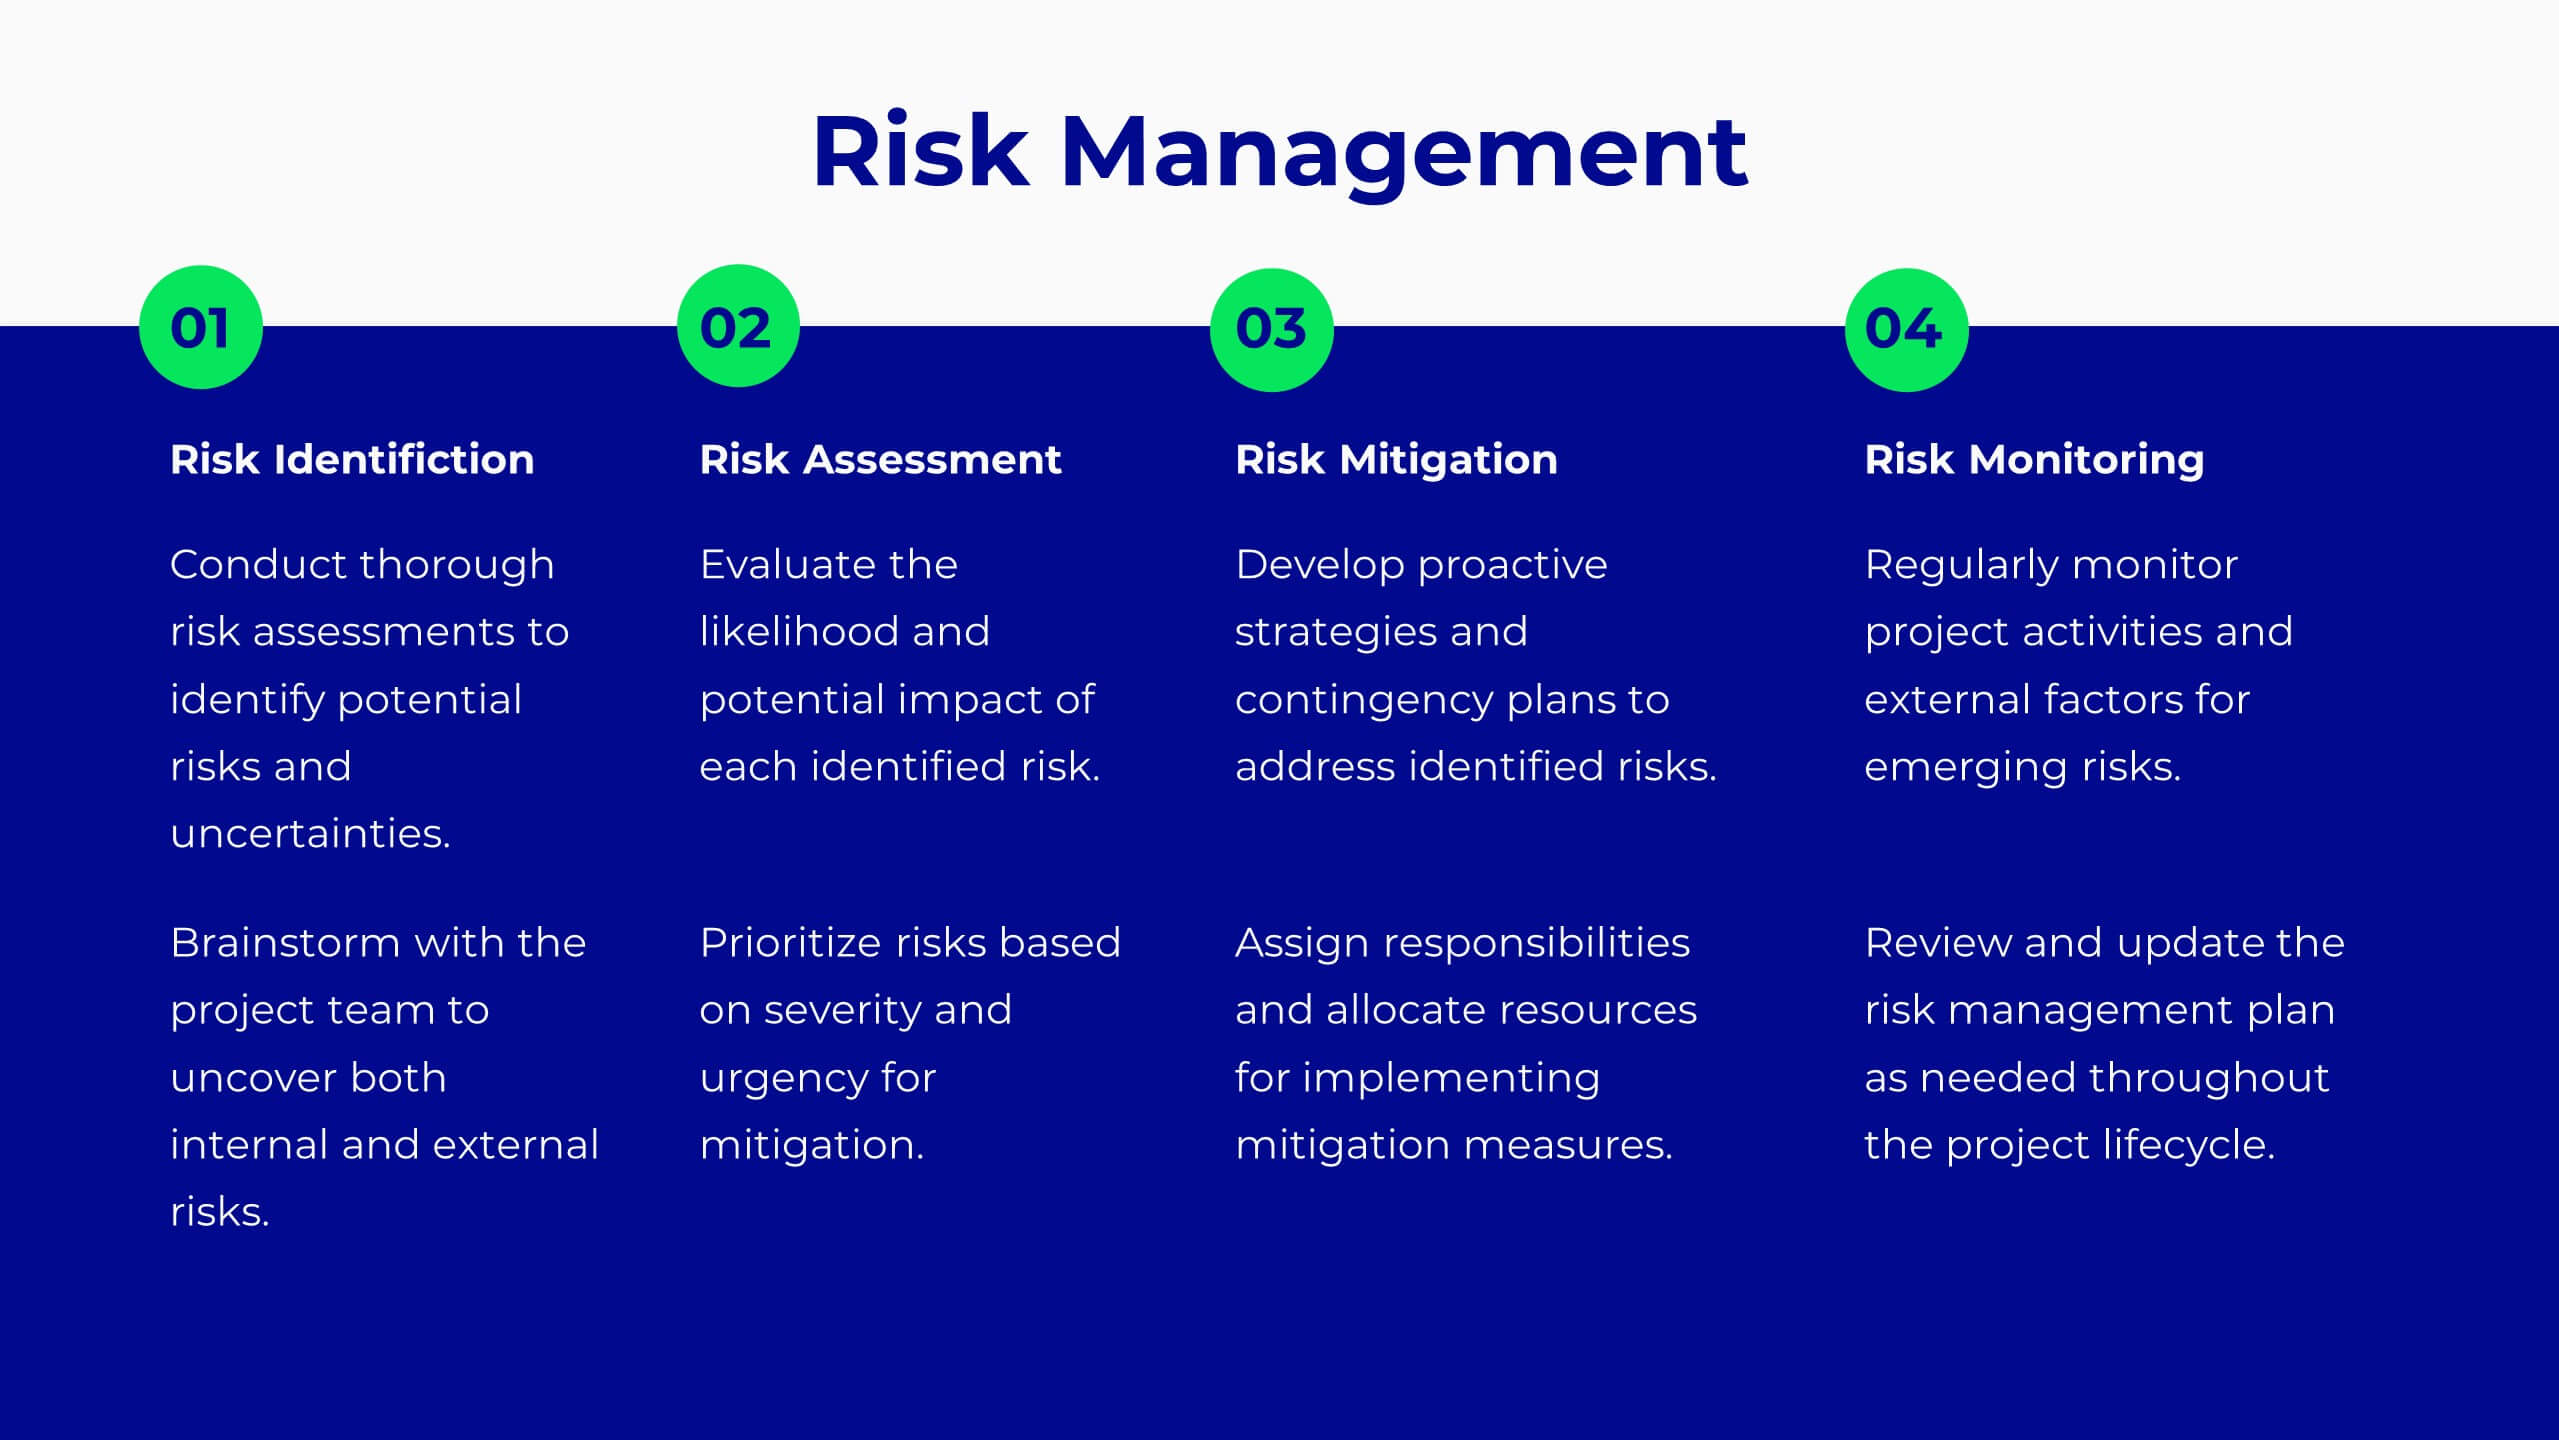
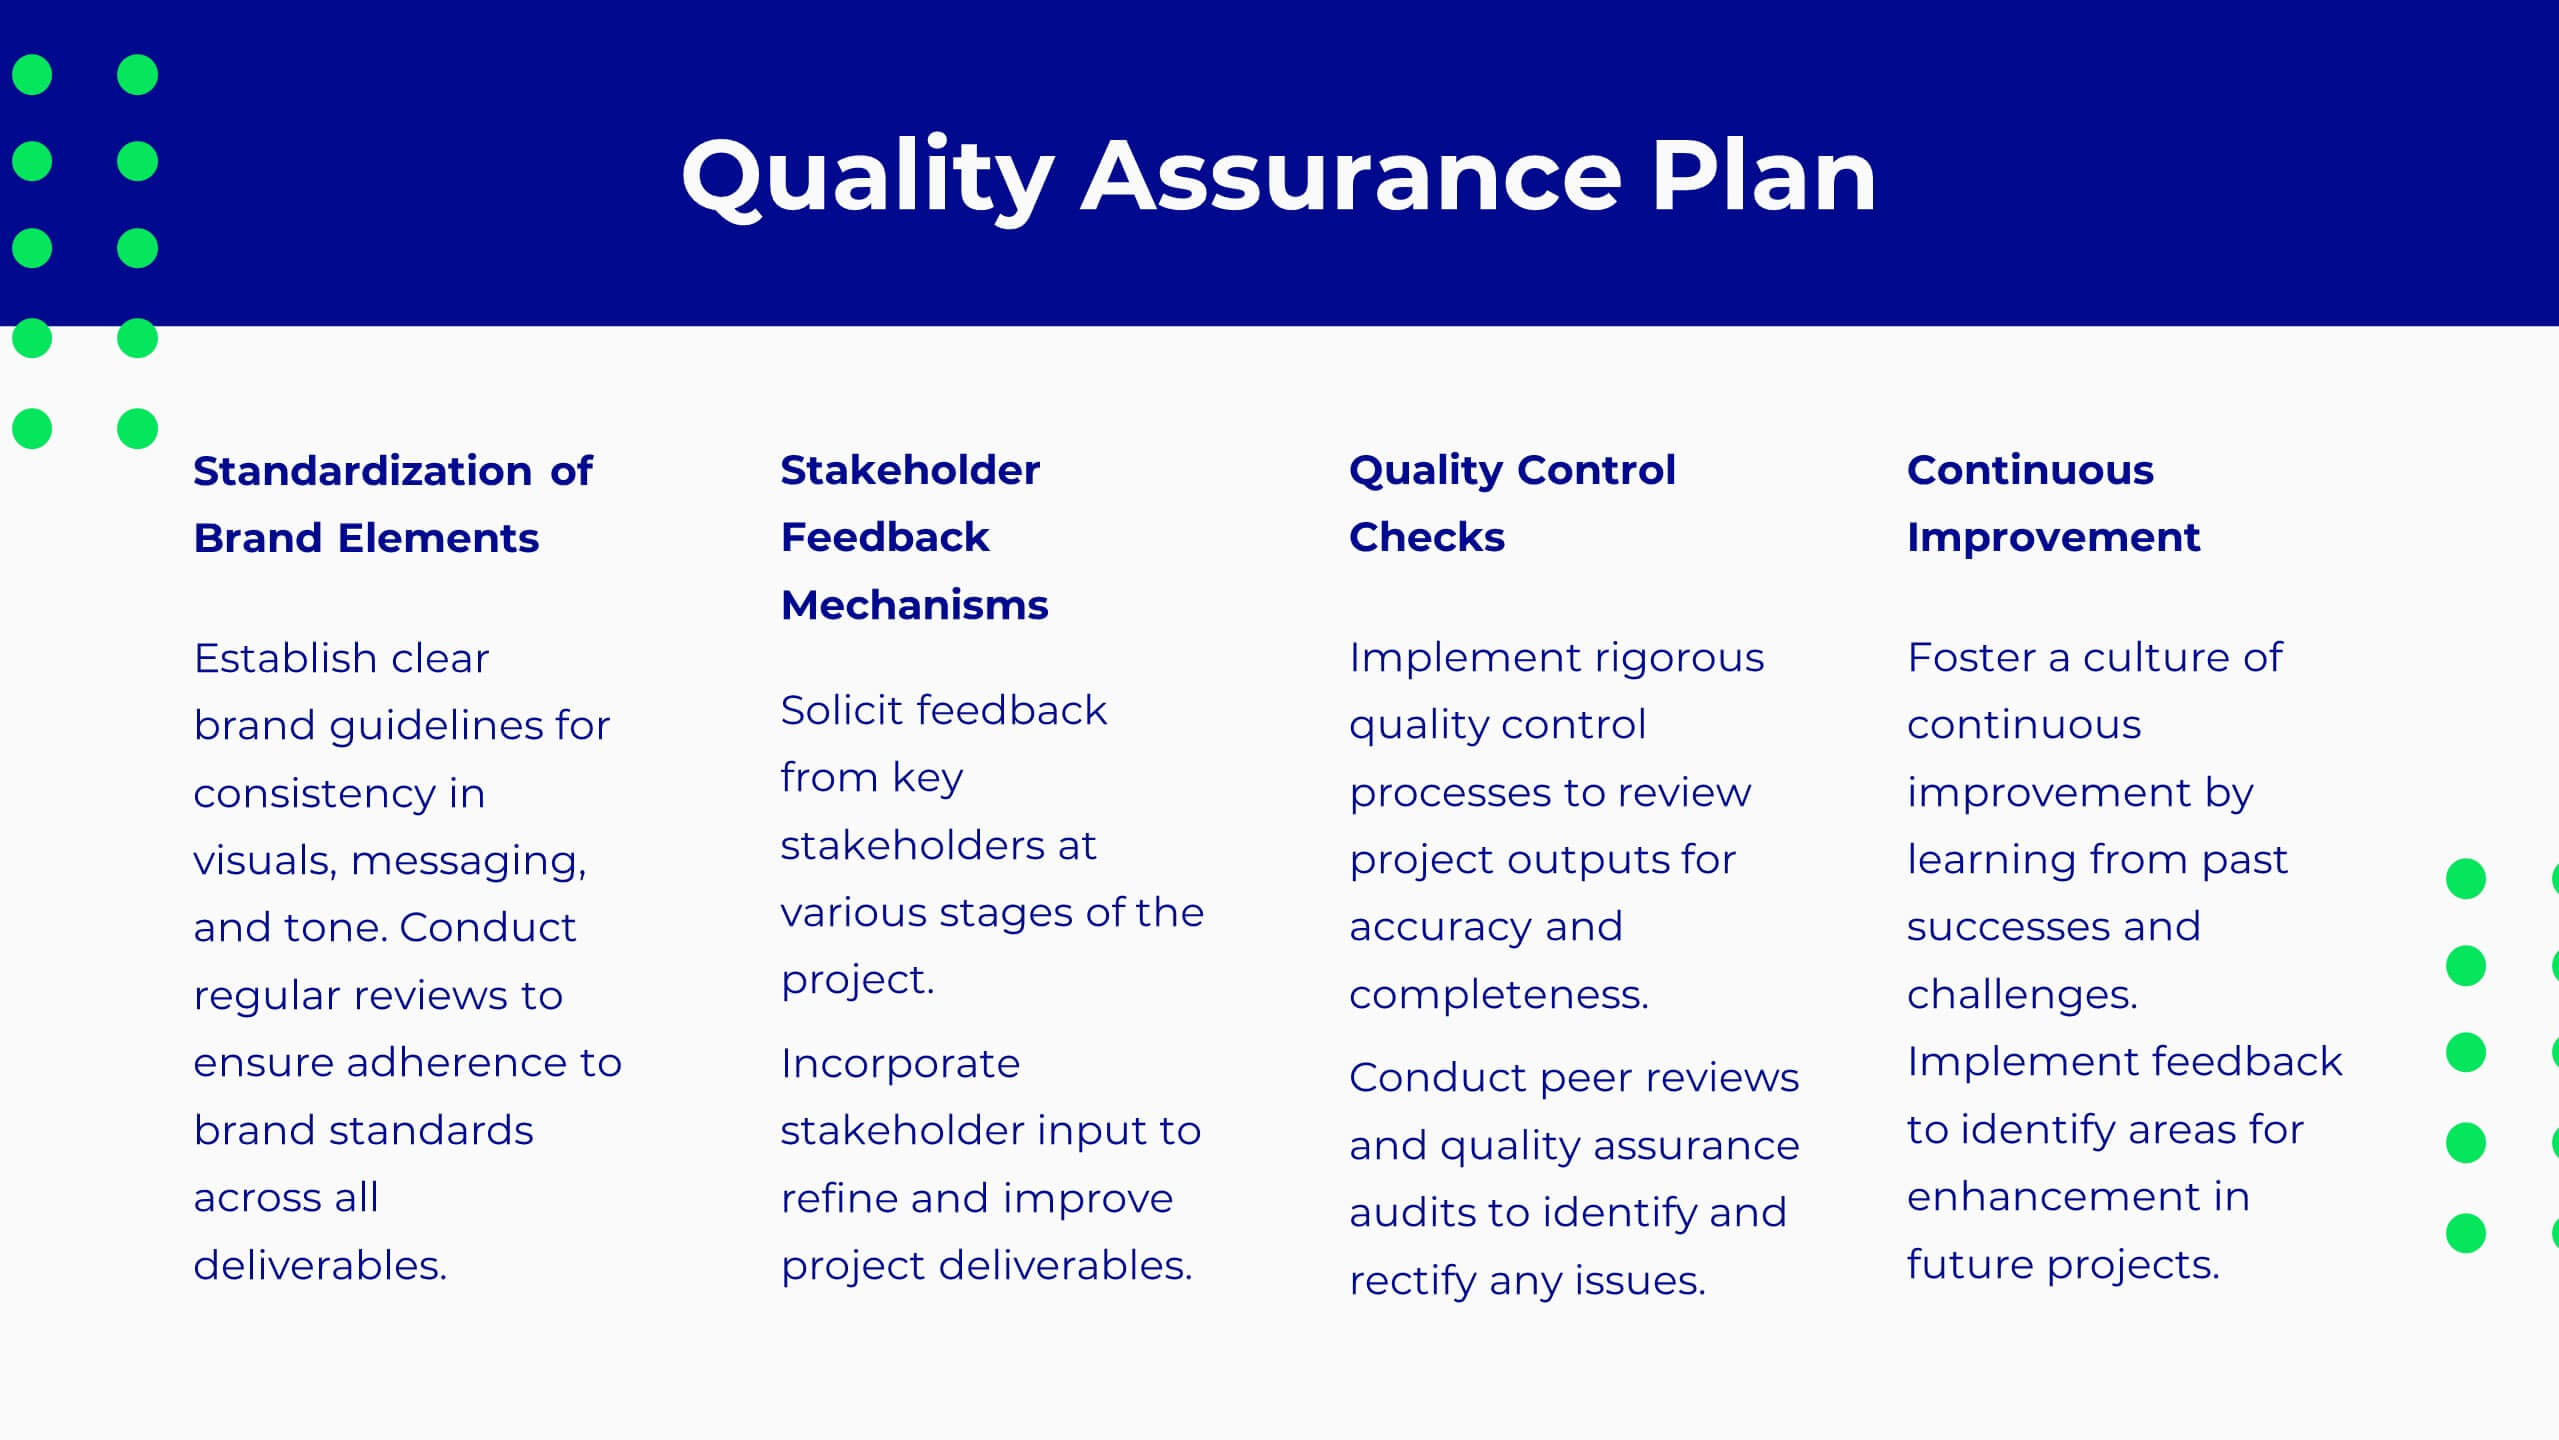
Pulse Project Milestones Report Presentation
Present project milestones effectively with this sleek, professional template. Cover project overview, timeline, and budget. Perfect for defining objectives, scope of work, and resource allocation. Highlight team introductions and stakeholder analysis. Ensure quality with risk management and assurance plans. Compatible with PowerPoint, Keynote, and Google Slides. Elevate your presentations today!


6 diapositivas
Workload Distribution and Calendar Plan Presentation
Stay on top of weekly responsibilities with the Workload Distribution and Calendar Plan Presentation. This visual planning template helps teams clearly assign tasks across days of the week, making it easy to organize schedules and boost productivity. Fully editable in PowerPoint, Keynote, and Google Slides.


5 diapositivas
Market Growth Strategies in North America Map Presentation
Unveil regional growth opportunities with the Market Growth Strategies in North America Map template, which provides a strategic layout for presenting business growth metrics across various regions.This template includes data-driven graphs to visualize performance and strategy deployment effectively. It's designed to aid professionals in making informed decisions and is compatible with PowerPoint, Keynote, and Google Slides.


6 diapositivas
Annual Budget Forecast Template Presentation
Plan smarter and present your financial goals with precision using this clean, data-driven layout. Designed to visualize yearly spending, savings, and projections, this template helps teams clearly communicate performance and future targets. Perfect for finance reports or business reviews, it’s fully compatible with PowerPoint, Keynote, and Google Slides for effortless customization.


22 diapositivas
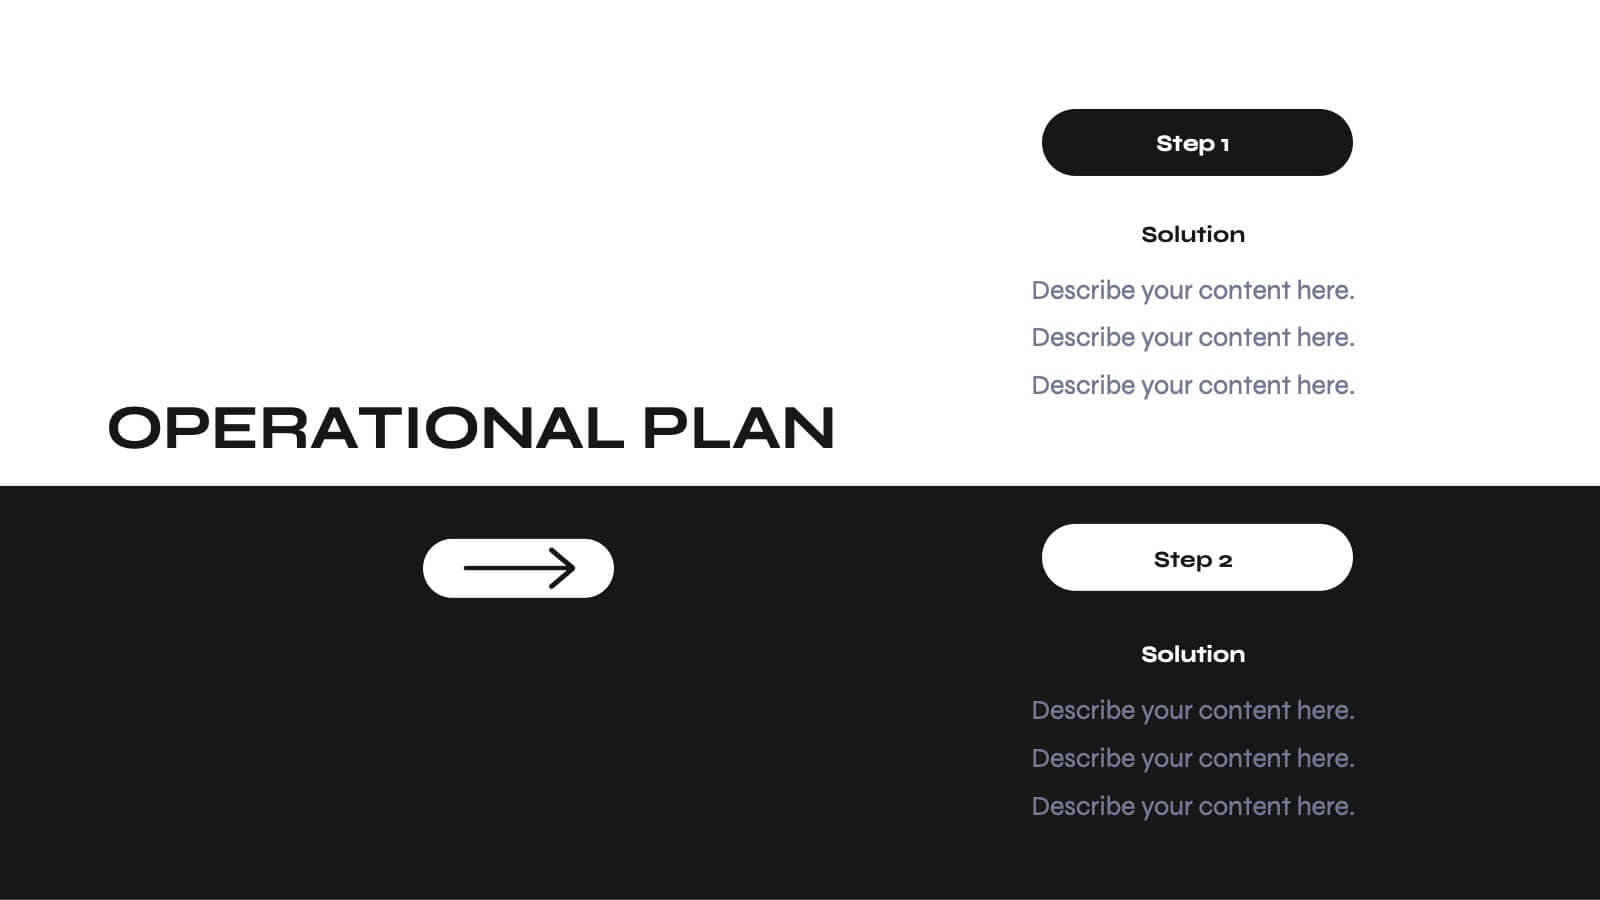
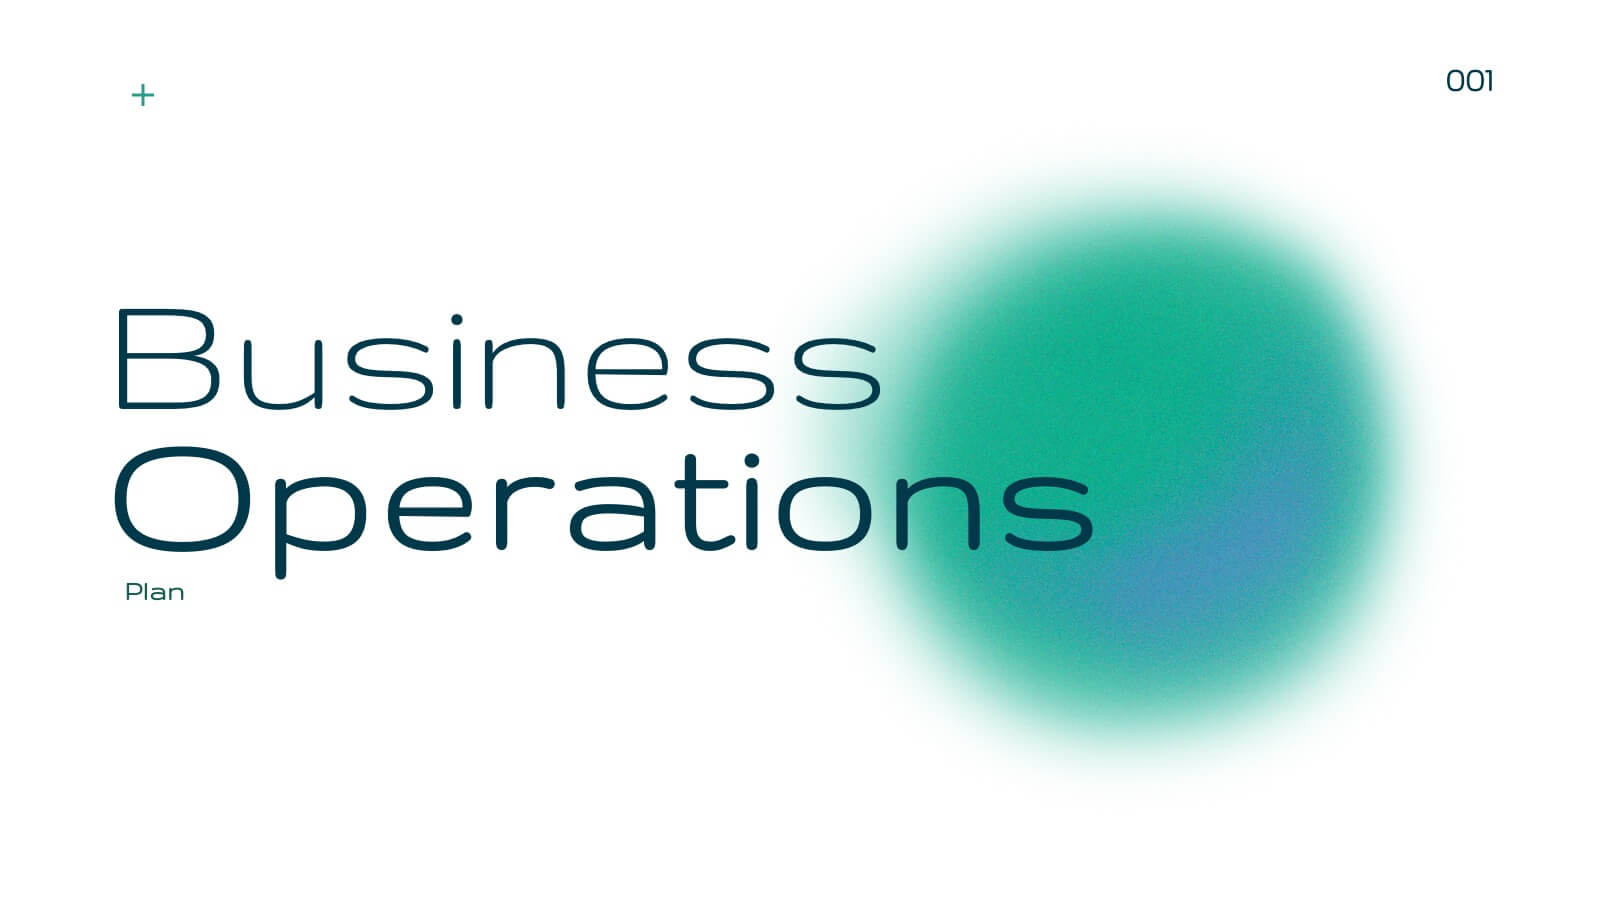
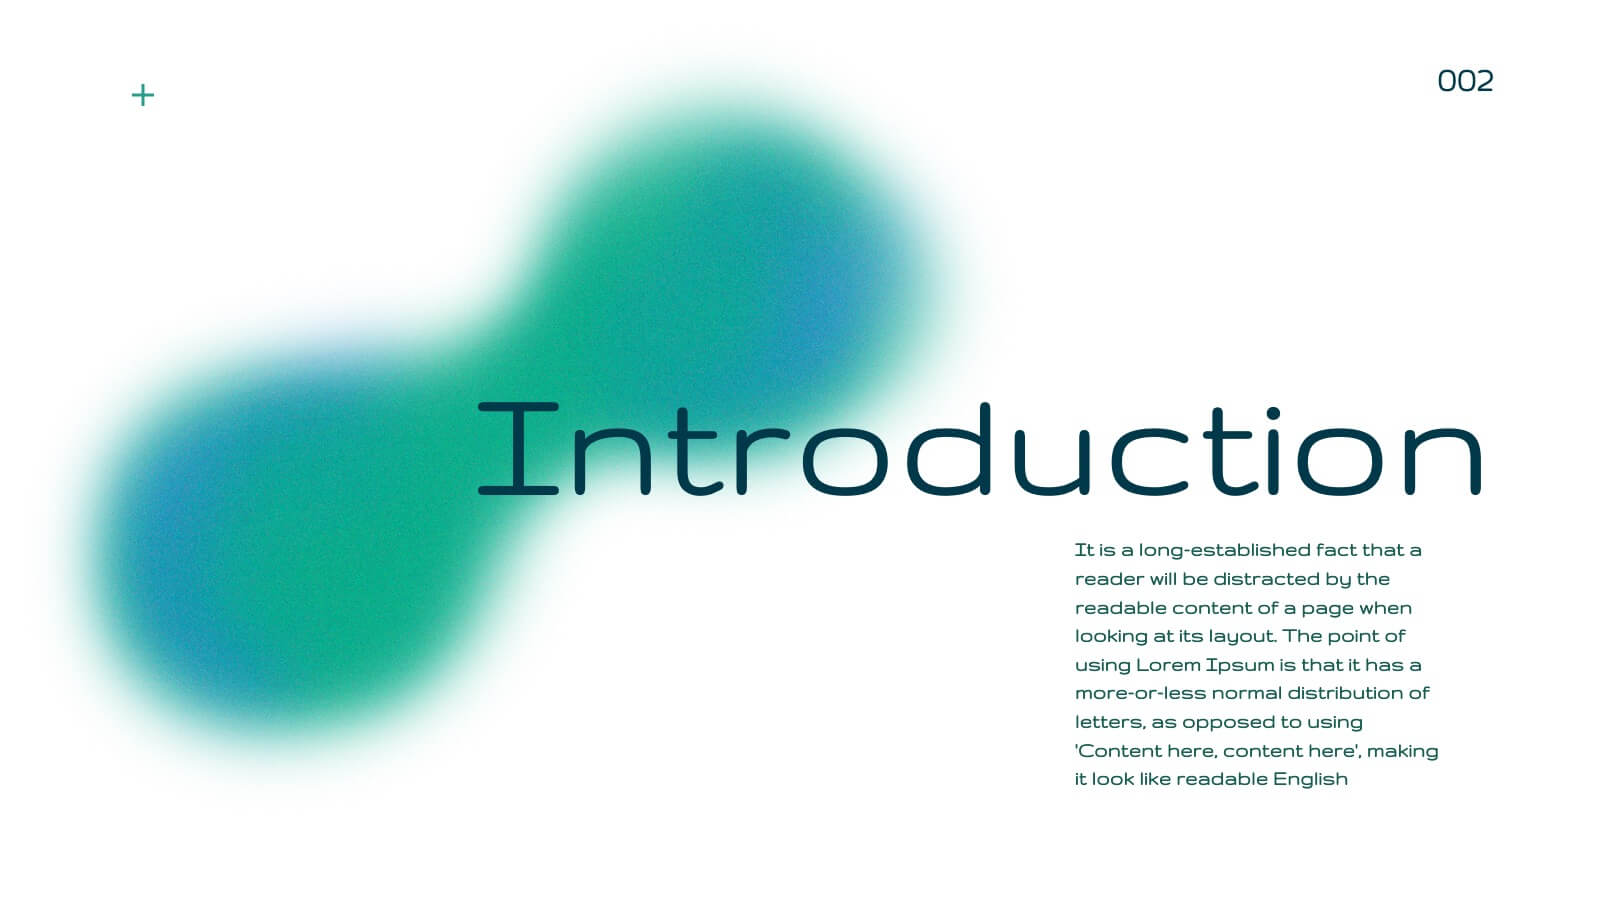
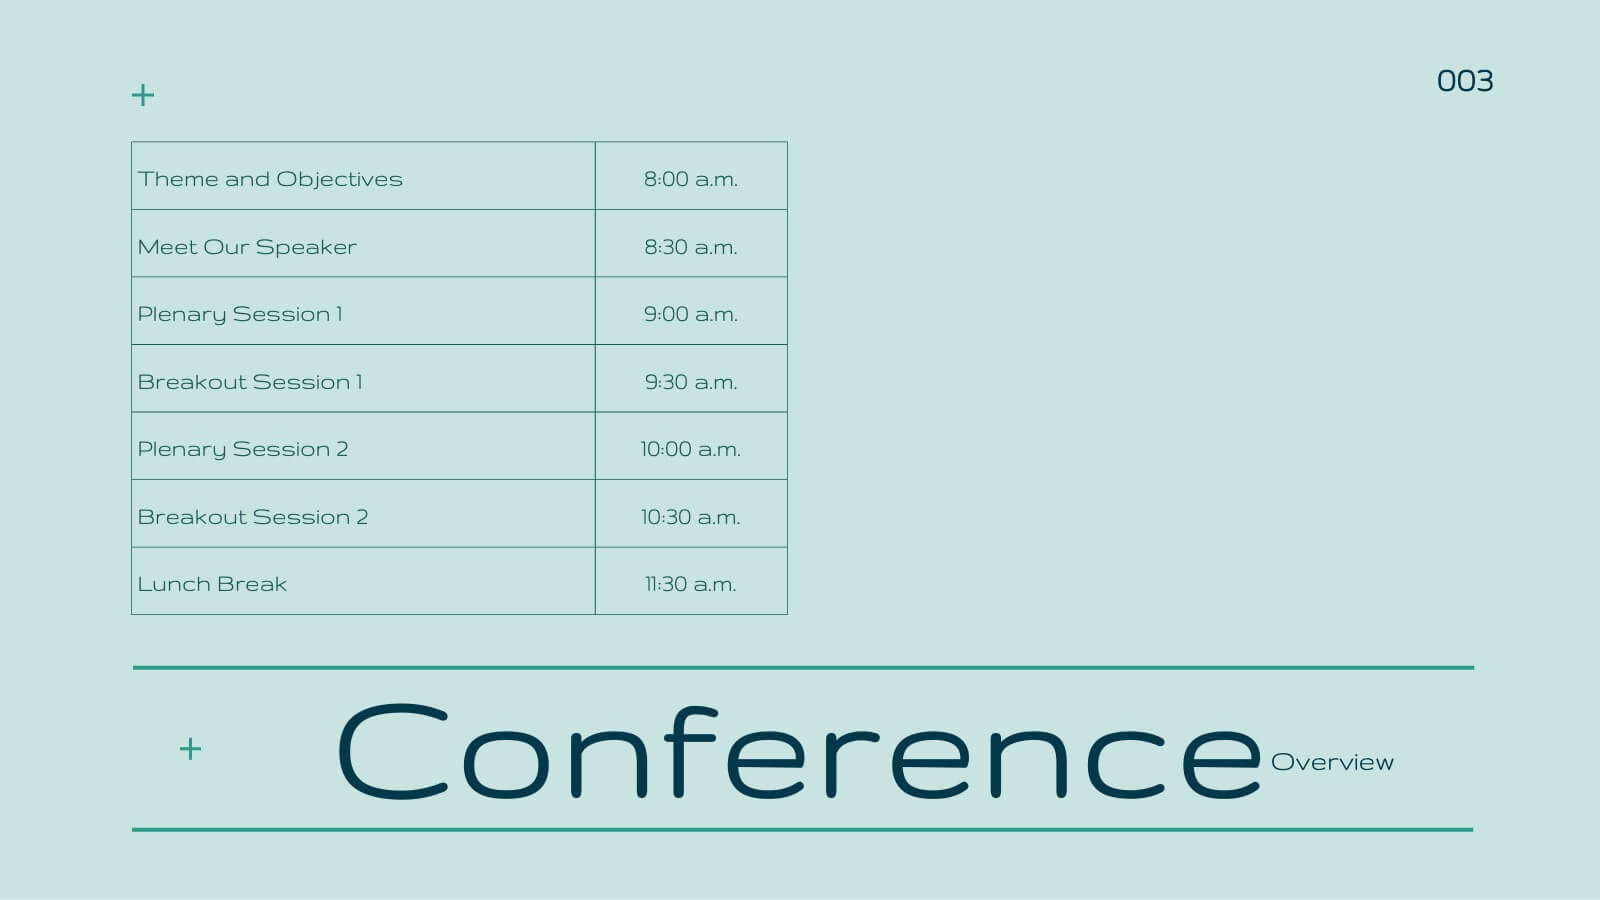
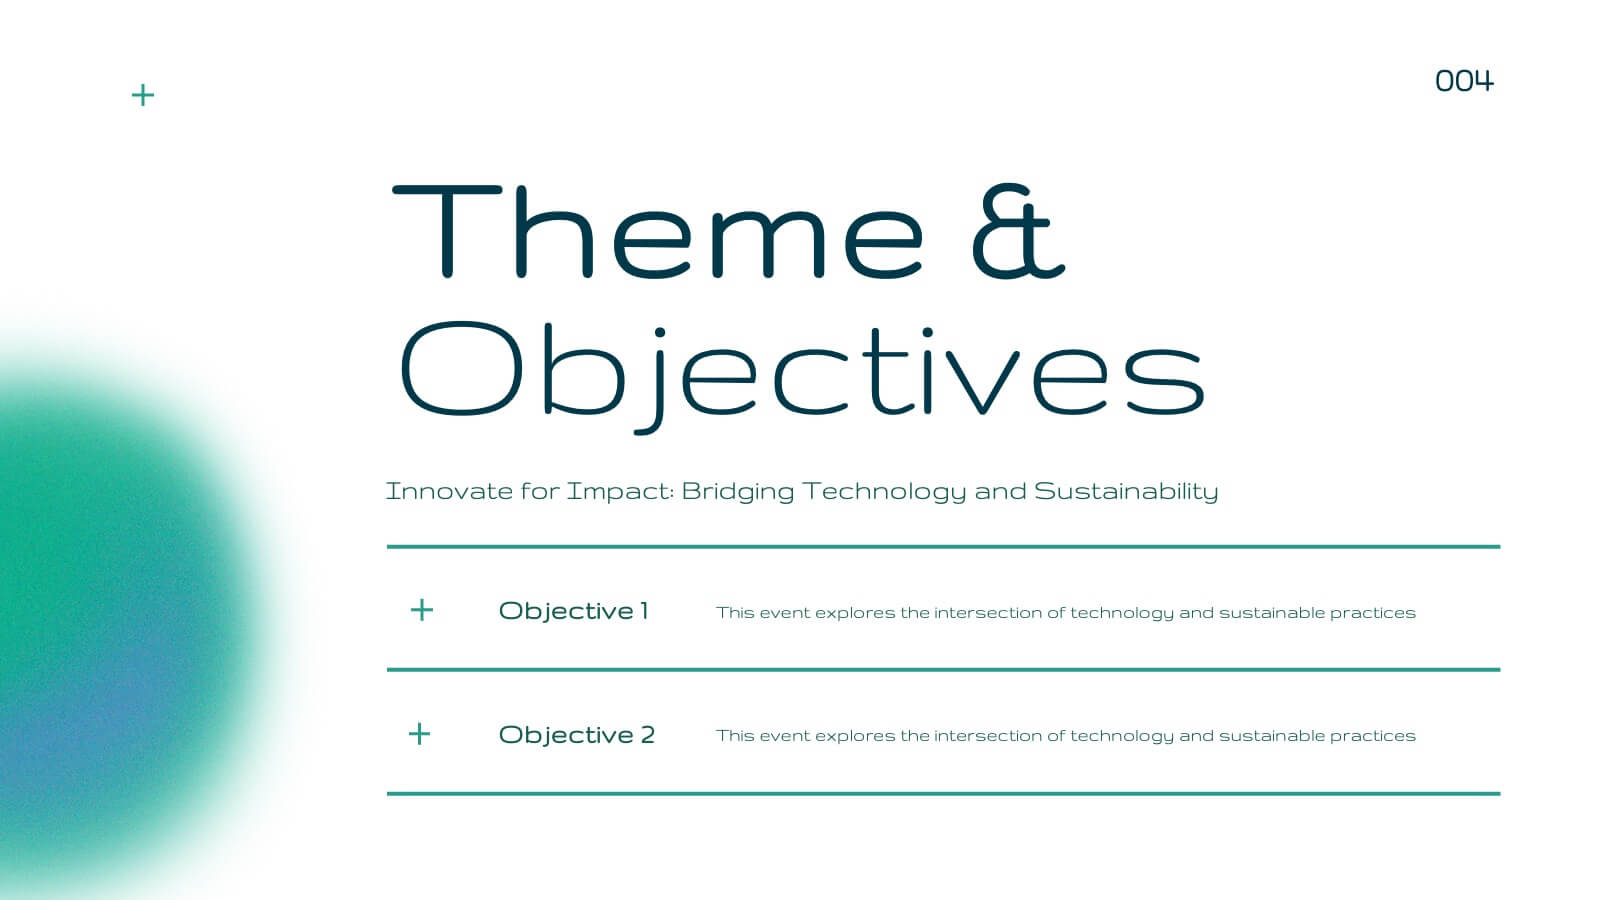
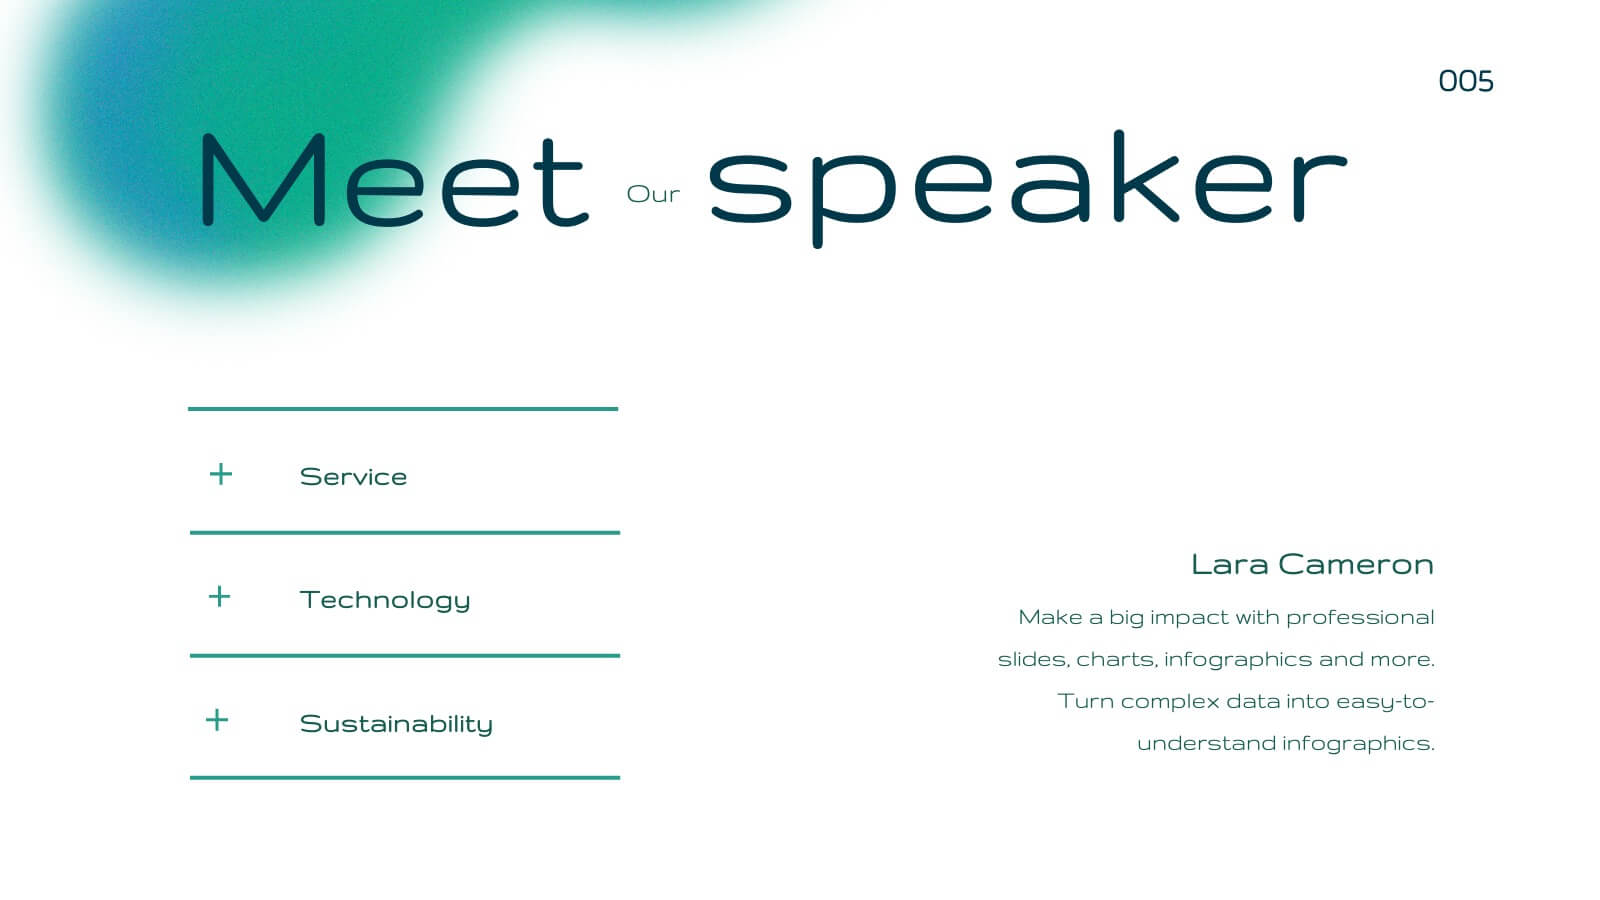
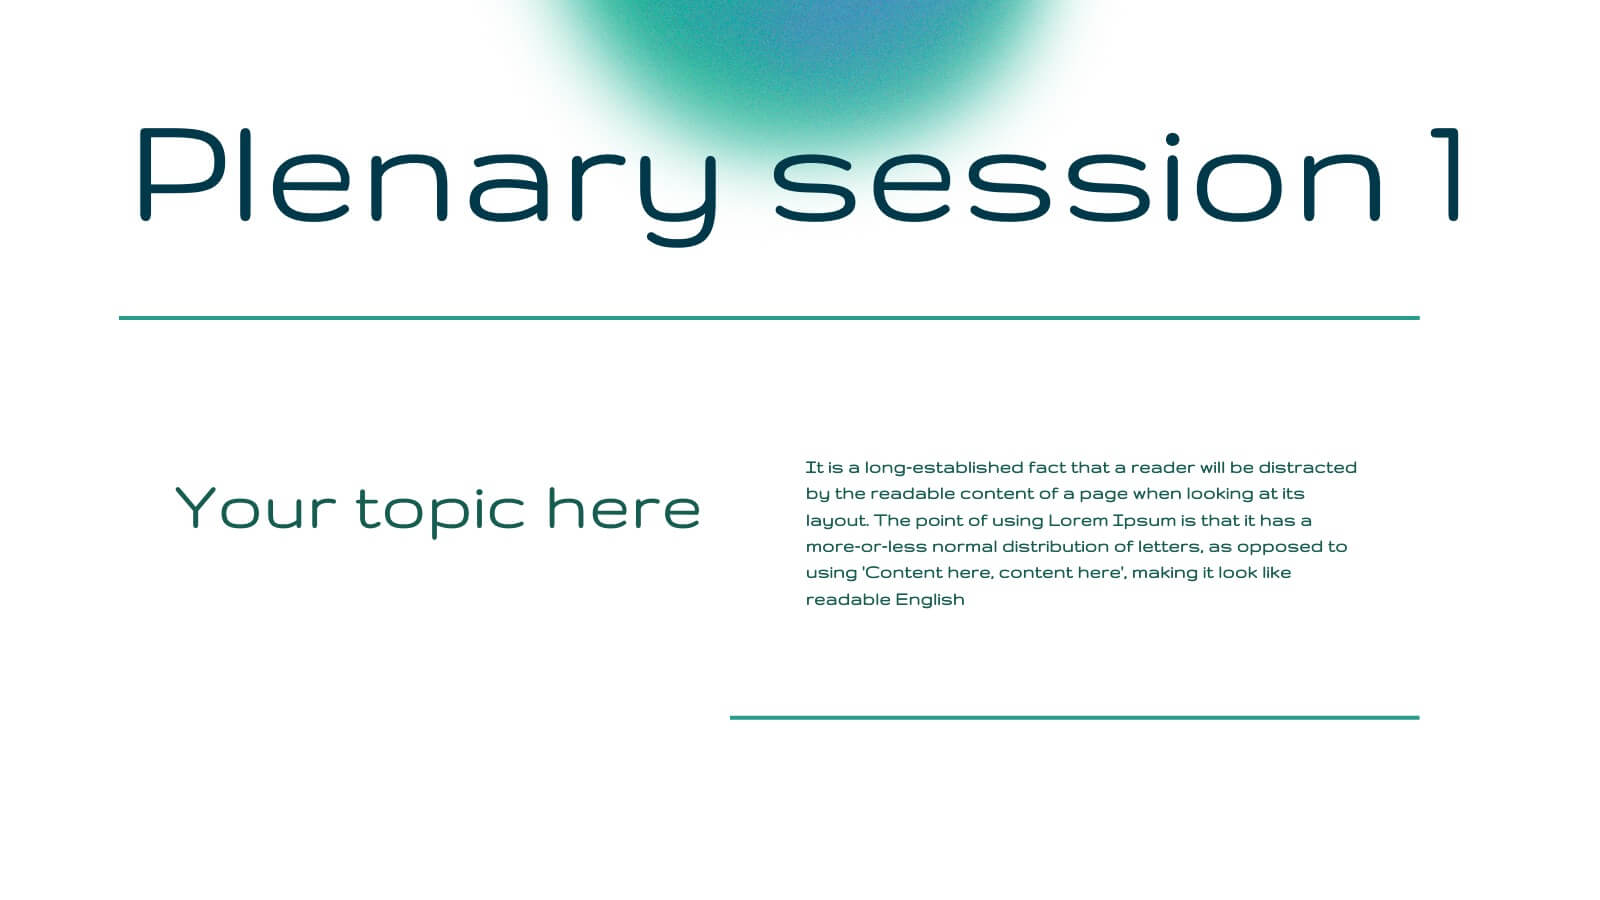
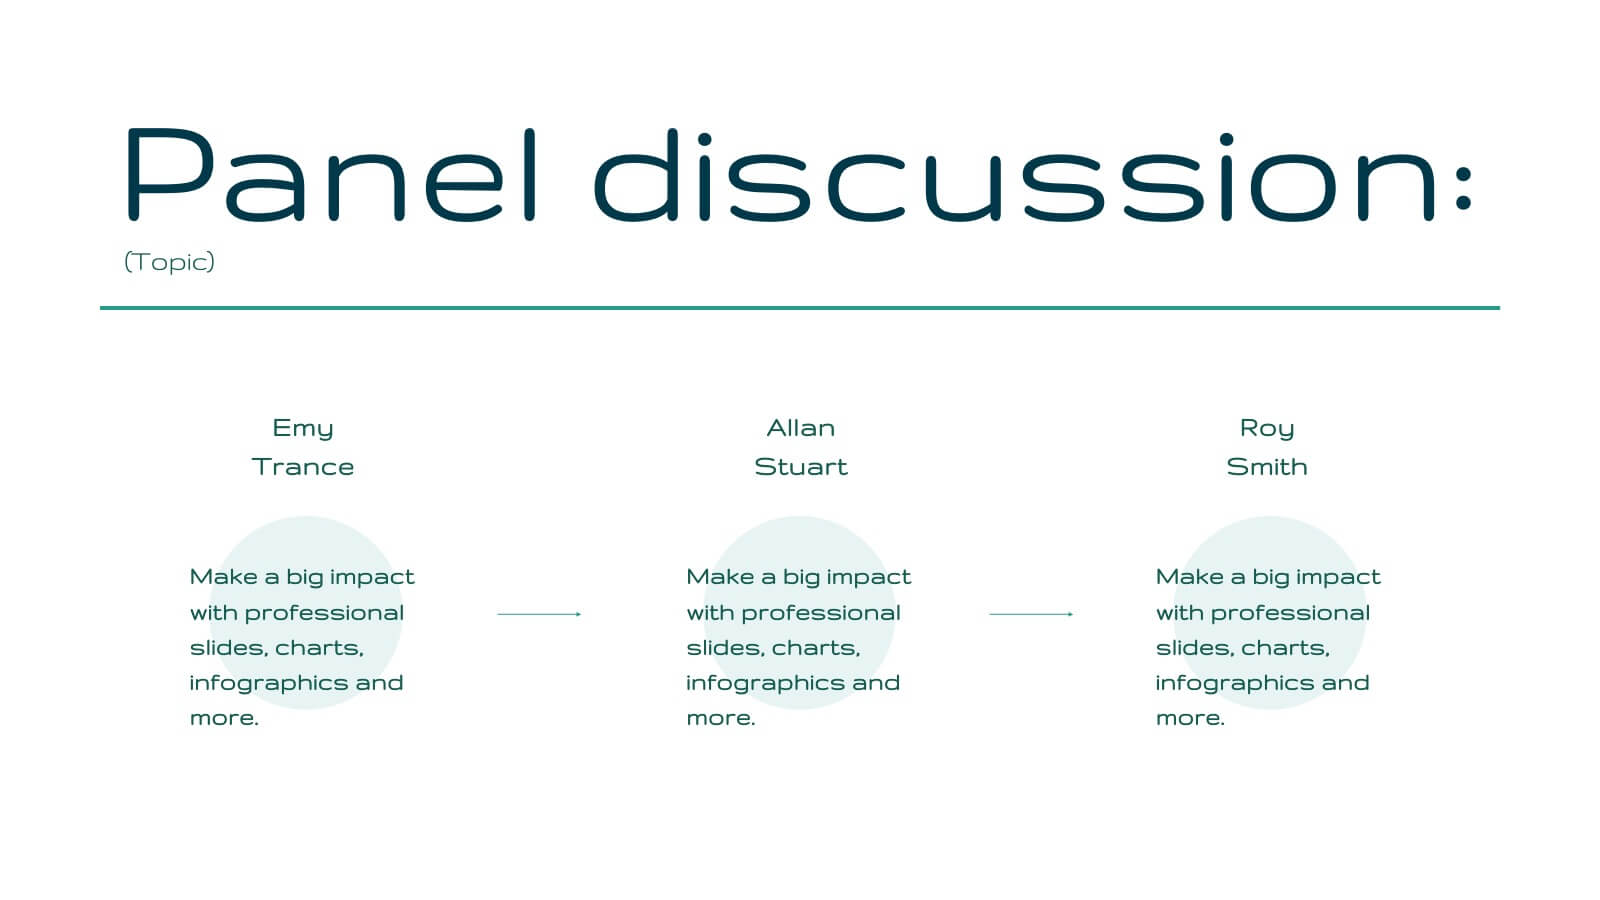
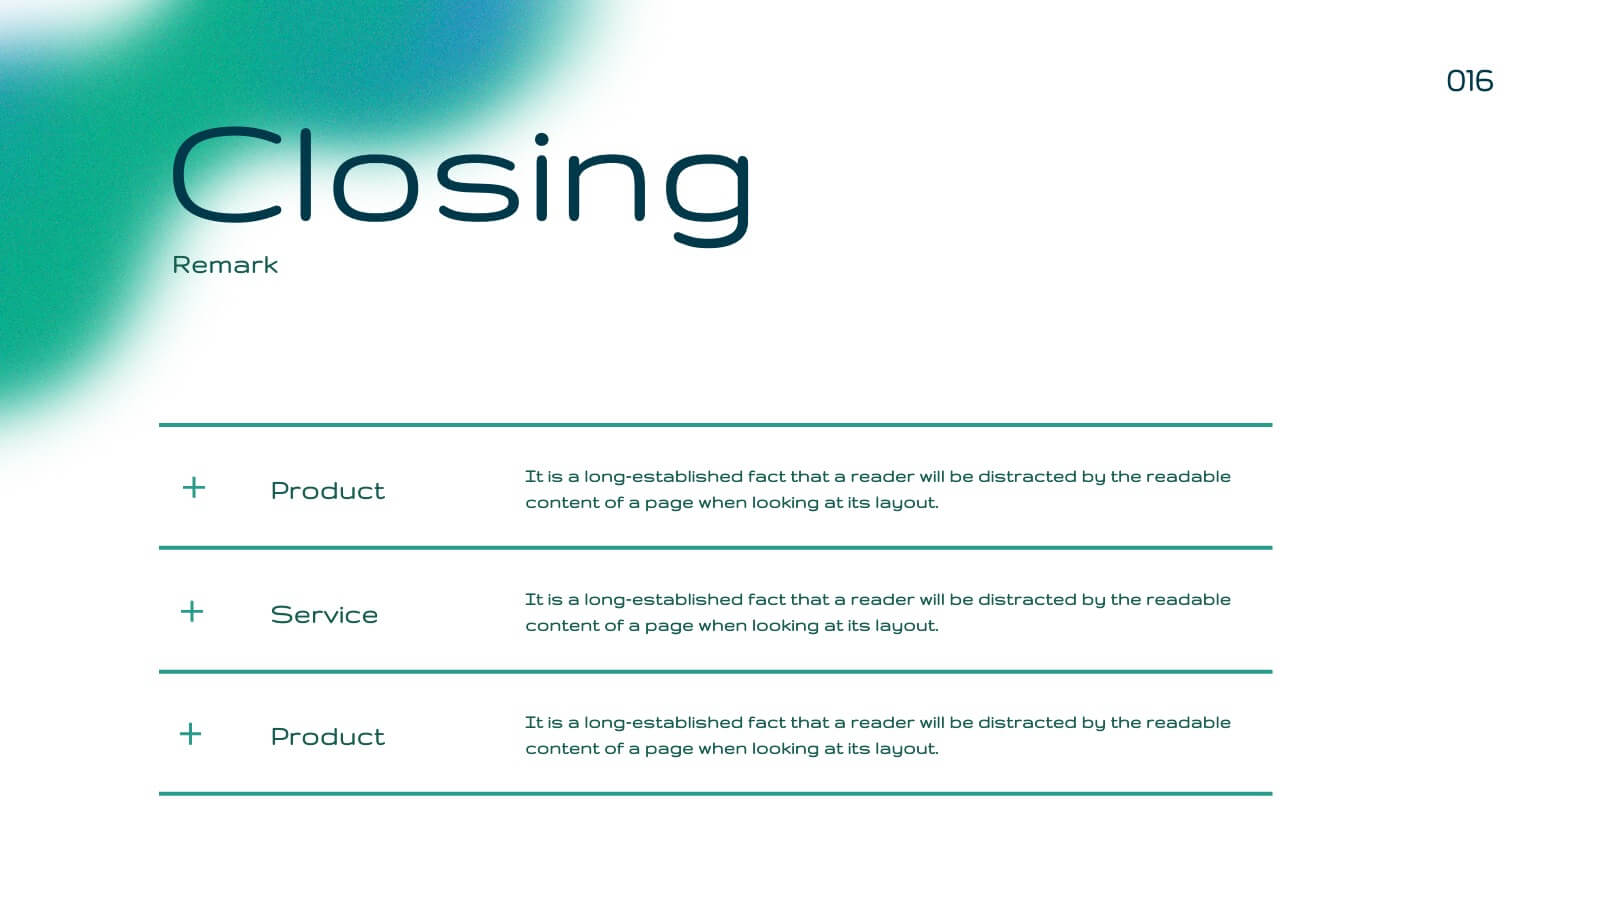
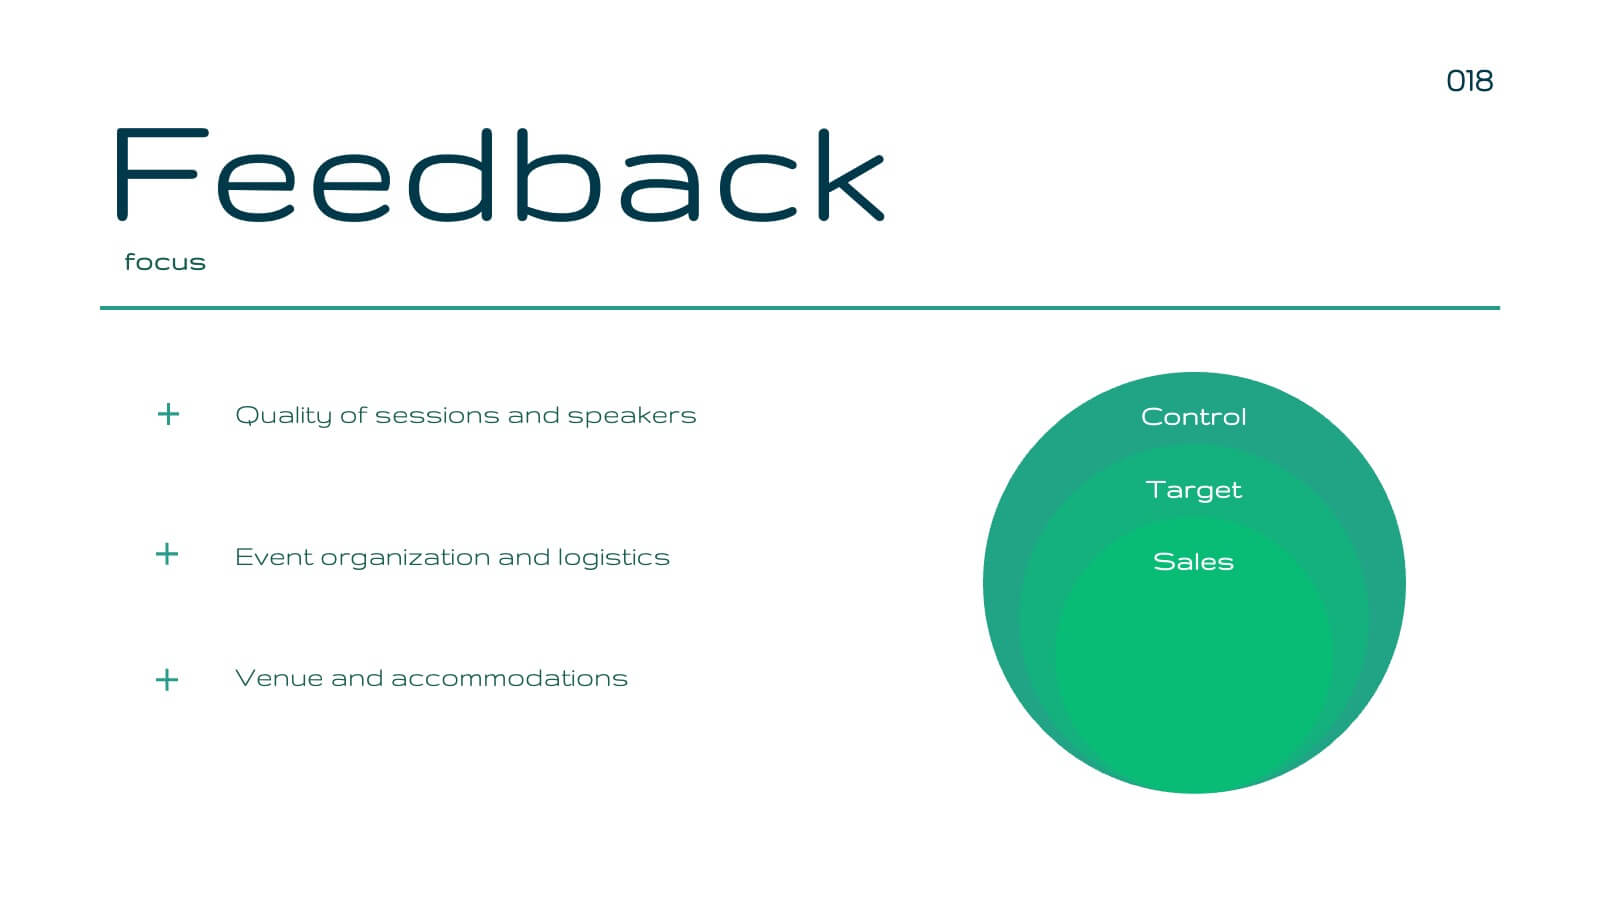
Blaze Business Operations Plan Presentation
Elevate your business presentations with this elegant, modern template designed for comprehensive business operations. Perfect for covering themes, objectives, workshops, and panel discussions, it ensures a professional and engaging delivery. The clean design and structured layout enhance clarity and impact. Compatible with PowerPoint, Keynote, and Google Slides, it’s versatile for any platform.


6 diapositivas
Creative Interior Design Portfolio Showcase Presentation
Showcase your creativity with the Creative Design Portfolio Showcase presentation. This template is perfect for graphic designers, architects, and creative professionals looking to display their work in a visually compelling format. Featuring modern layouts, high-quality image placeholders, and structured text sections, it allows for easy customization to highlight key insights. Fully compatible with PowerPoint, Keynote, and Google Slides.


8 diapositivas
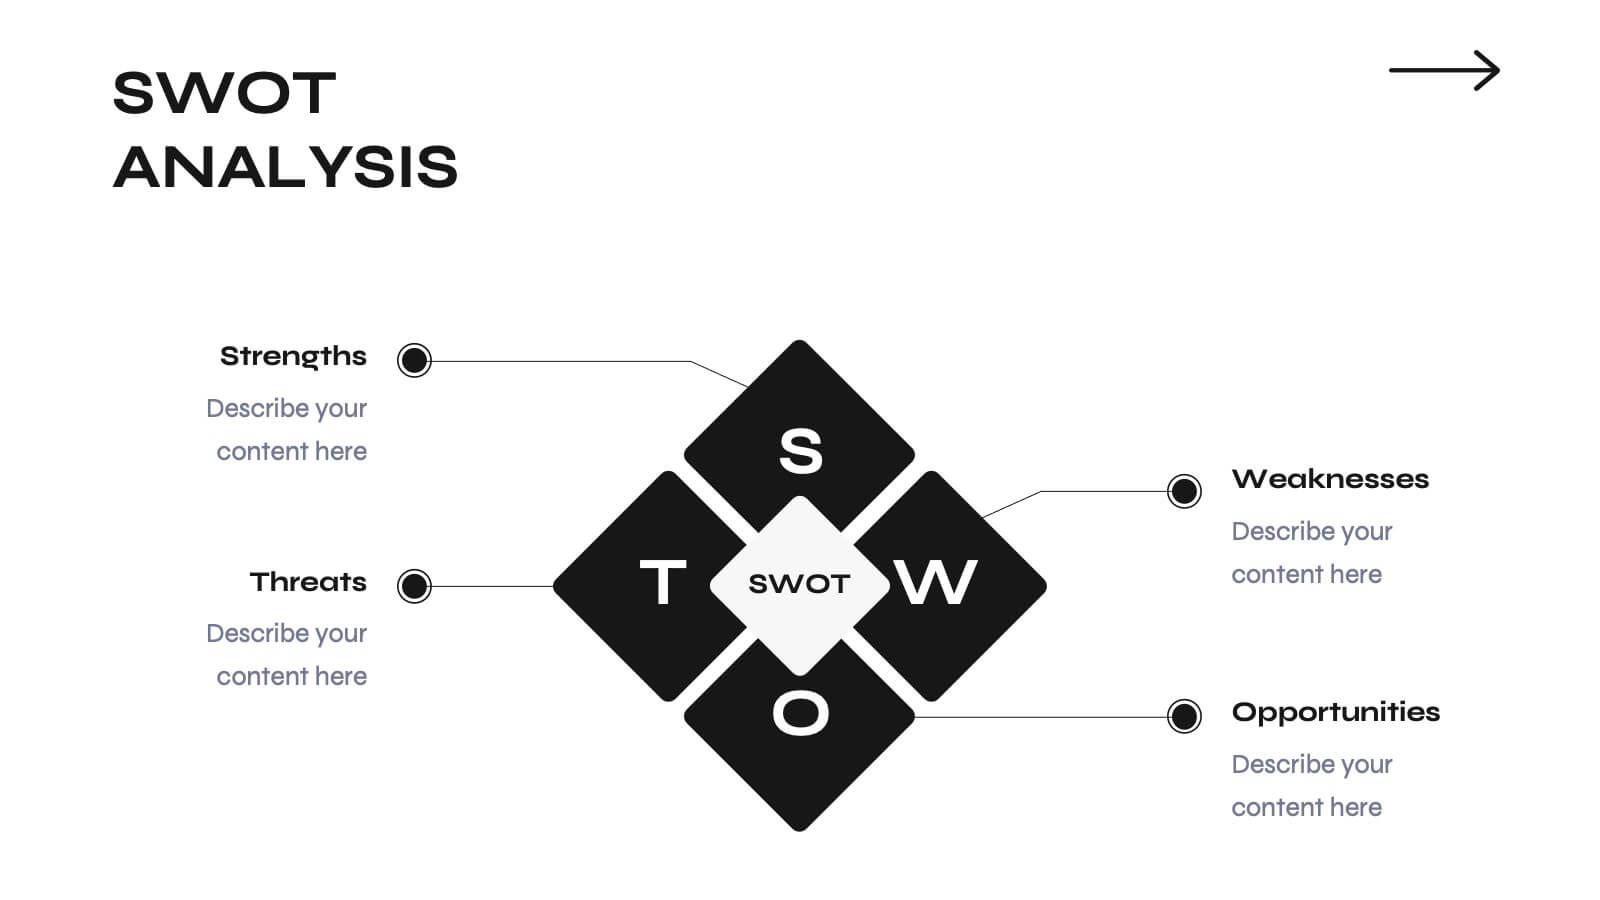
SWOT-Based Competitive Analysis
Clearly map your organization’s strengths, weaknesses, opportunities, and threats with this dynamic infographic layout. Ideal for strategic planning sessions, this template uses a continuous loop to show interconnection between internal and external factors. Fully editable in PowerPoint, Keynote, and Google Slides.


4 diapositivas
Economic Impact on Stock Market
Visualize financial cause and effect with this step-by-step economic impact infographic. Ideal for explaining market trends, policy changes, or fiscal outcomes, this slide uses a four-part arrow path starting with a money bag icon. Each stage—A to D—can be customized with data and analysis. Fully editable in PowerPoint, Keynote, and Google Slides.


5 diapositivas
Empowered Leadership and Influence Strategy
Showcase impactful leadership journeys with the Empowered Leadership and Influence Strategy Presentation. This slide features a bold mountain-style layout that symbolizes growth, with five colorful peaks representing key leadership steps or principles. Perfect for professional development workshops, executive coaching, or team-building presentations. Fully editable and compatible with PowerPoint, Keynote, and Google Slides.


4 diapositivas
Pillar Strategy Framework Presentation
Turn complex strategies into clear, structured visuals with this elegant infographic design. Ideal for showcasing key principles, organizational foundations, or business frameworks, it helps communicate ideas with precision and balance. Fully customizable and compatible with PowerPoint, Keynote, and Google Slides for effortless editing and professional results.


5 diapositivas
Corporate Annual Report Insights Presentation
Showcase Your Corporate Success! The Corporate Annual Report Insights Presentation delivers financial highlights, key performance indicators, and strategic insights in a structured, visually appealing format. Ideal for executives and stakeholders, this template ensures clarity and professionalism. Fully customizable and compatible with PowerPoint, Keynote, and Google Slides, it enhances impactful business storytelling.


7 diapositivas
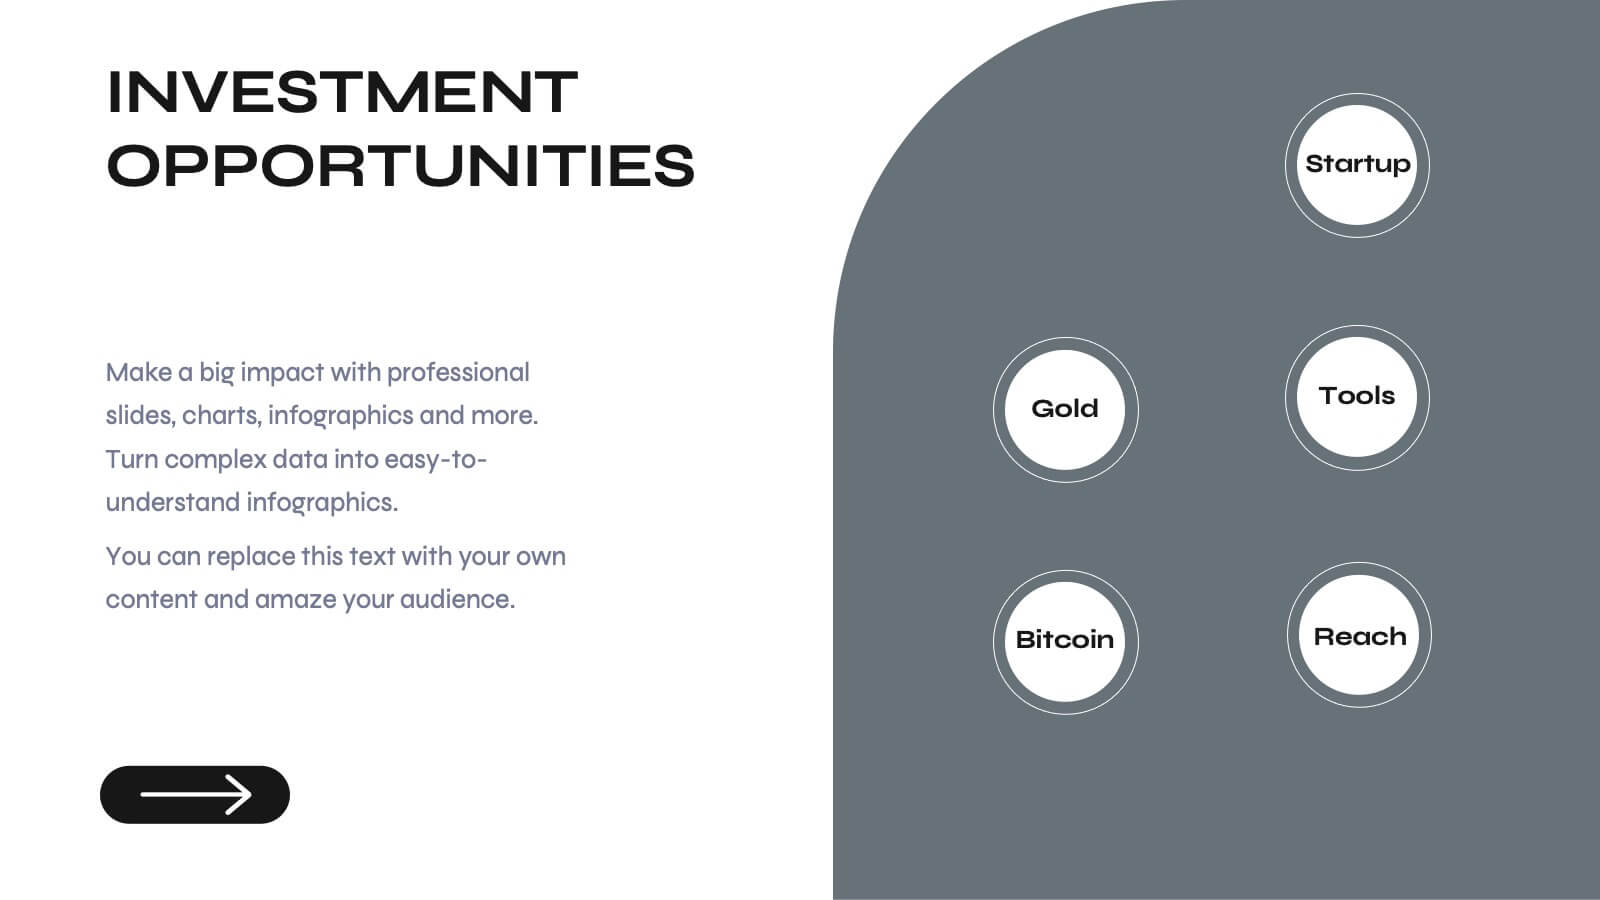
Market Research Data Insights
Present insights with impact using this Market Research Data Insights slide. Featuring six circular data points with icons and space for strategic commentary, it's ideal for showcasing key findings, trends, or survey results. Fully editable in PowerPoint, Keynote, and Google Slides for versatile use.