


Características


¿Tienes alguna pregunta?
Recomendar


7 diapositivas
Mind Map Project Infographic
A mind map is a visual representation of information, ideas, or concepts arranged around a central topic or theme. This template is a powerful brainstorming and organizational tool that helps individuals or teams visually connect related ideas, explore new connections, and see the bigger picture. This diagram organizes information around a central theme or idea, with branches extending outwards to represent related concepts or tasks. This infographic is perfect for for capturing ideas, and presenting complex information in a structured and easily manner. This template is customizable and compatible with Powerpoint, Keynote, and Google Slides.


4 diapositivas
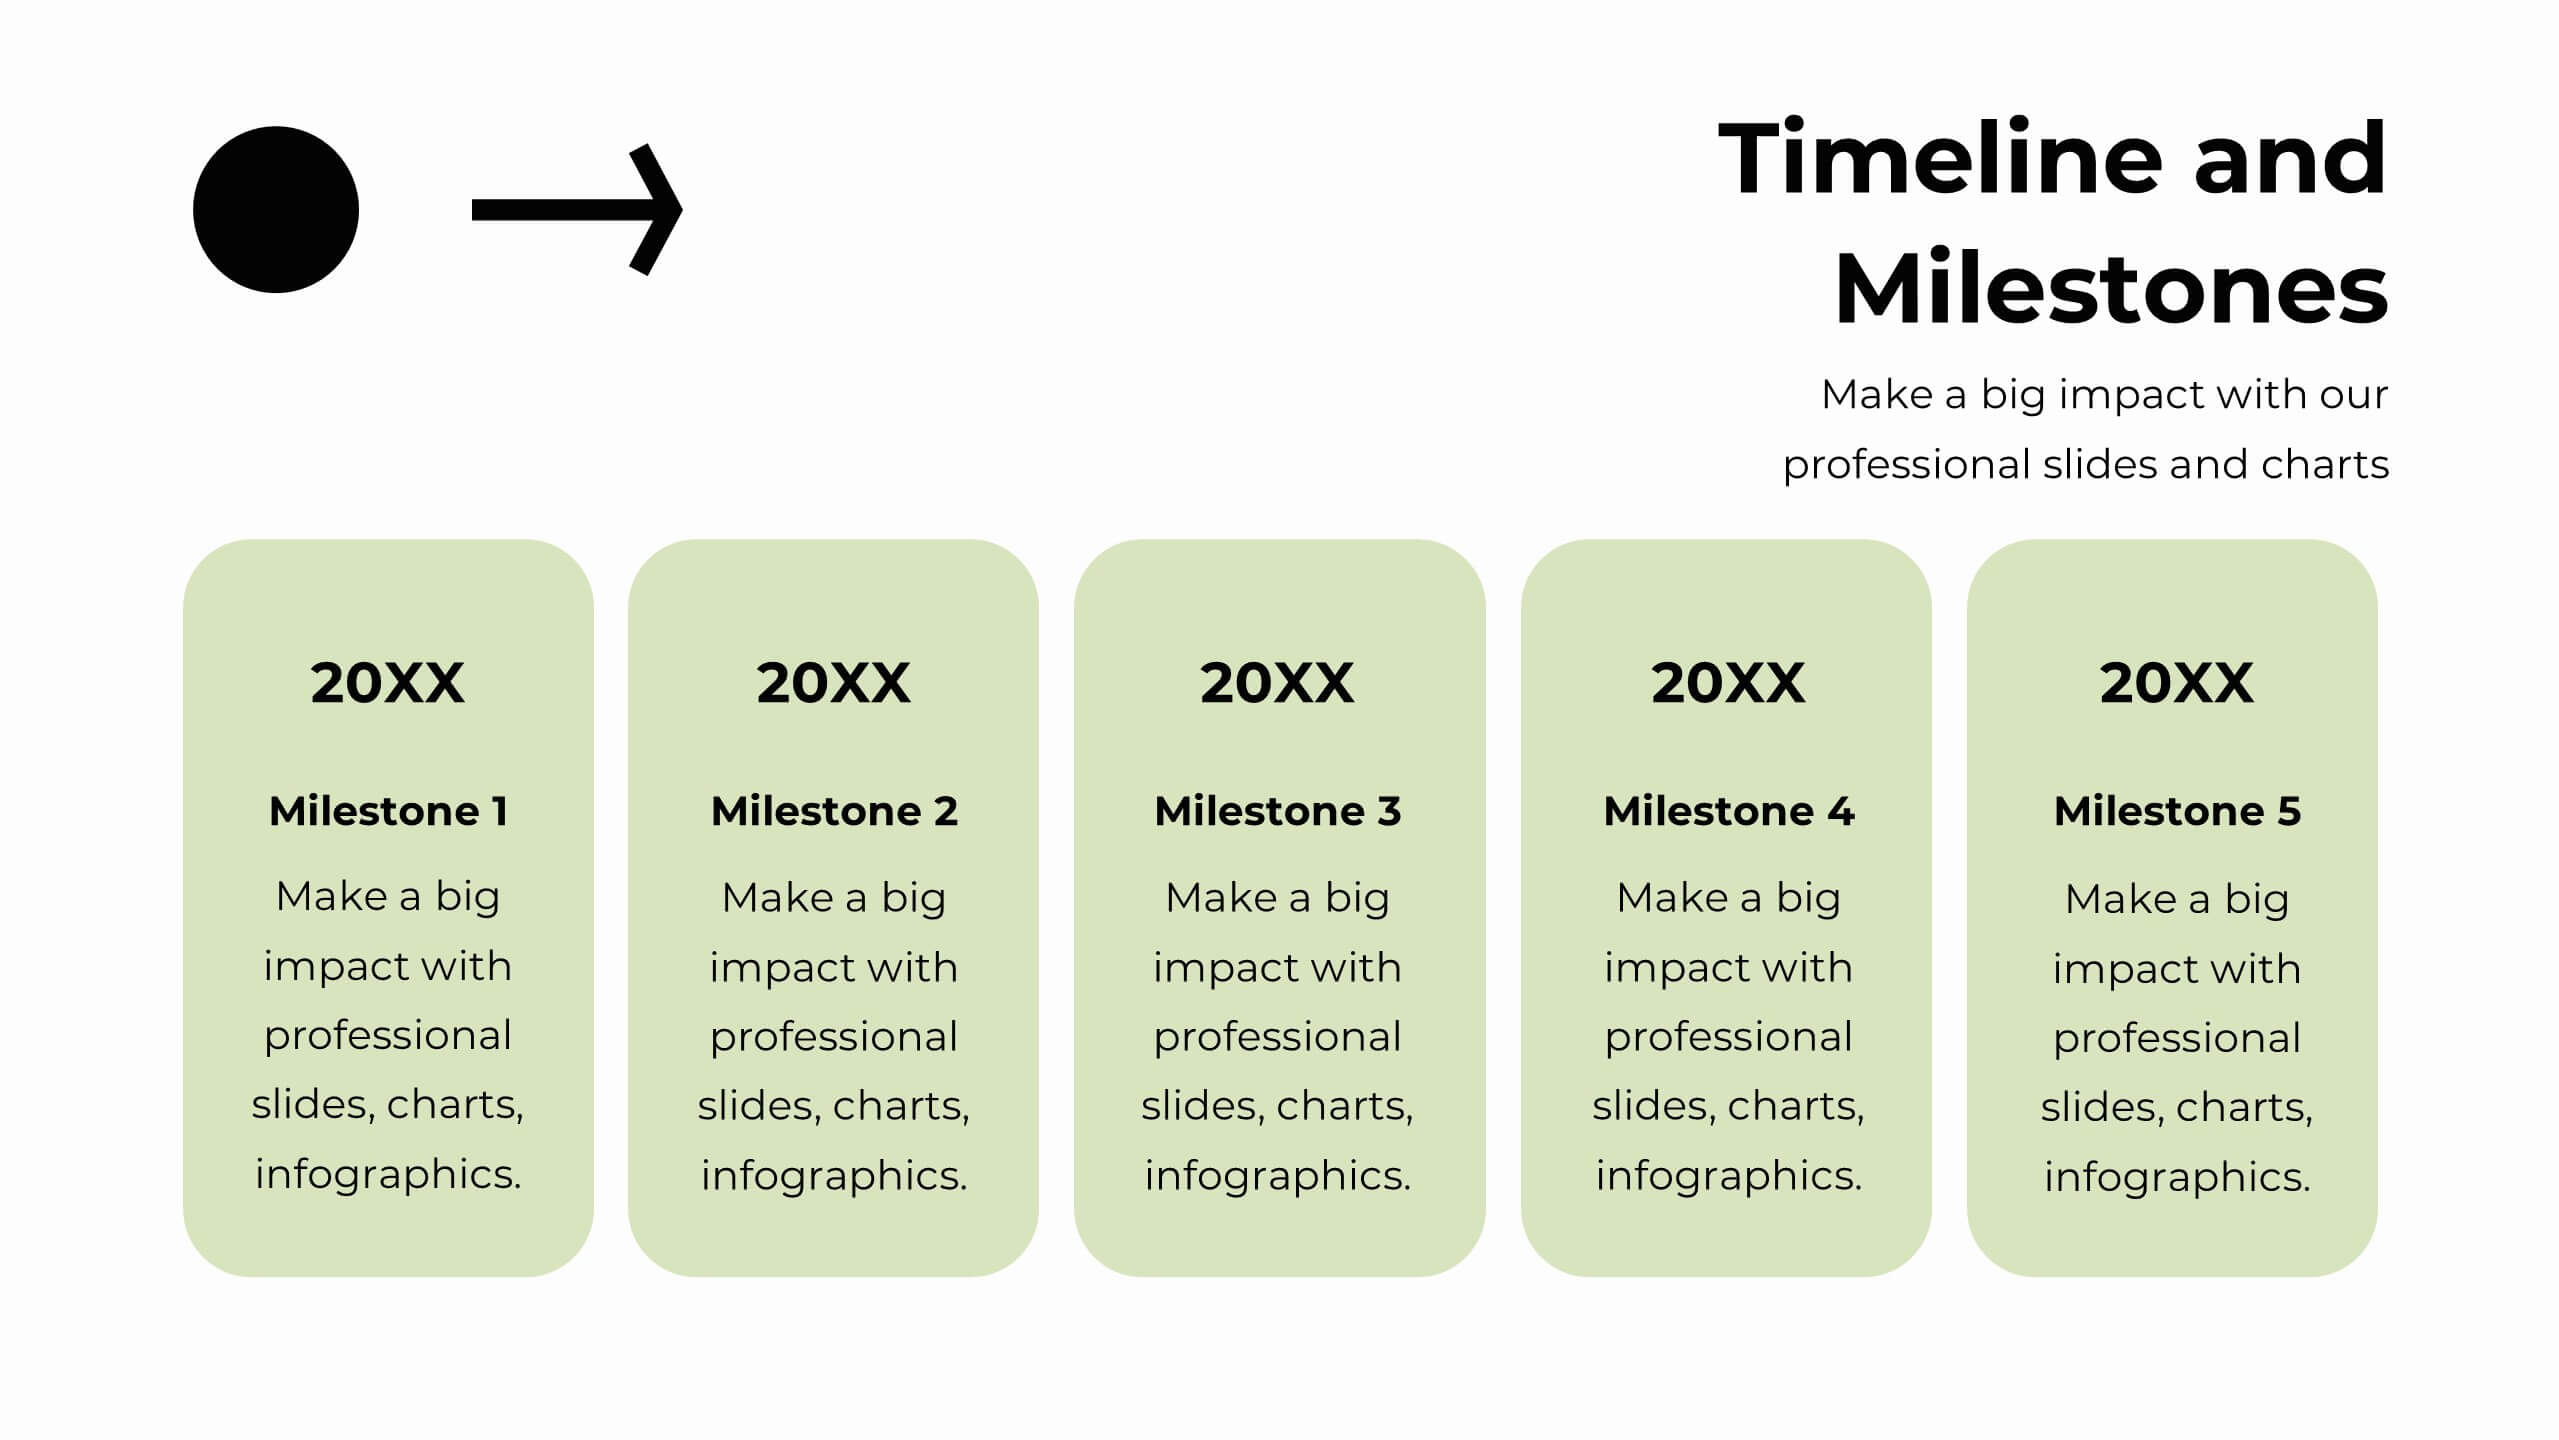
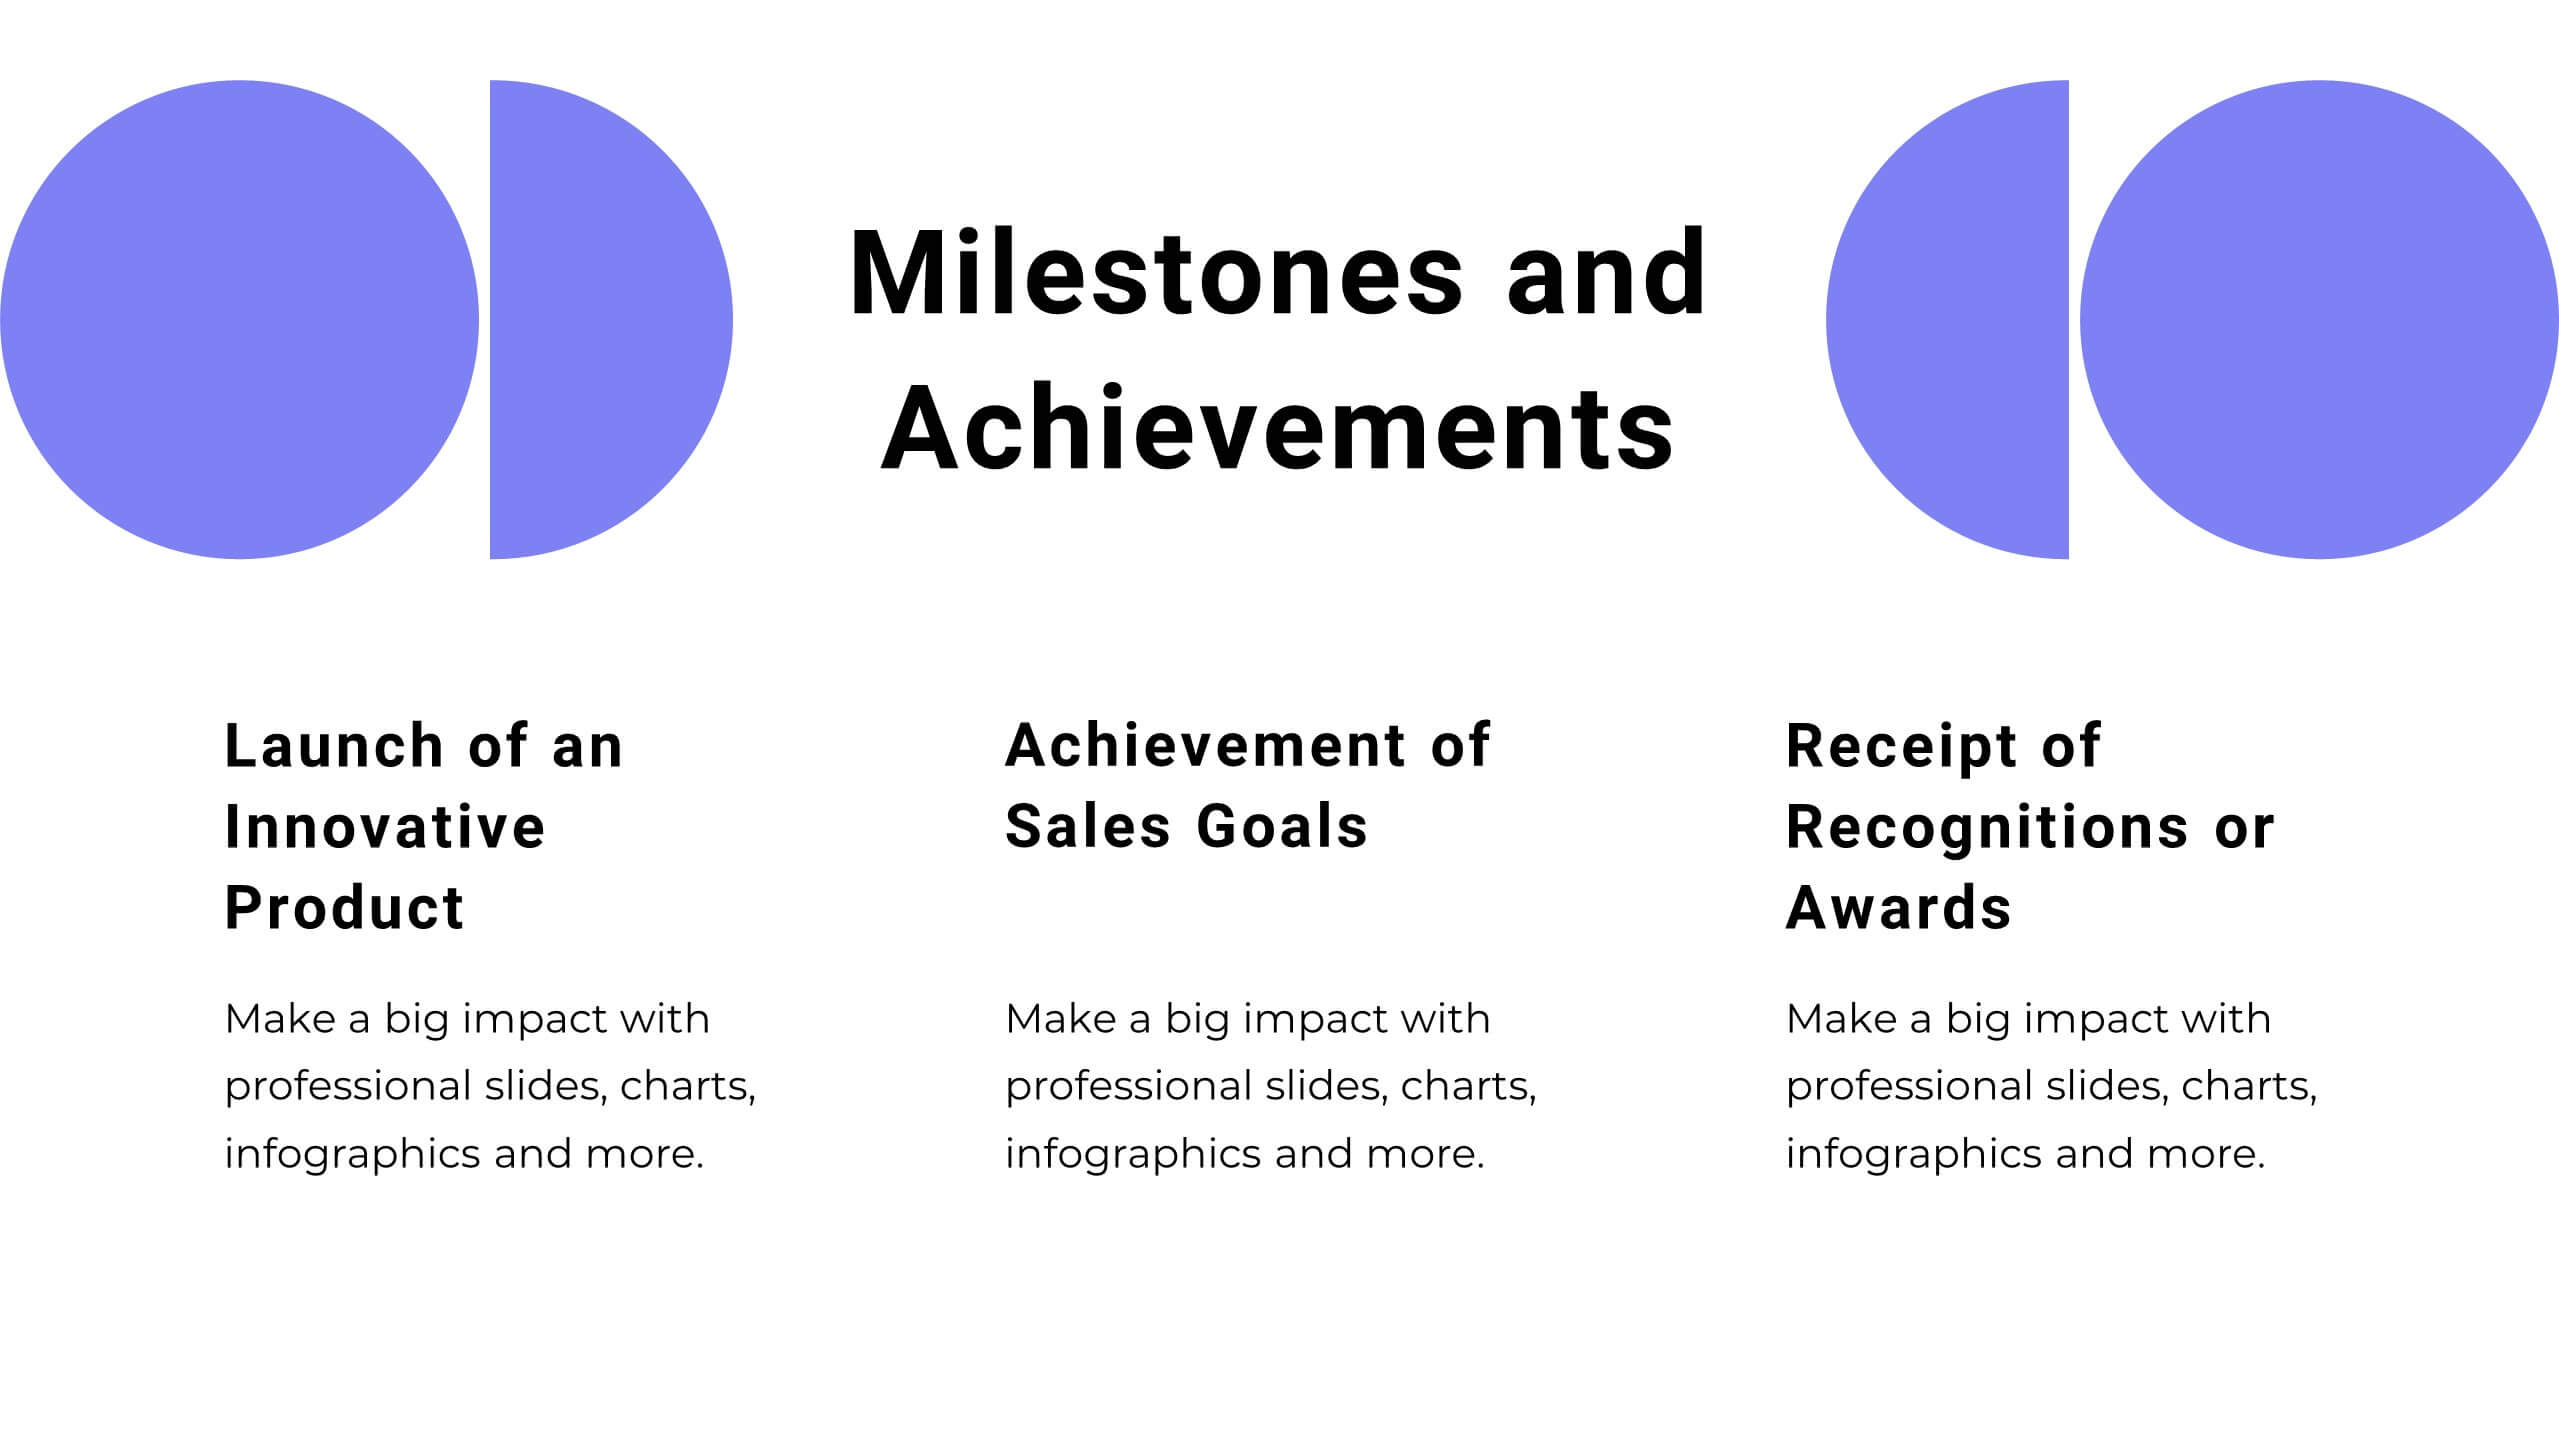
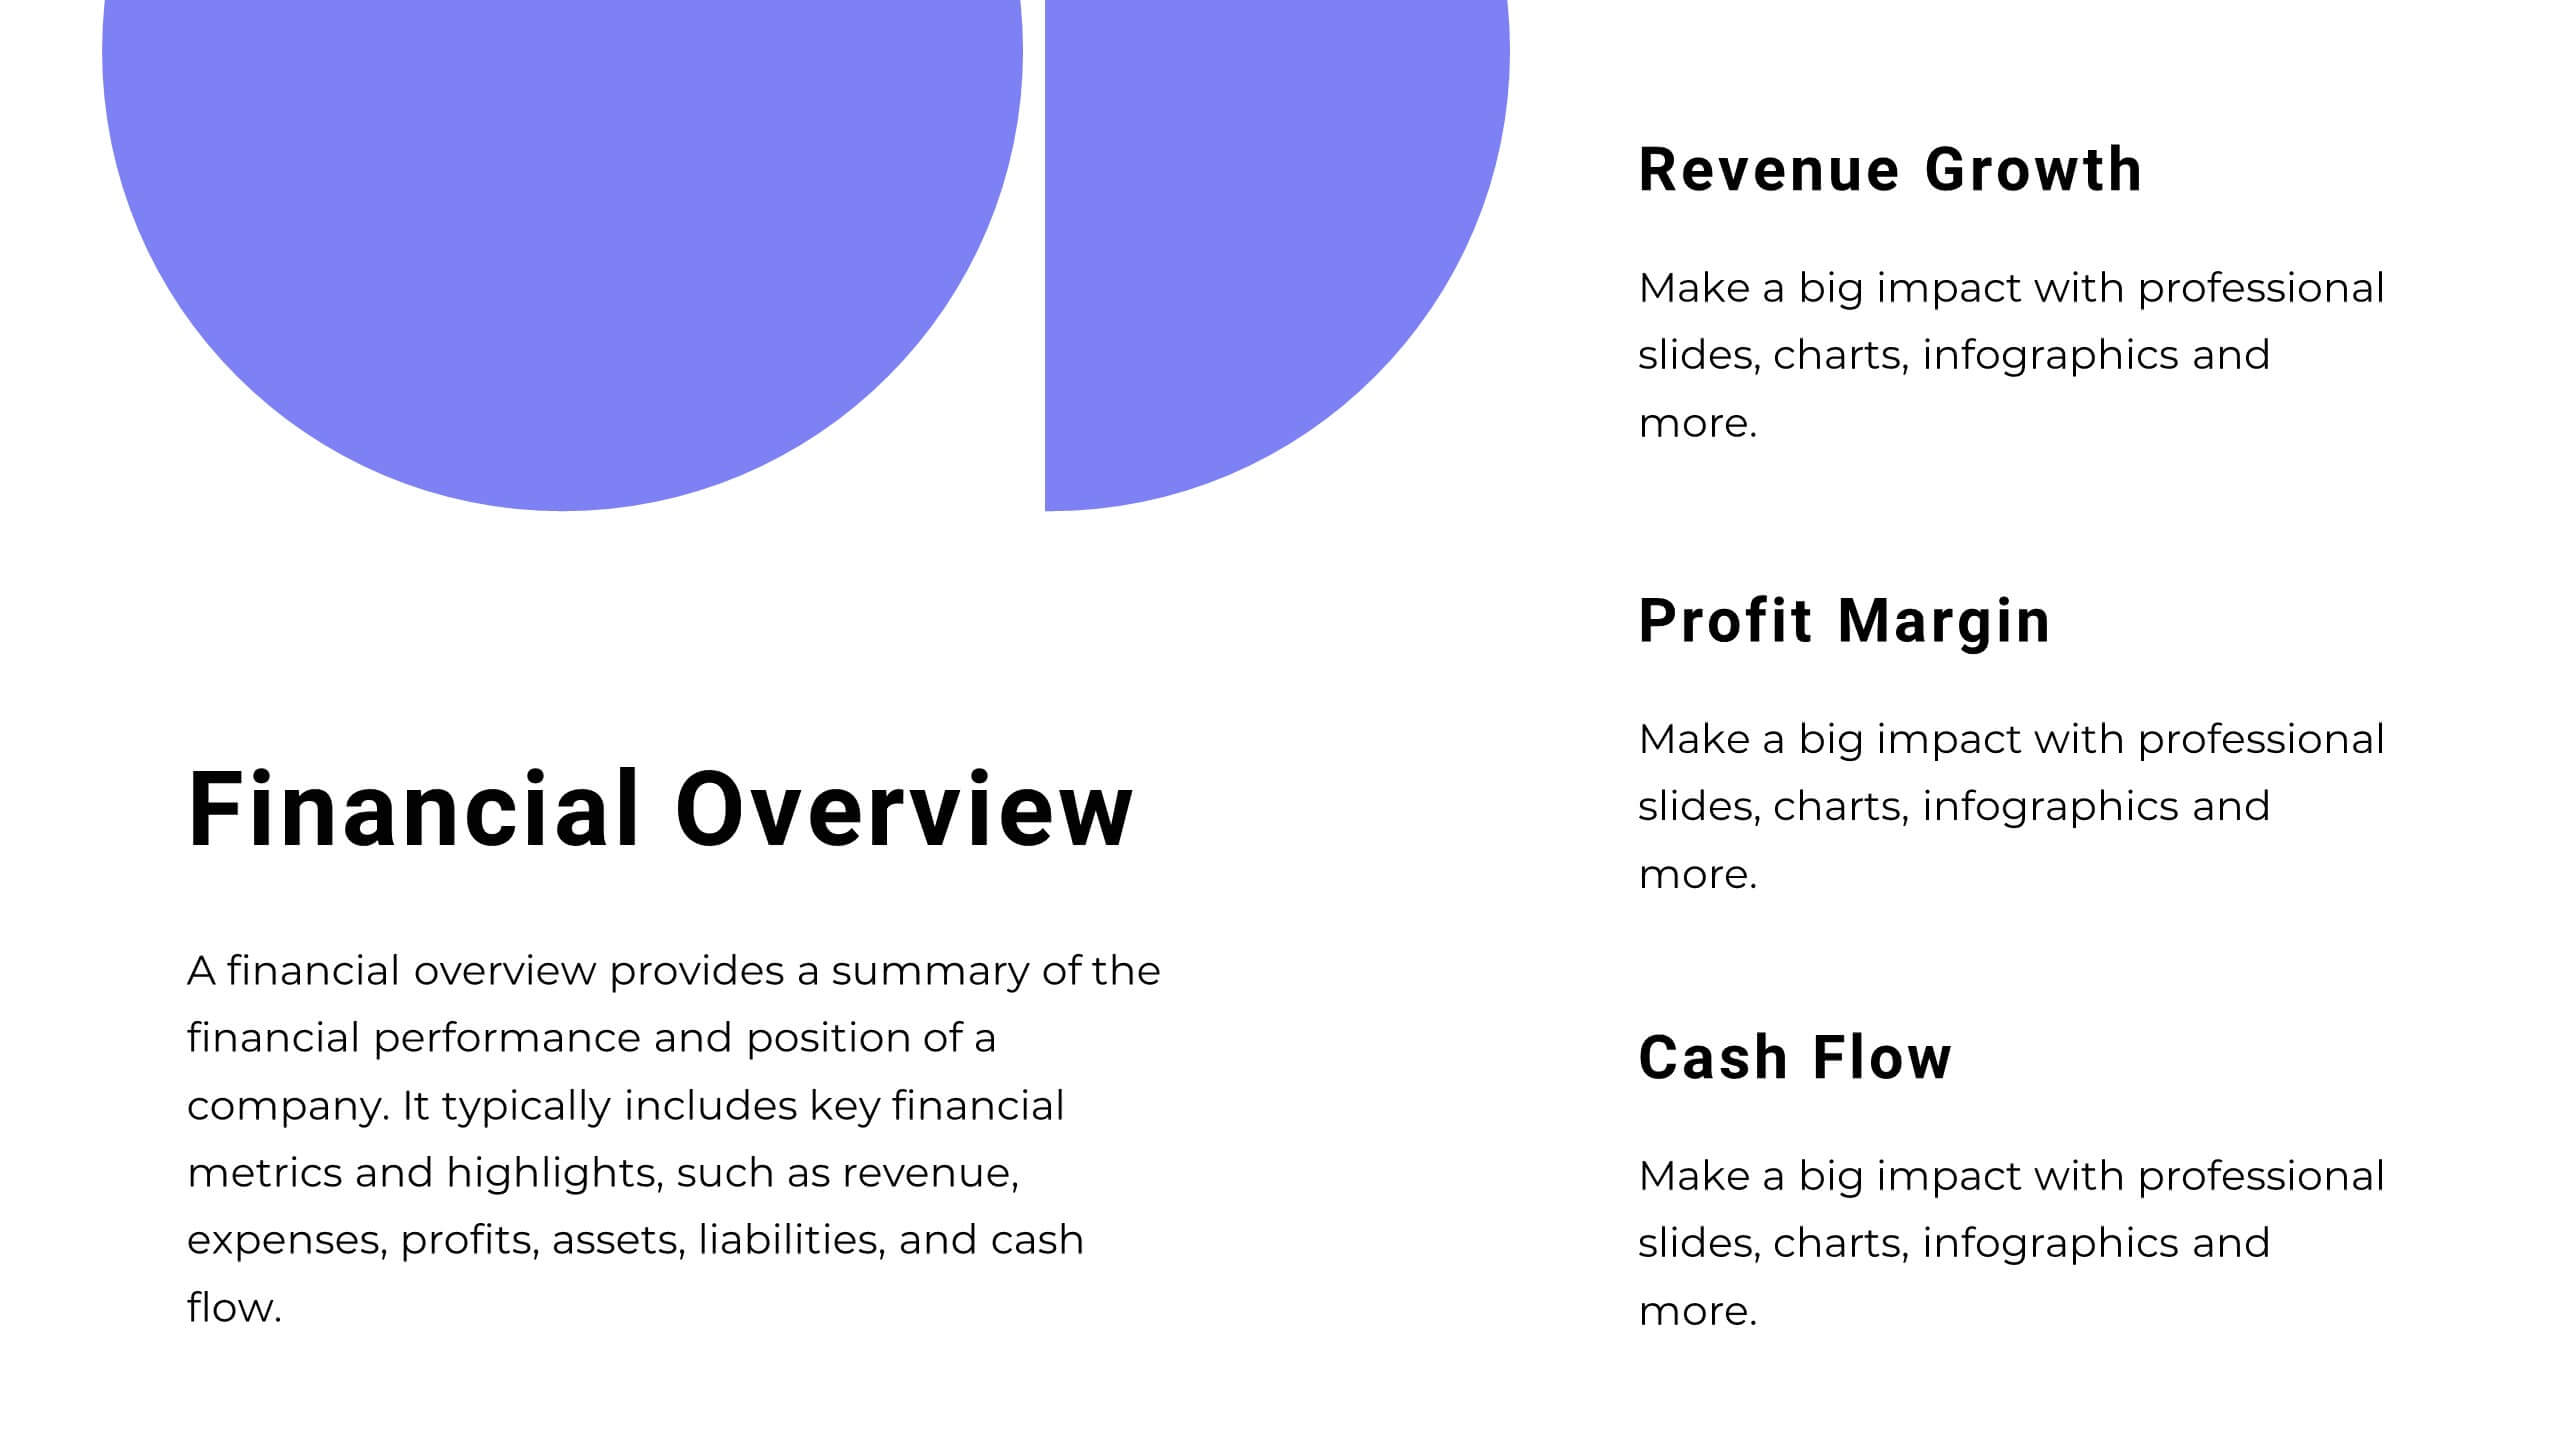
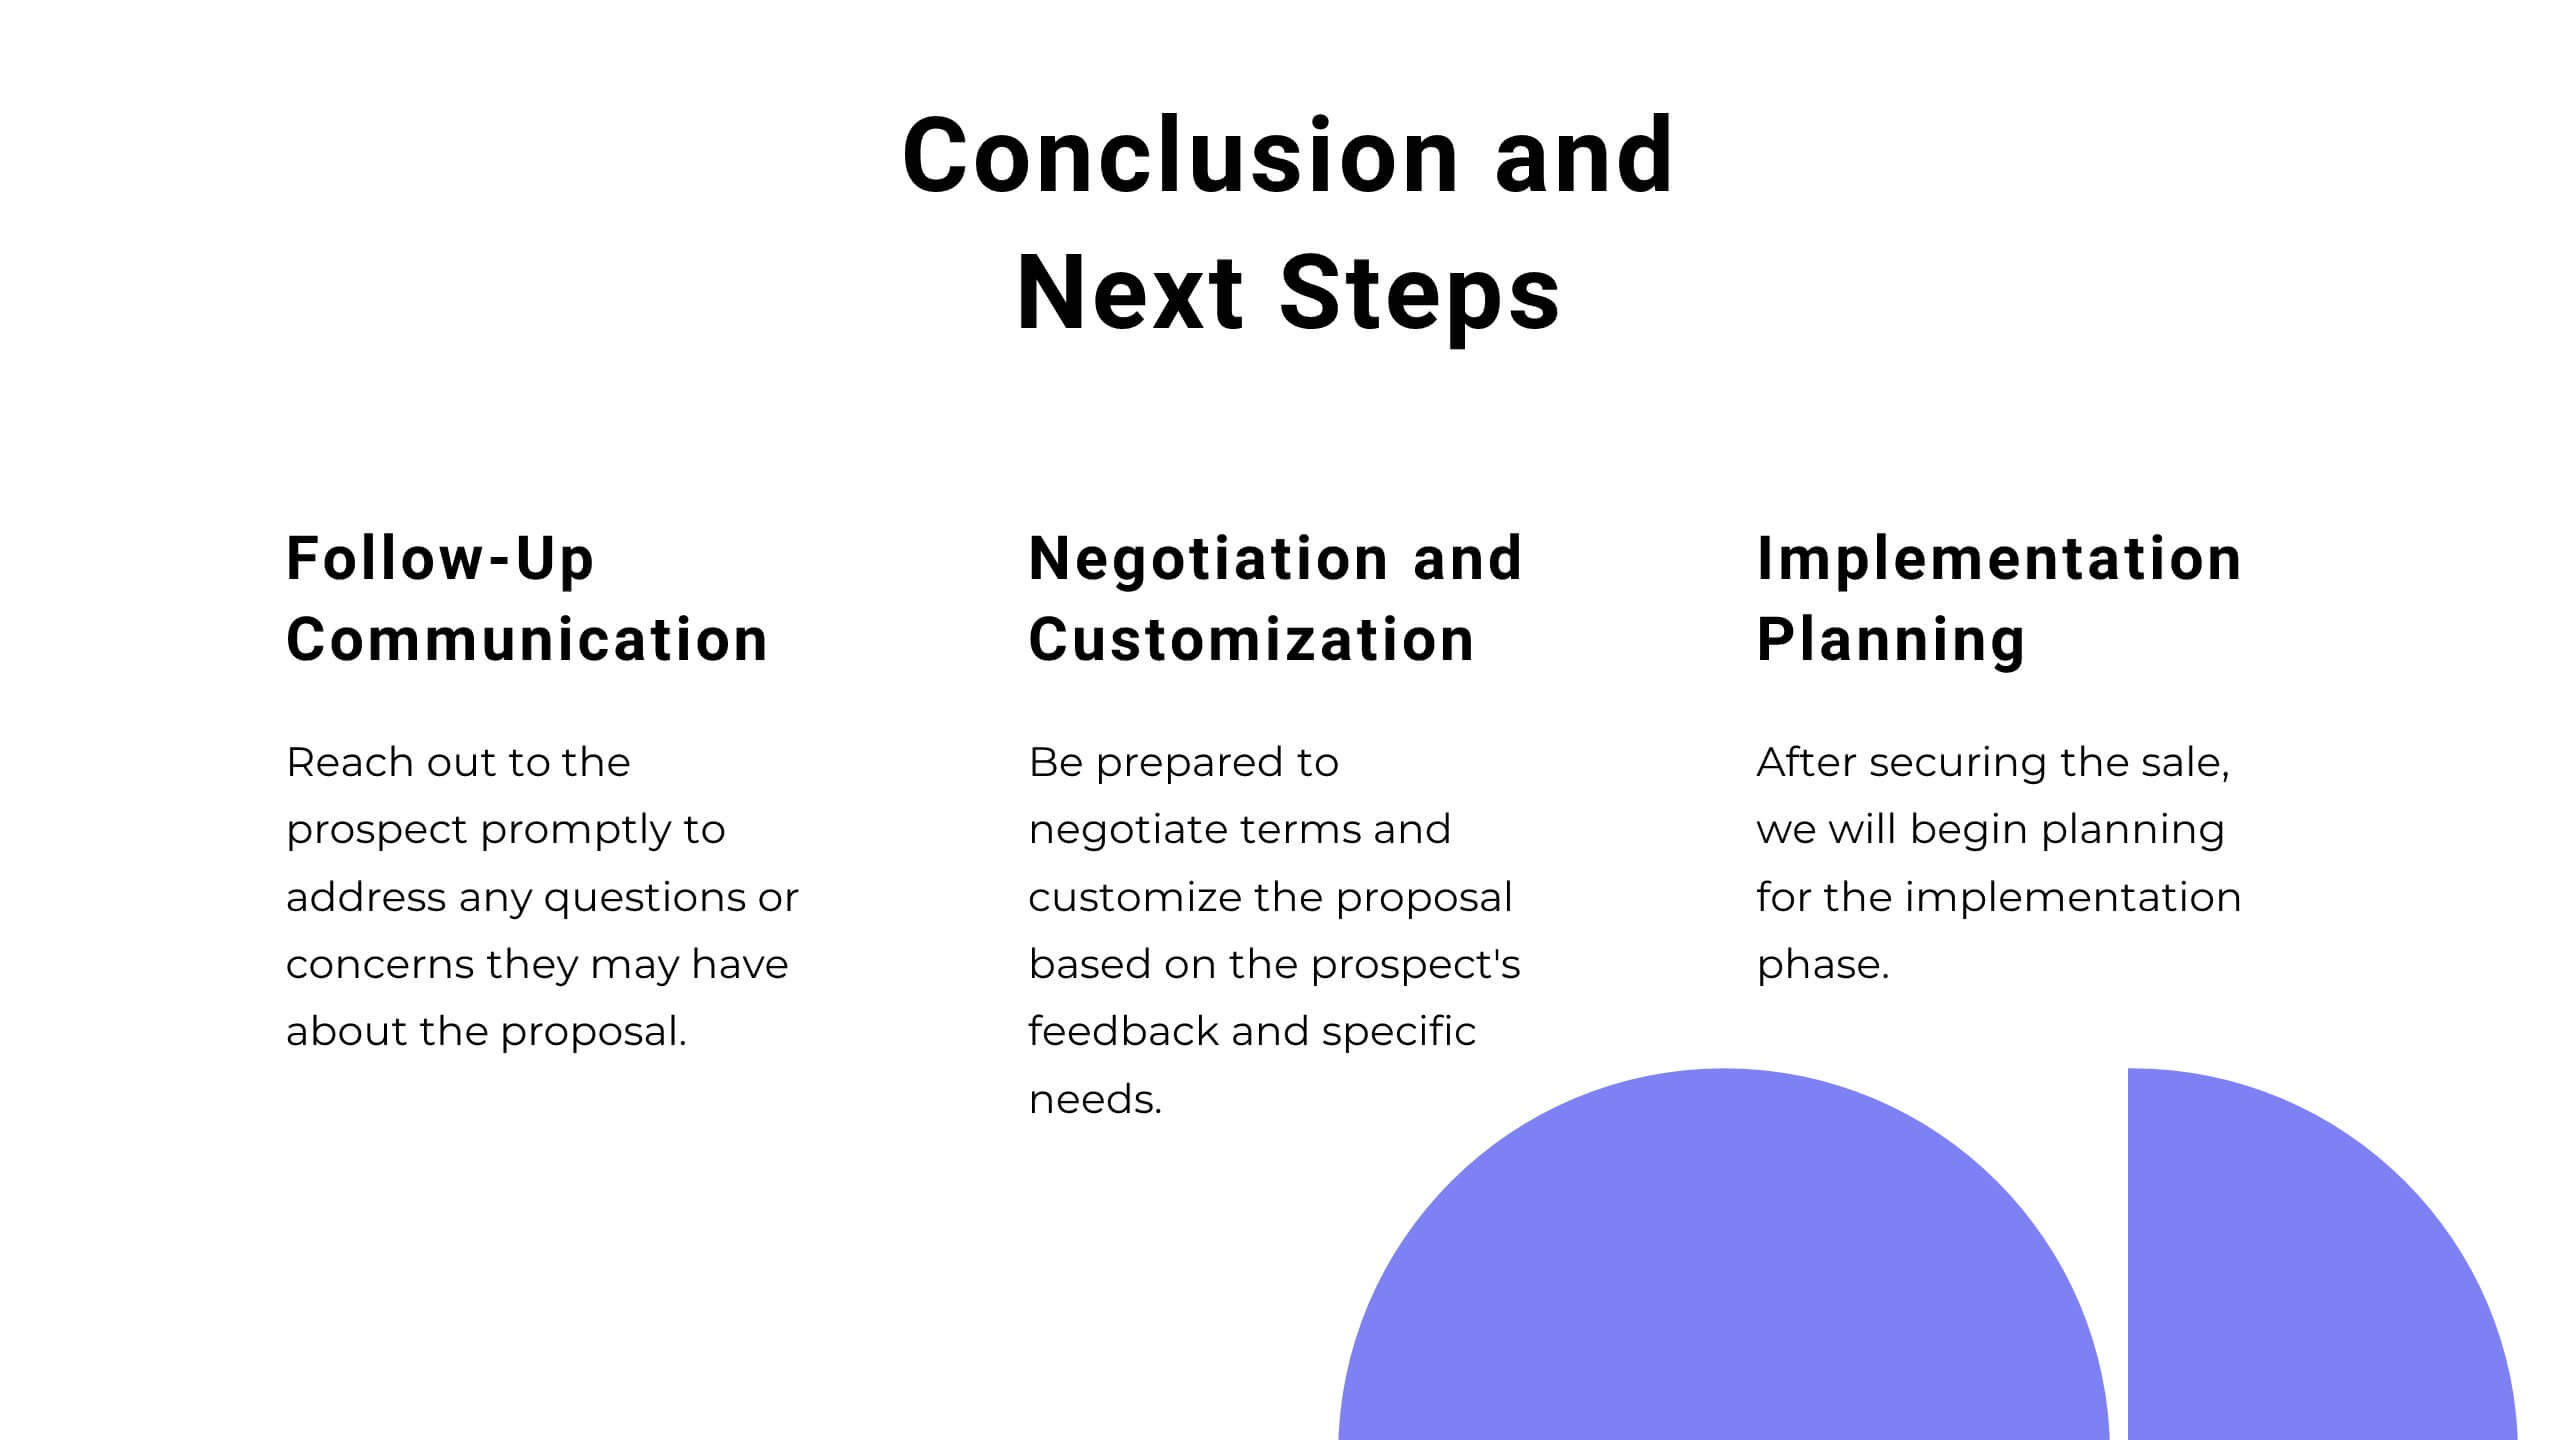
Business Milestone Roadmap Presentation
Visualize your company's journey with this curved-road milestone infographic. Perfect for tracking key goals, quarterly achievements, or strategic plans, this template uses clear markers along a winding path to emphasize progress and direction. Ideal for business updates, project timelines, or growth strategies. Fully editable in PowerPoint, Keynote, and Google Slides.


6 diapositivas
PESTEL Management Infographic
PESTEL analysis is a framework used to assess and analyze the external macro-environmental factors that can impact an organization, industry, or market. This infographic template provides an overview of the PESTEL analysis framework and its application in strategic management. This template provides a clear and concise explanation of the PESTEL analysis framework, detailing each component of the acronym for you to use. It highlights the significance of considering these external factors when formulating business strategies and making informed decisions. Compatible with Powerpoint, Keynote, and Google Slides.


5 diapositivas
Business Investment in Africa Map Presentation
Explore promising markets with the "Business Investment in Africa Map" template, designed to provide a visual overview of investment opportunities across the continent. It features a map with marked regions, each linked to specific data points about business prospects. Ideal for investors or companies looking at market penetration or expansion within Africa, this layout helps in making data-driven decisions by providing a clear, concise visual representation of key information.

23 diapositivas
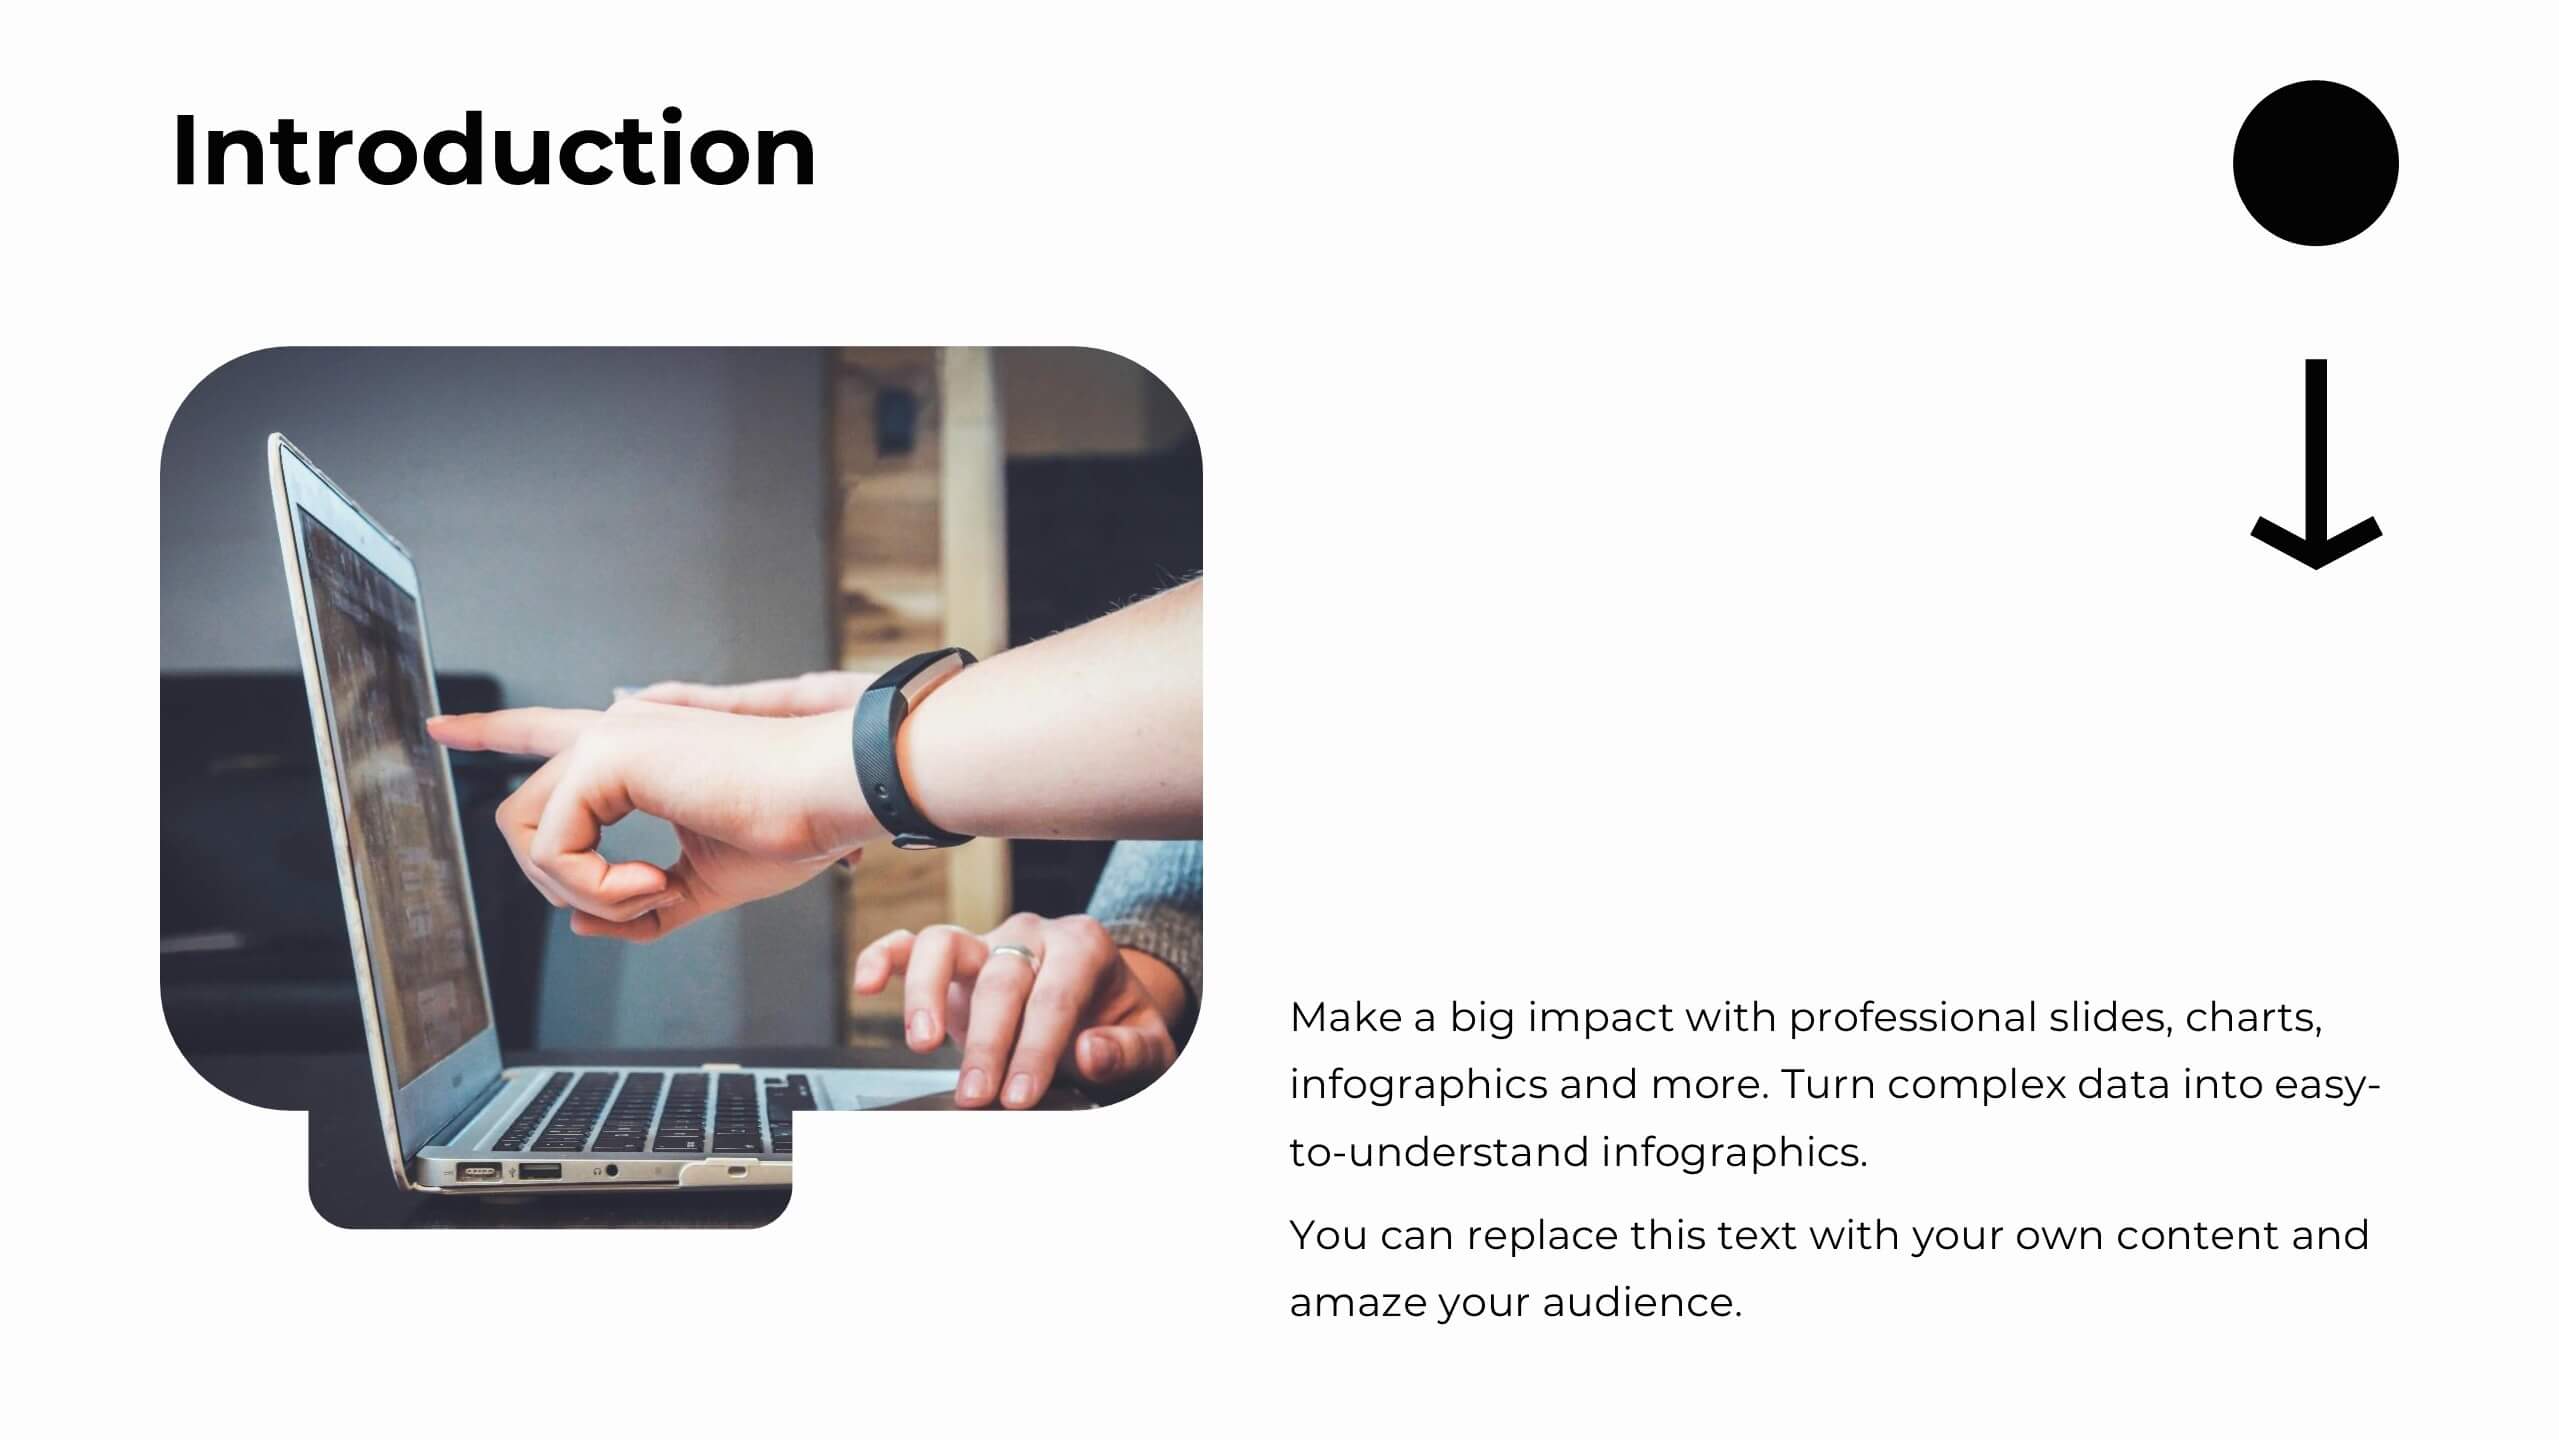
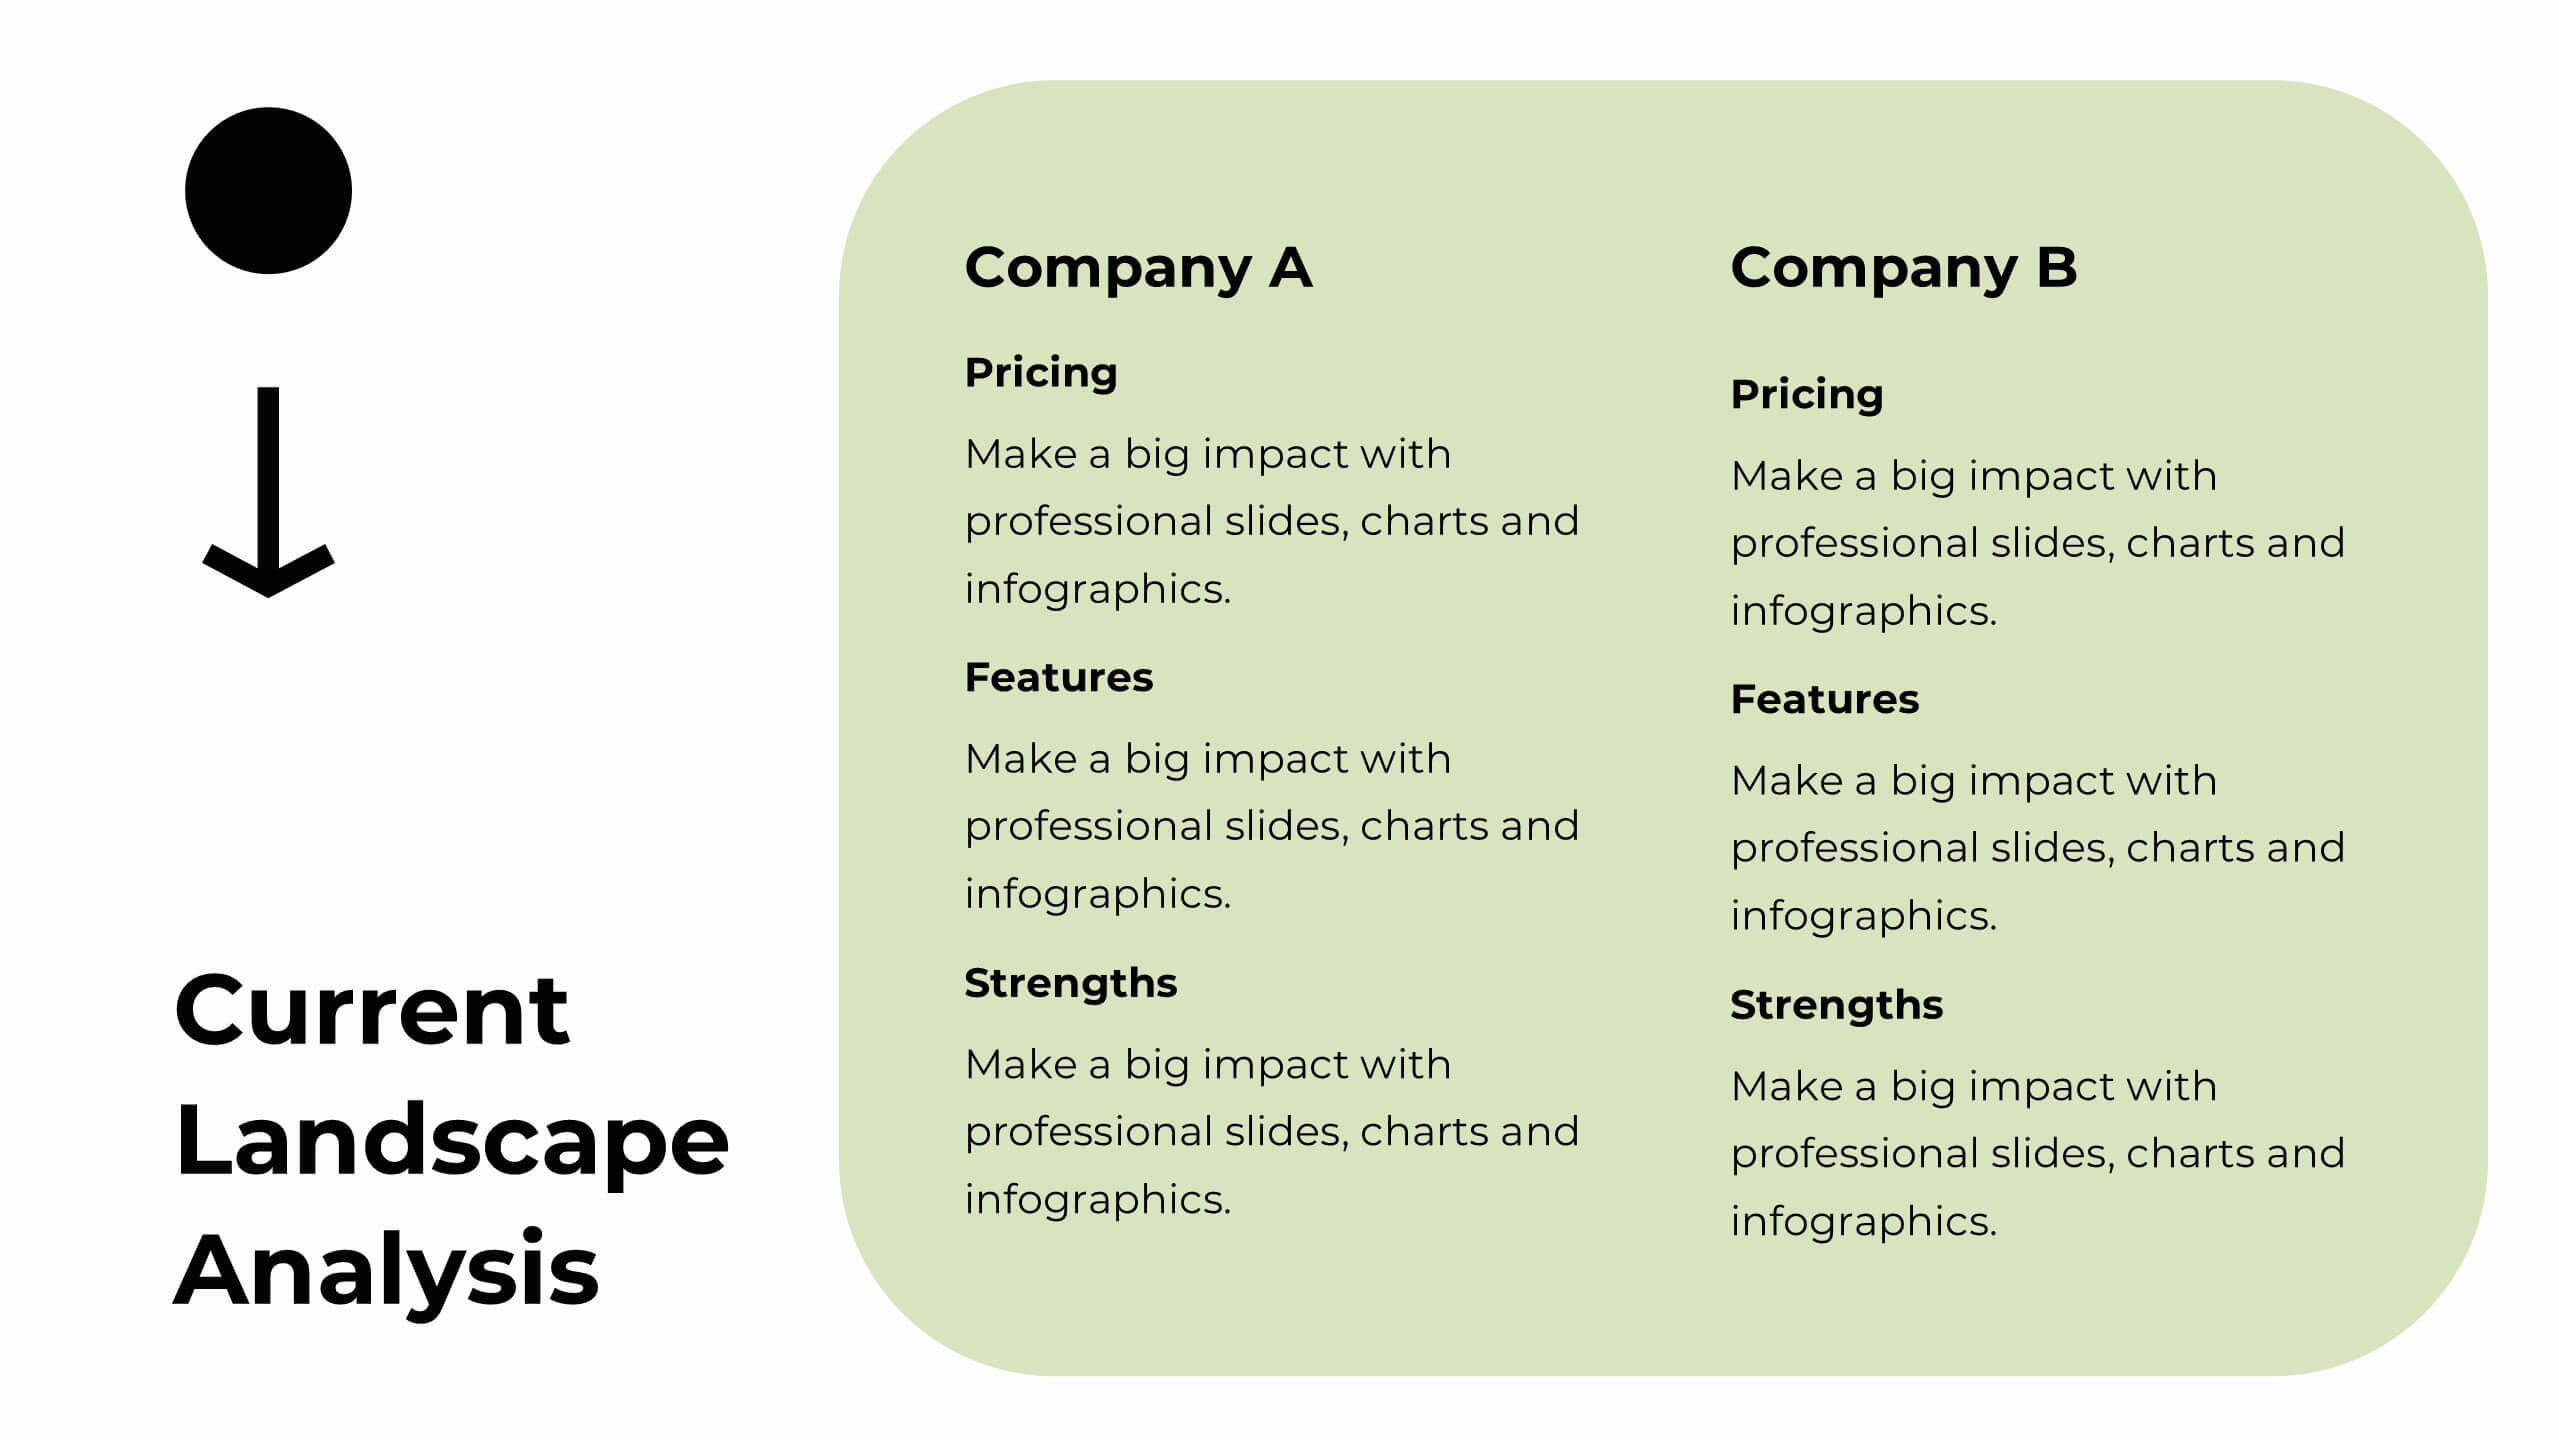
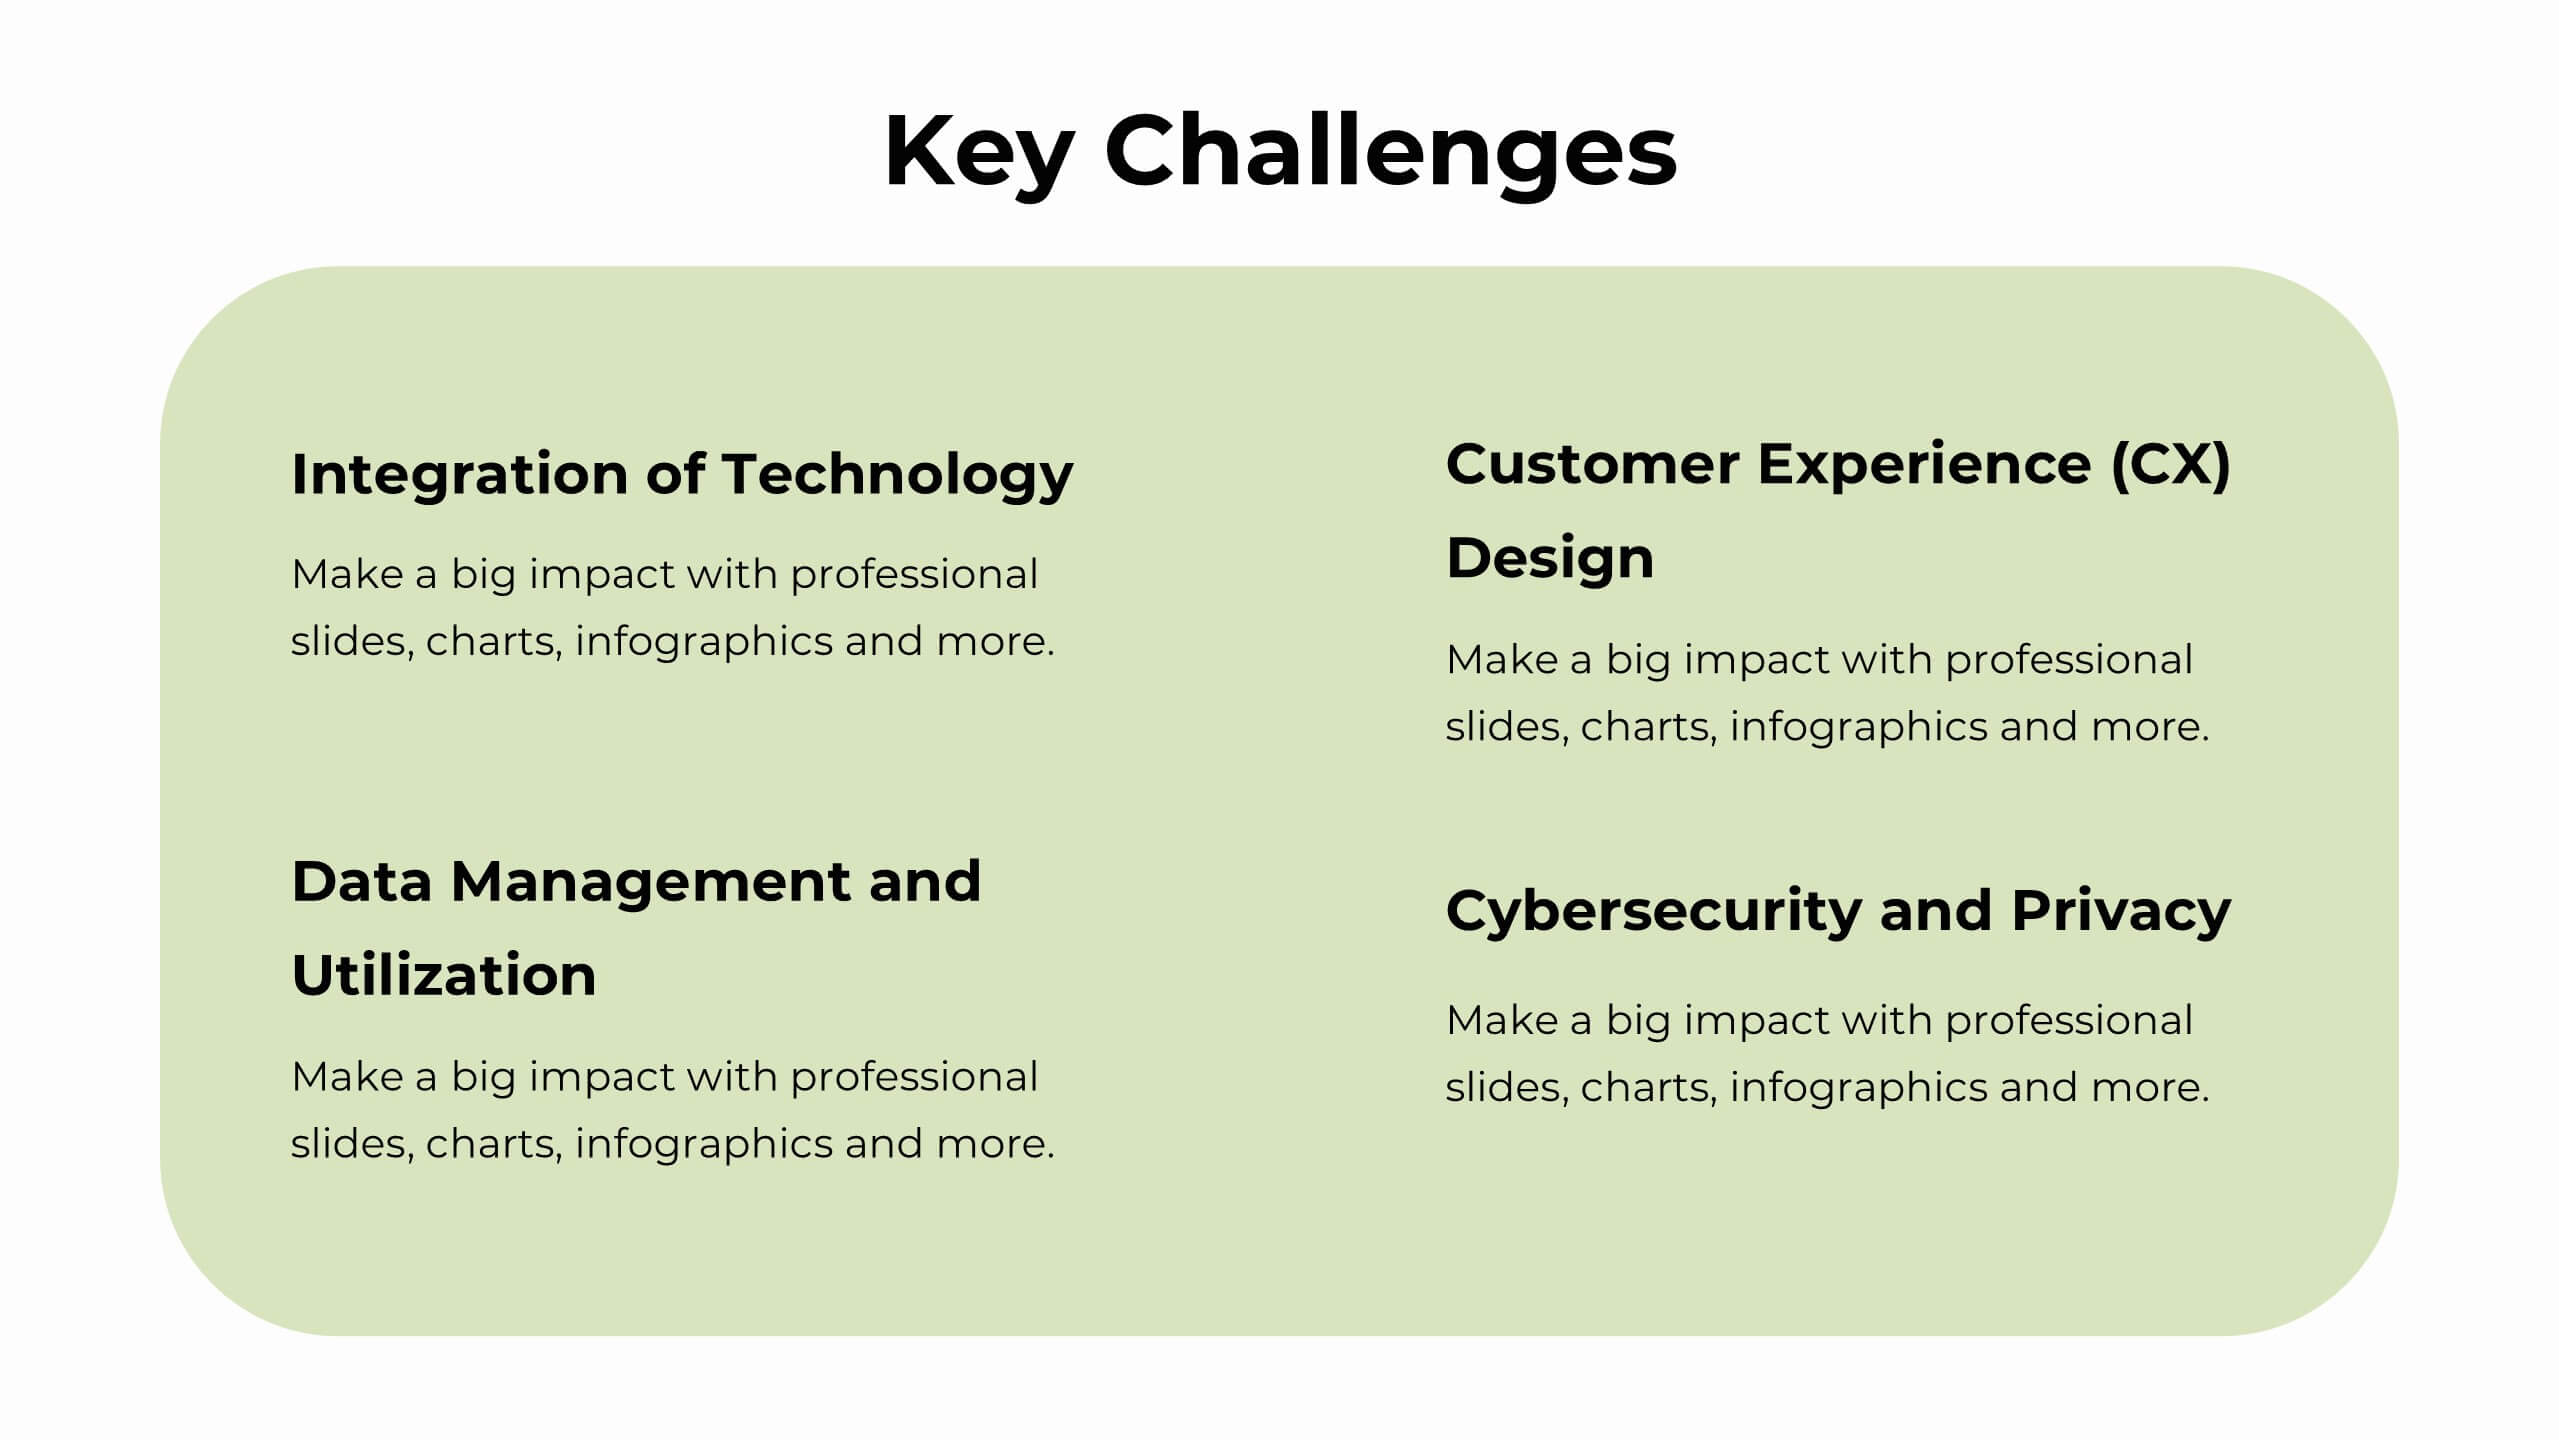
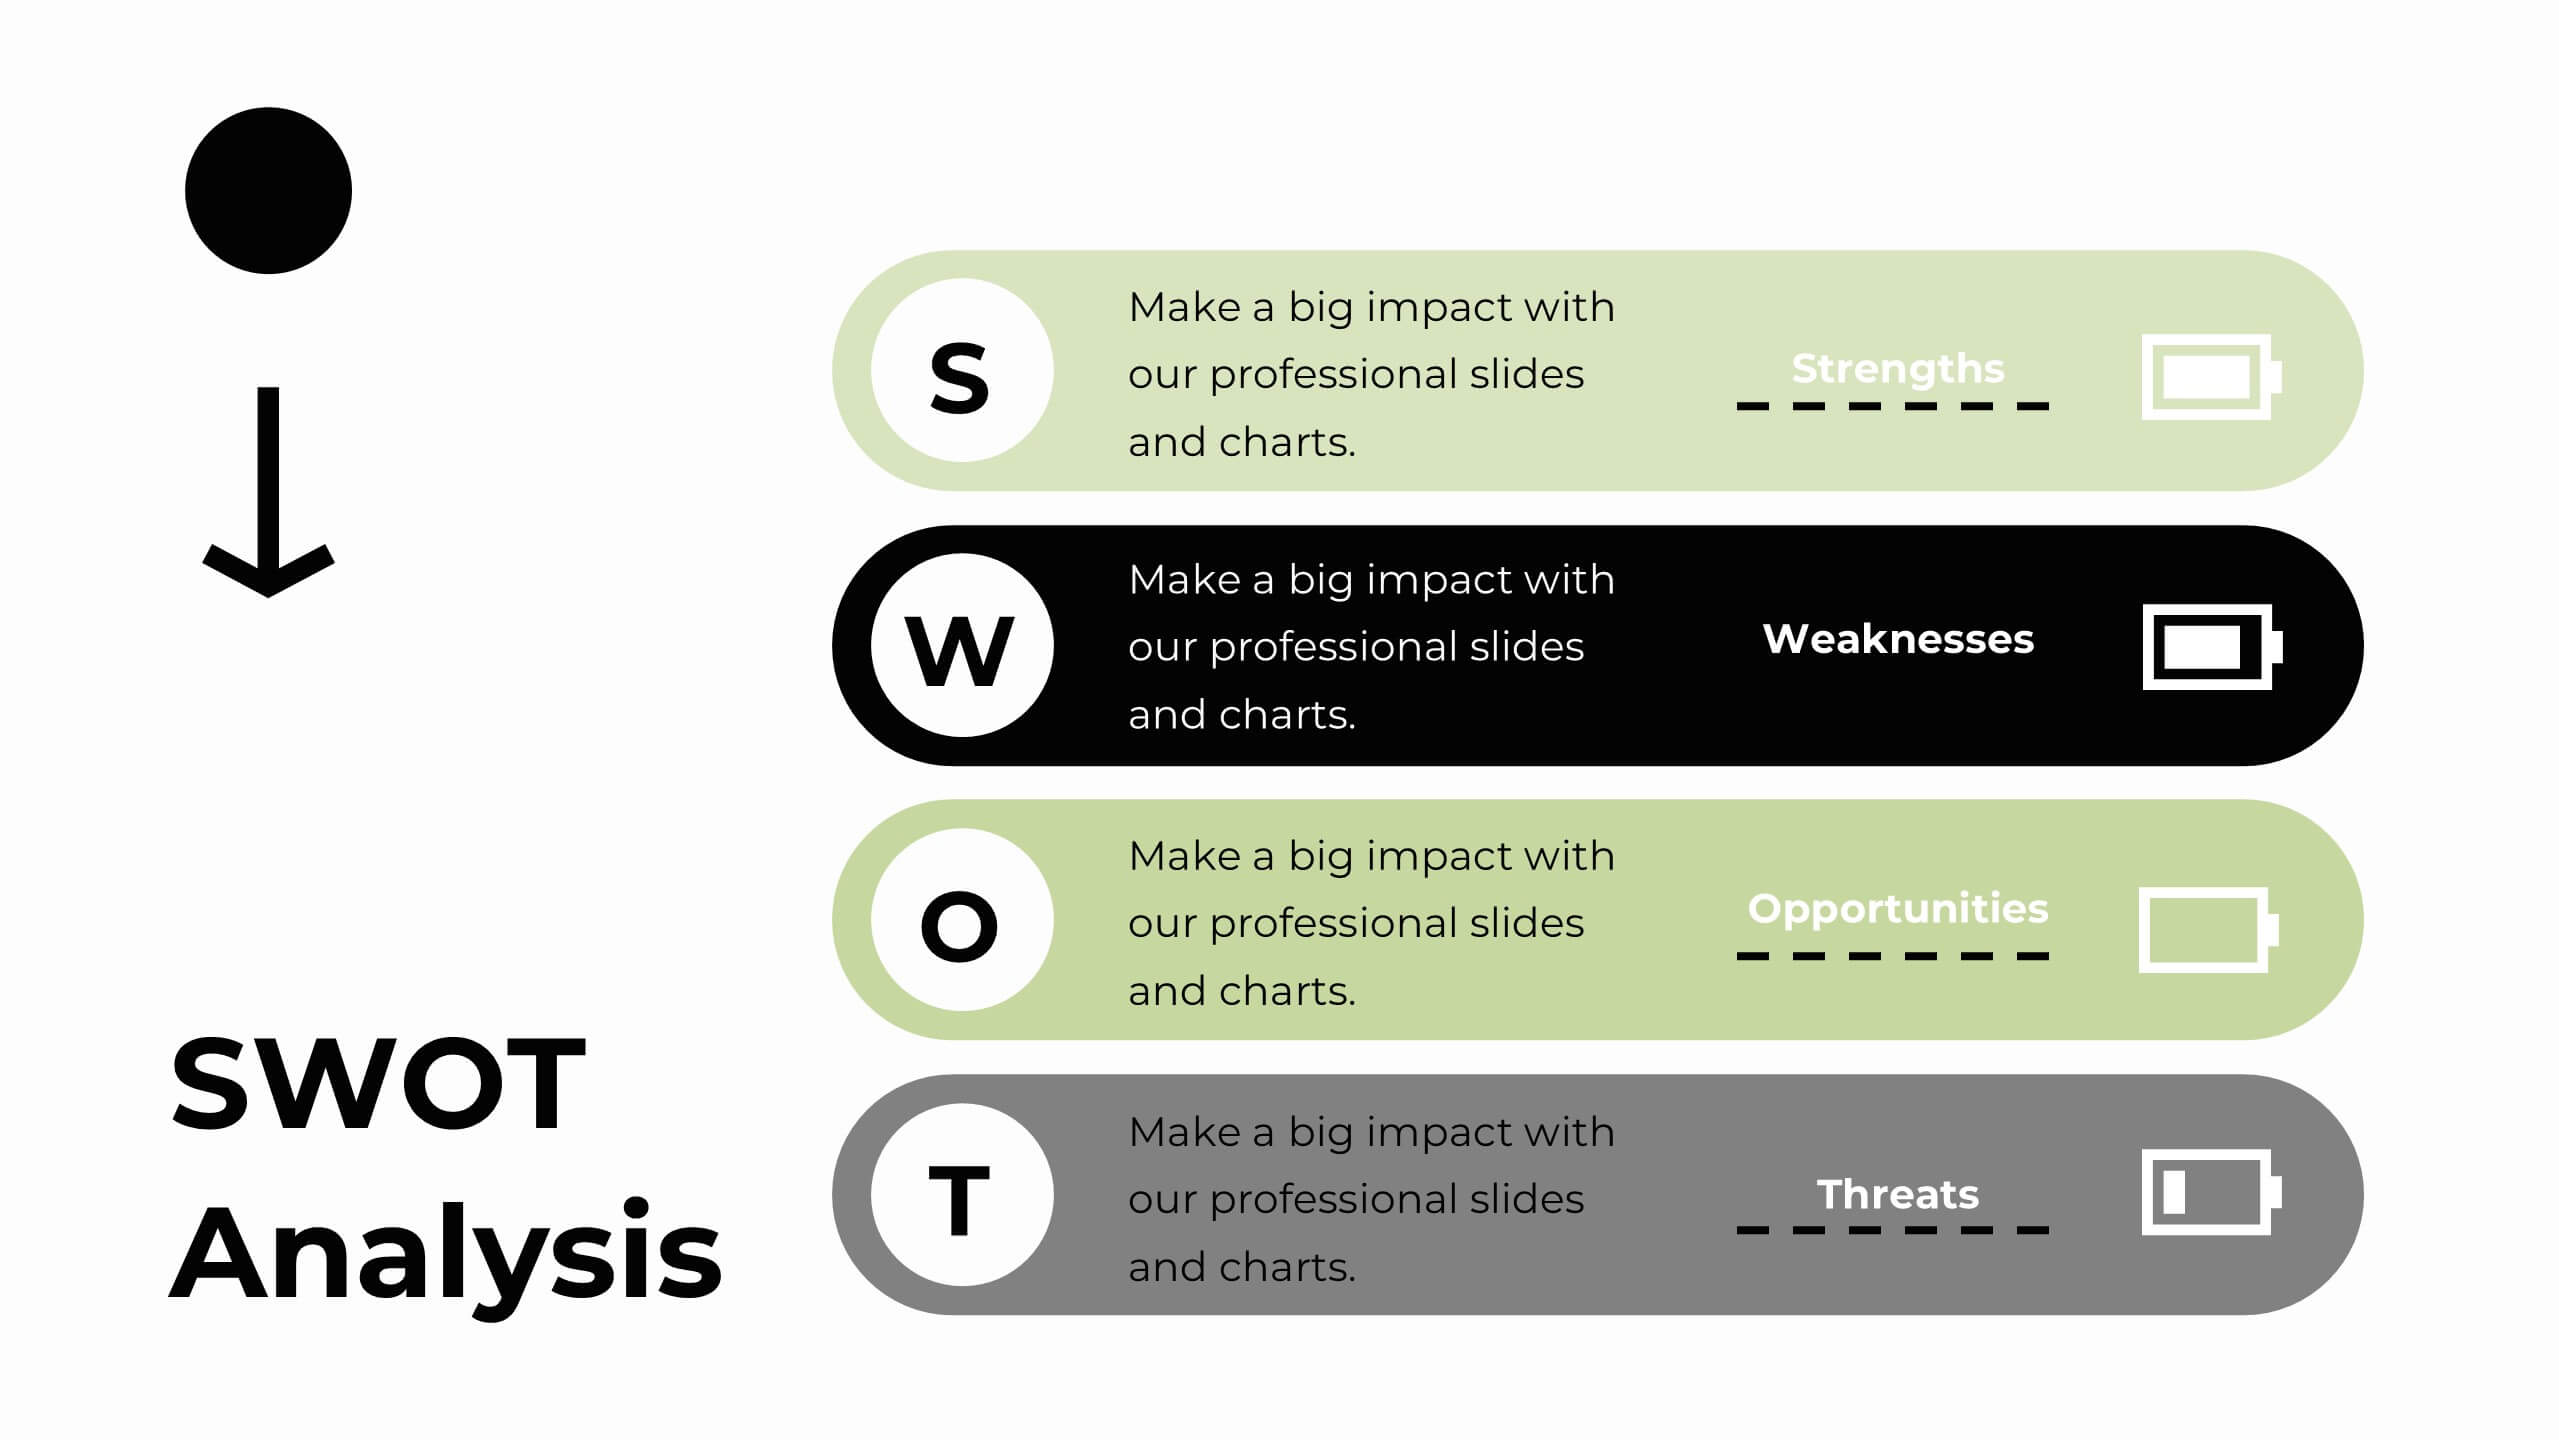
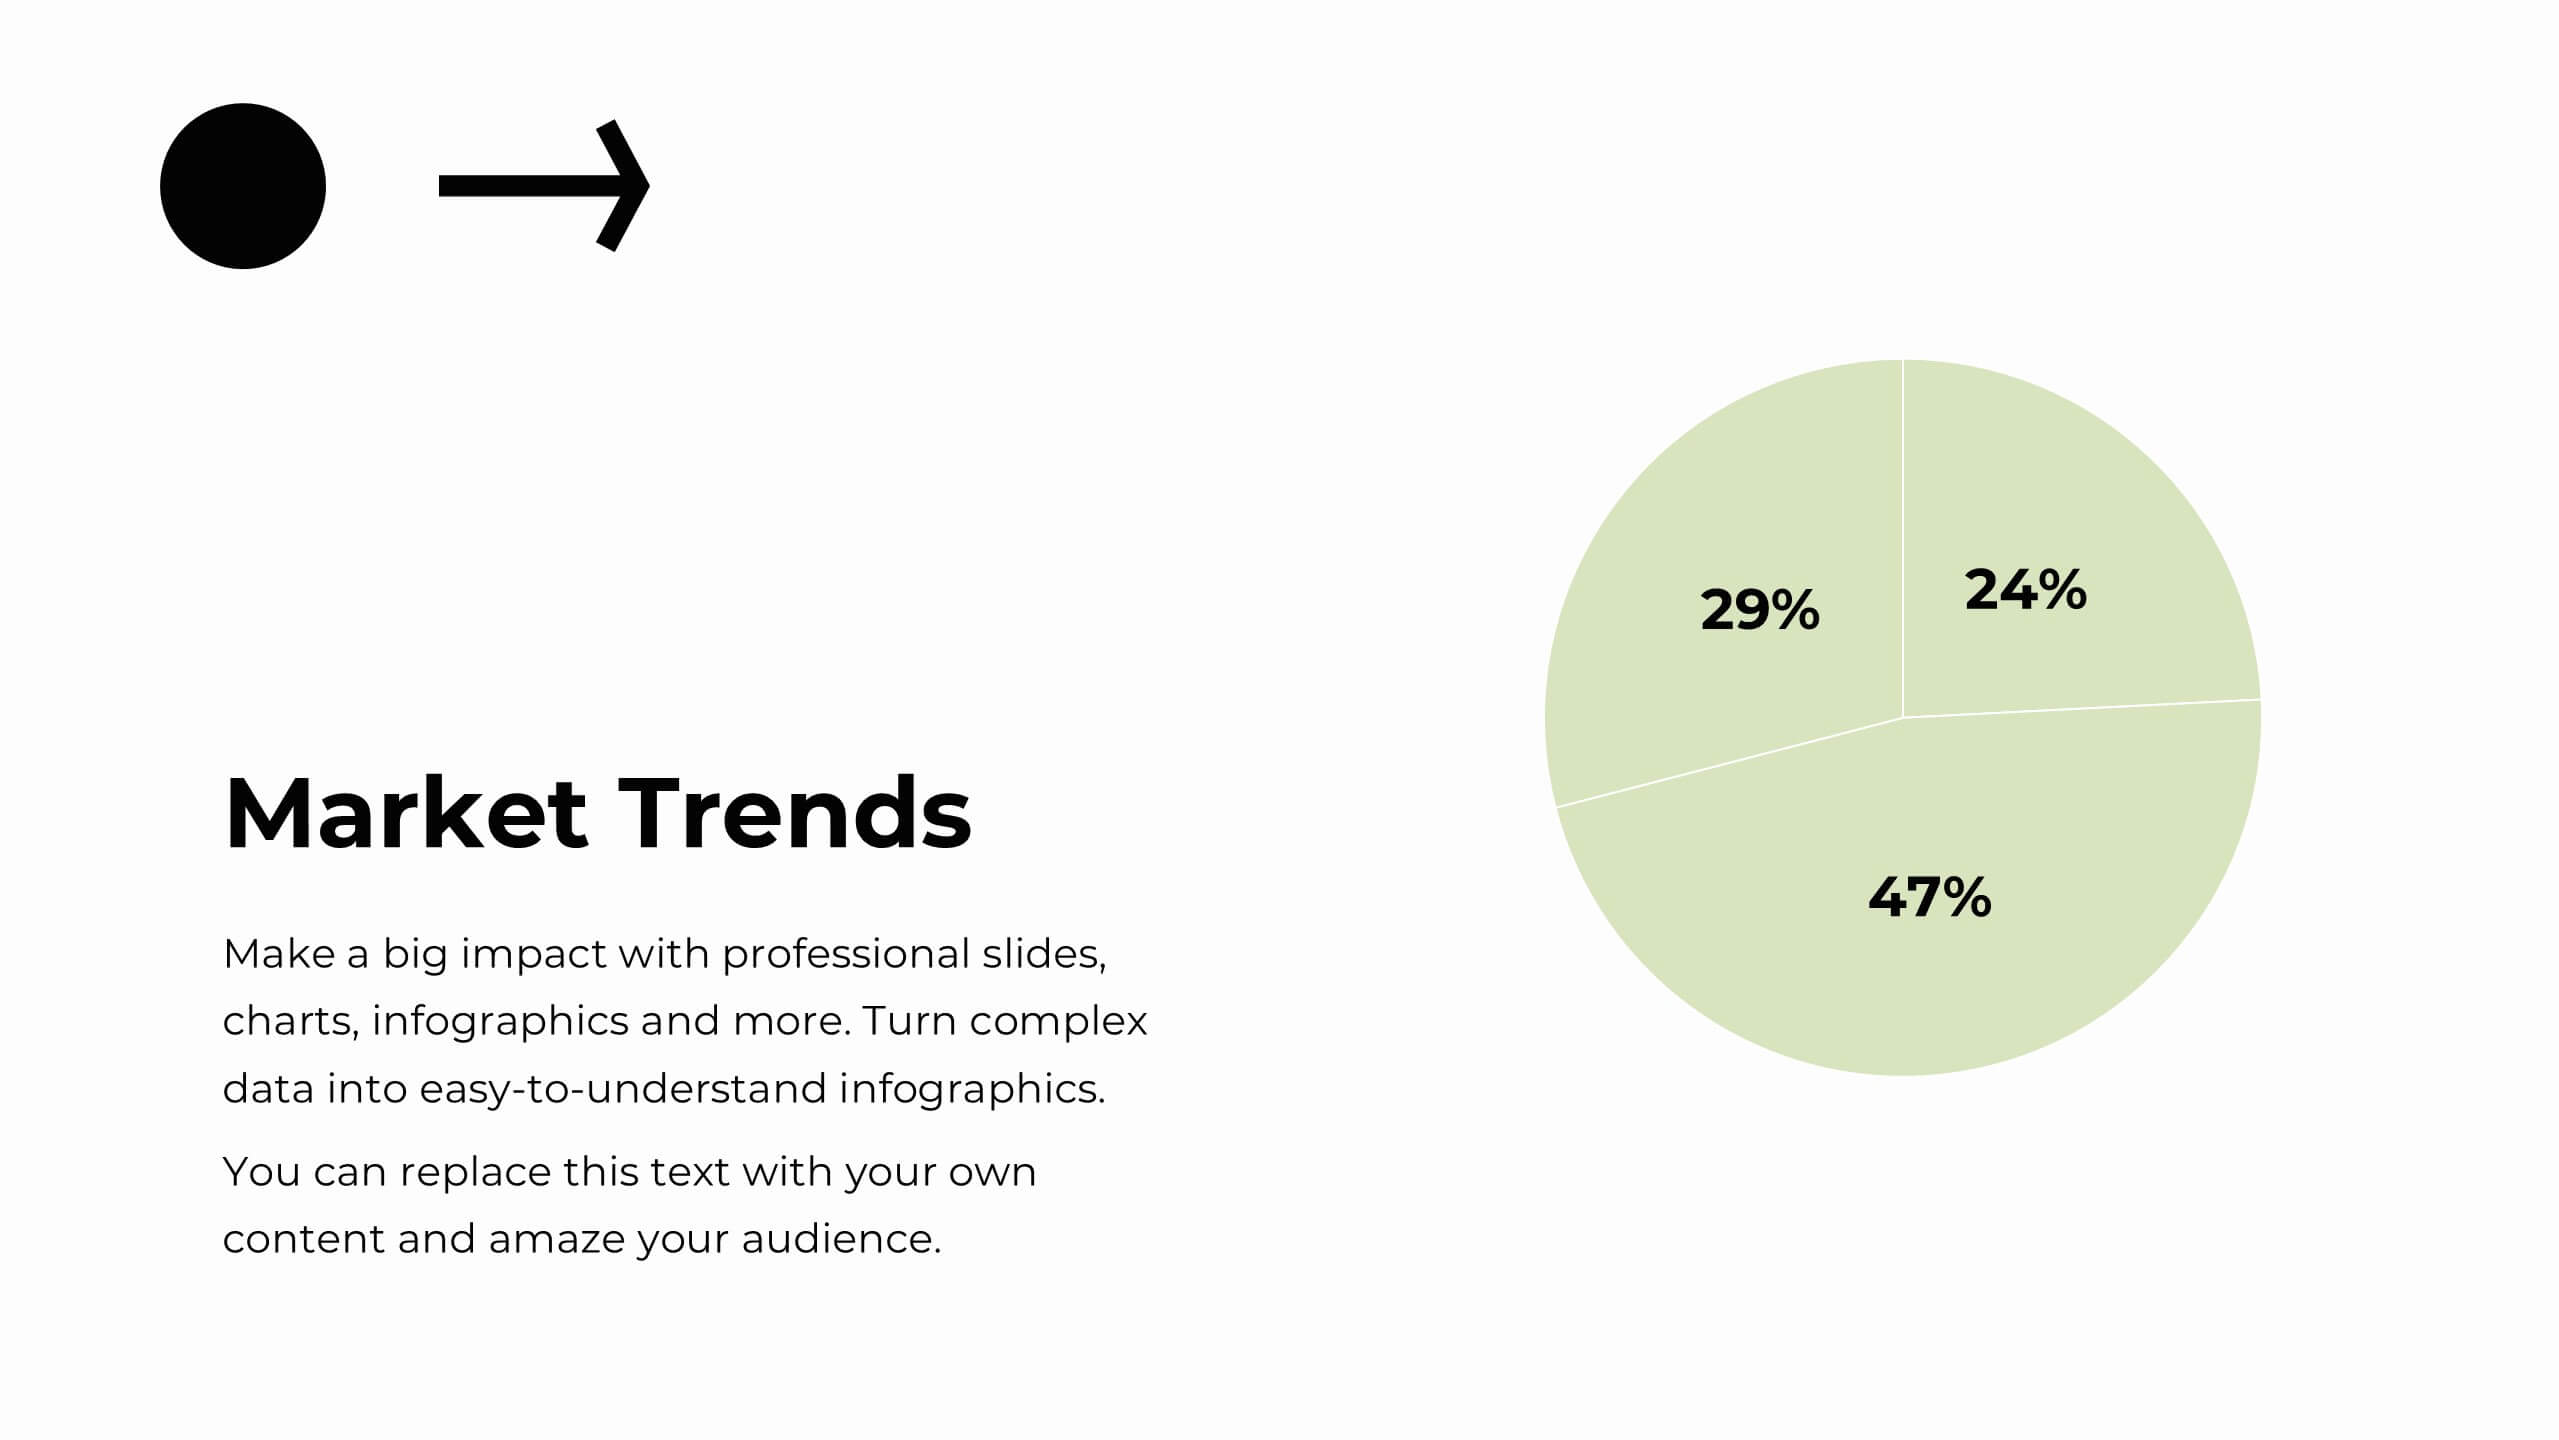
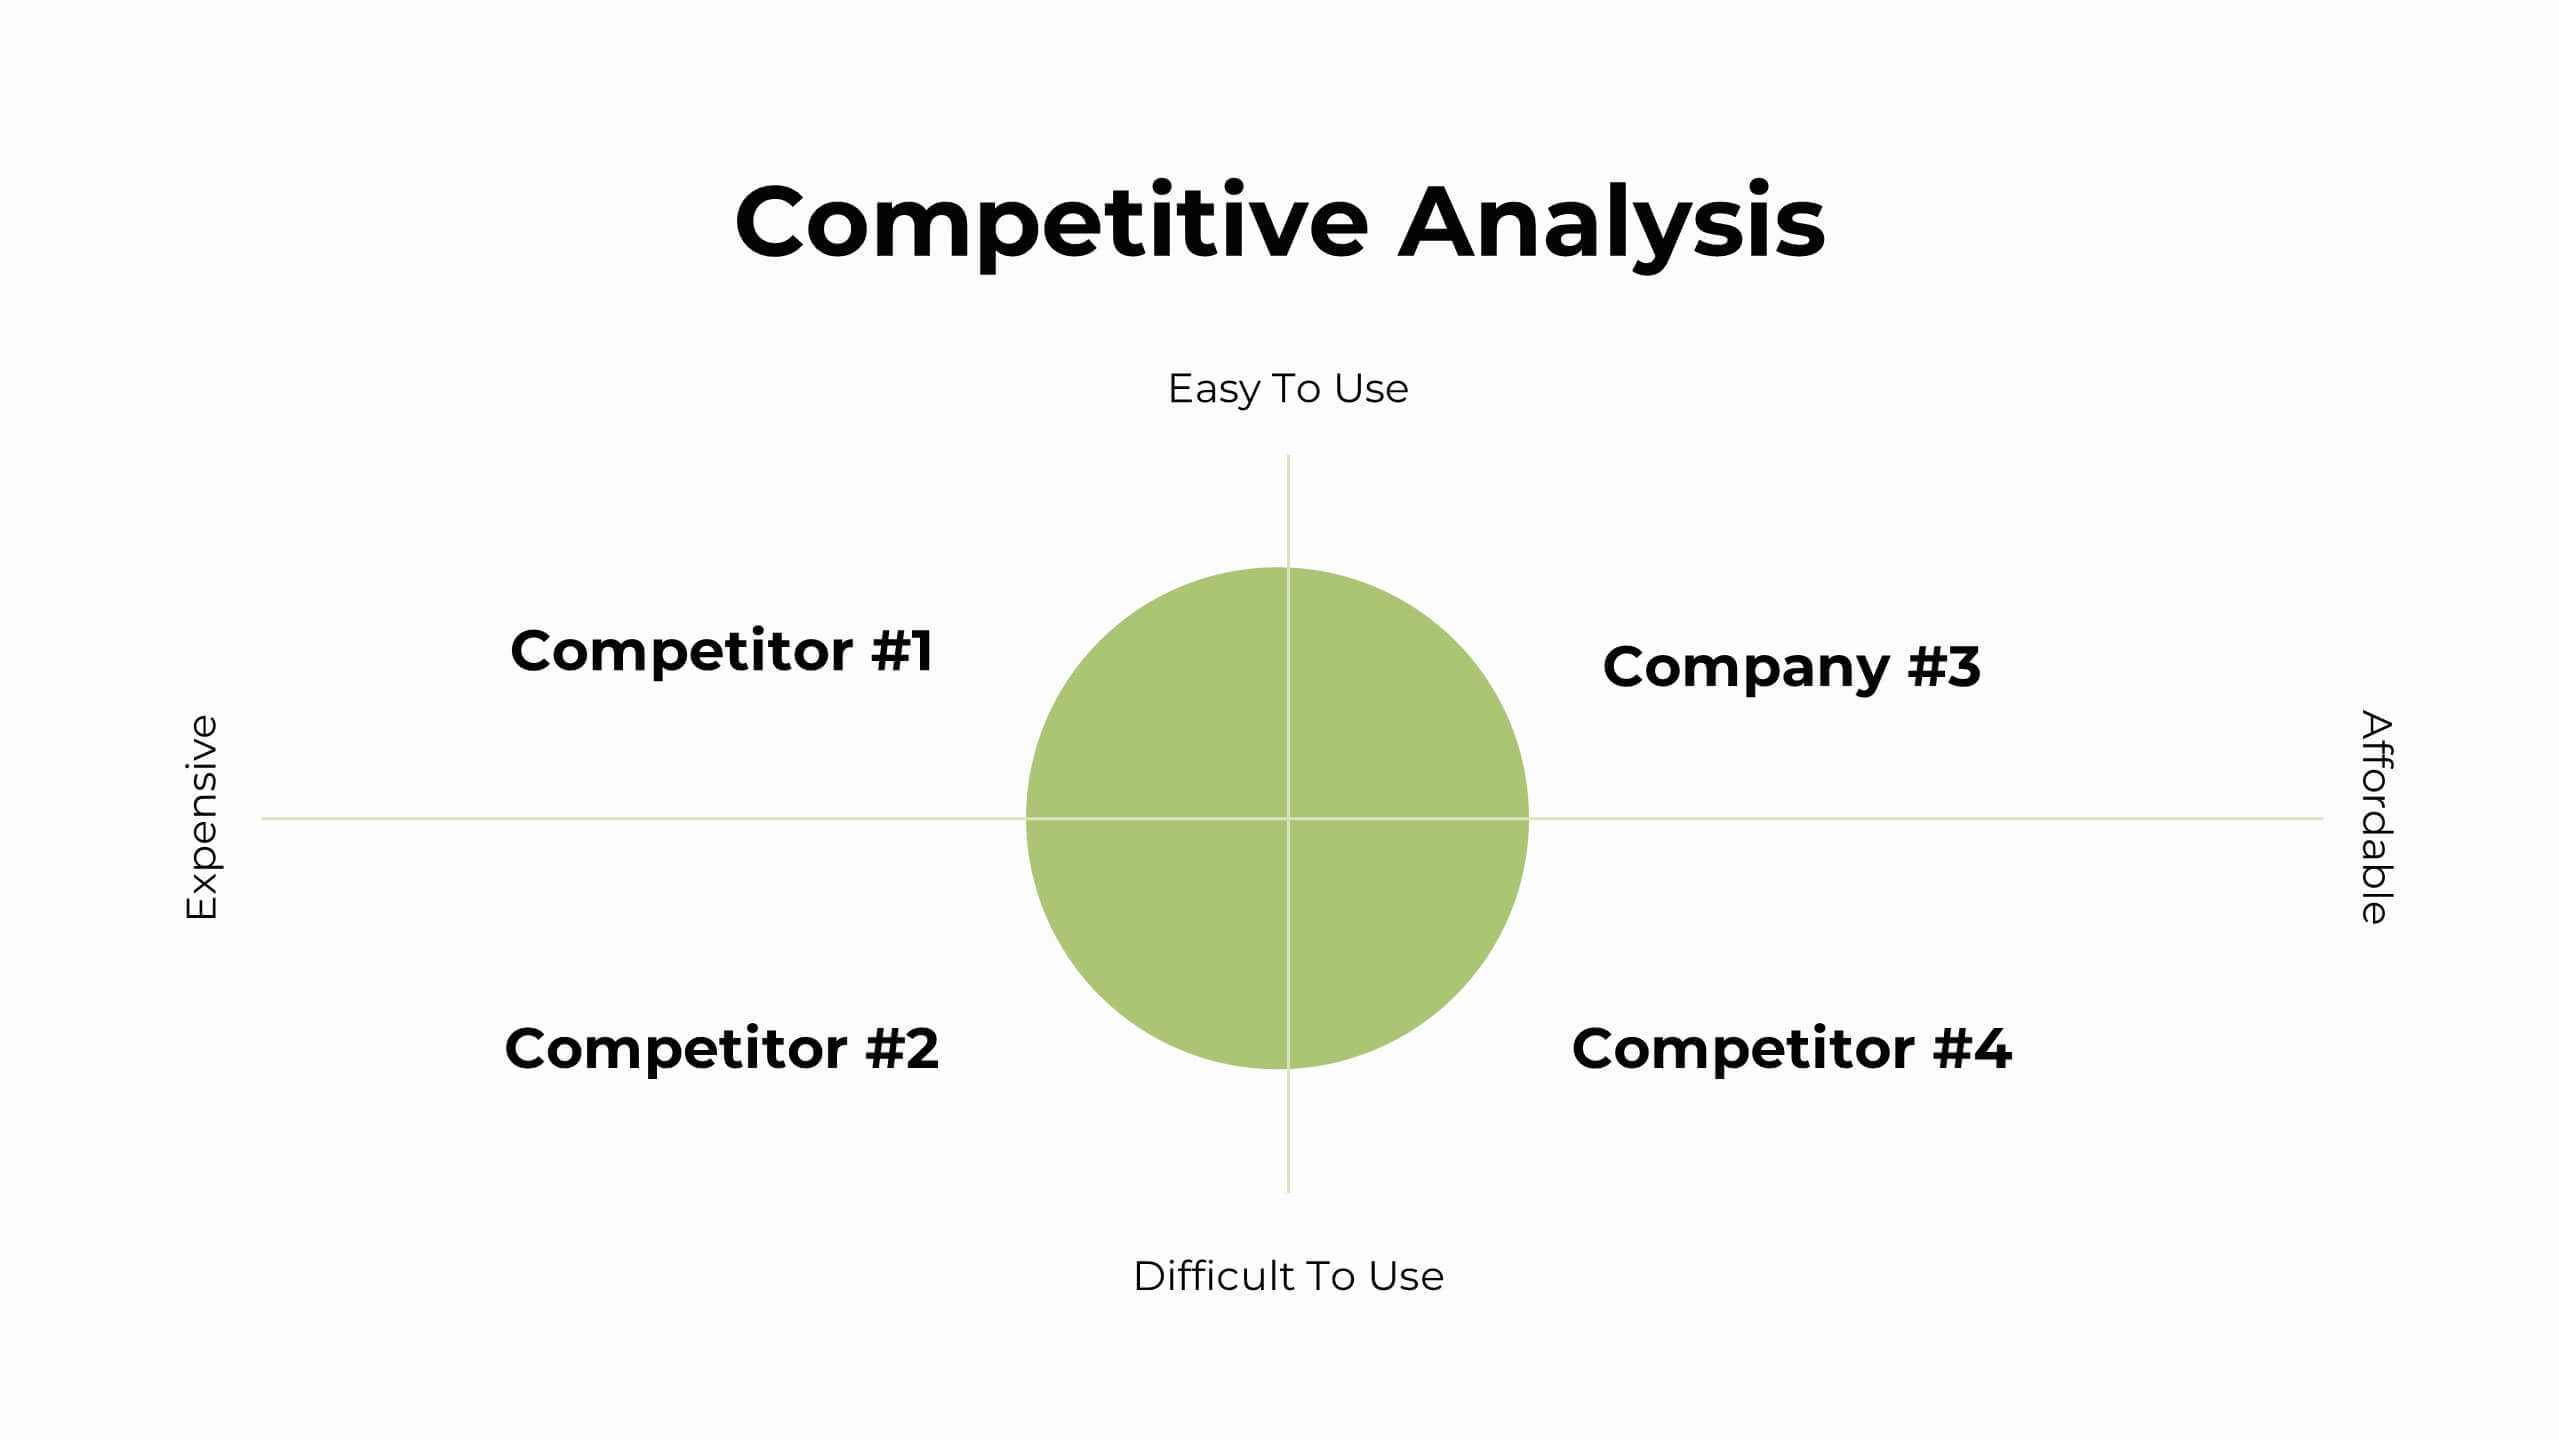
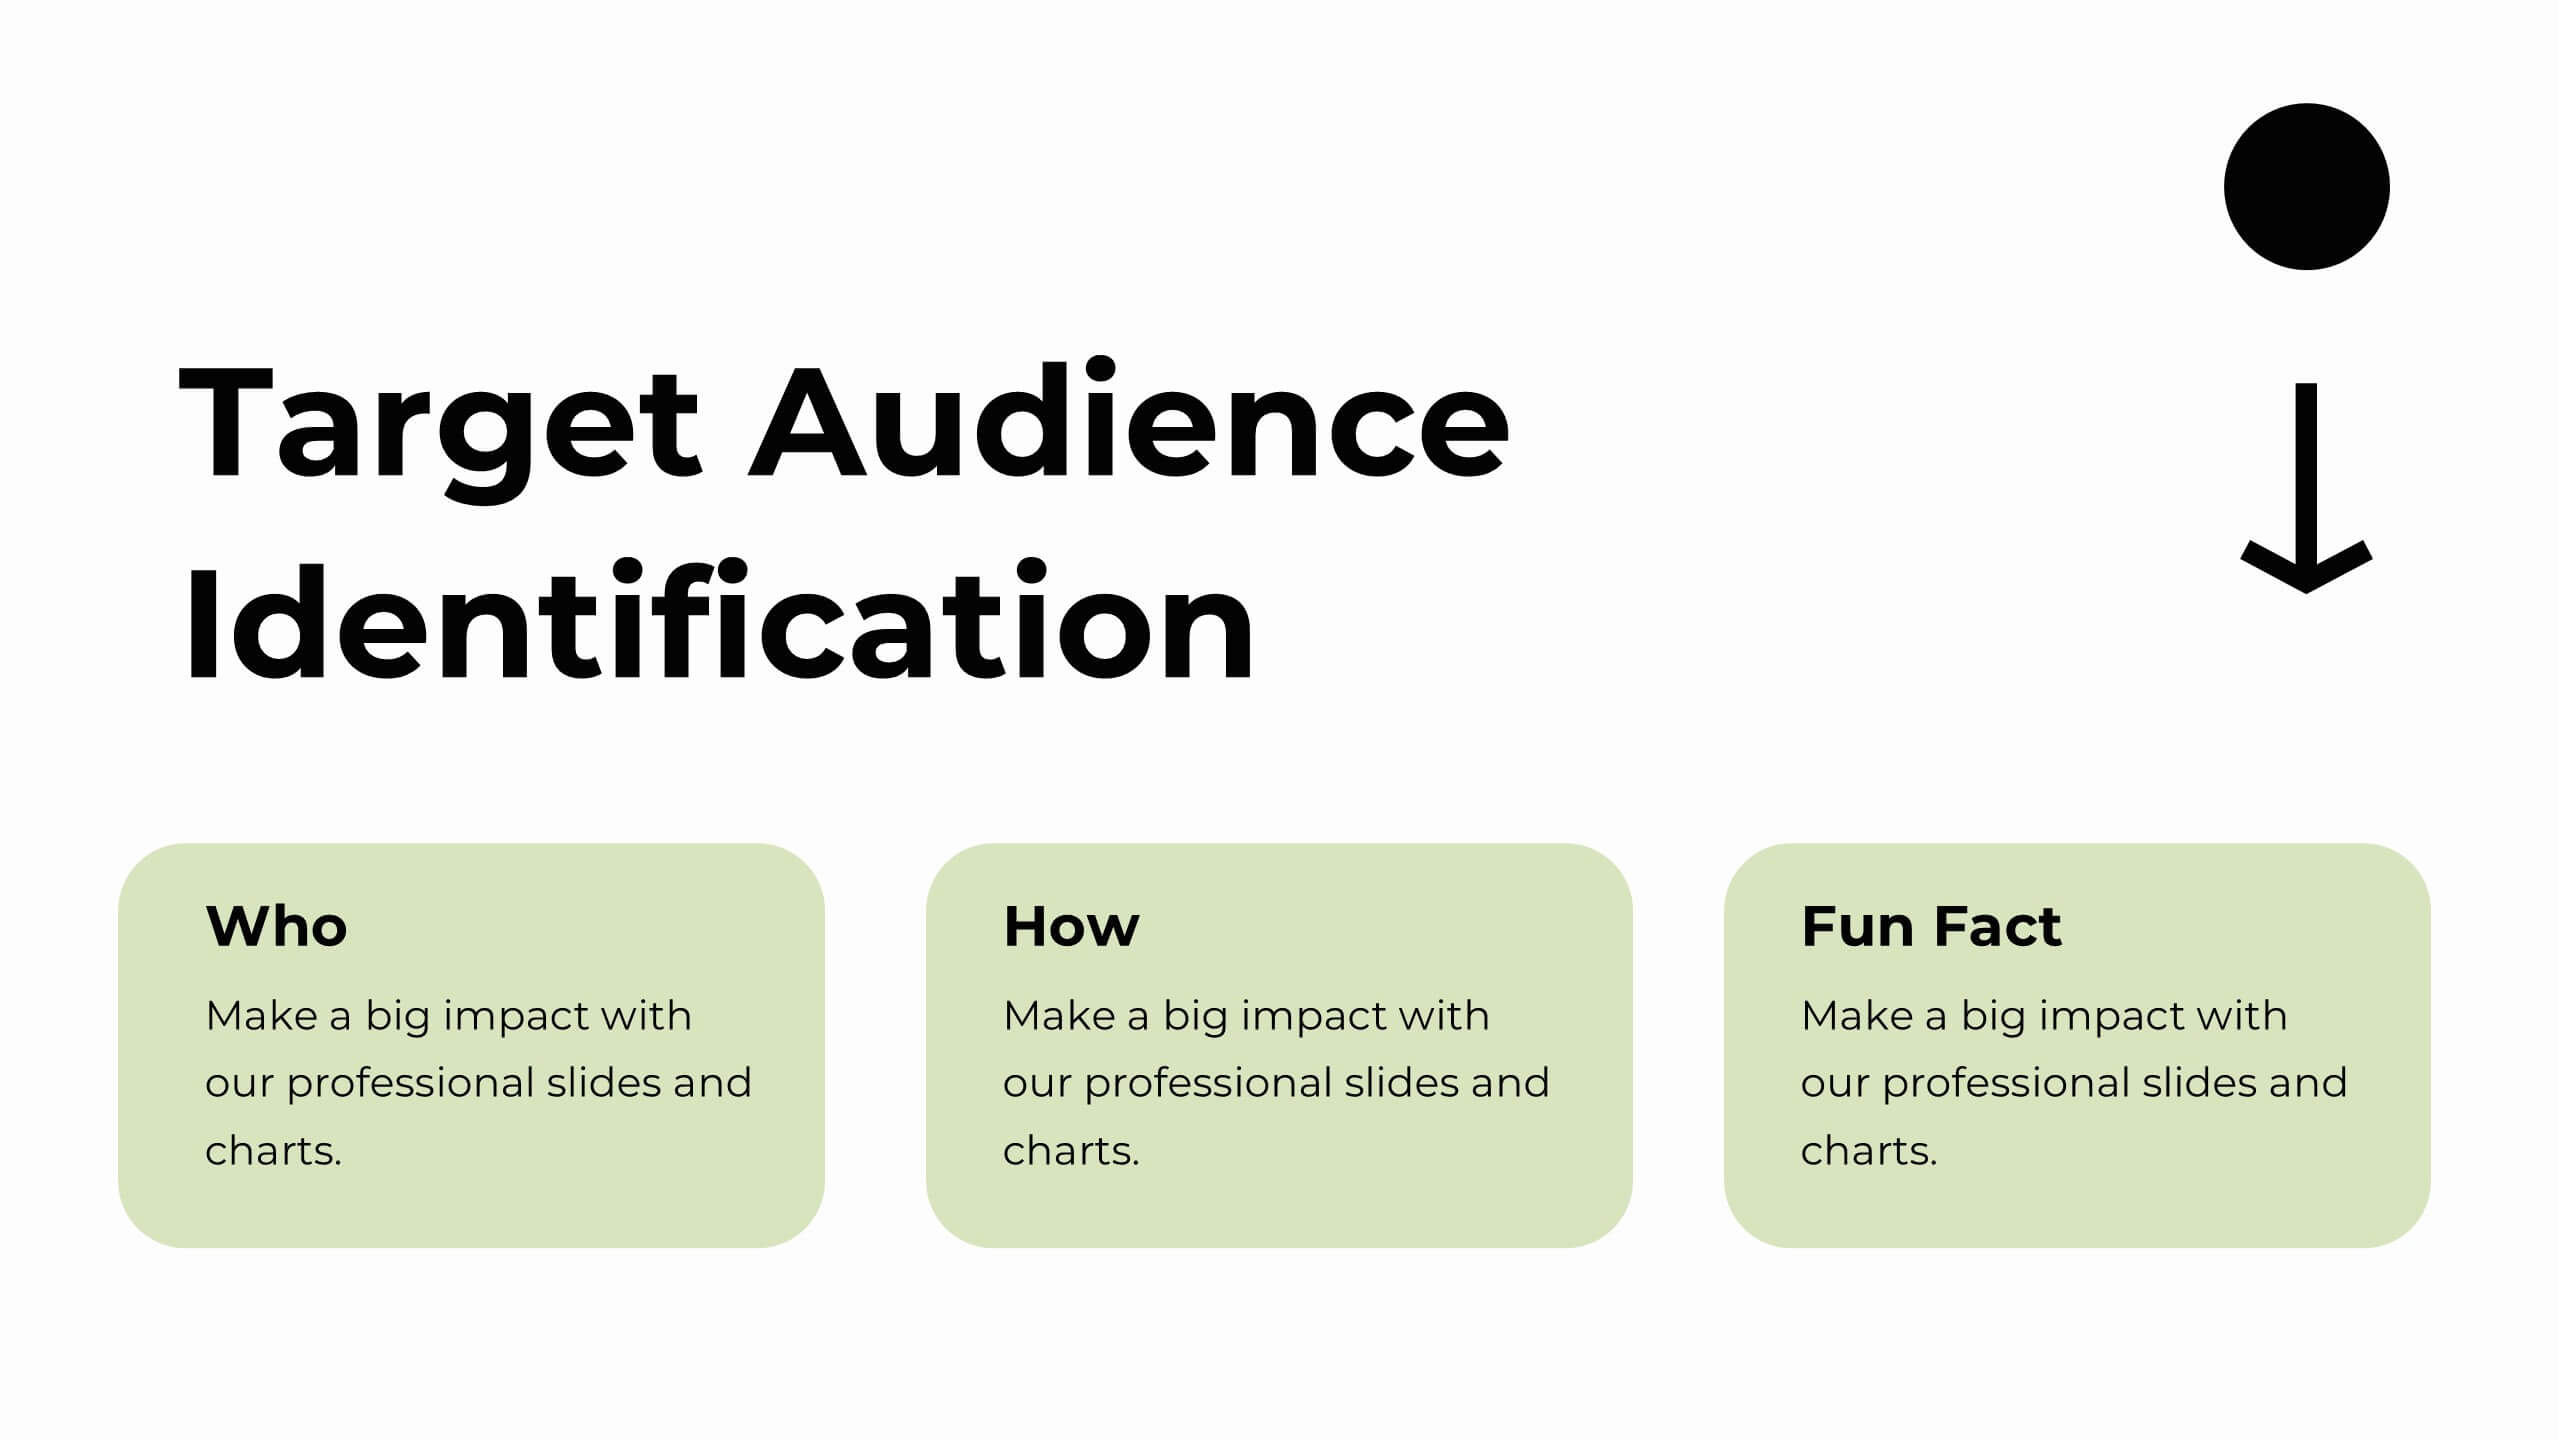
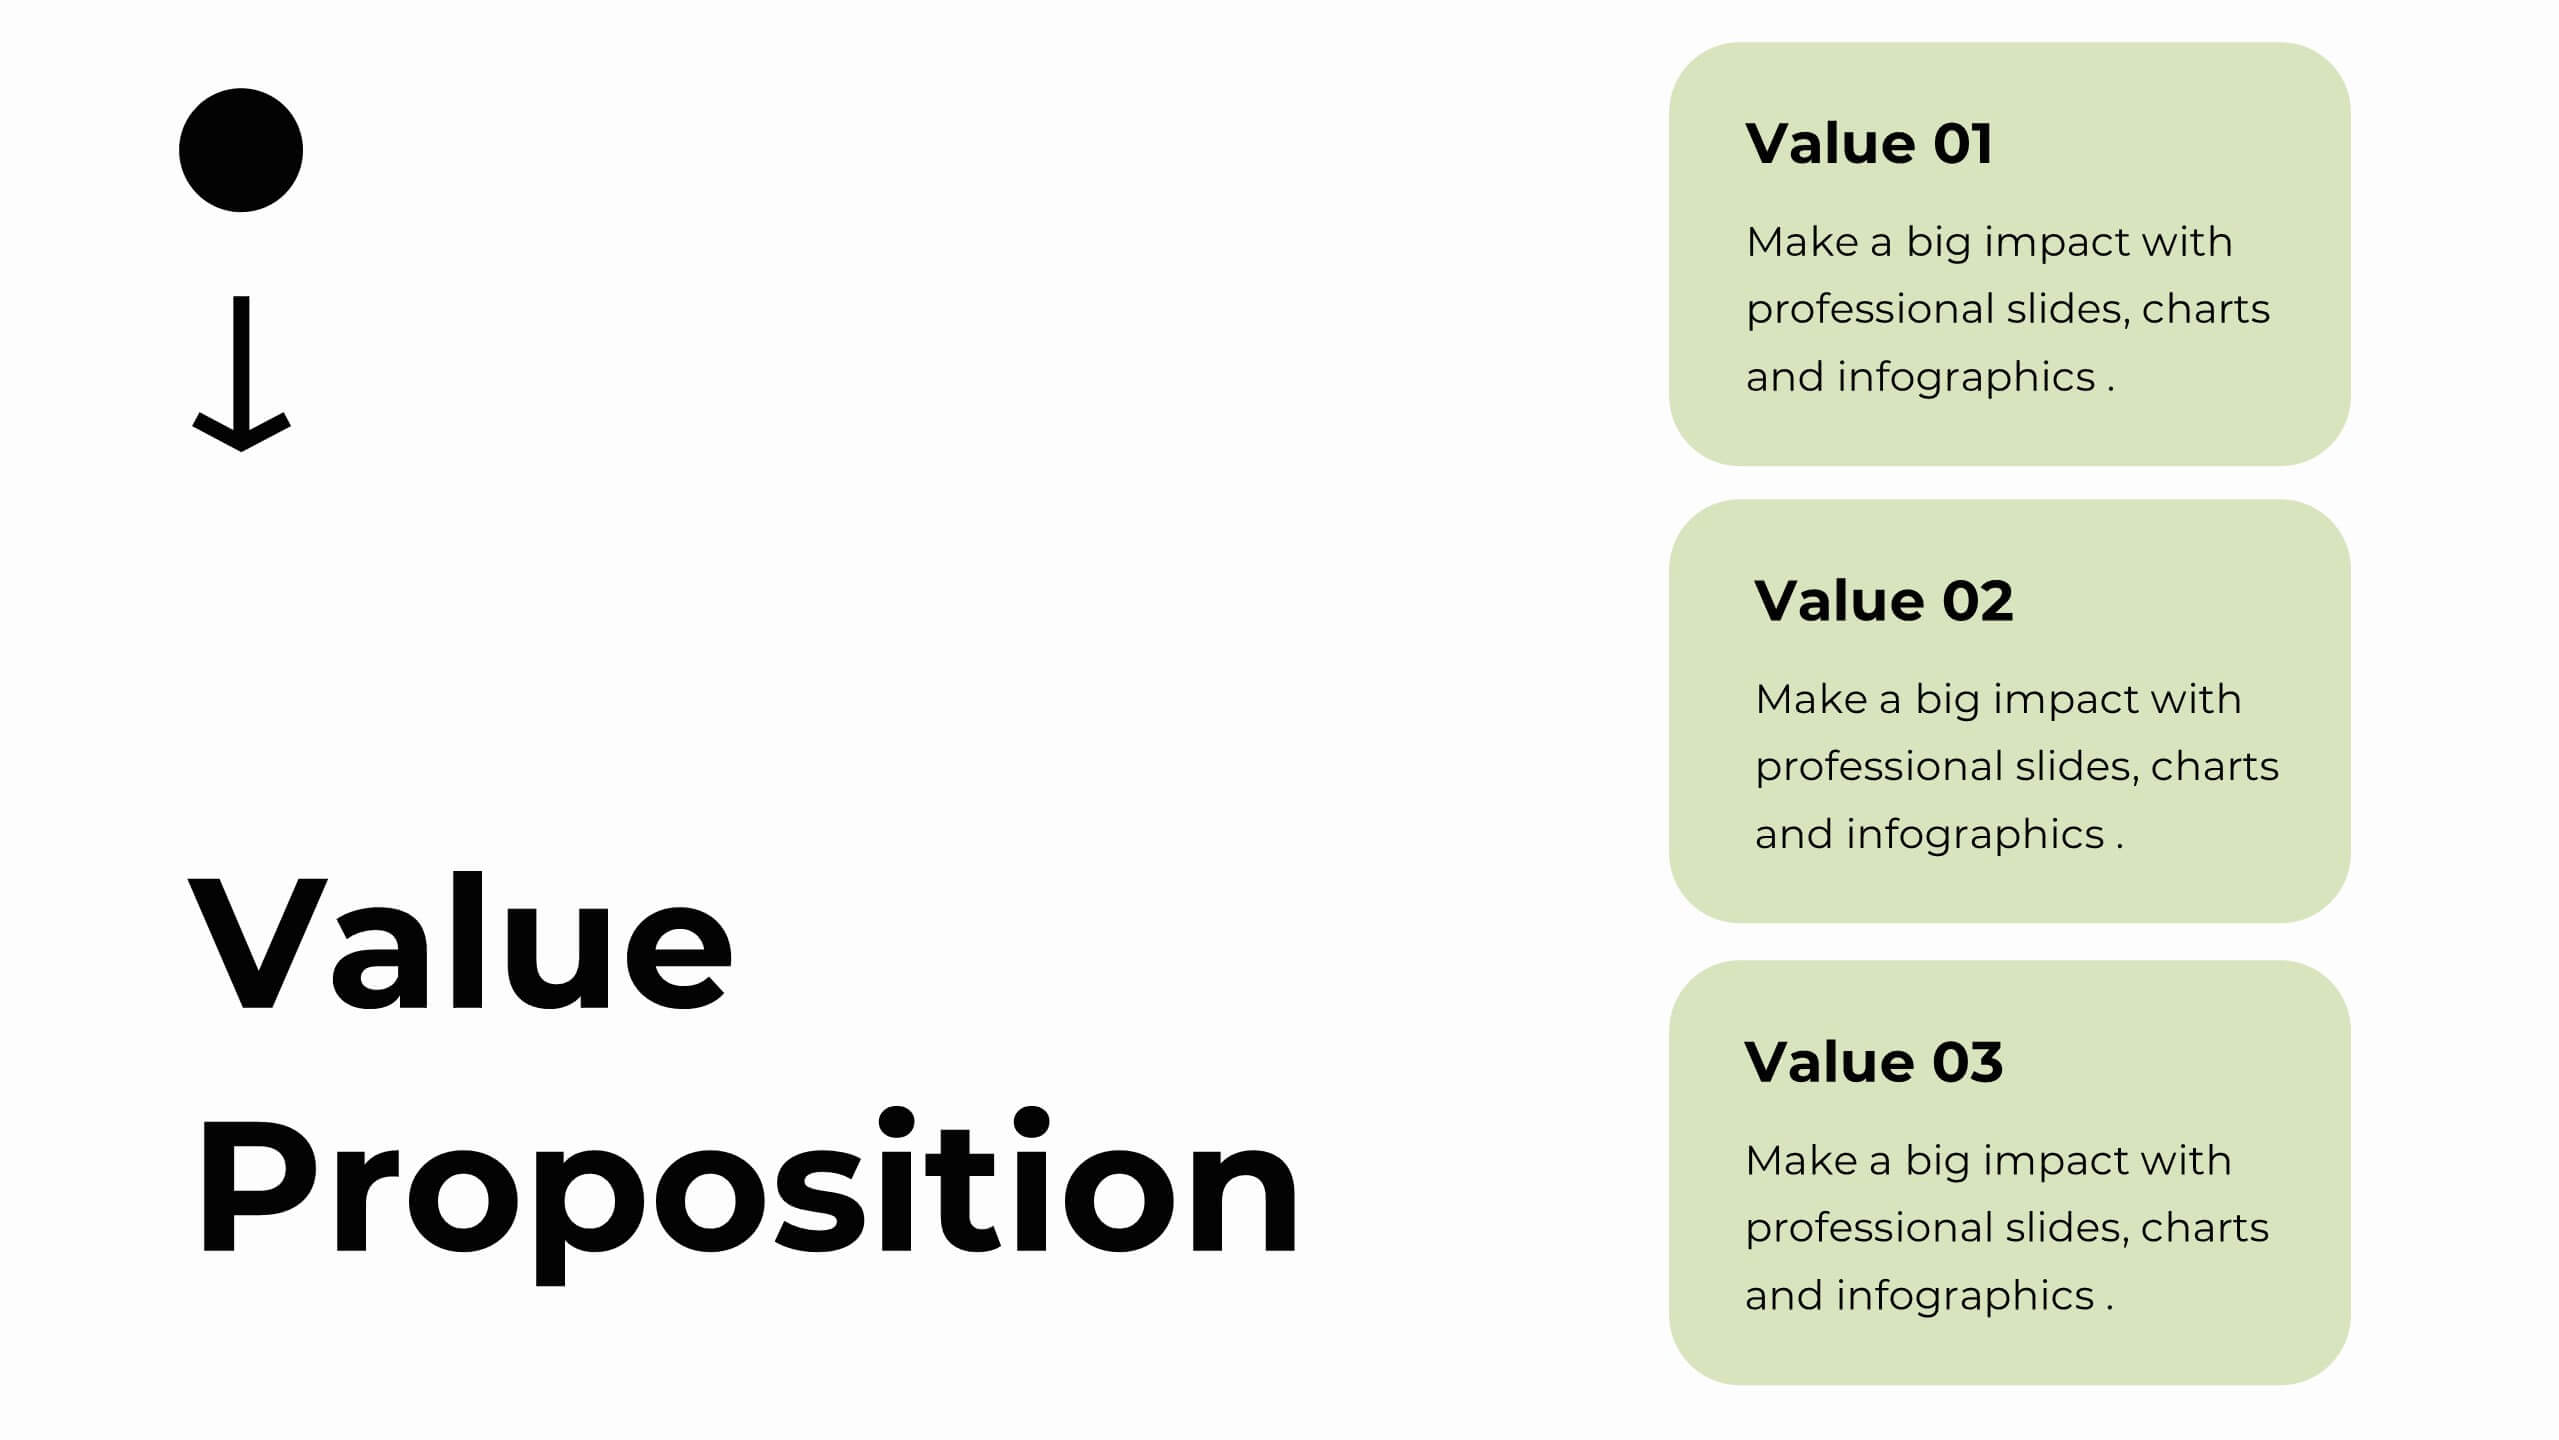
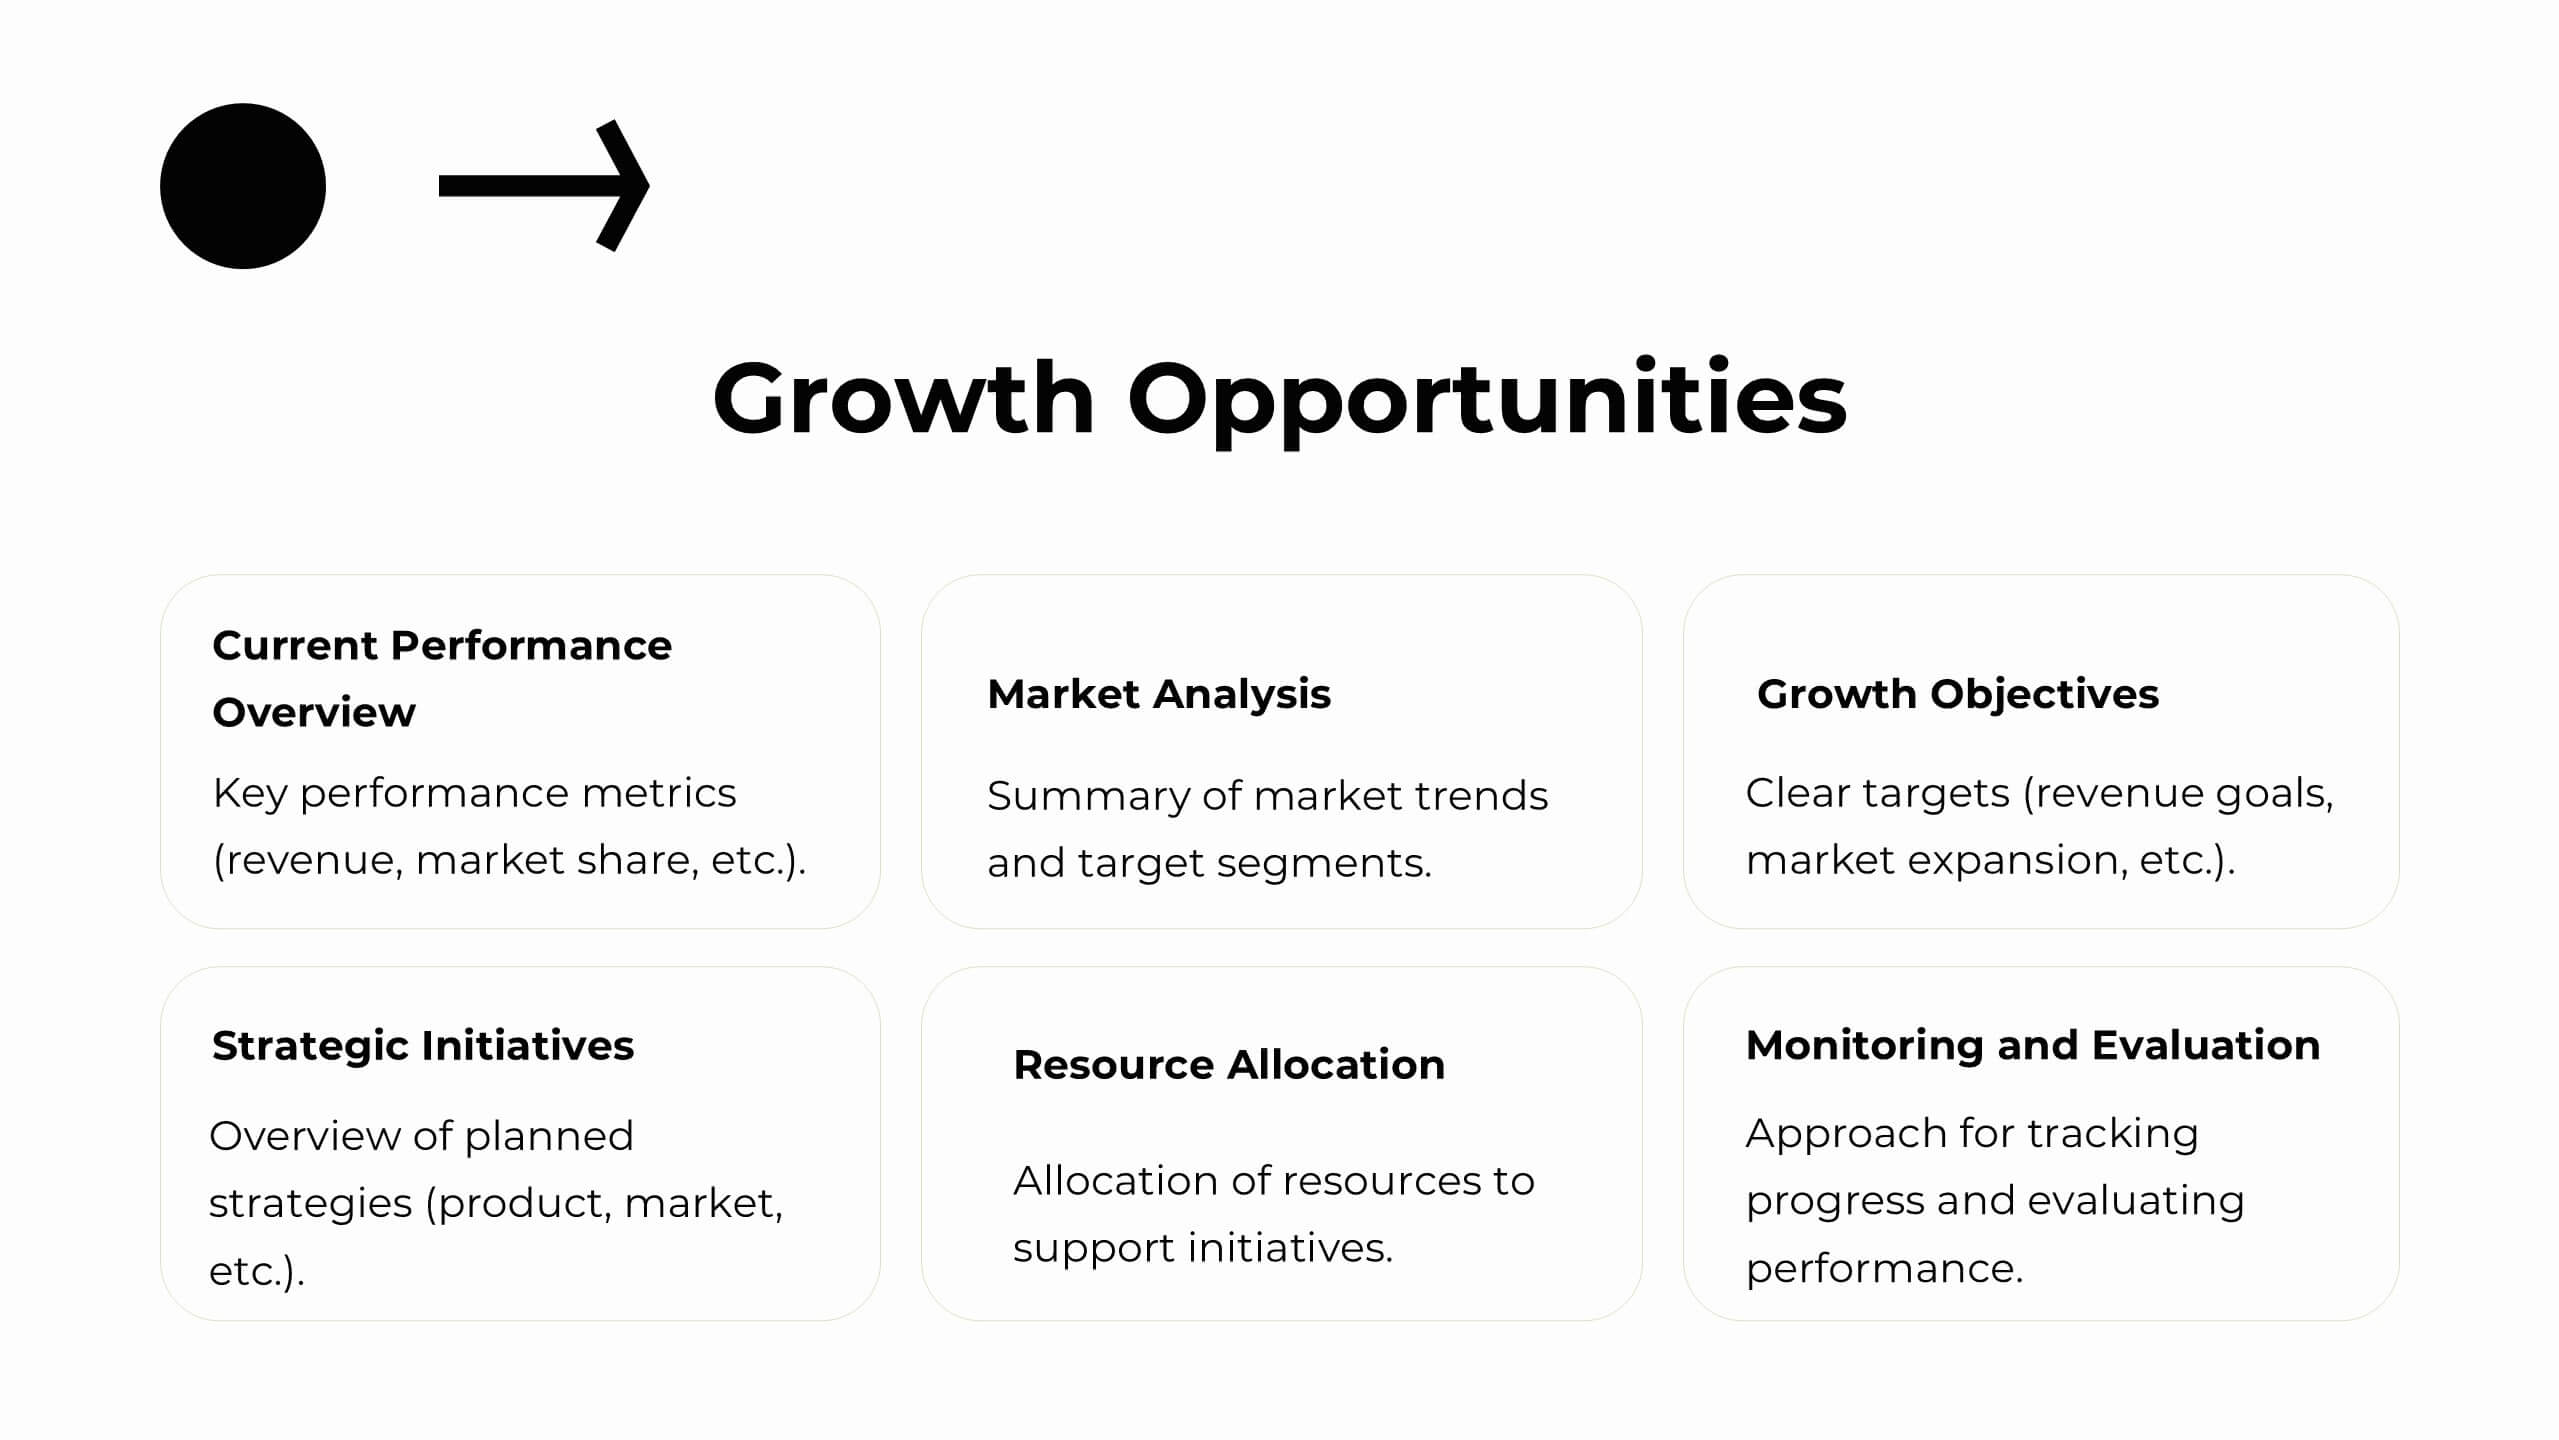
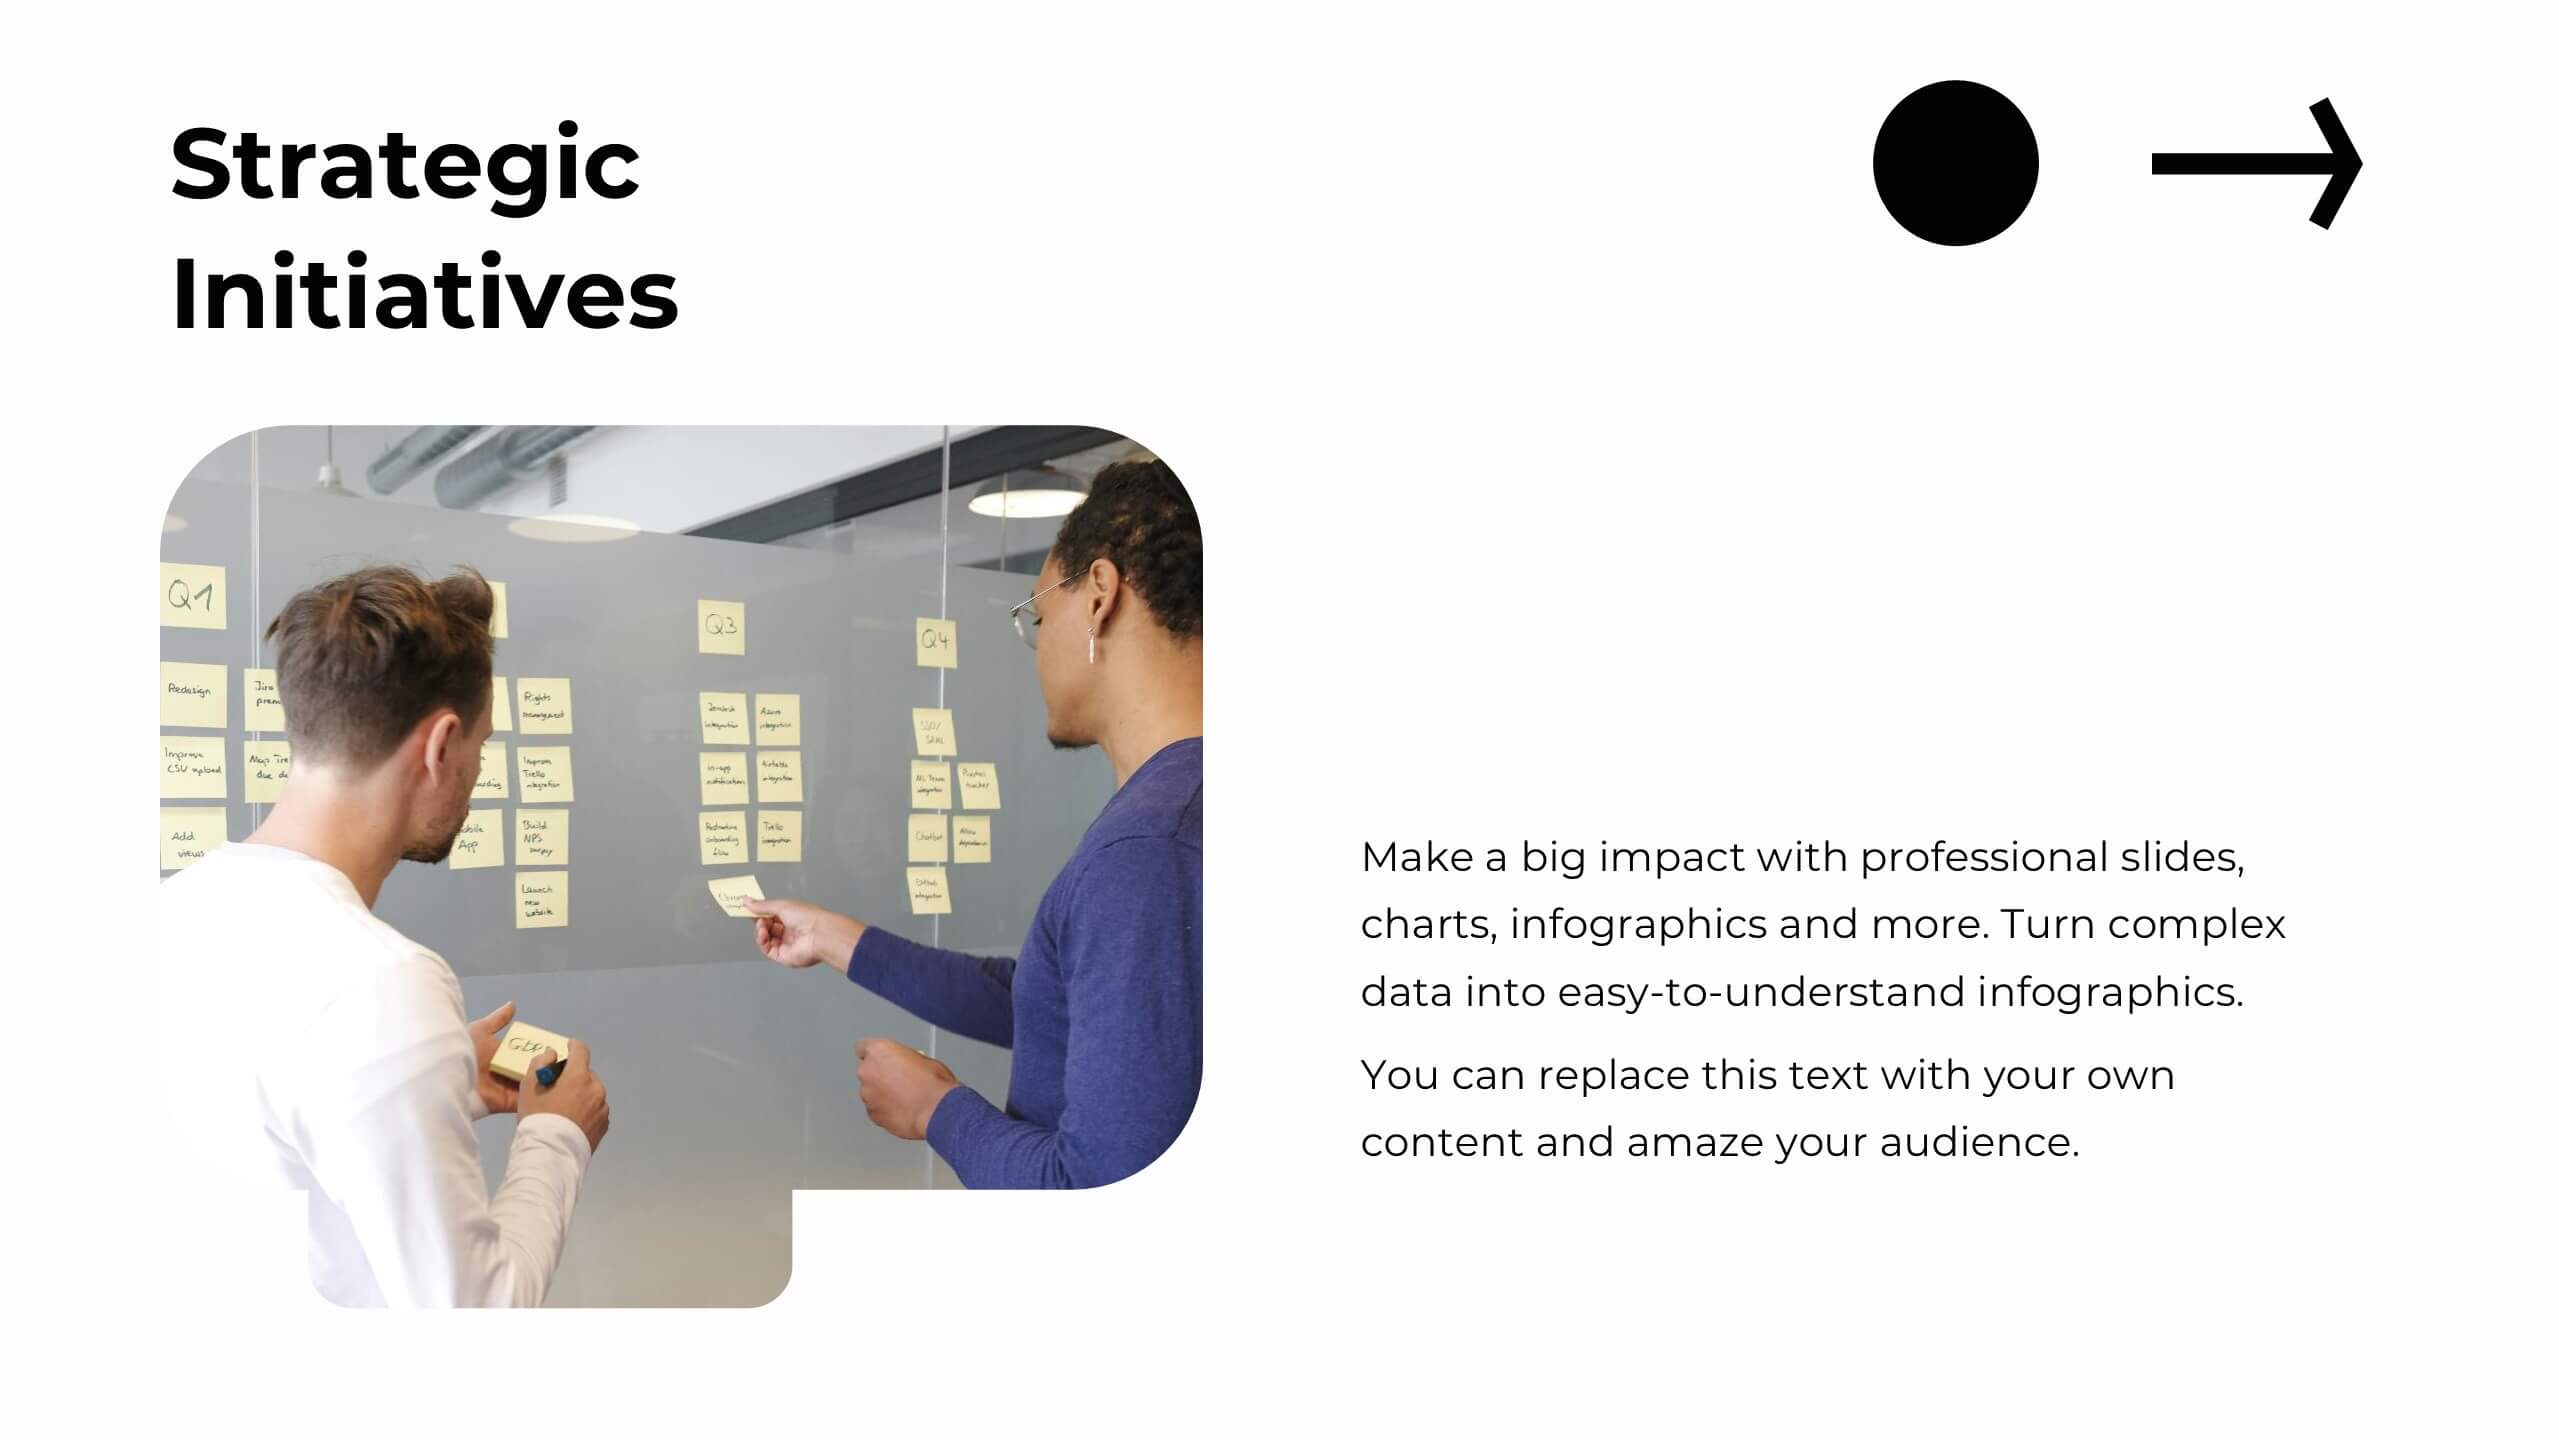
Zirconium Strategic Planning Report Presentation
Plan and present your strategies with precision using this comprehensive strategic planning report template! Designed for clear communication of goals, market trends, SWOT analysis, and growth opportunities, it’s perfect for aligning team objectives and driving success. Fully customizable and compatible with PowerPoint, Keynote, and Google Slides, this template is ideal for strategic initiatives and performance reviews.


26 diapositivas
E-commerce Presentation
Venture into the digital marketplace with a presentation template that embodies the innovative spirit of e-commerce. This template, with its vibrant colors and modern design elements, is tailored to highlight the fast-paced world of online retail. The slides offer a digital storefront for your ideas, from introducing the creative minds behind the operation to showcasing the latest trends in online shopping. Utilize engaging layouts to compare products, outline sales strategies, or highlight consumer behavior with clear, concise infographics. With promotional slide options to announce special deals and a design that captures the convenience and excitement of shopping with a click, this collection is an essential tool for marketers, online retailers, and startups. It’s optimized for conveying complex data in a user-friendly format, ensuring your audience stays engaged and informed. Compatible with PowerPoint, Keynote, and Google Slides, it’s the perfect cart to carry your message in the bustling online marketplace.


5 diapositivas
Global Market Trends World Map Presentation
Visualize your market insights with this sleek and professional Global Market Trends World Map slide. Designed to highlight key regional data with pinpoint accuracy, it’s ideal for presenting statistics, regional performance, or global expansion strategies. The sidebar gradient layout offers space for five categories, each linked to map locations. Fully customizable and compatible with PowerPoint, Keynote, and Google Slides.


5 diapositivas
Health Care Infographics
Taking care of your health is an investment in your future self and can lead to a happier and more fulfilling life. These vertical health care infographics are visual representations of information related to health care. They can cover a wide range of topics, such as disease prevention, medical treatments, and patient care. These are designed to be easily understandable and engaging for a general audience. They use colorful graphics and illustrations to convey complex information in an eye-catching manner. These also include graphs, diagrams text boxes, and other design elements to highlight key information.


6 diapositivas
Unique Intersection Comparison Diagram
Illustrate complex relationships with clarity using the Unique Intersection Comparison Diagram Presentation. This visually engaging 5-circle diagram highlights overlaps and distinct points, ideal for showcasing cross-functional collaboration, multi-variable strategies, or layered comparisons. Each segment supports titles and brief text, making it perfect for business planning, product features, or audience segmentation. Fully editable in PowerPoint, Keynote, and Google Slides.


6 diapositivas
Work from Home Best Practices Presentation
The "Work from Home Best Practices" presentation template is thoughtfully designed to display metrics and insights for remote work effectiveness. Each slide provides visual elements like bar graphs, line charts, and icon grids to represent various data points such as weekly activity percentage, hours worked, and number of projects managed. This setup is ideal for illustrating best practices and benchmarks in remote work environments, enabling clear communication of goals, achievements, and areas for improvement. The template uses a clean and professional layout with plenty of space for customization, making it a versatile tool for remote teams looking to optimize their workflows and productivity.


10 diapositivas
Task and Role Allocation Matrix Presentation
Organize your team's responsibilities effectively with our Task and Role Allocation Matrix presentation template. Perfect for project managers and coordinators, this tool offers a clear, visual breakdown of who does what, using a color-coded system to assign tasks across multiple roles. It's ideal for streamlining project processes and ensuring accountability. Compatible with PowerPoint, Keynote, and Google Slides, this template is a must-have for any organized project team.


6 diapositivas
Technology Education Infographic
Technology education refers to the teaching and learning of skills, knowledge, and concepts related to technology. This infographic template is designed to present key information about technology education in a concise manner. It aims to educate and inform the audience about the importance of technology education and its impact on students' learning and future careers. The template utilizes visually appealing icons, illustrations, and graphics to enhance understanding and engagement. It includes images of computers, coding symbols, robots, and other technology-related visuals that help to reinforce the information presented.


5 diapositivas
Side-by-Side Features Comparison Presentation
Clearly compare product or service features with the Side-by-Side Feature Comparison Presentation. This layout is perfect for showcasing pros and cons, plan differences, or feature breakdowns across two options. With a clean visual structure and customizable labels, it's ideal for decision-making slides. Compatible with Canva, PowerPoint, Keynote, and Google Slides.


6 diapositivas
Sales Strategy 30-60-90 Day Plan Presentation
Drive sales success with this structured 30-60-90 day strategy template! Designed to help sales teams and professionals set clear objectives, track progress, and optimize performance, this layout ensures a smooth transition from planning to execution. Fully customizable and compatible with PowerPoint, Keynote, and Google Slides for seamless presentations.


4 diapositivas
Infrastructure and Construction Industry Presentation
Showcase key developments in the Infrastructure and Construction Industry with this visually structured template. Ideal for project managers, urban planners, and engineers, it highlights construction phases, investment data, and industry insights. Fully customizable and compatible with PowerPoint, Keynote, and Google Slides for seamless integration into your professional presentations.


7 diapositivas
Agile Circle Methodology Infographic Presentation
Agile Methodology is a flexible and adaptive approach to project management that values customer satisfaction, teamwork, and continuous improvement. Our Agile Methodology template is perfect for academic or work presentation projects. This template is super easy to use and works with Powerpoint, Keynote, and Google Slides. It has a minimal design with, bright colors that will keep your audience engaged. With this template, you can learn all about Agile Methodology in a way that is visually appealing. Use this template to see how you and your team work more efficiently and effectively.


21 diapositivas
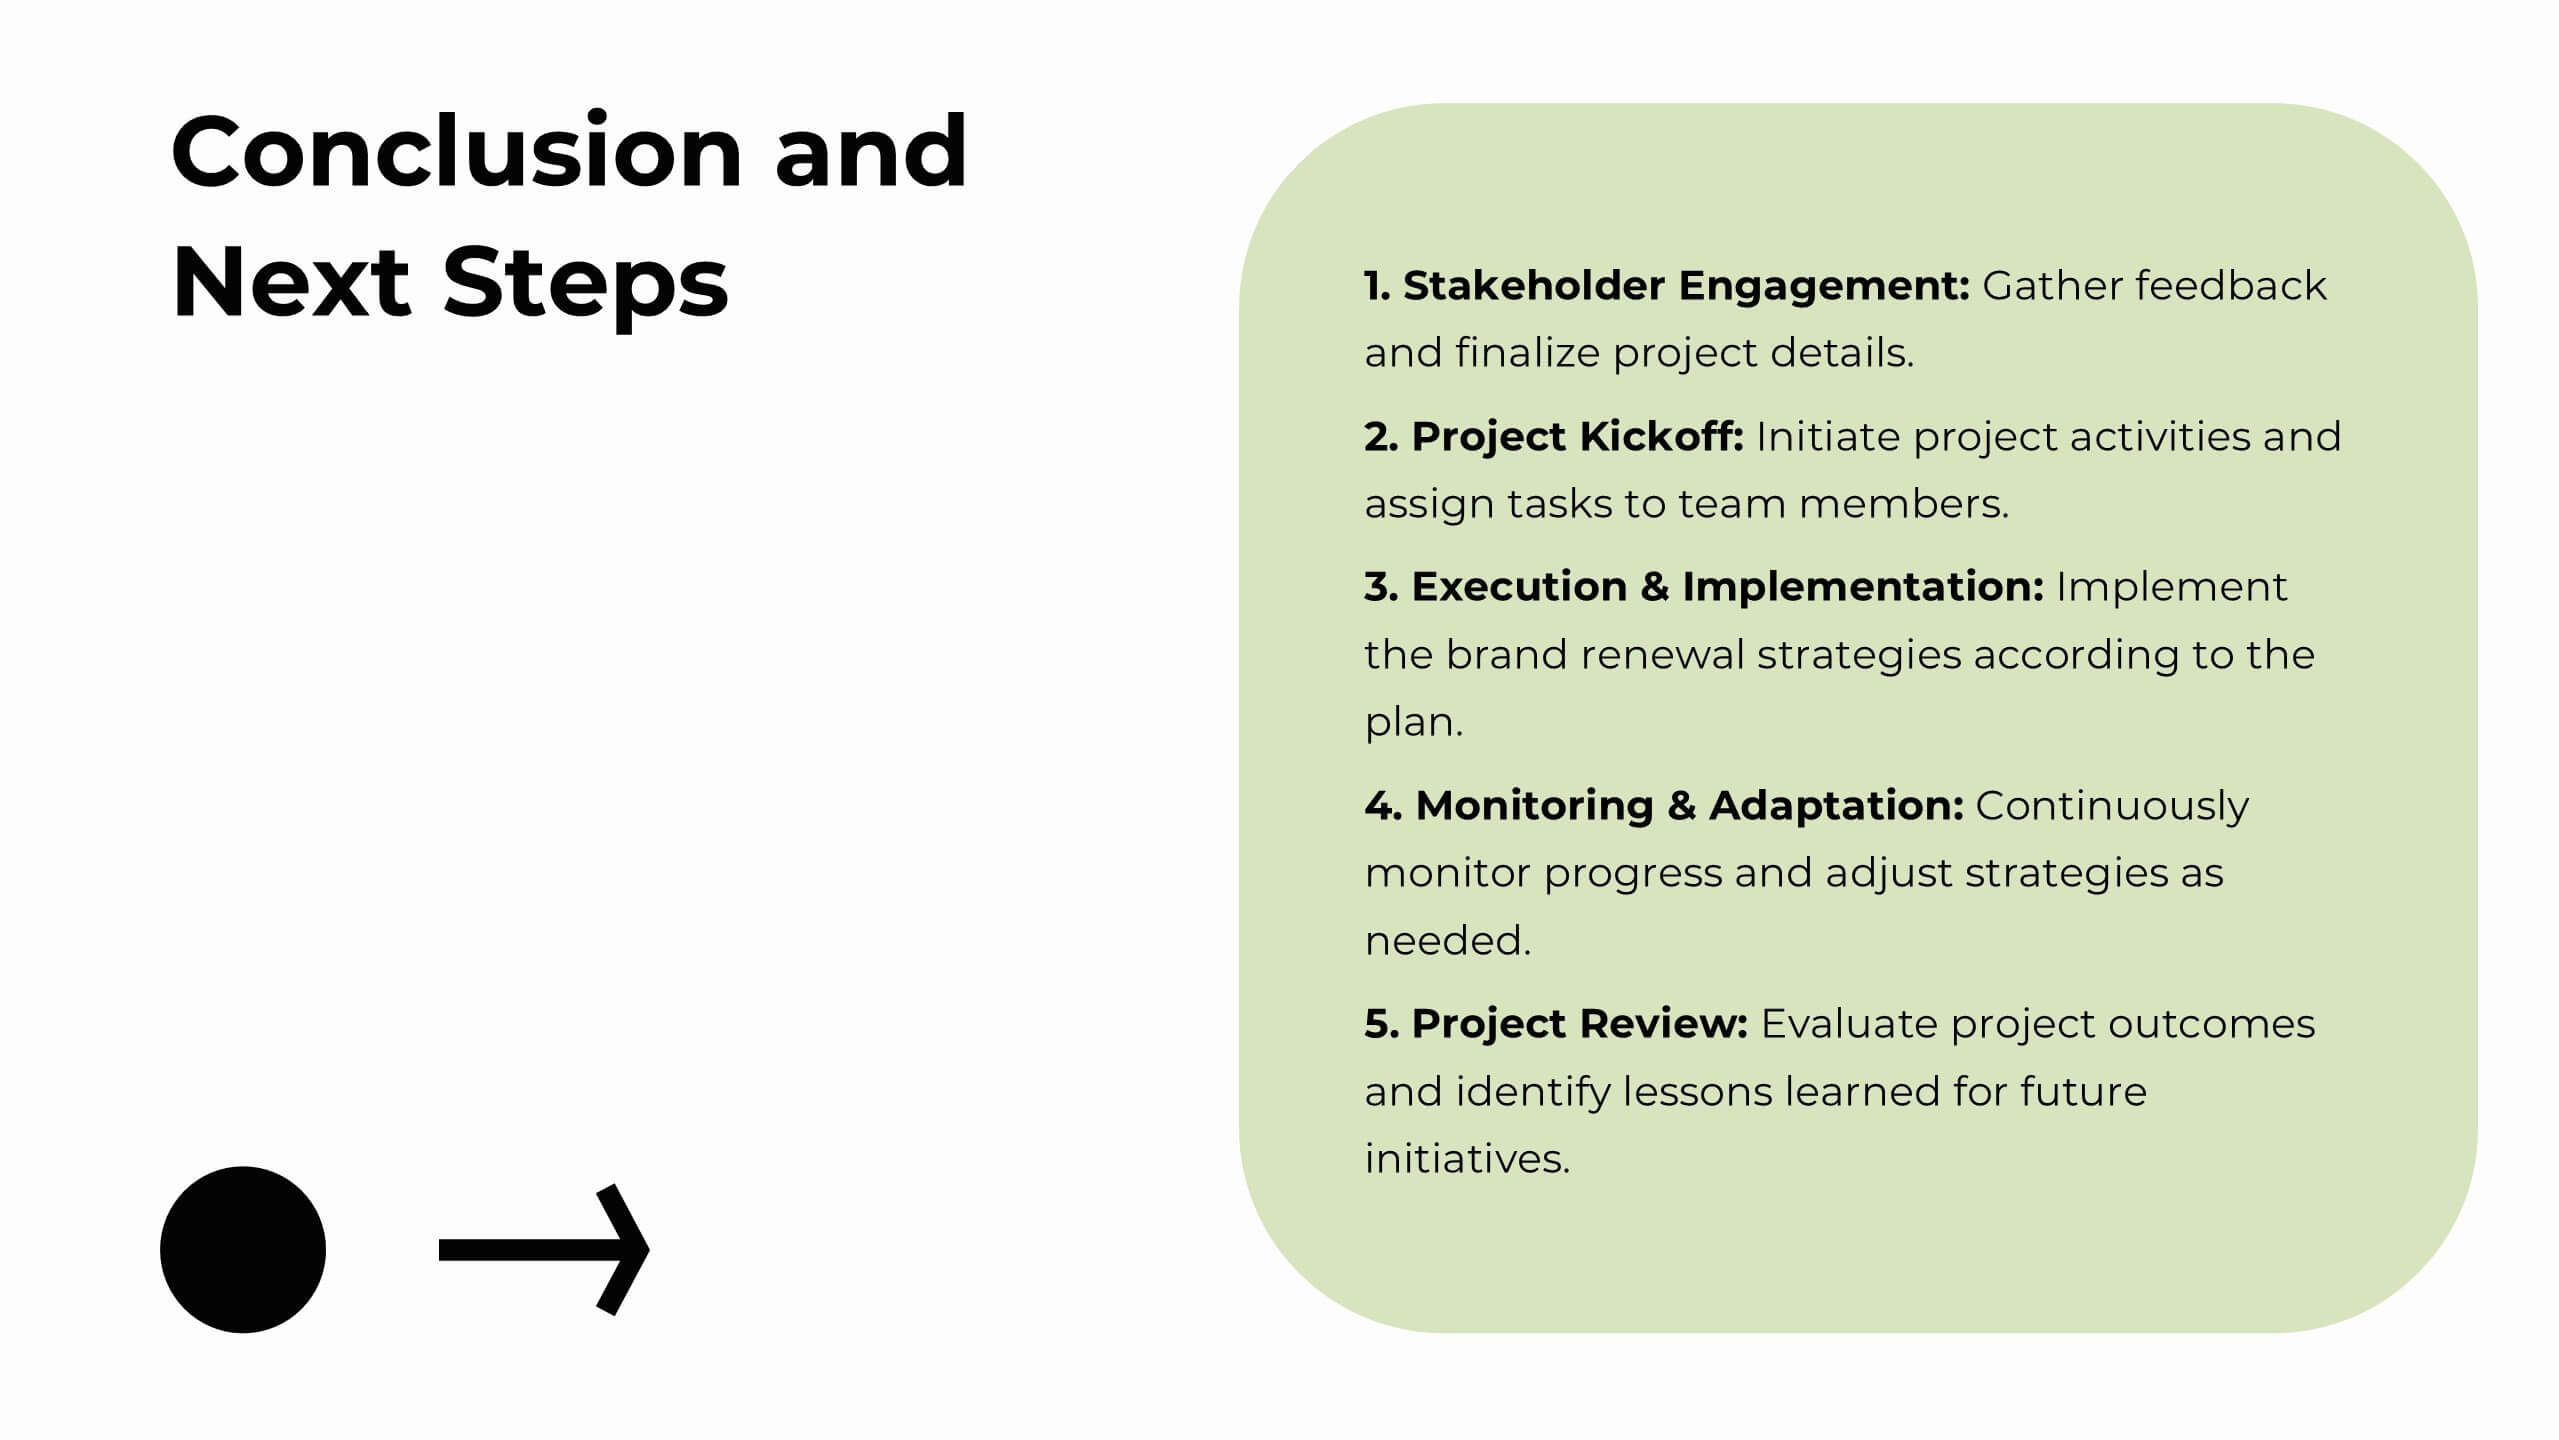
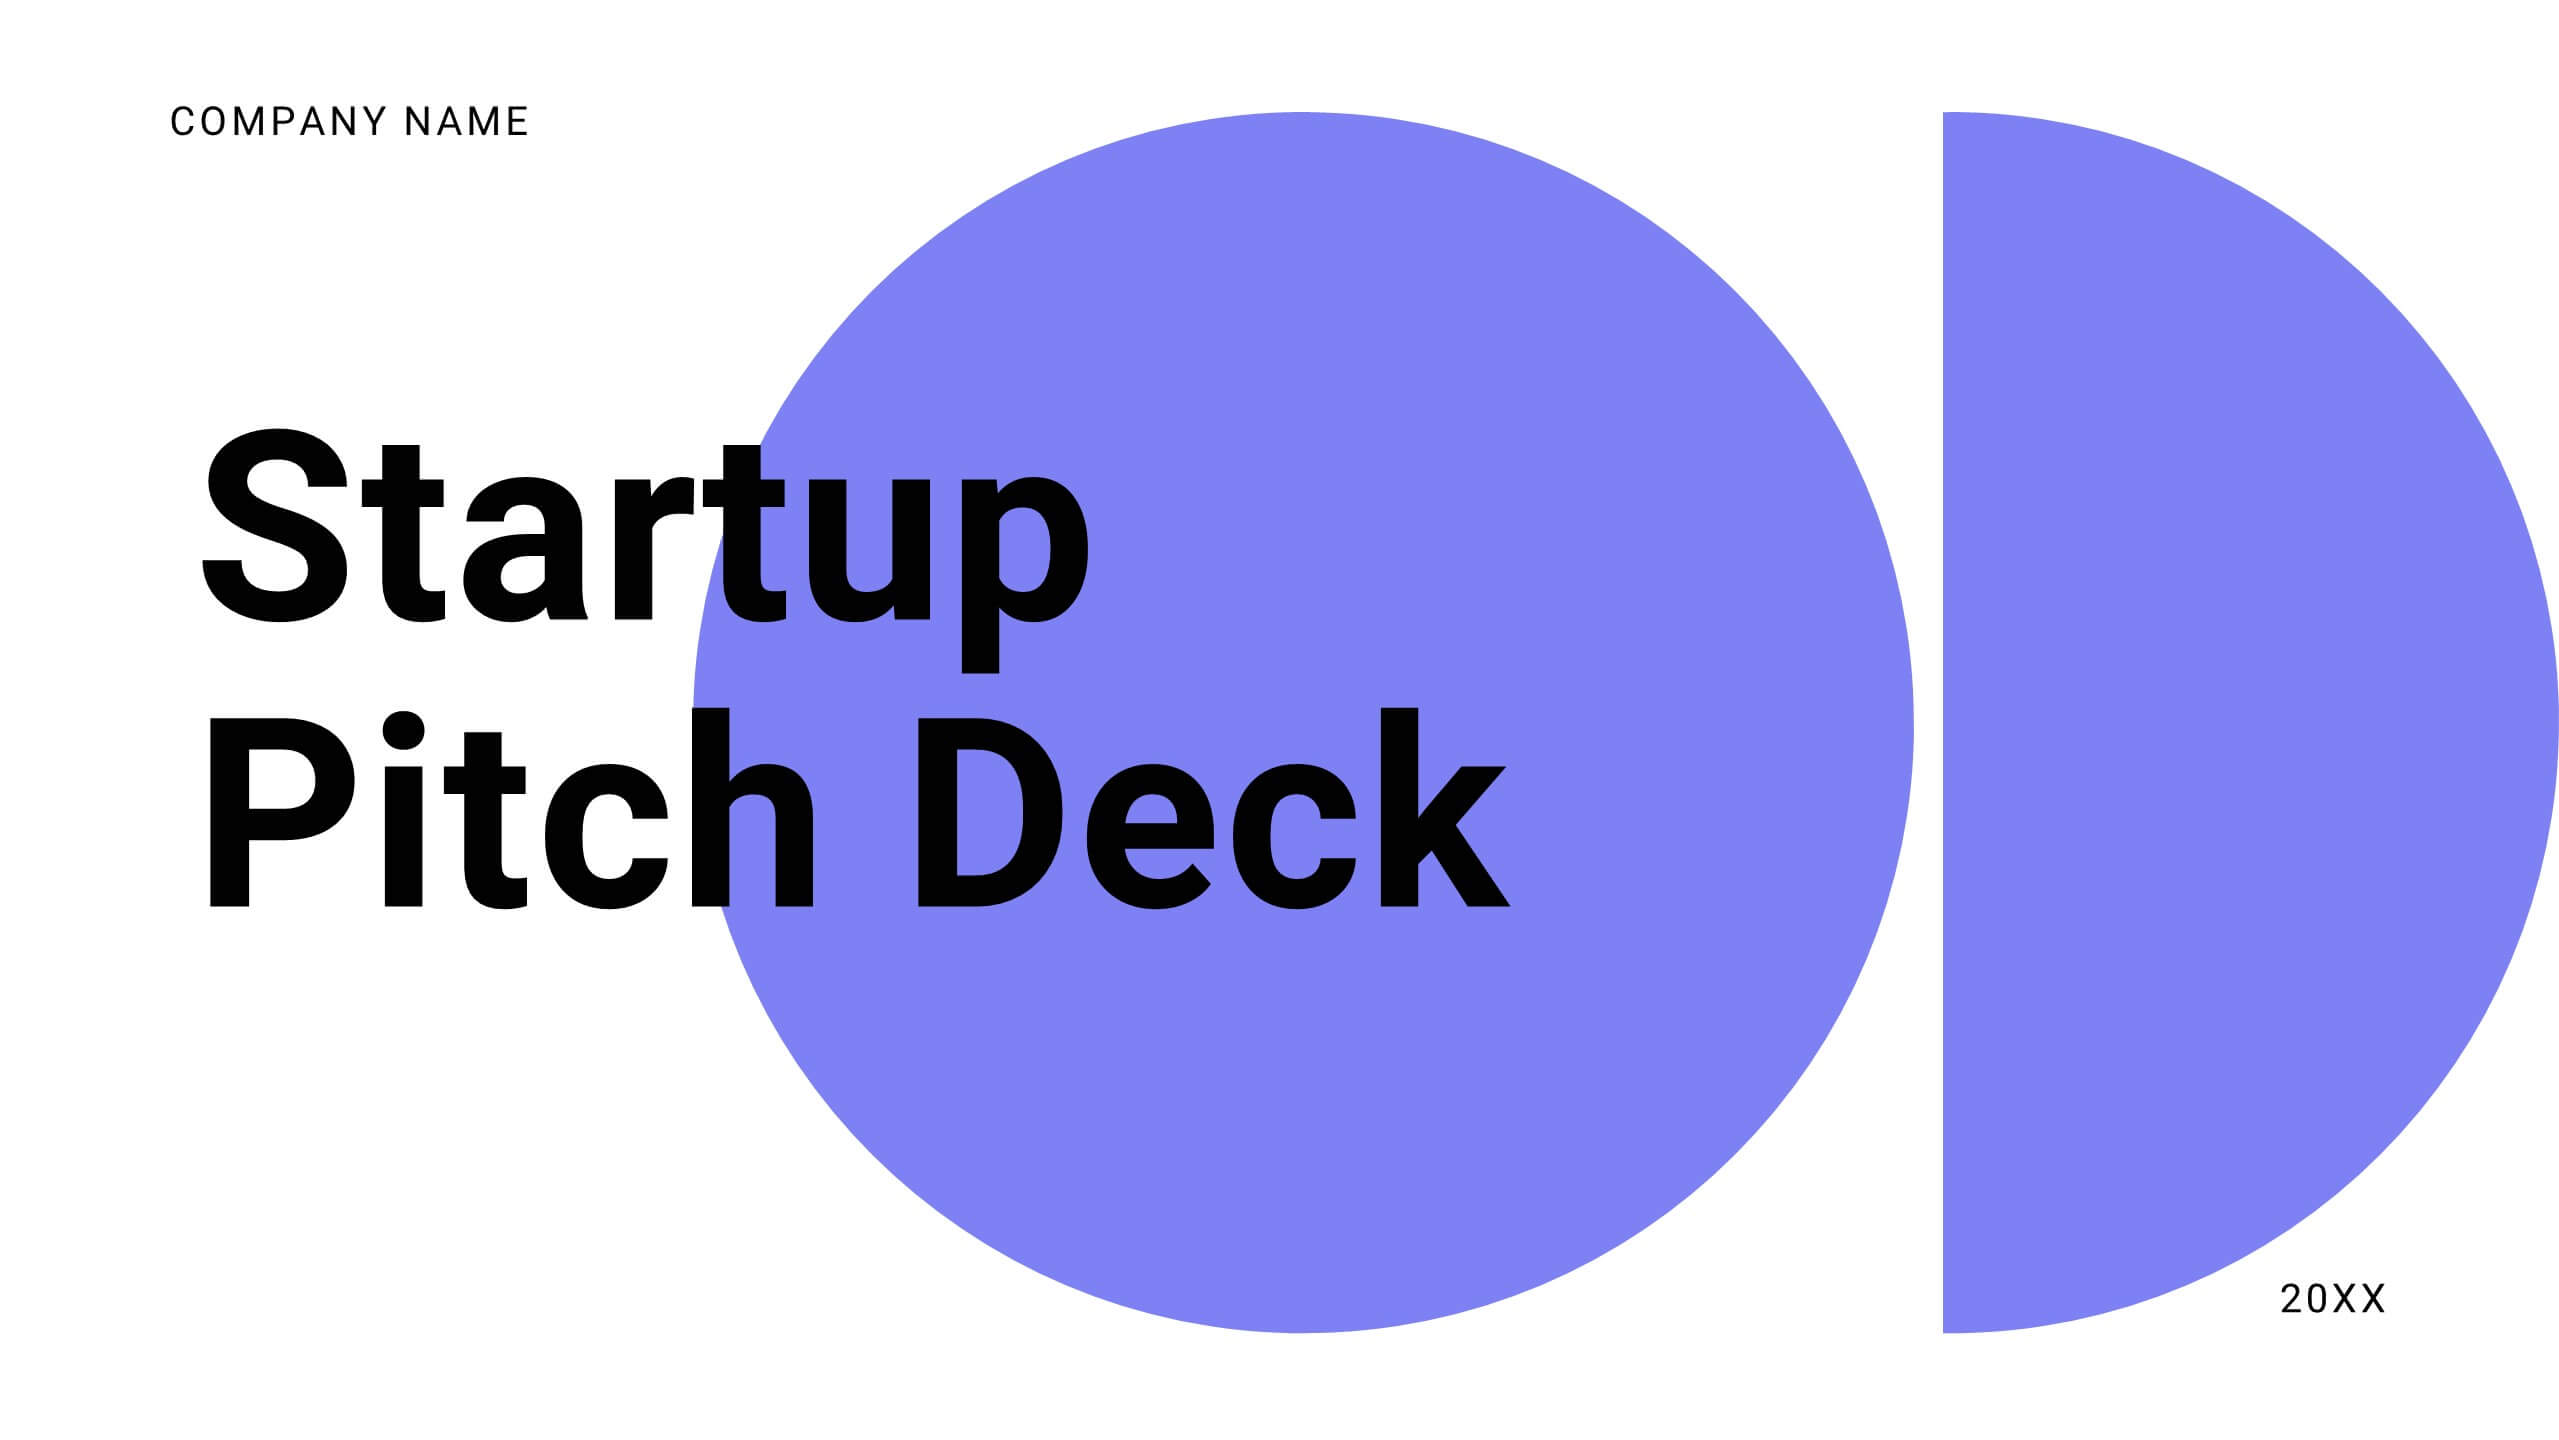
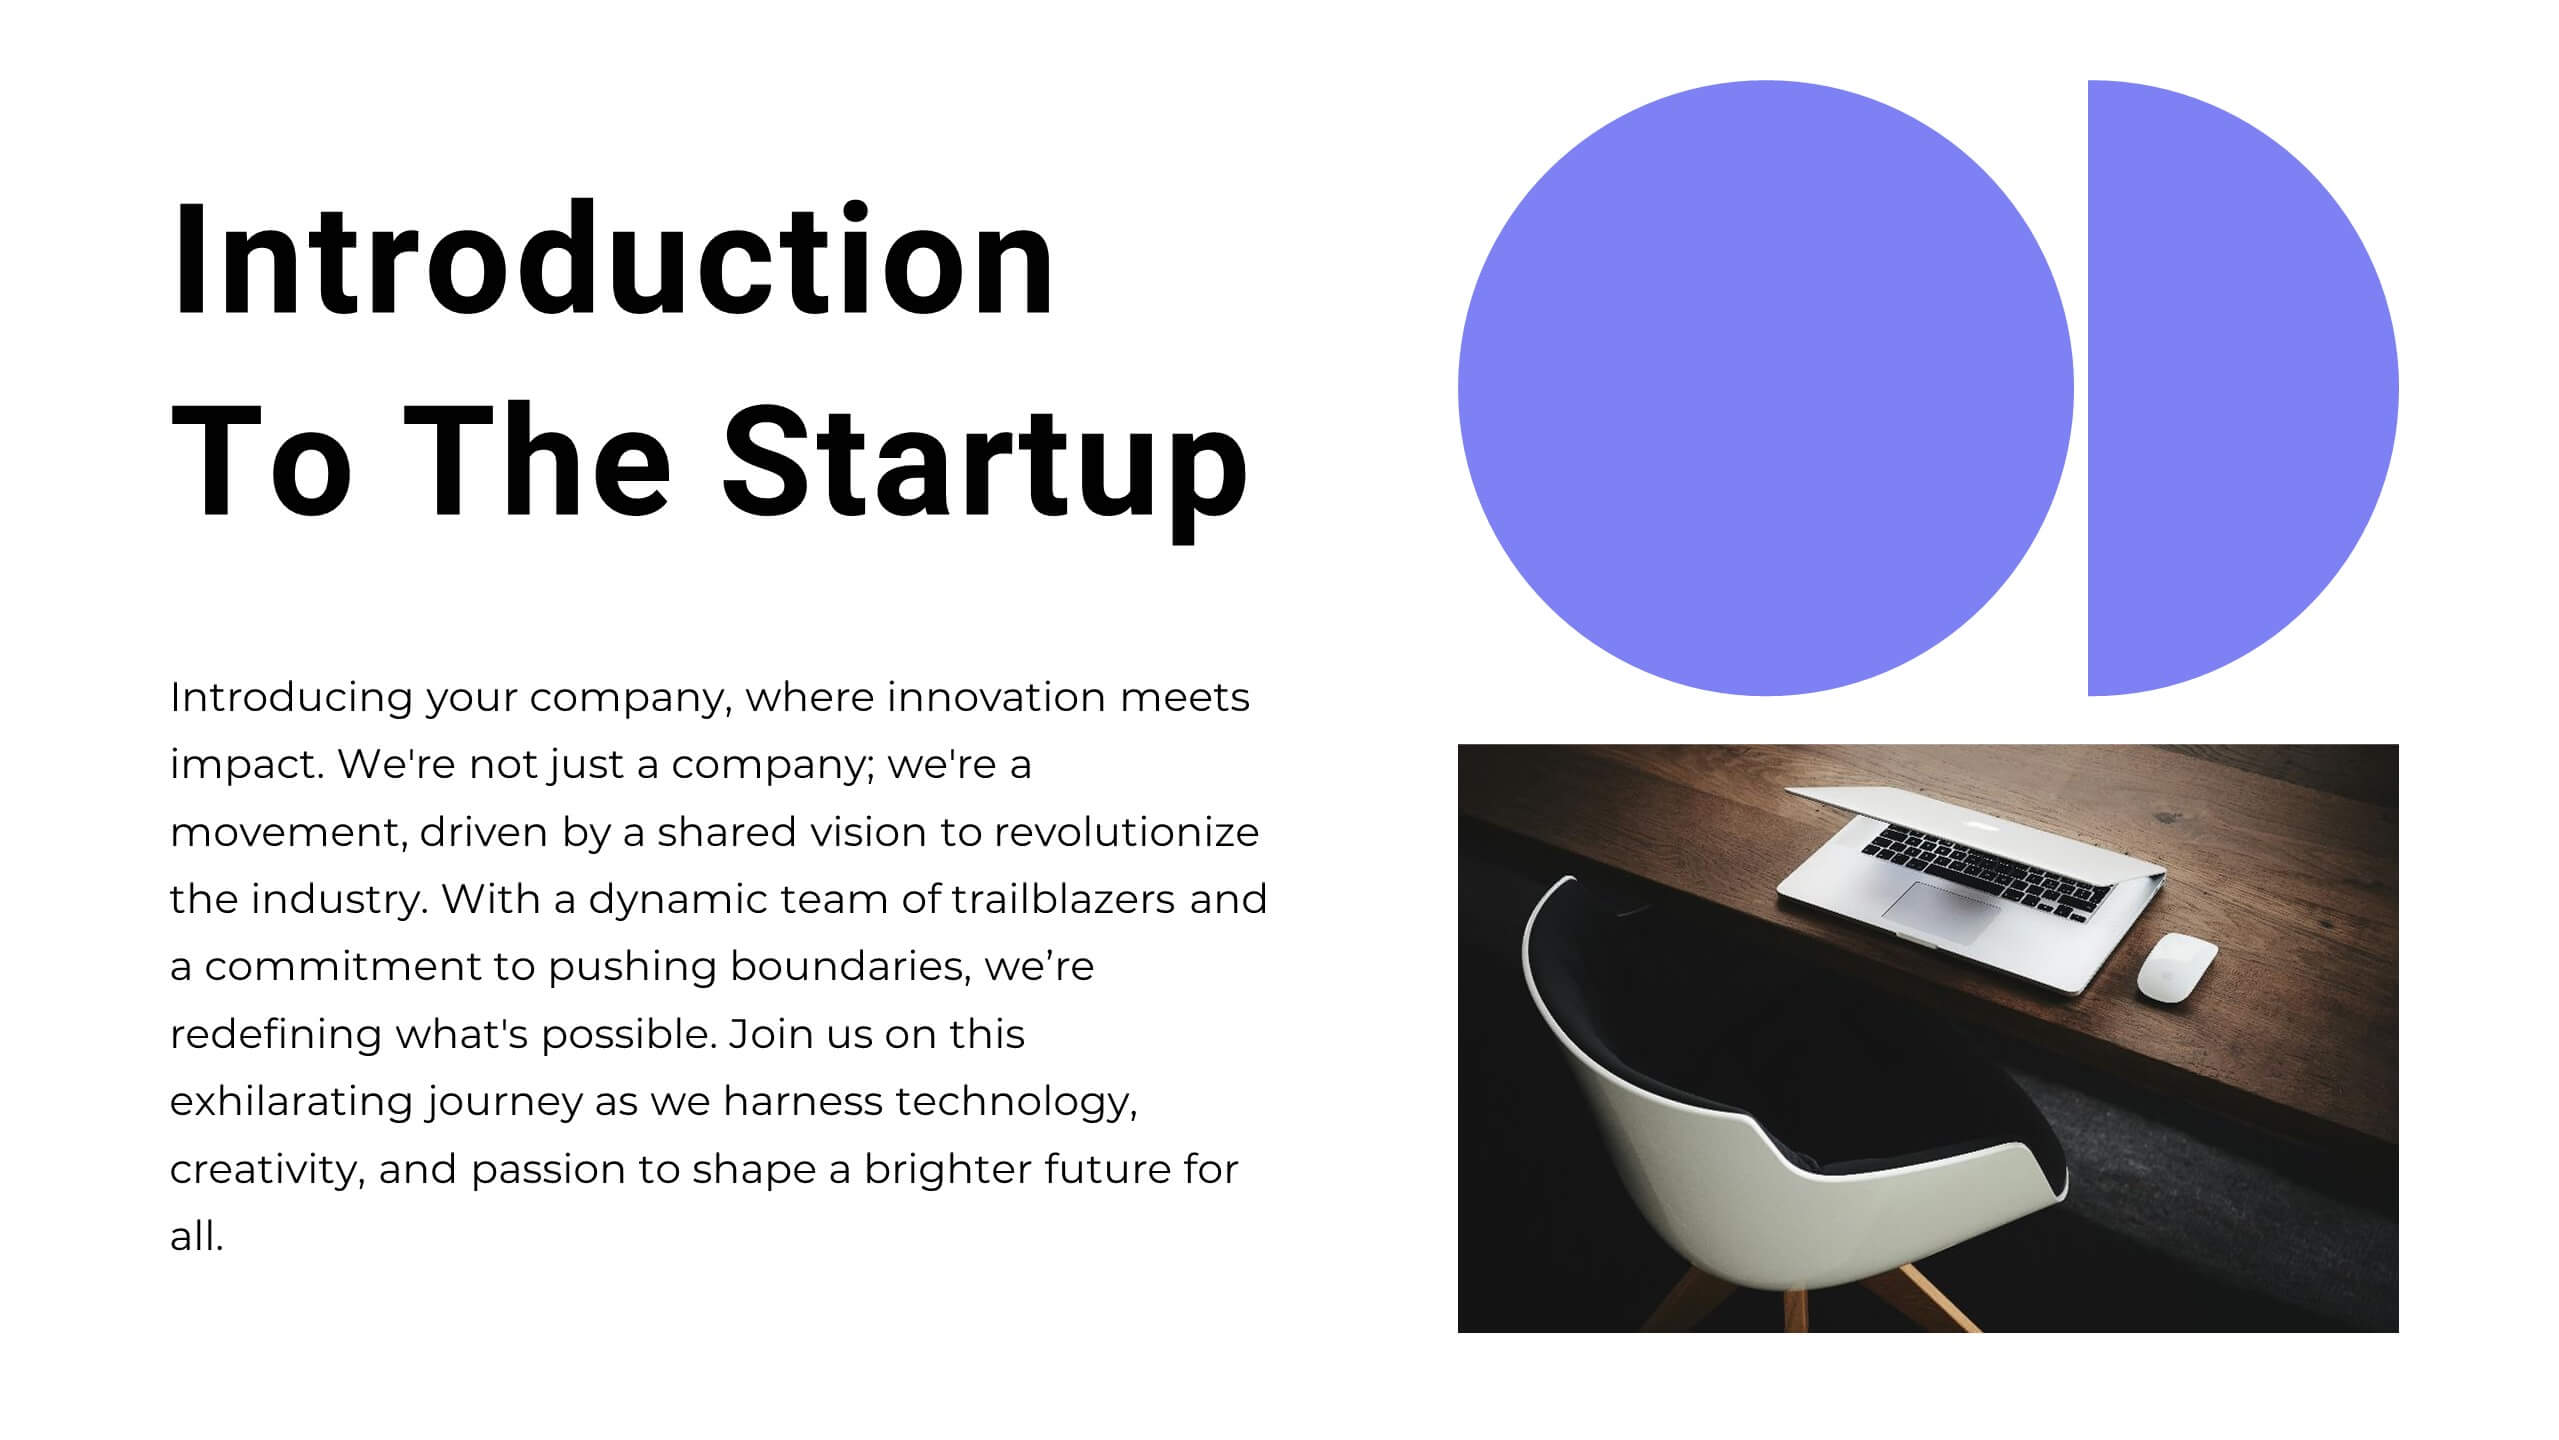
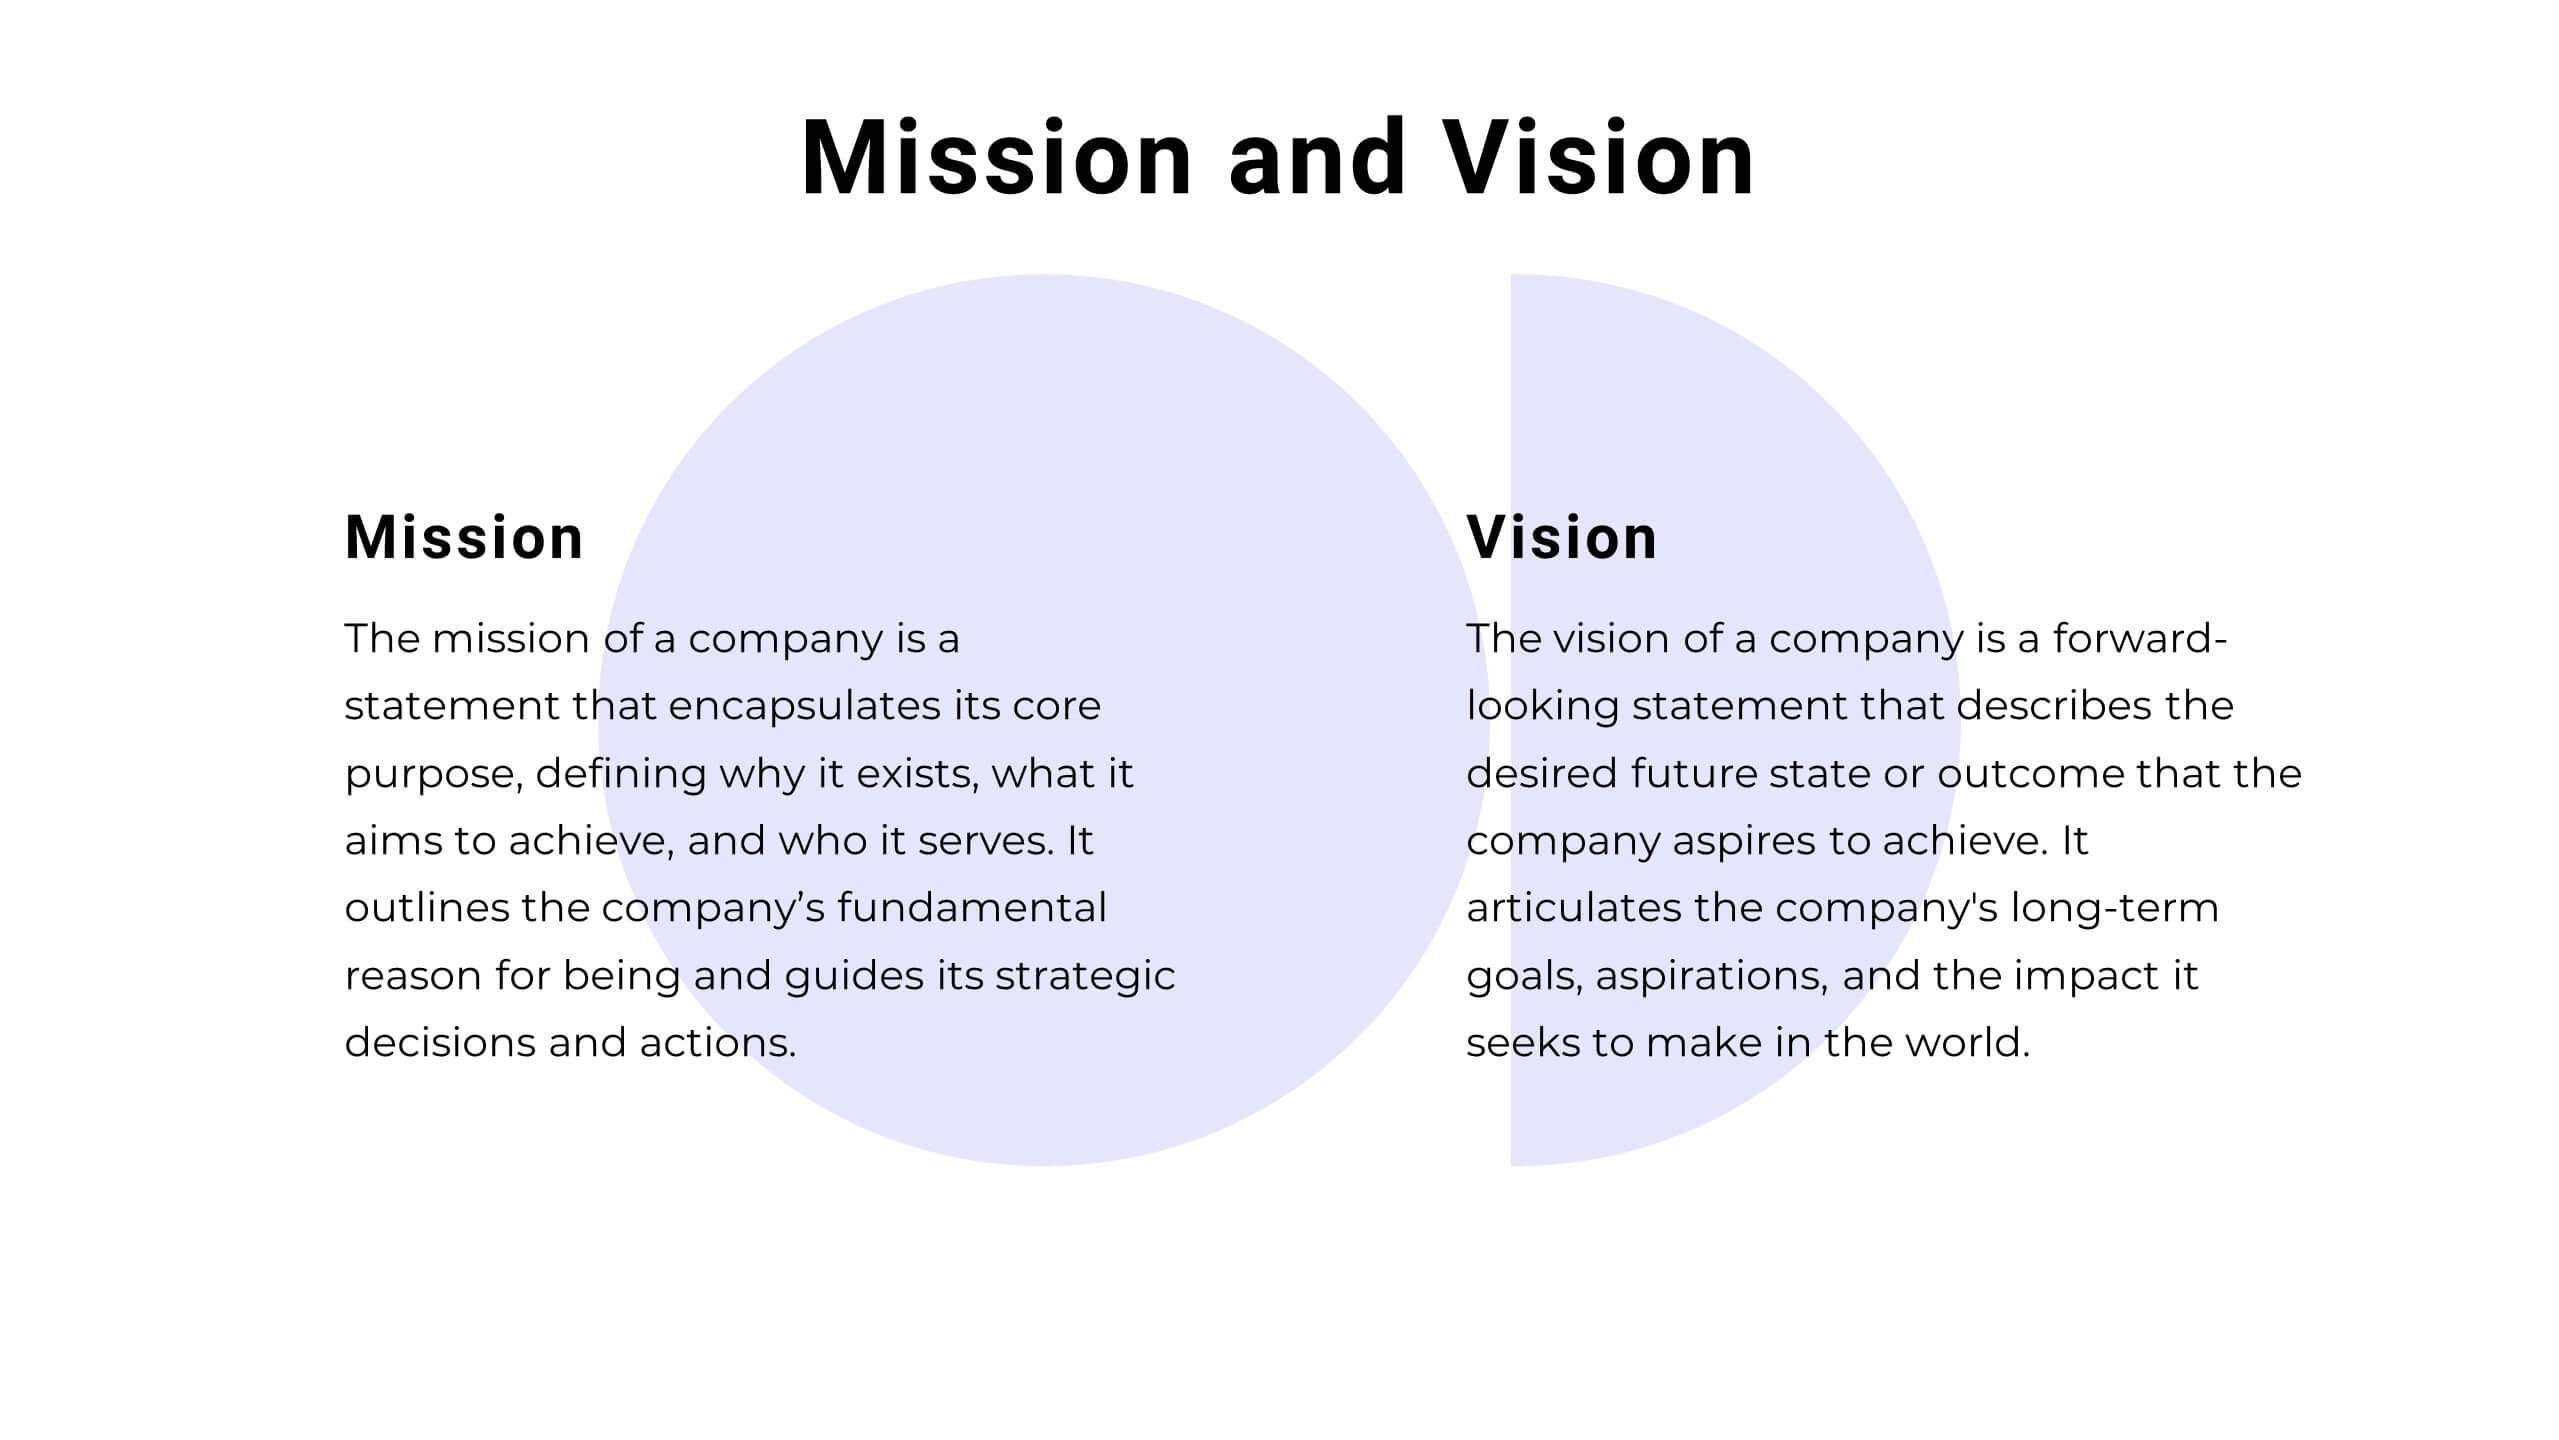
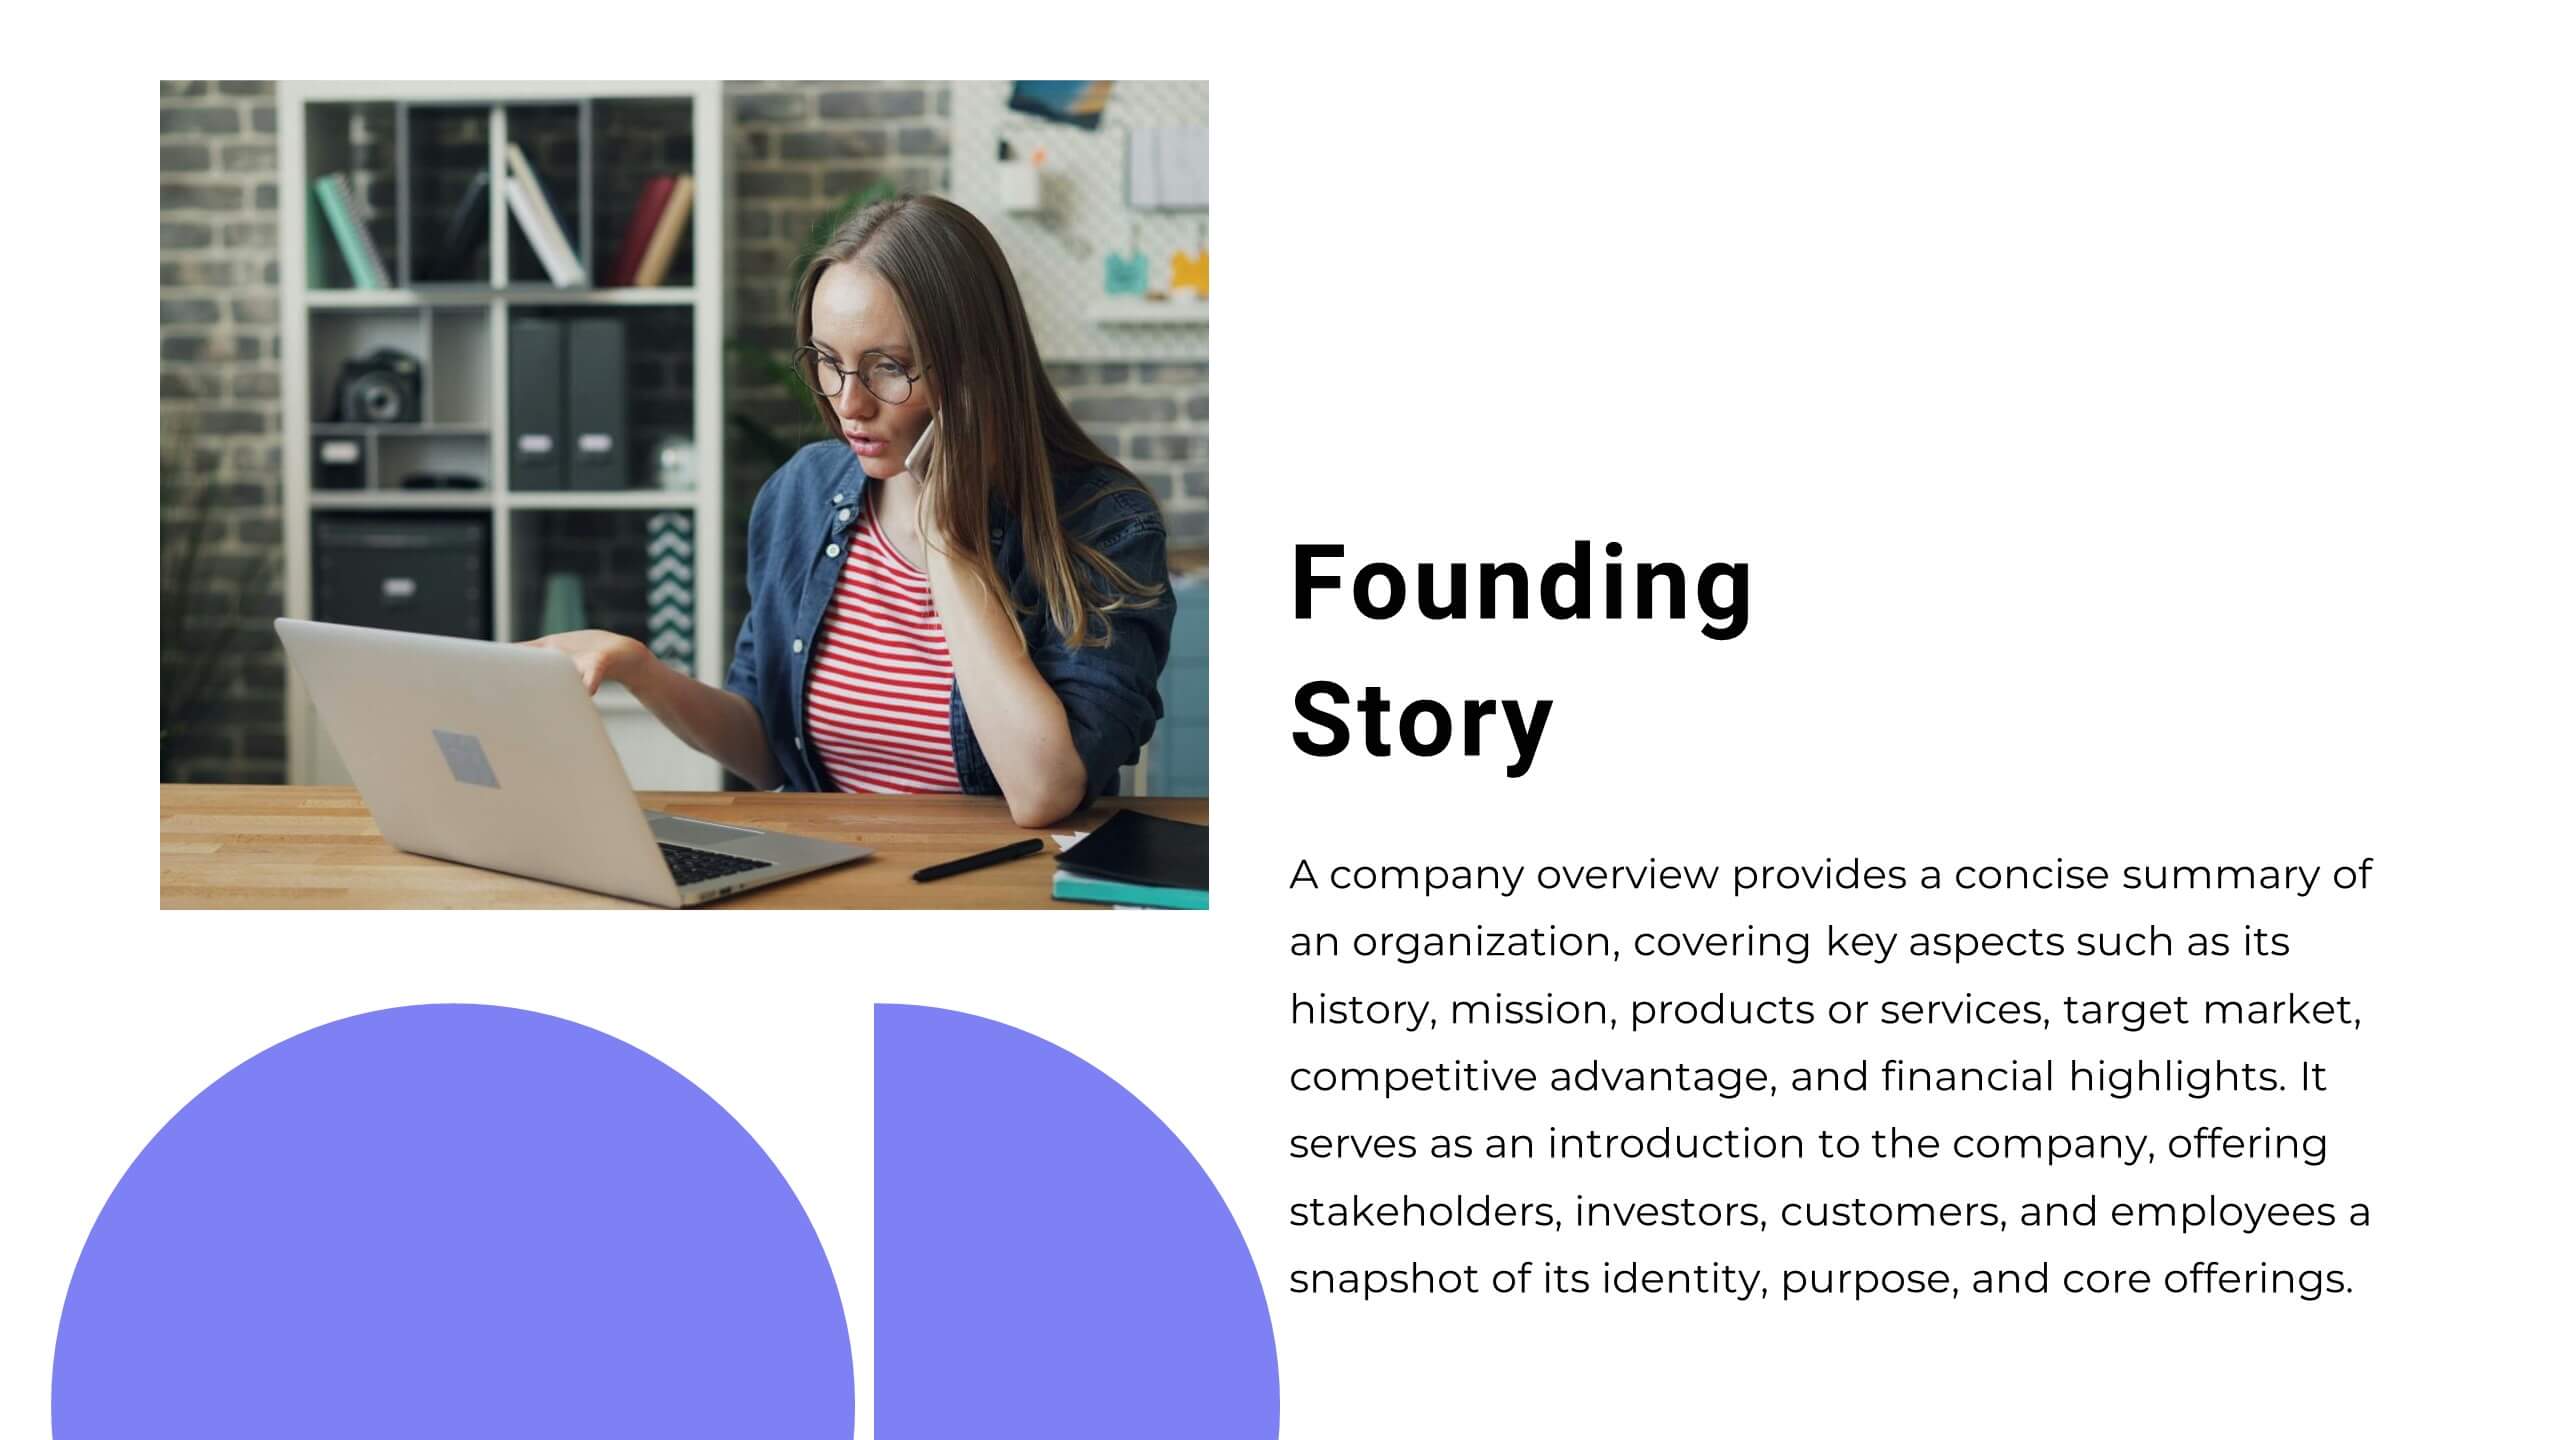
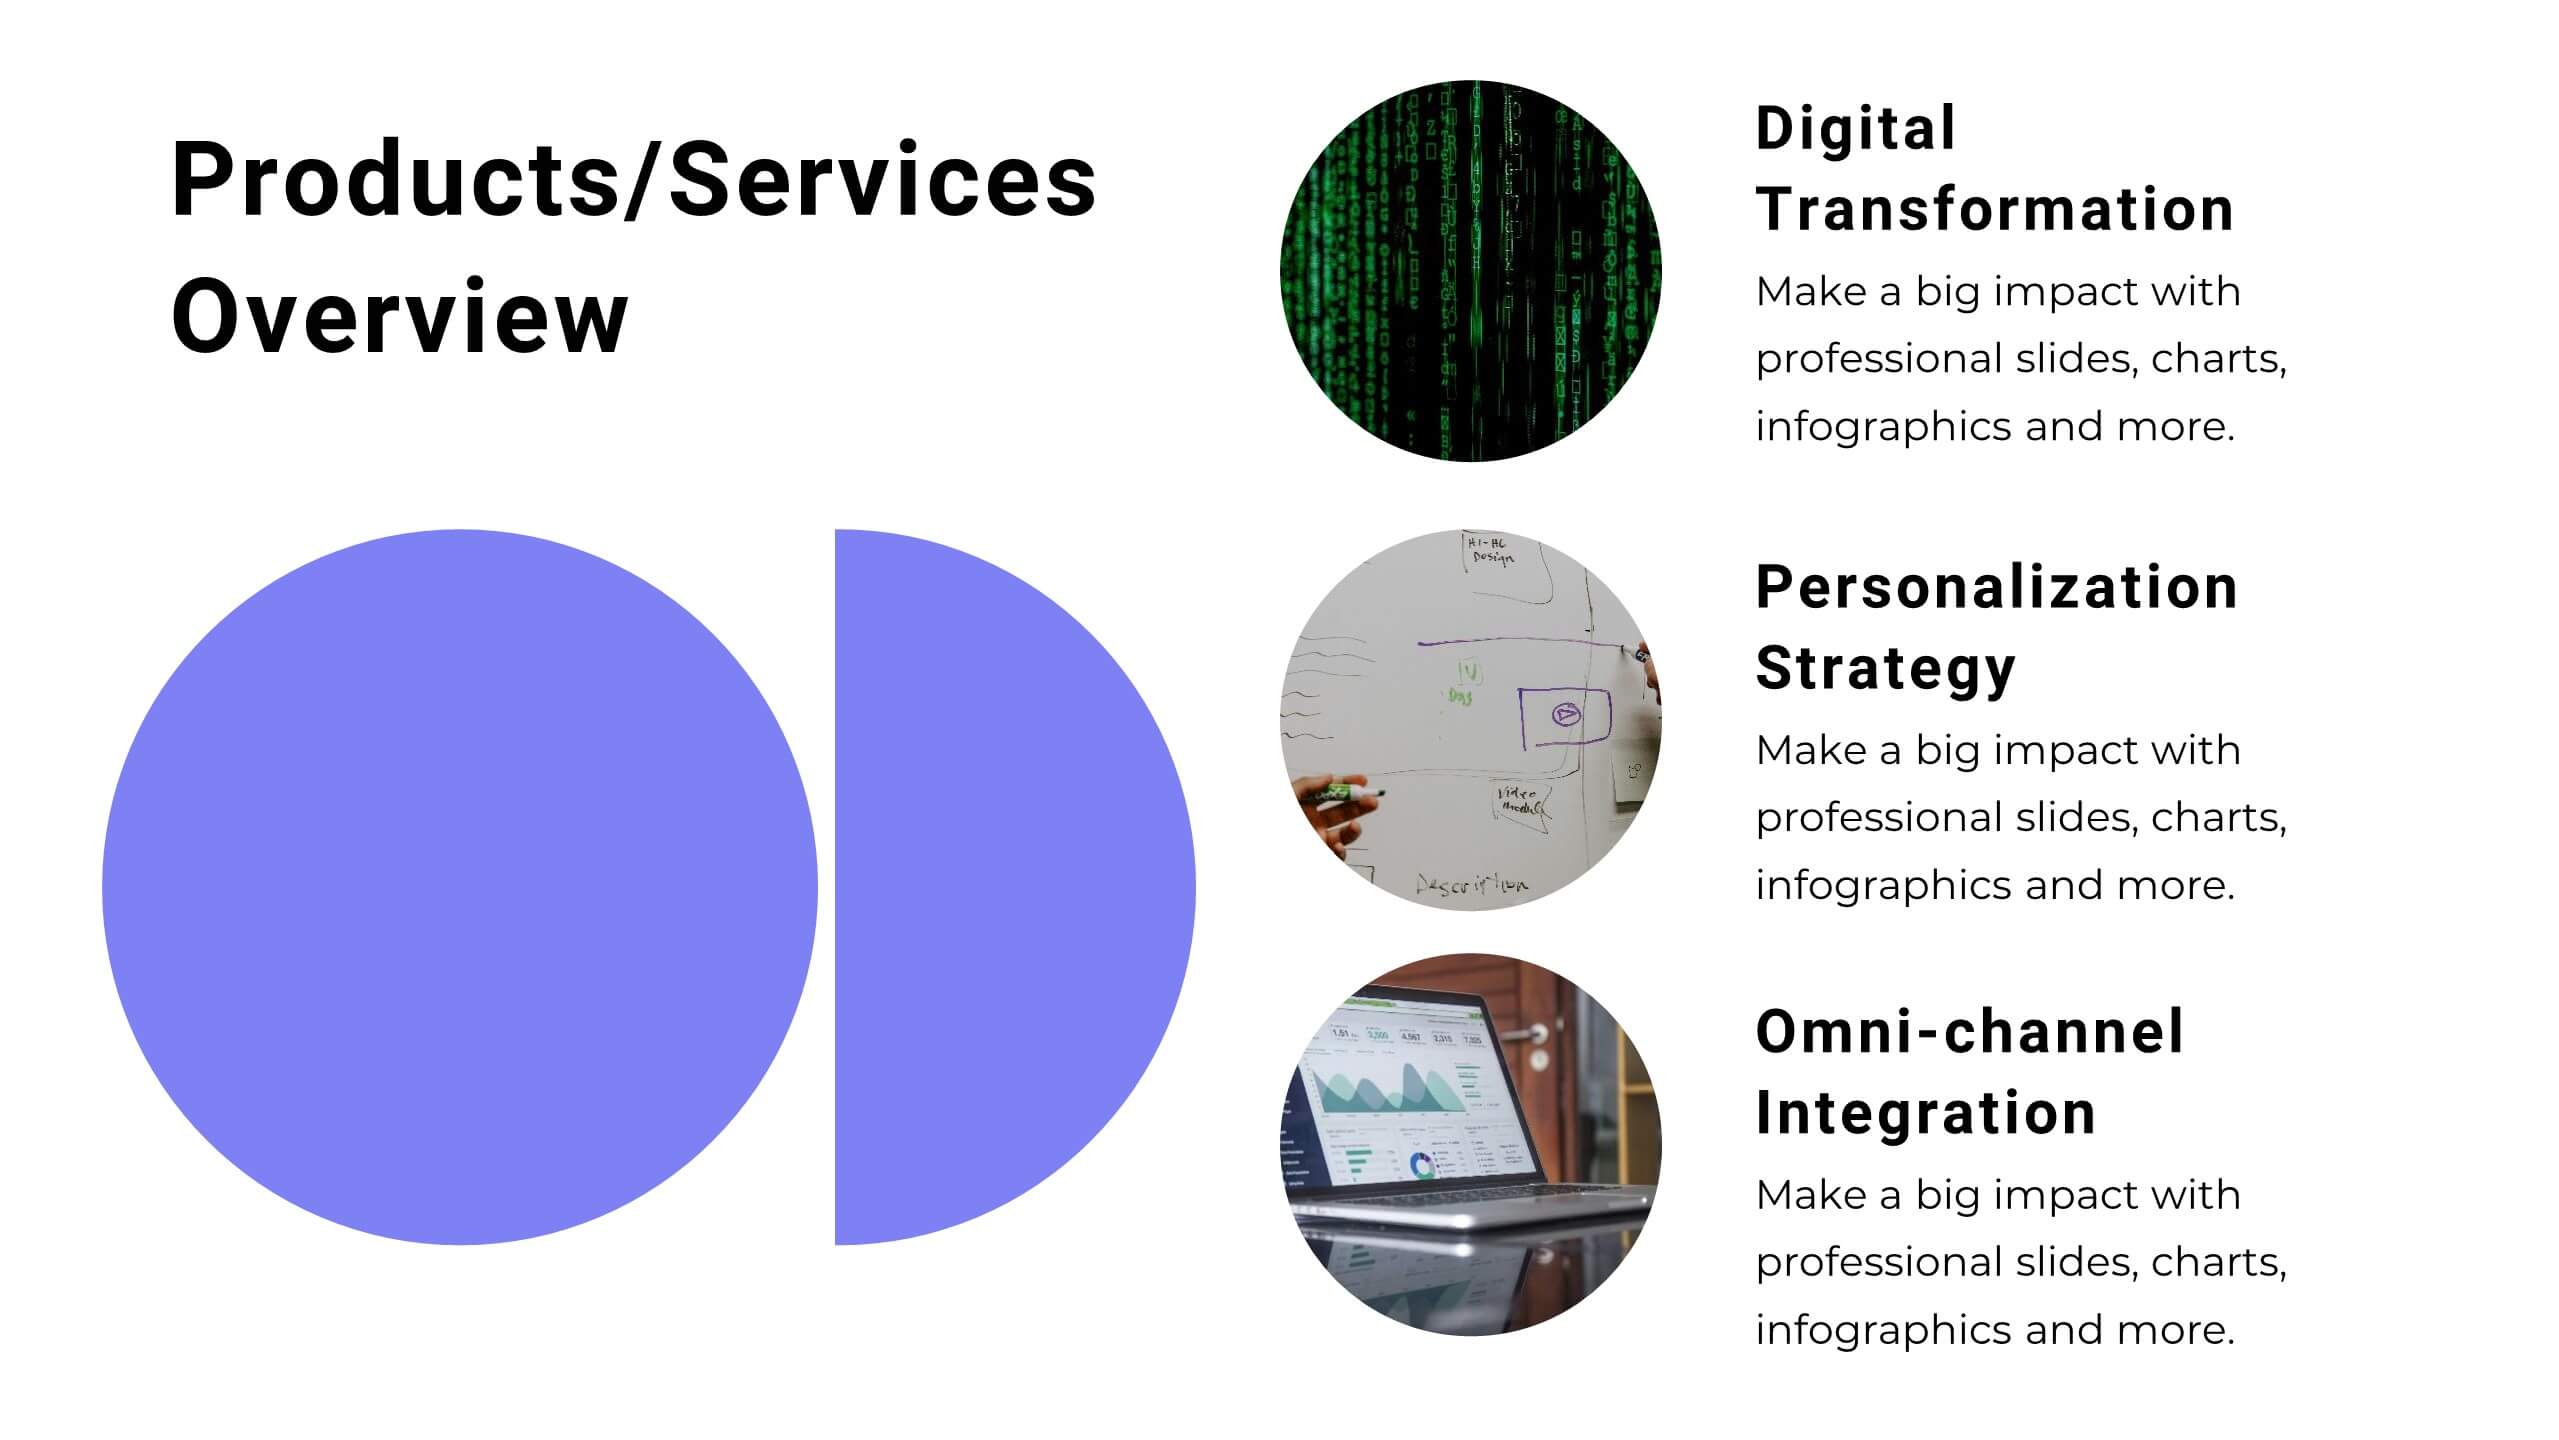
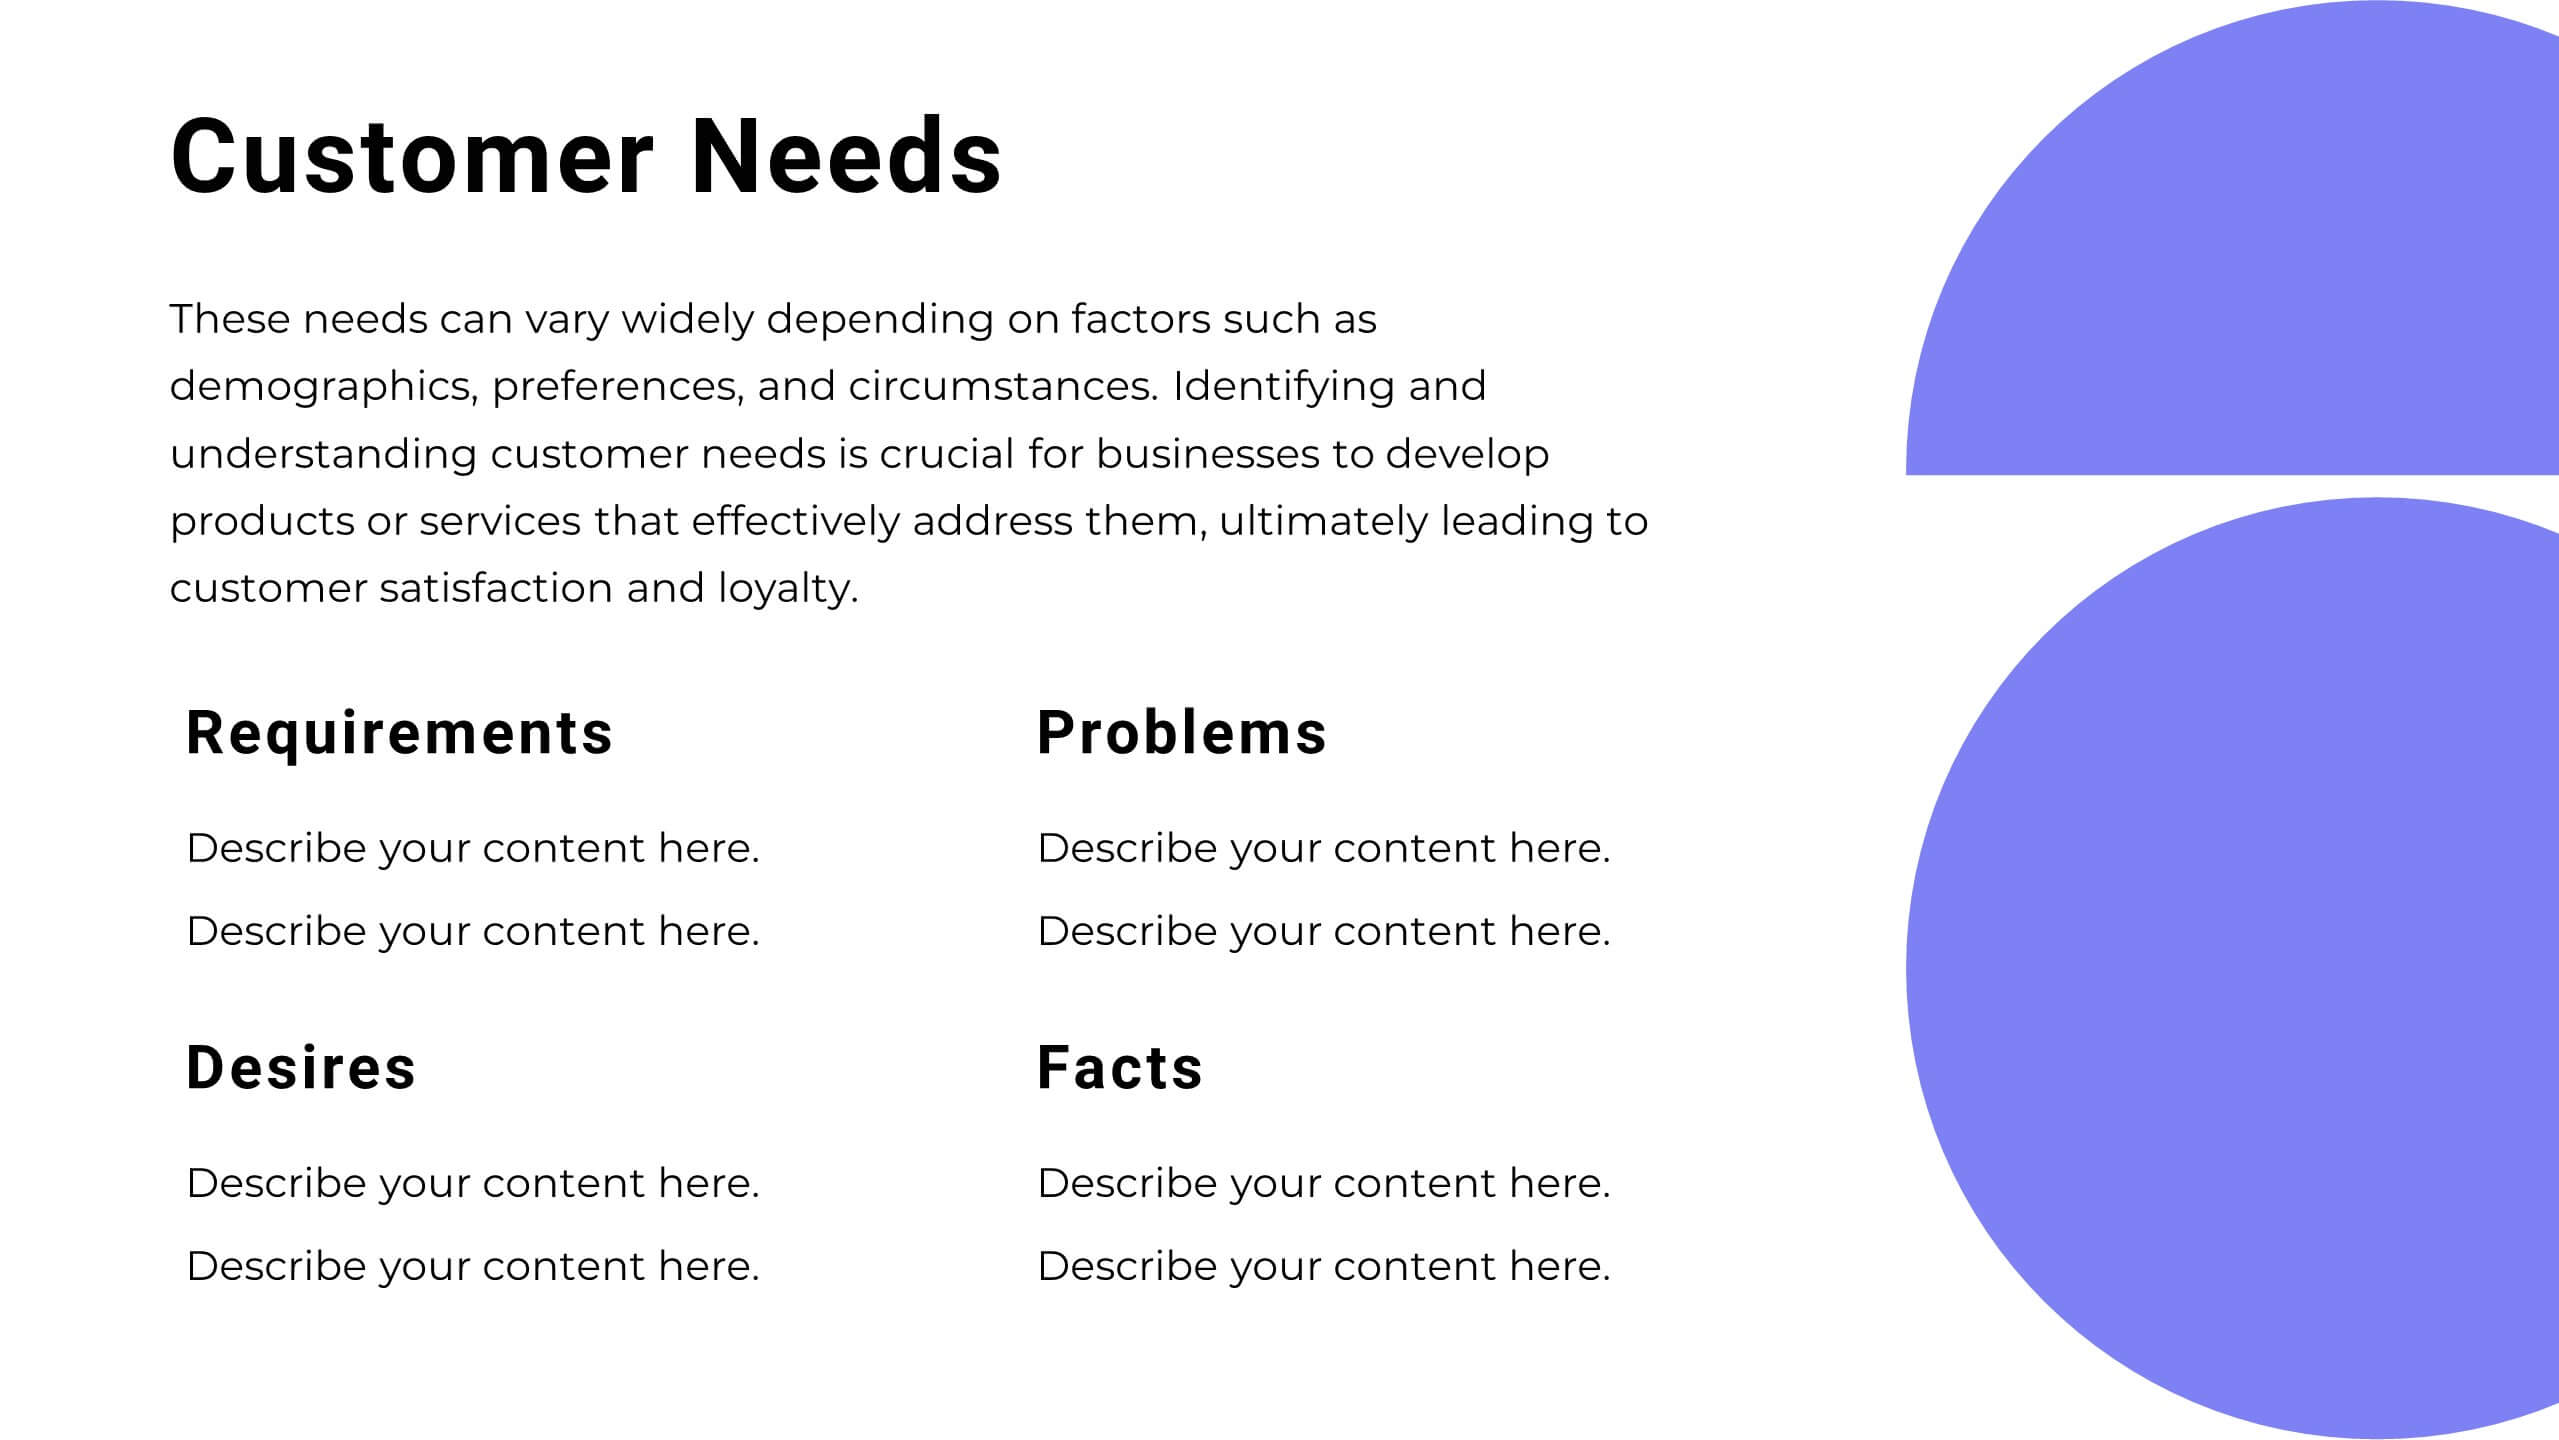
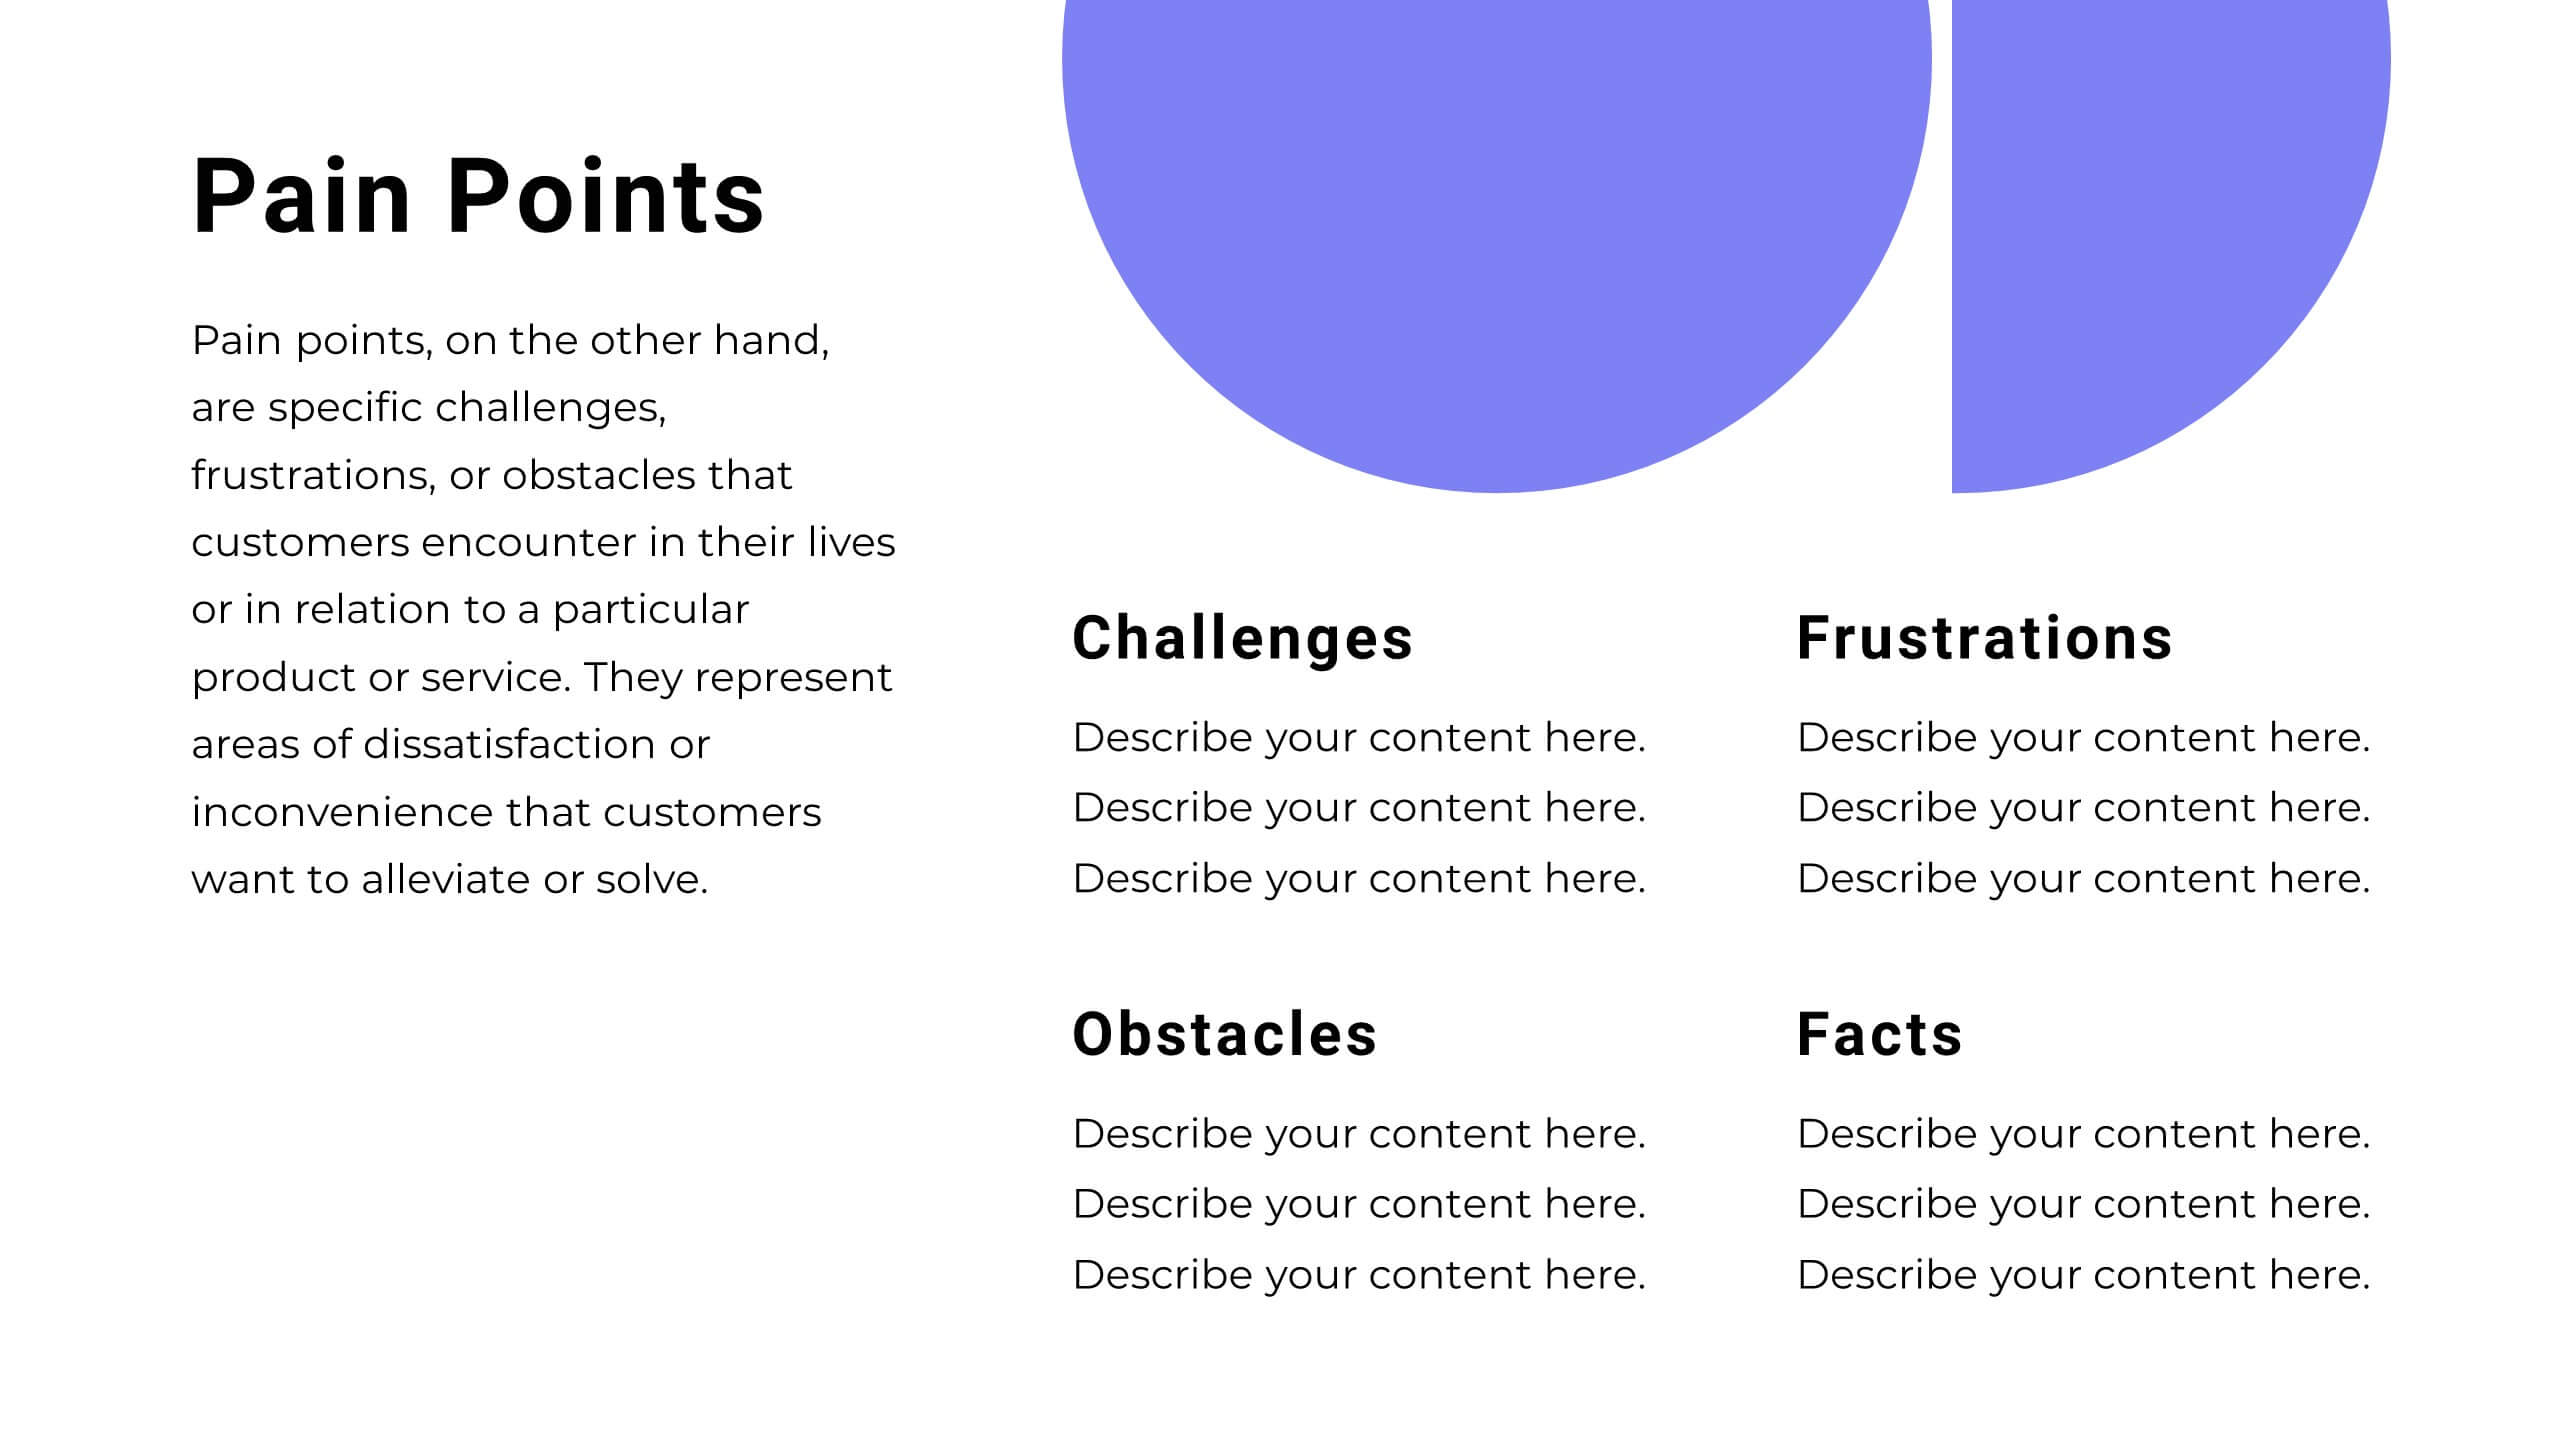
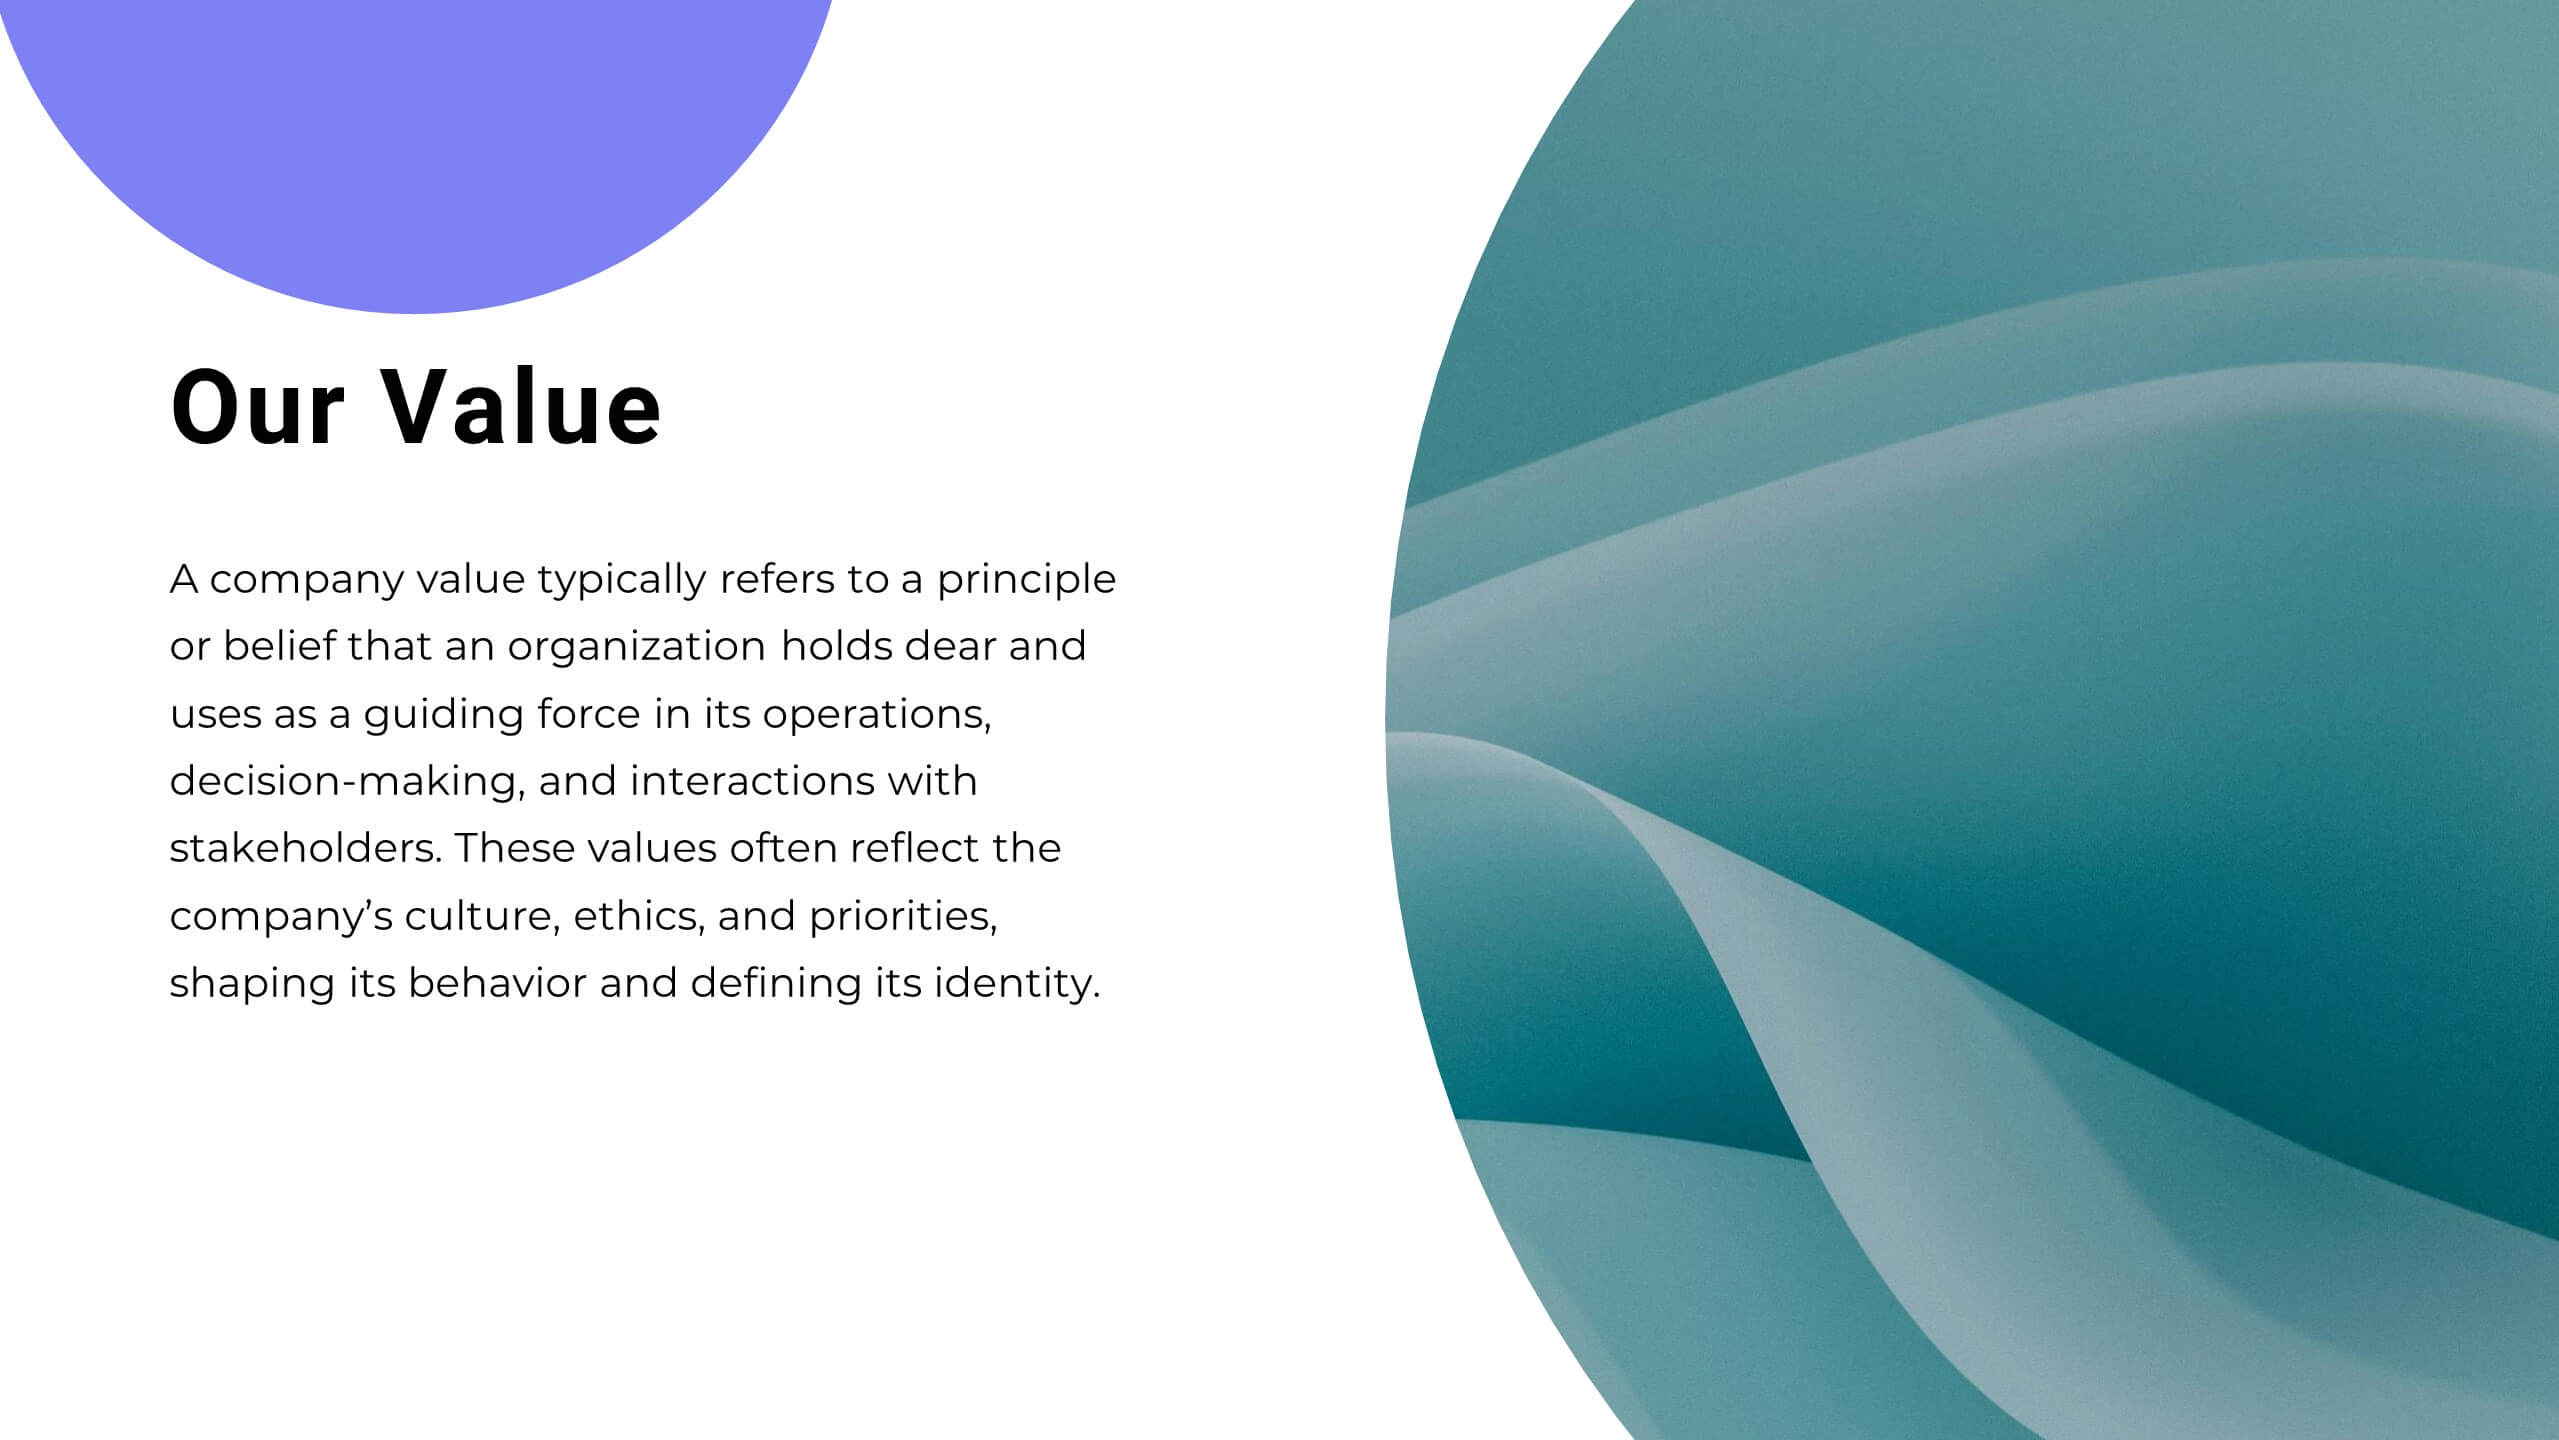
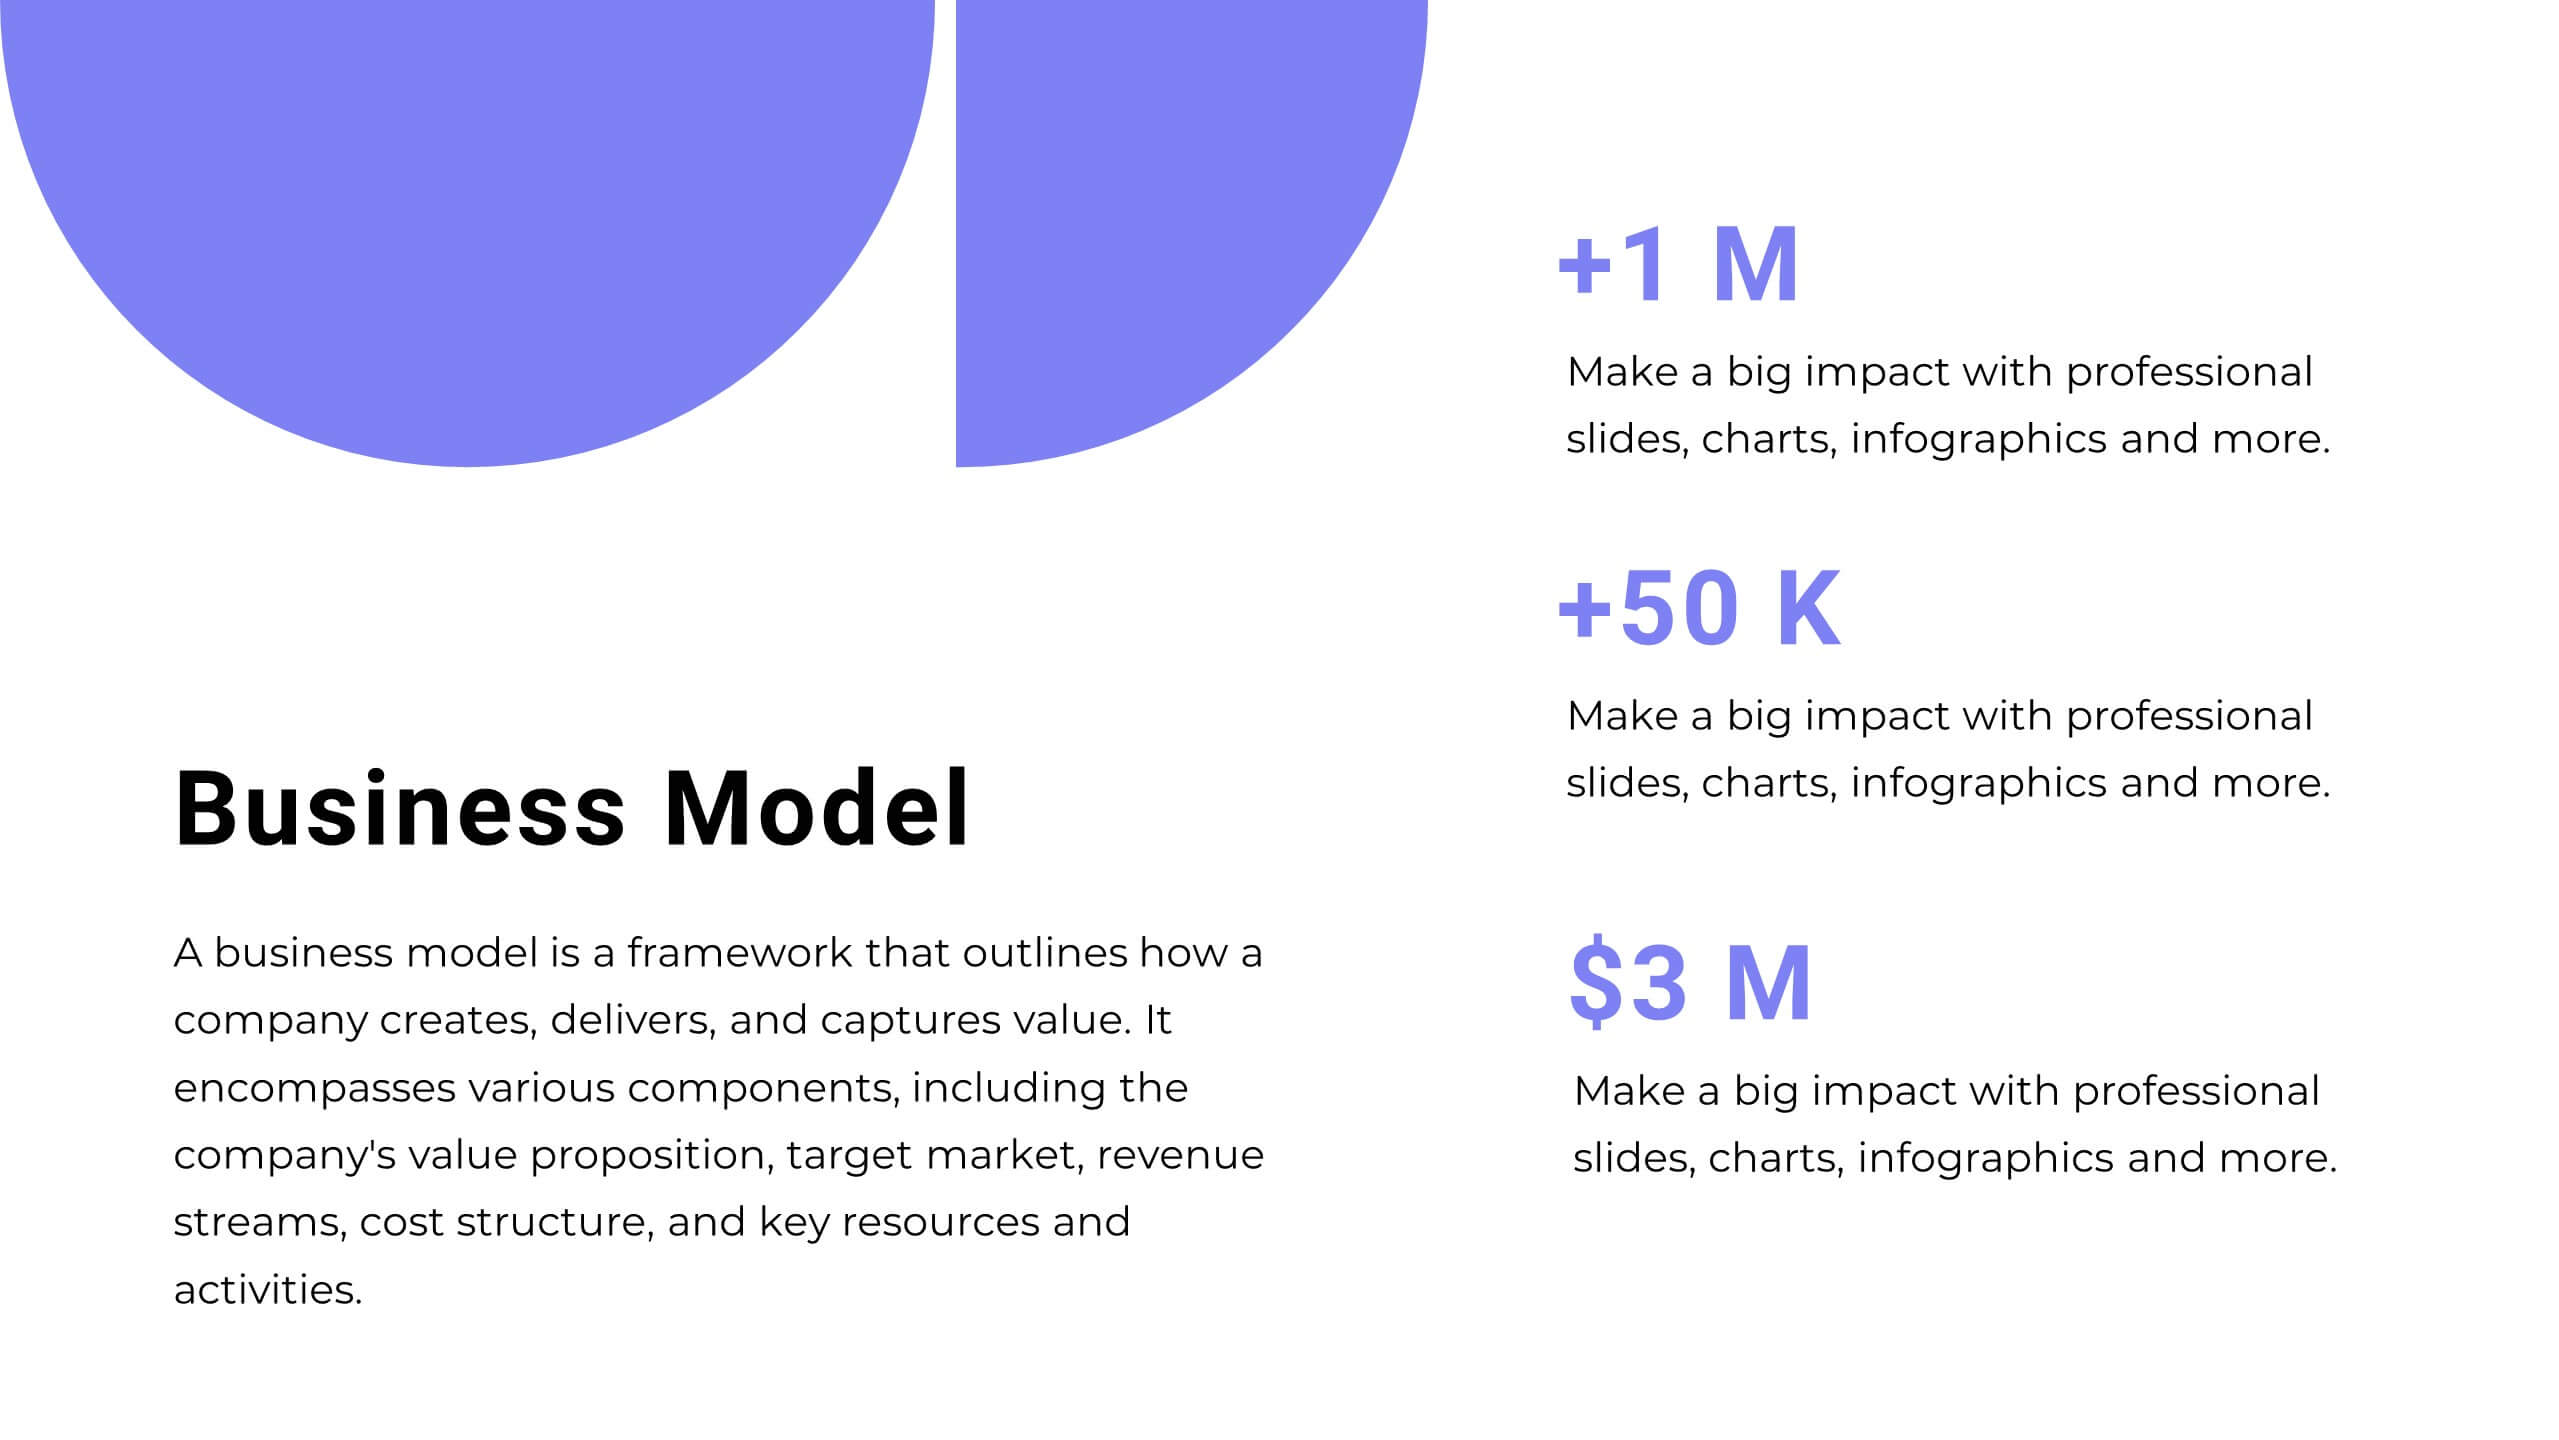
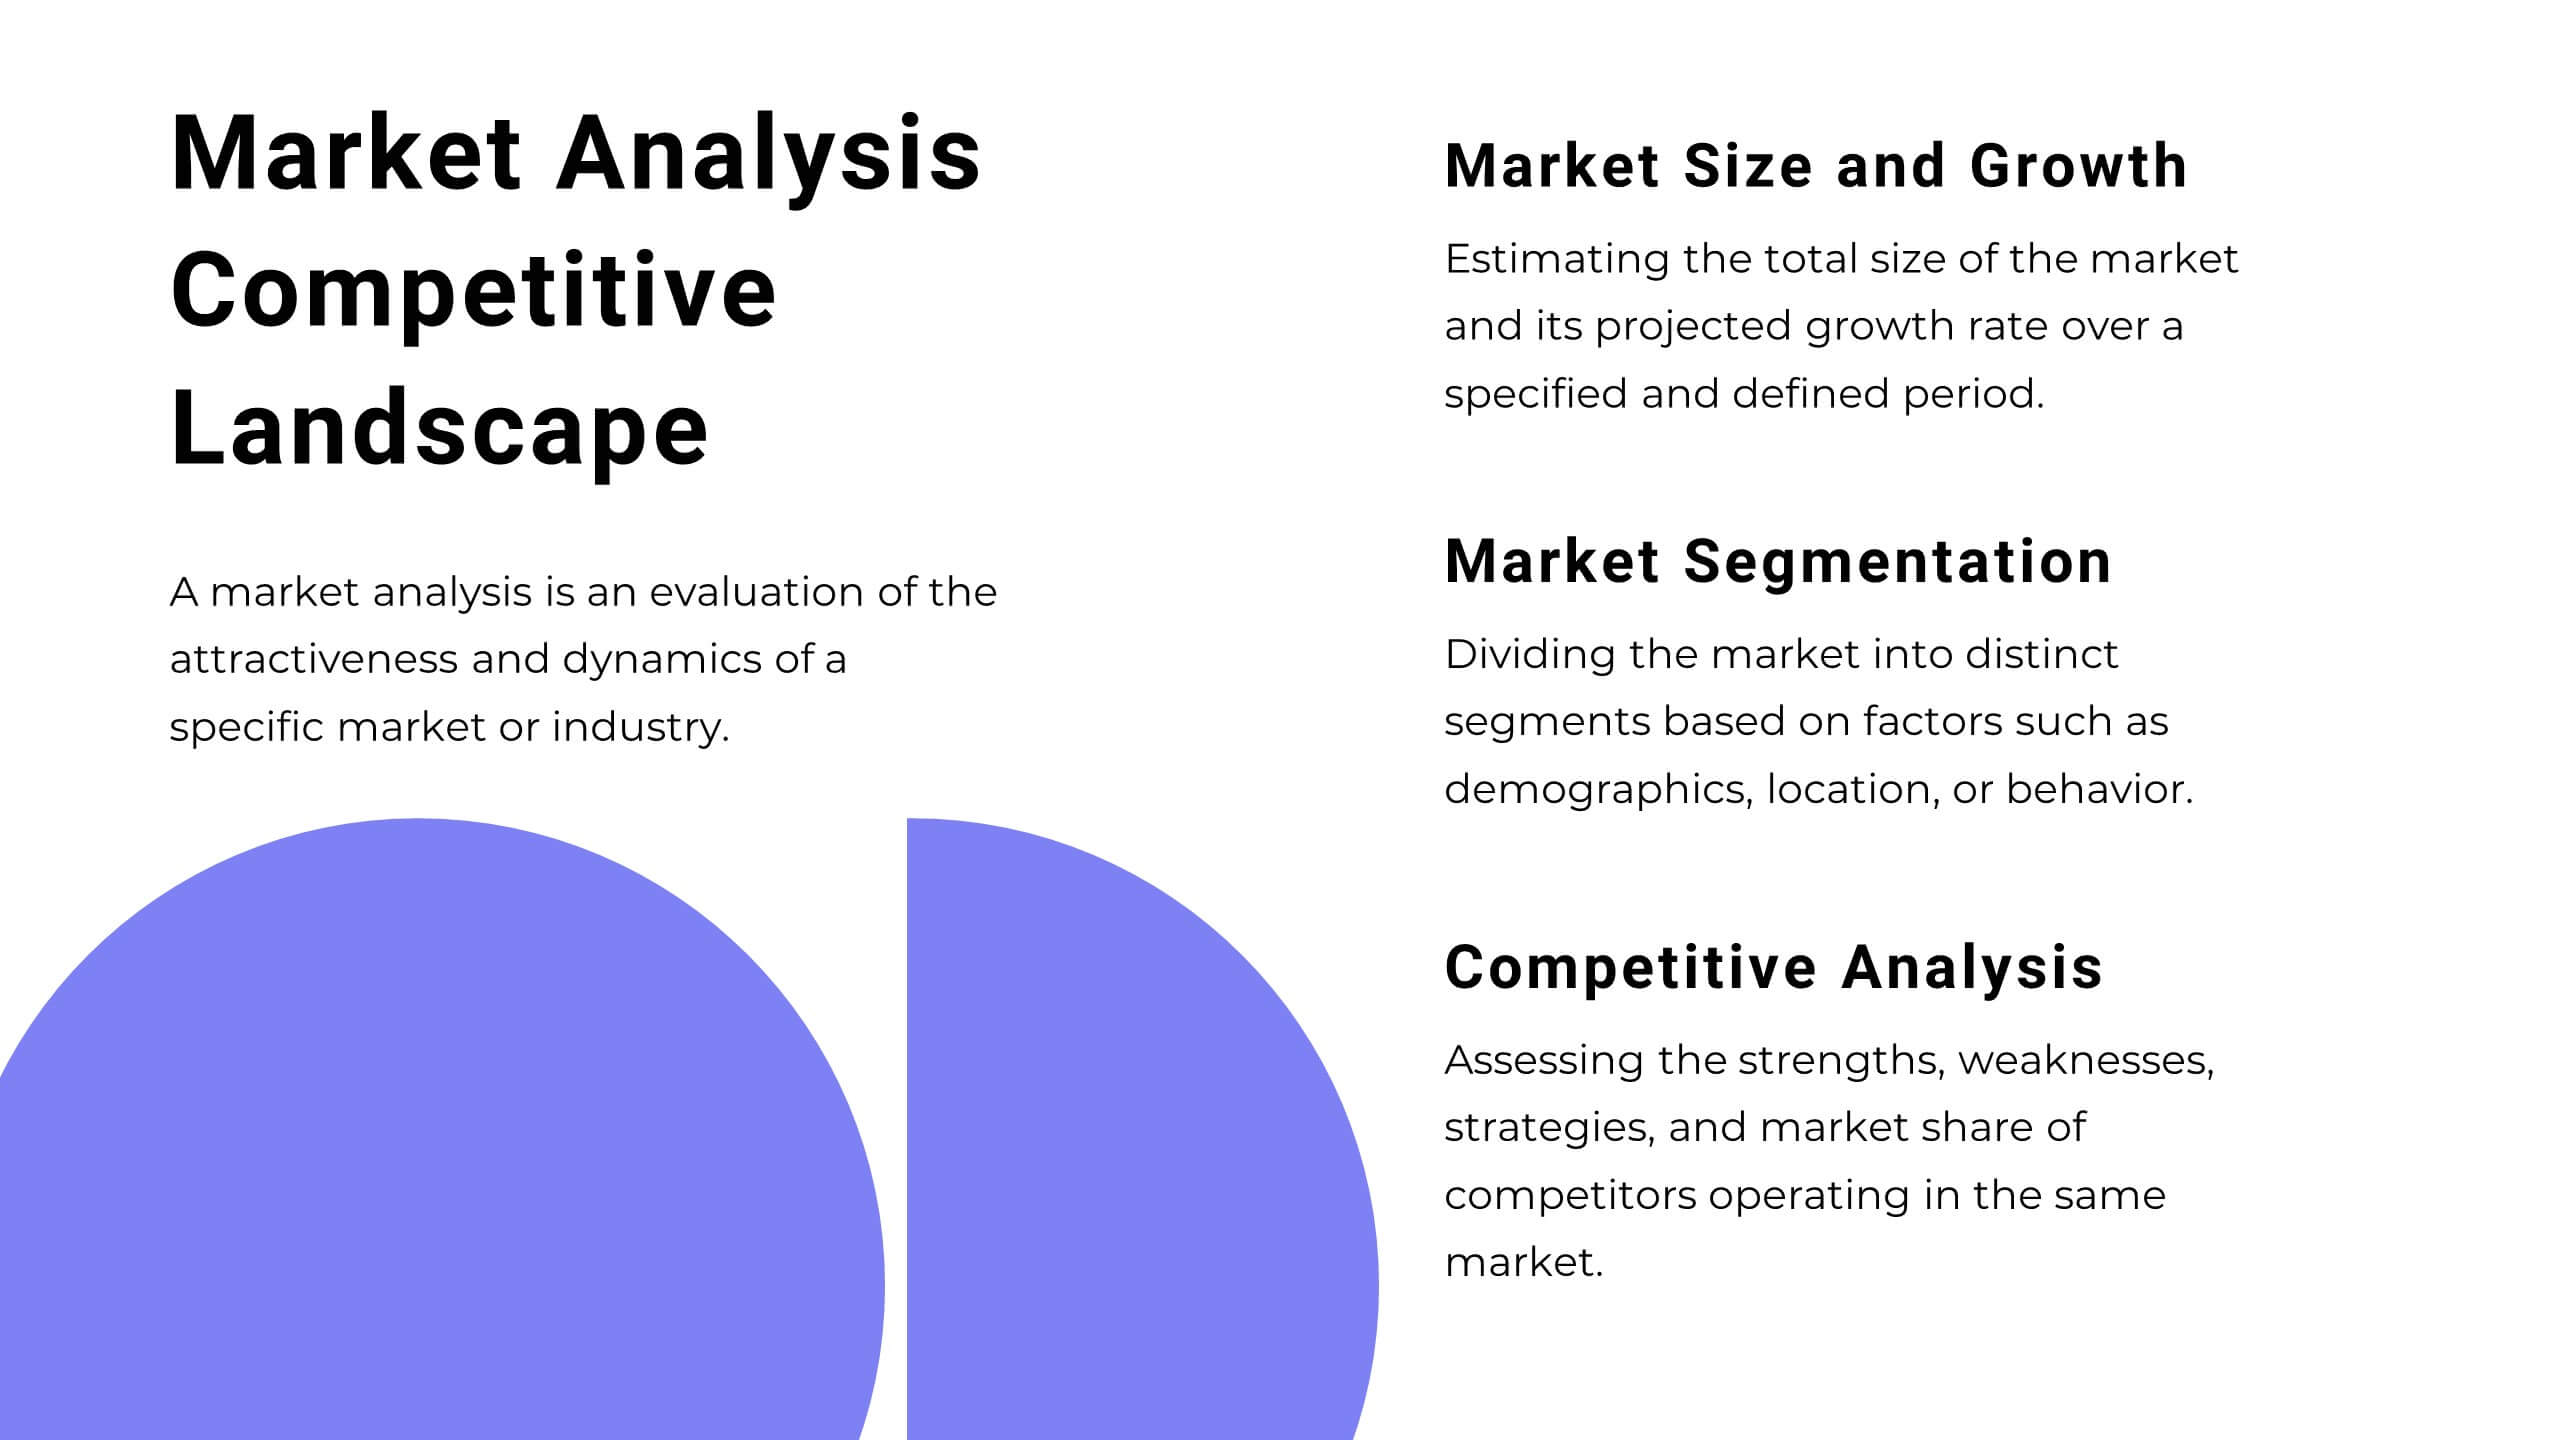
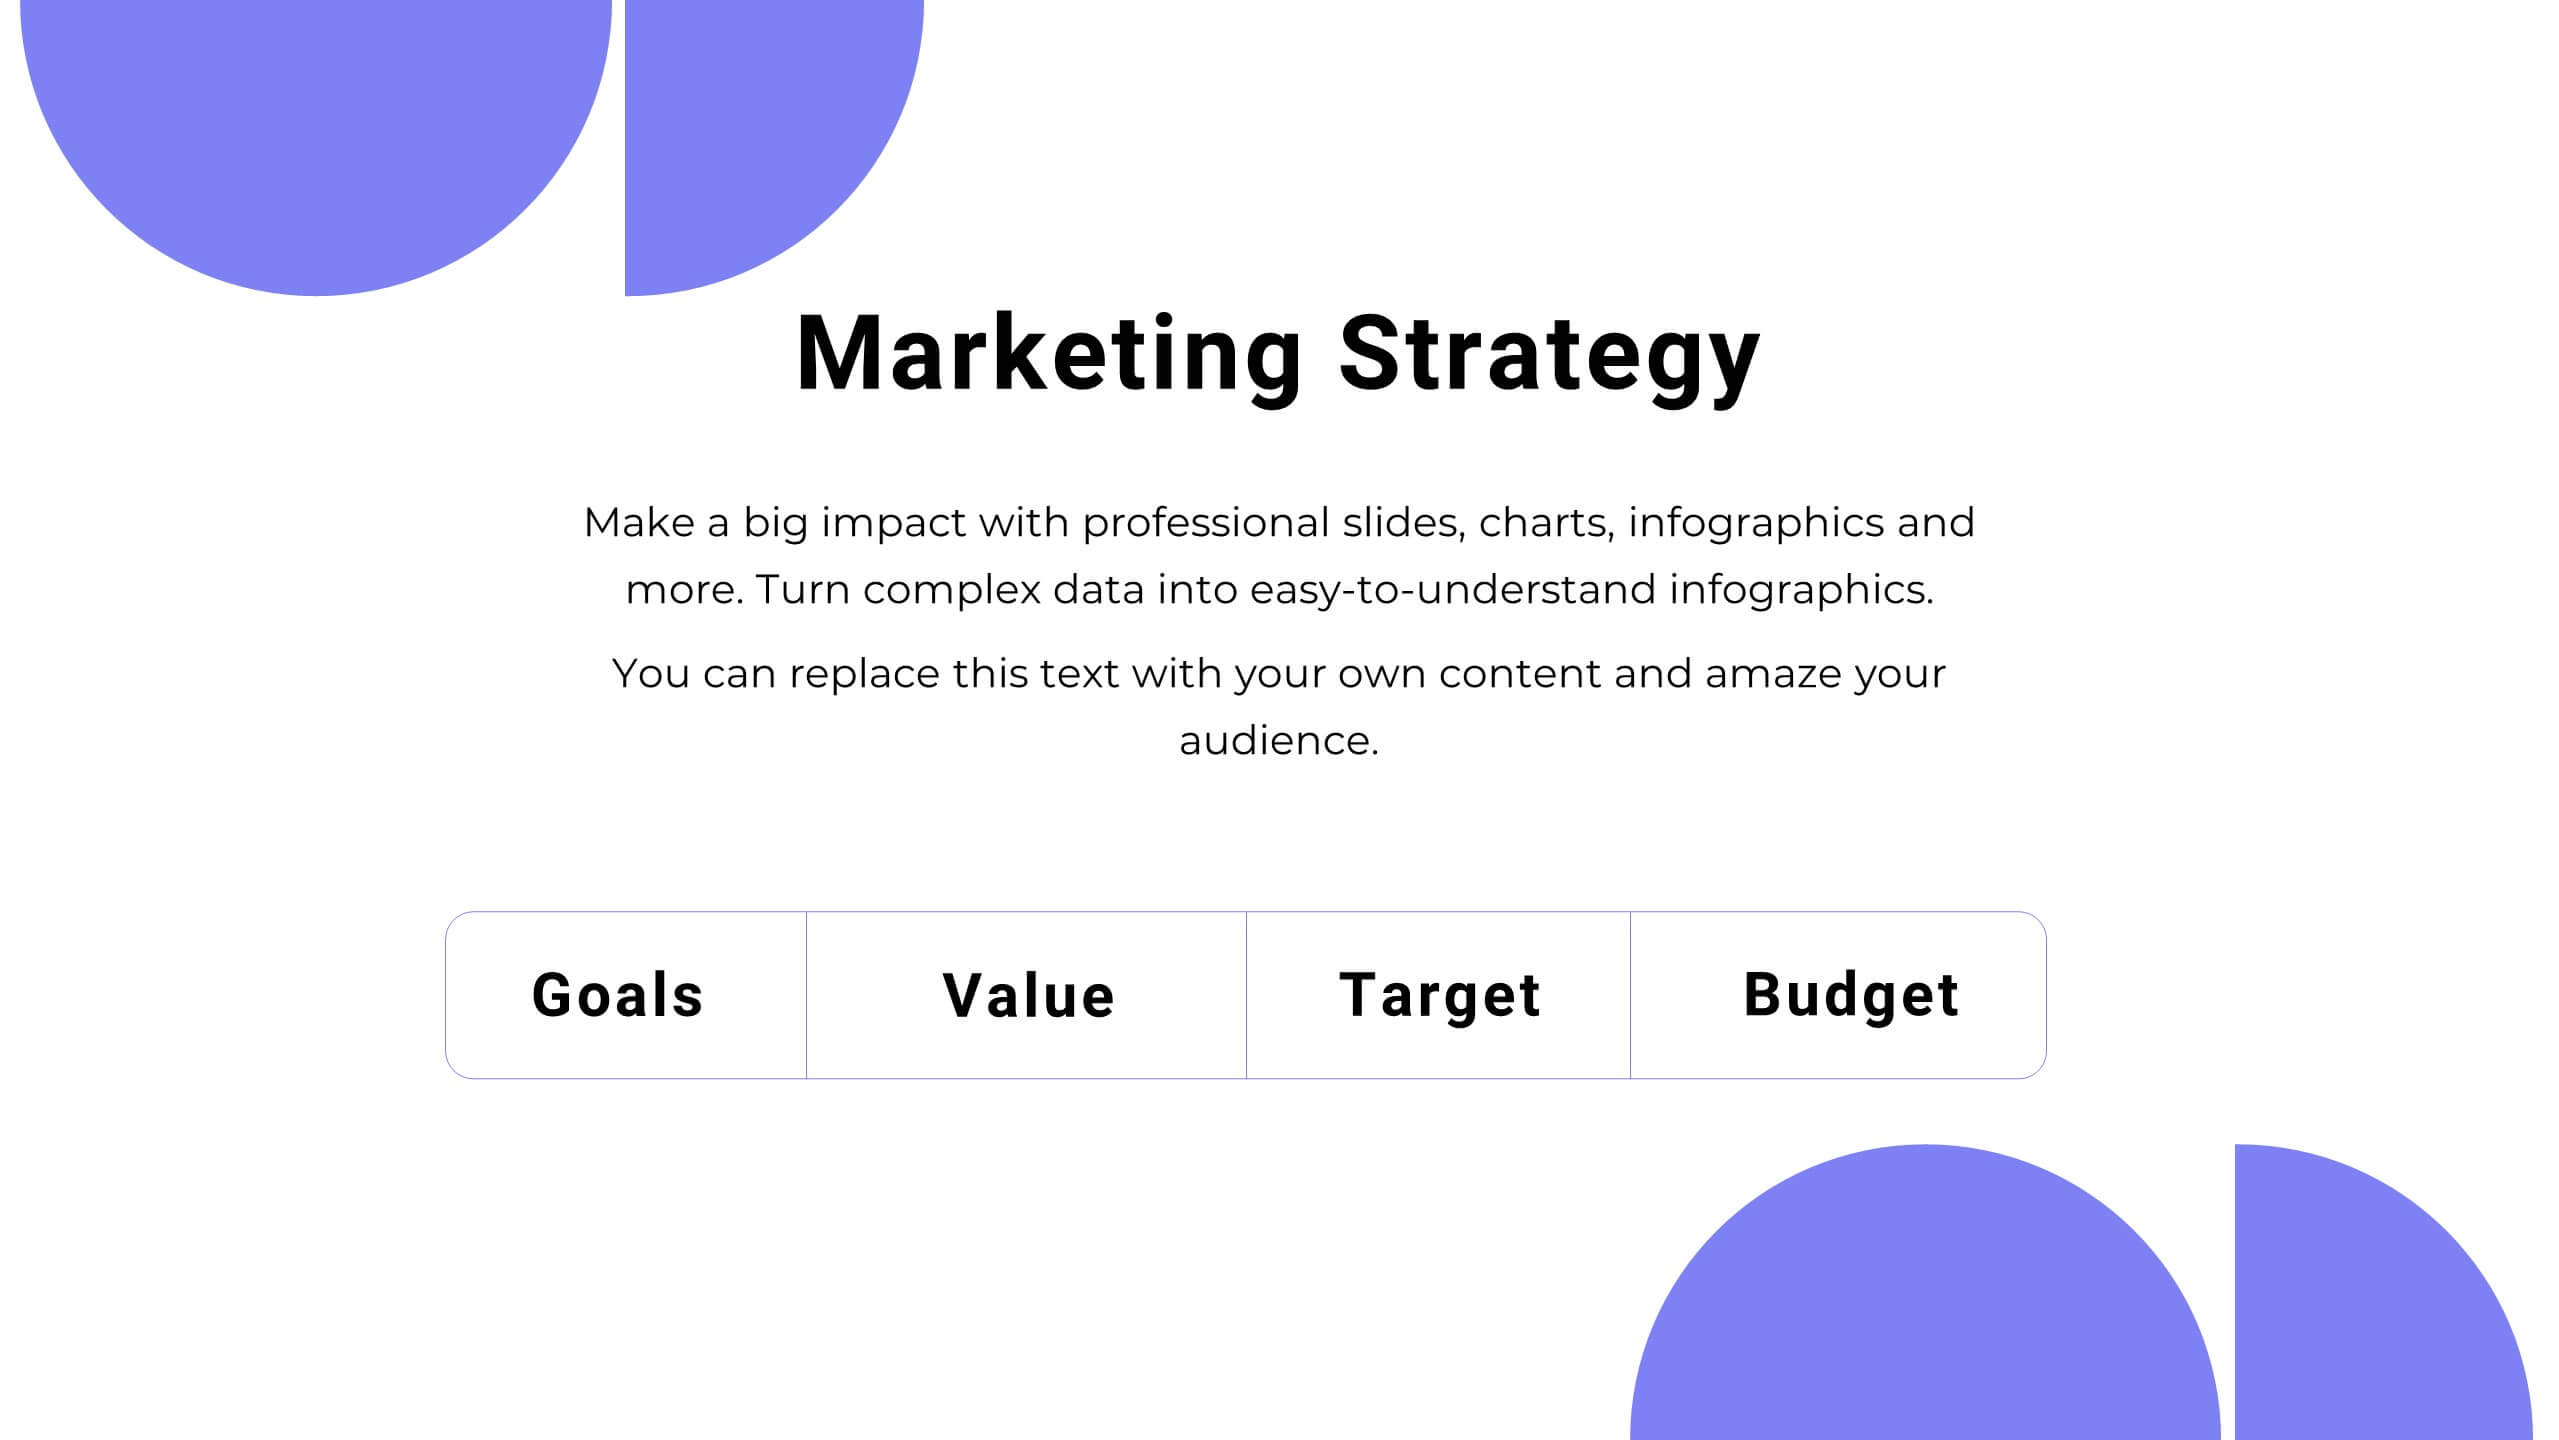
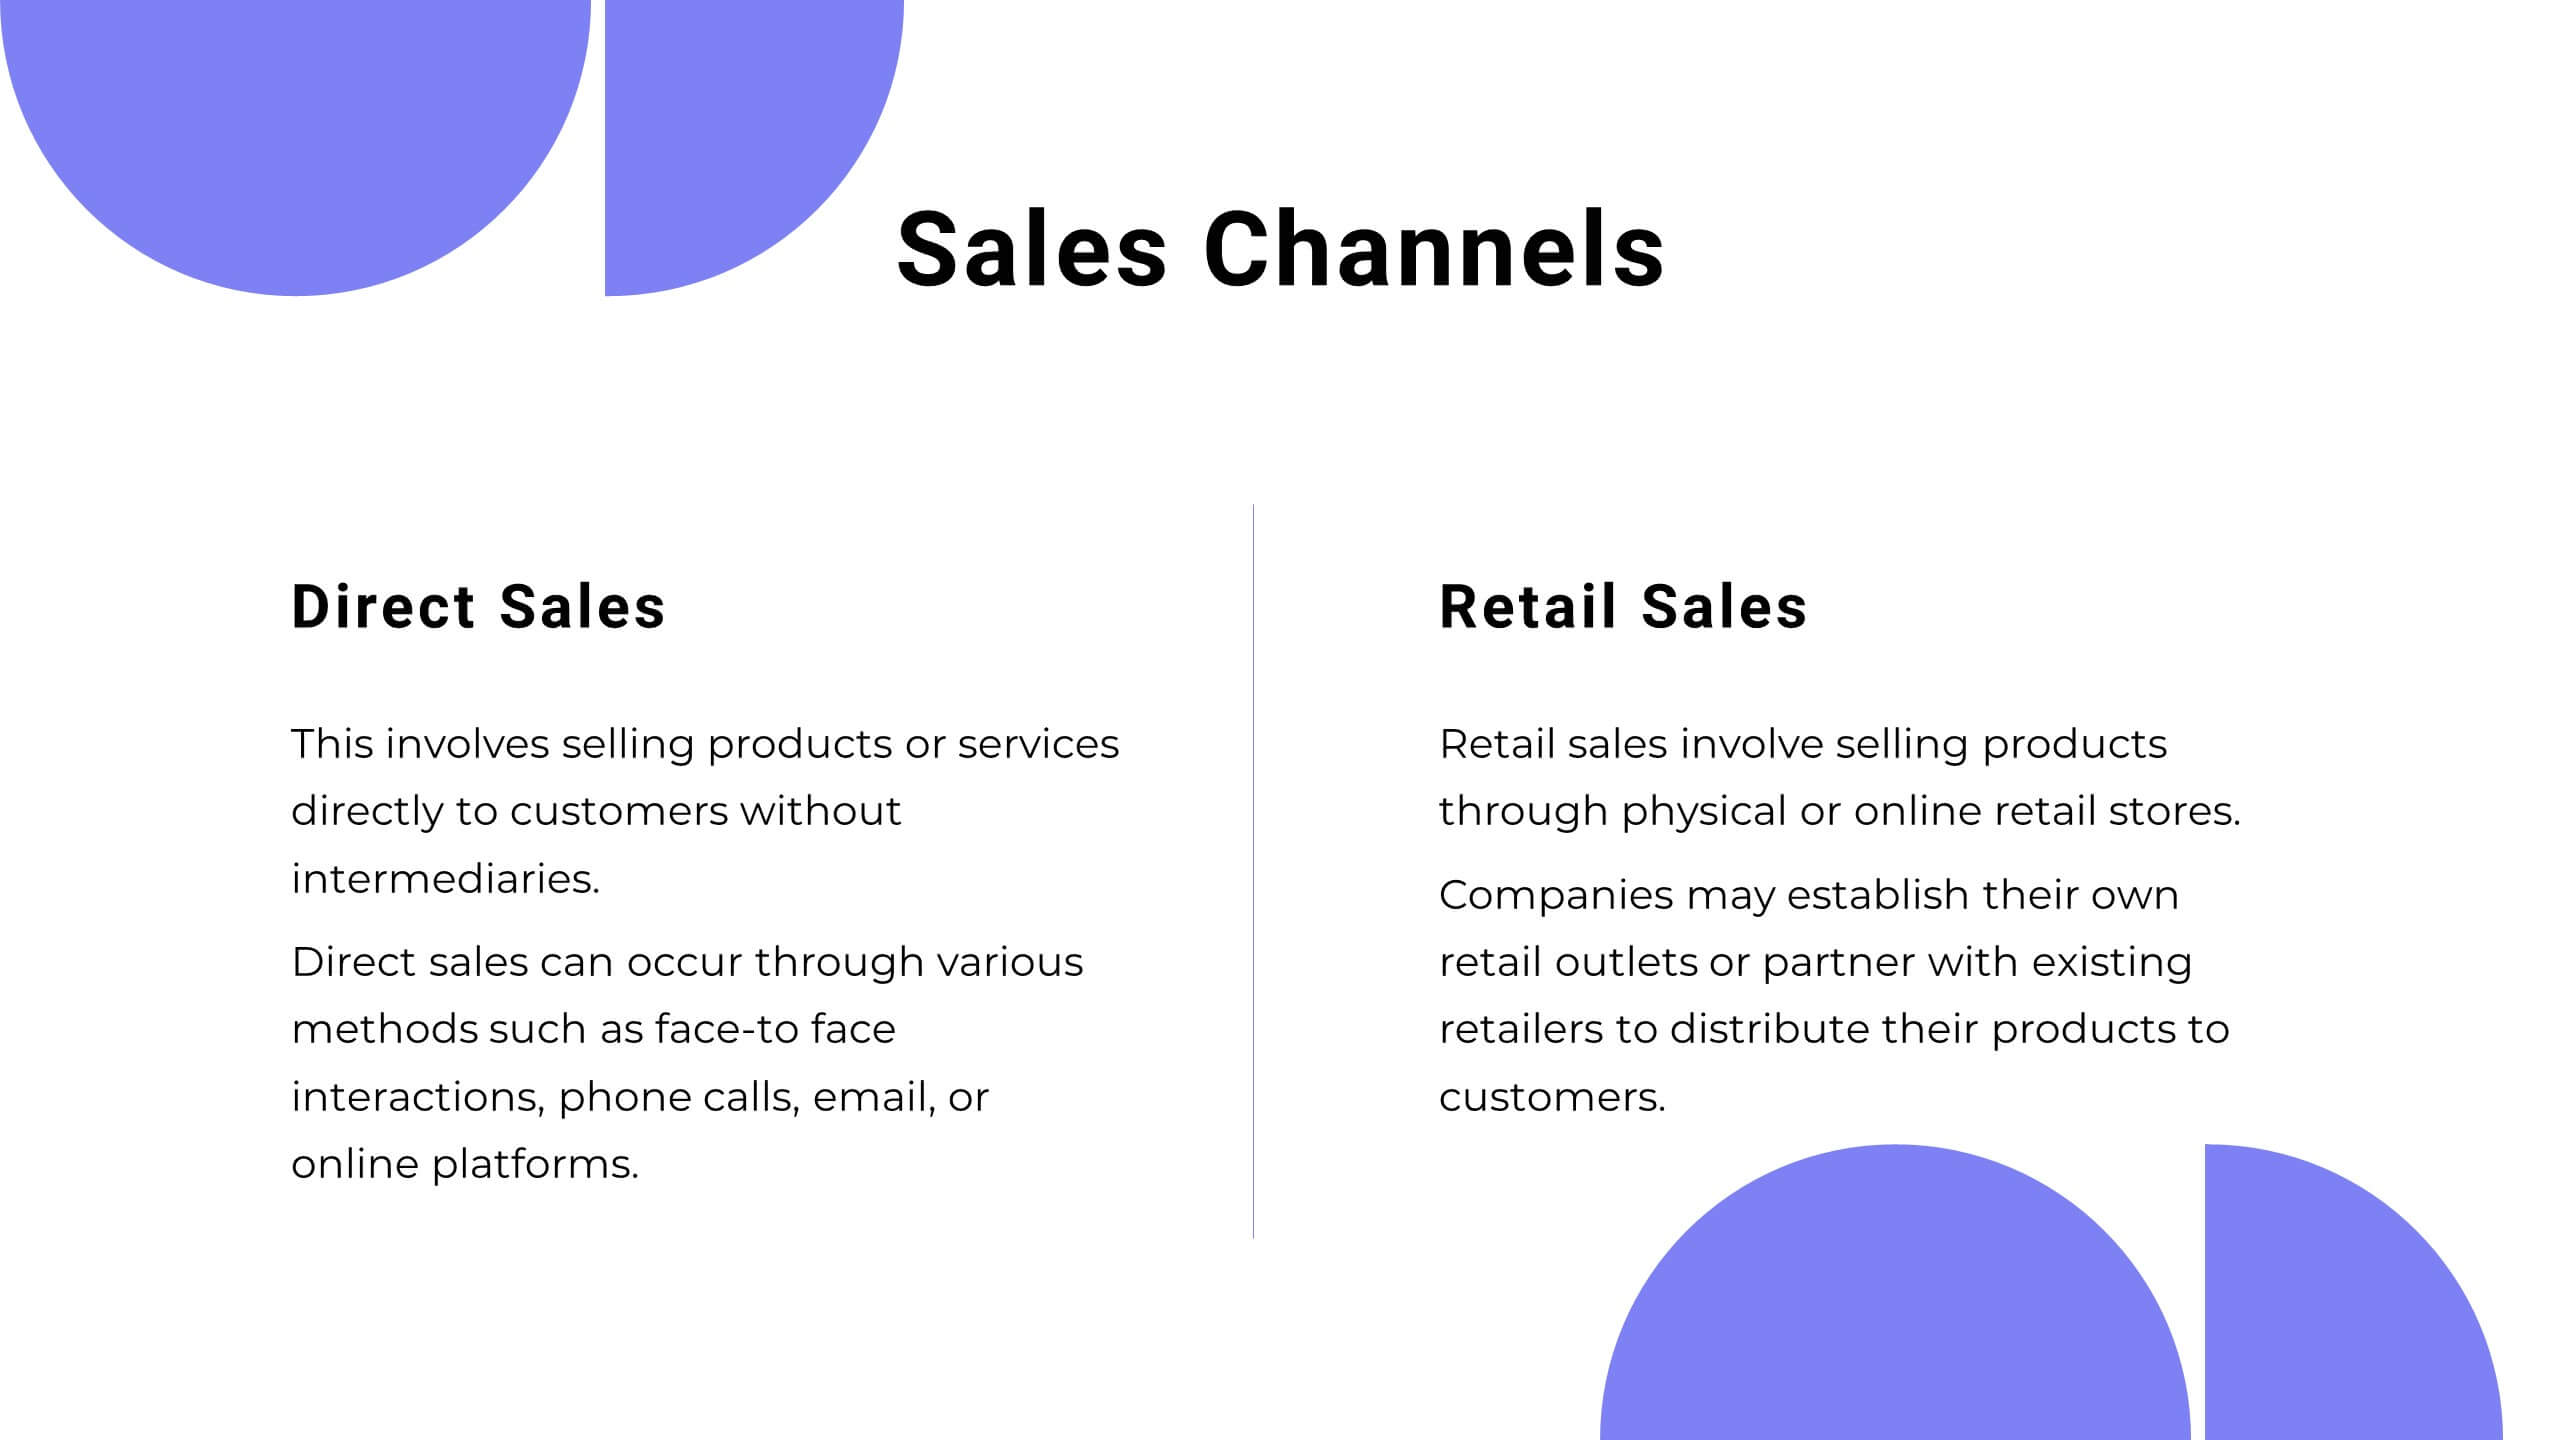
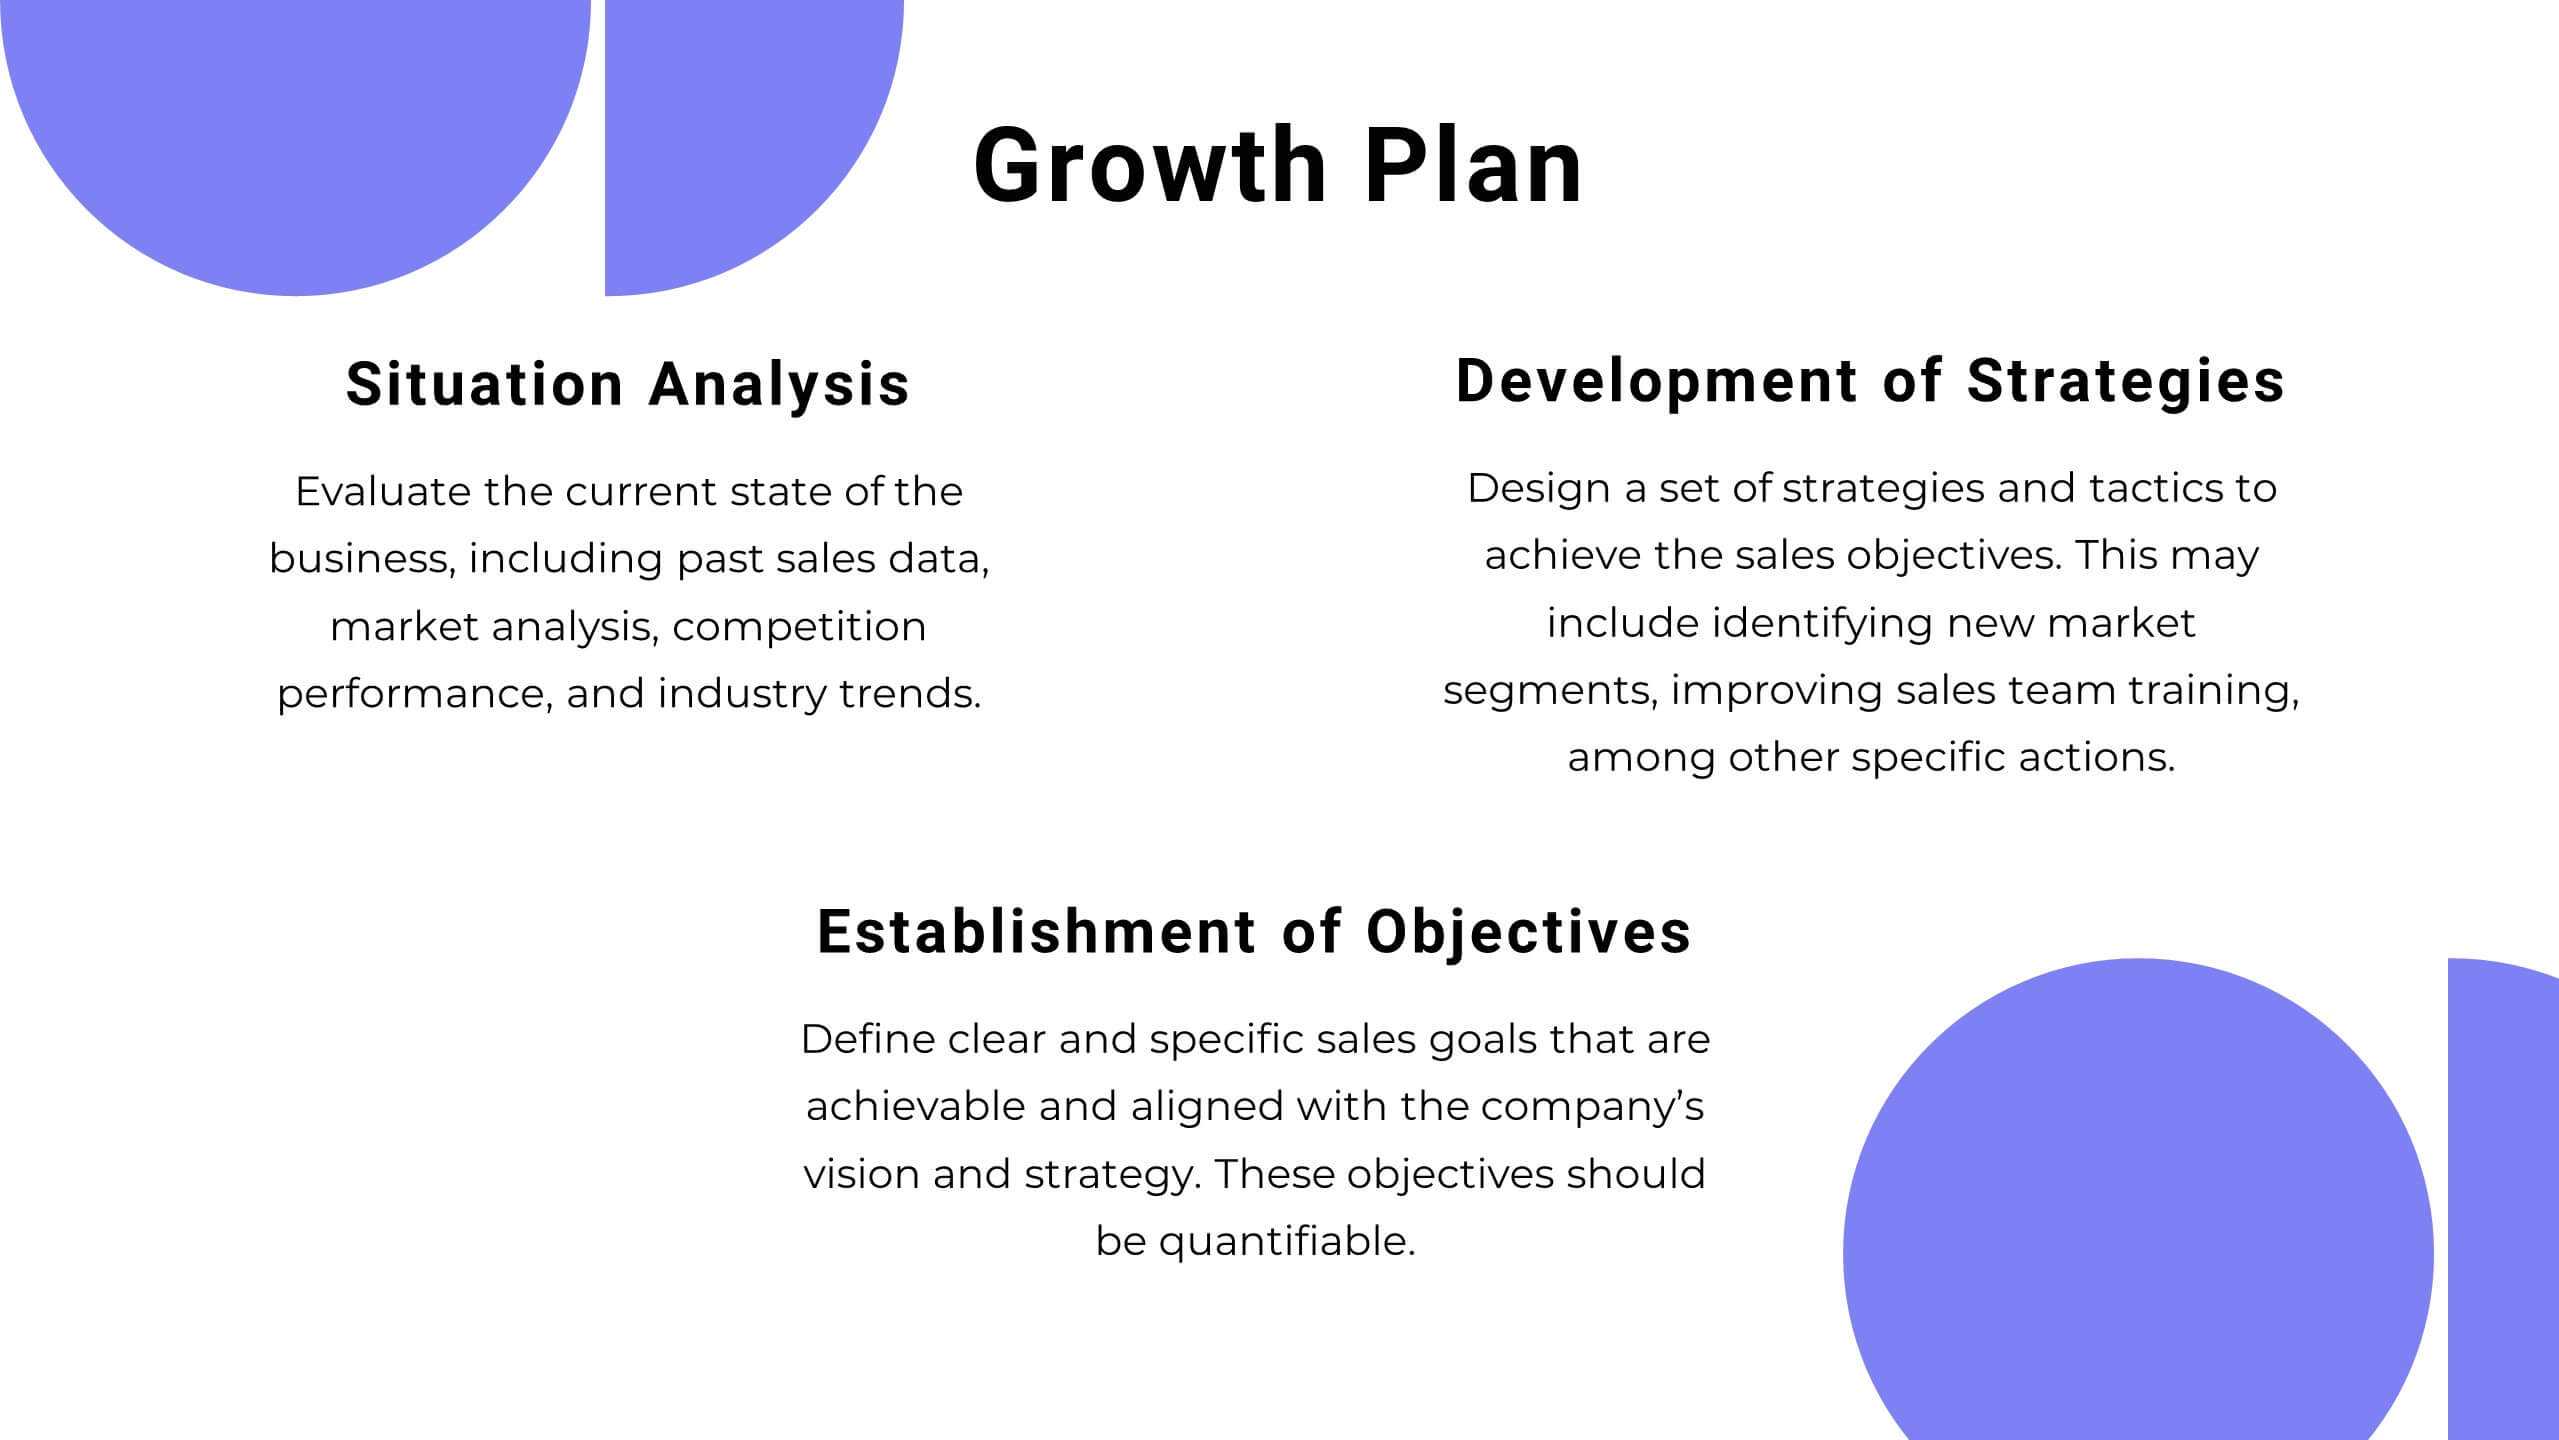
Vibrant Startup Pitch Deck Presentation
This dynamic and modern Startup Pitch Deck template is perfect for showcasing your startup's vision, strategy, and growth potential. Featuring a sleek design with bold visuals, this template guides you through key sections such as mission and vision, product/service overview, target market, and financial projections. It’s tailored to help you tell a compelling story that resonates with investors and stakeholders. The template is fully customizable in PowerPoint, Keynote, or Google Slides, ensuring you can adapt it to your specific needs and create a memorable presentation that leaves a lasting impression.