


Características


¿Tienes alguna pregunta?
Recomendar


26 diapositivas
Beauty Products Company Profile Presentation
A beauty products company is a business that specializes in the development, manufacturing, marketing, and sale of various beauty and skincare products. This presentation template is designed to showcase your cosmetics and skincare brand in the most captivating and alluring way possible. With a blend of elegance and modernity, this template is your beauty brand's ticket to leaving a lasting impression on clients, investors, and partners. Fully customizable and compatible with Powerpoint, Keynote, and Google Slides. The sophisticated color palette will reflect the elegance of your beauty company.


5 diapositivas
Editable Mind Mapping Presentation
Clarify complex thoughts with the Editable Mind Mapping Presentation. This sleek template features a central profile design with five branching points to visualize ideas, processes, or strategies. It's perfect for brainstorming sessions, team collaboration, or project planning. Fully customizable and compatible with PowerPoint, Keynote, and Google Slides.


7 diapositivas
Mind Map Infographic Presentation Template
A mind map is a diagram that allows you to visualize how related ideas and concepts are connected to one another. It is especially good for brainstorming, planning and organizing. A mind map allows you to organize information in a way that shows your thinking process and gives you the opportunity for deeper understanding. This template will help others understand how you think about a particular subject or topic. Use this template to "brainstorm" a topic, and create an interesting mind map. You can also use it to share your ideas with others, or to visually organize your thoughts.


4 diapositivas
Workplace Safety Guidelines Presentation
Create a safer, smarter workspace with this clean and visual presentation design. Ideal for communicating safety standards, compliance rules, and hazard prevention tips, it helps teams stay informed and engaged. Fully customizable and compatible with PowerPoint, Keynote, and Google Slides for easy editing and professional delivery.


5 diapositivas
Startup Business Pitch Deck Presentation
Impress investors with this clean and modern pitch deck slide, designed to showcase business growth and funding stages. Featuring a sleek stacked ring graphic with a rocket icon for visual impact, this layout is perfect for presenting milestones, KPIs, or financial progress. Fully editable in PowerPoint, Keynote, and Google Slides.


5 diapositivas
Sports Performance Analysis Presentation
Visualize athletic metrics and improvement strategies with this Sports Performance Analysis slide layout. Designed around a dynamic running figure, it uses labeled circular markers (A–D) to clearly break down four key insights or action points. Perfect for sports reviews, training breakdowns, or coaching sessions. Fully editable in PowerPoint, Keynote, and Google Slides.


20 diapositivas
Vitrumin Photography Portfolio Presentation
Showcase your creative work with this elegant and modern photography portfolio presentation template. Featuring essential slides such as an introduction, project highlights, creative process, awards, and client testimonials, this template is perfect for presenting your work professionally. Fully customizable and easy to edit, it's compatible with PowerPoint, Keynote, and Google Slides.


6 diapositivas
Revenue Cycle Infographic
The Revenue Cycle refers to the set of processes and activities involved in generating revenue for a business. This infographic template serves as a comprehensive guide to understanding and optimizing the revenue generation cycle. This presents the key stages, processes, metrics, and strategies involved in managing revenue in a colorful visually engaging and easy-to-understand format. With this template, you can effectively communicate the revenue cycle concepts and promote revenue optimization within your organization. Fully customizable and compatible with Powerpoint, Keynote, and Google Slides.


6 diapositivas
Strategic Blocks in Business Canvas
Visualize and communicate your business model effectively with the Strategic Blocks in Business Canvas Presentation. This slide breaks down all critical segments—Partners, Activities, Resources, Value Propositions, Channels, Revenue Streams, and more—into a clean and colorful layout for strategic planning and stakeholder alignment. Fully editable in PowerPoint, Keynote, and Google Slides.


8 diapositivas
Project Execution Next Steps
Break down your implementation plan with this visually engaging 3D layered funnel infographic. Ideal for showcasing four key stages in project delivery, each step is color-coded and paired with icons and descriptive text. Great for status updates, strategy meetings, or team briefings. Fully customizable in PowerPoint, Keynote, and Google Slides.


5 diapositivas
5-Step Business Optimization Plan Presentation
Showcase your improvement roadmap using this 5-step building block diagram. Perfect for illustrating sequential development, each step is styled like interlocking bricks to convey progress and structure. Fully editable in PowerPoint, Keynote, and Google Slides—ideal for strategic planning, process optimization, and business growth presentations needing a clear step-by-step layout.


7 diapositivas
Project Timeline Presentation
Visualize key milestones with this project timeline presentation template. Designed to highlight each phase with clarity, it's perfect for project managers, planners, and teams tracking progress. The horizontal layout, color-coded steps, and year indicators make it easy to customize in PowerPoint, Keynote, or Google Slides for any industry.


26 diapositivas
Premium Finance for Daily Life Presentation
Introducing our Premium Finance for Daily Life Presentation template this is a comprehensive and informative tool to educate individuals about the concept of premium finance and its relevance in everyday life. This presentation aims to provide valuable insights on how premium finance can be utilized to manage and optimize personal finances. The slides are fully customizable and compatible with PowerPoint, Keynote, and Google Slides. It features a professional design with clean layouts, visually appealing graphics, and icons related to finance and daily life activities. The presentation can cover various topics related to premium finance.


7 diapositivas
Idea Clustering Mind Map Presentation
Great ideas become clearer when you can see how everything connects, and this presentation makes that process effortless. It helps you organize thoughts, group related concepts, and visually map creative themes for planning or strategy discussions. Clean, modern, and easy to customize. Fully compatible with PowerPoint, Keynote, and Google Slides.

20 diapositivas
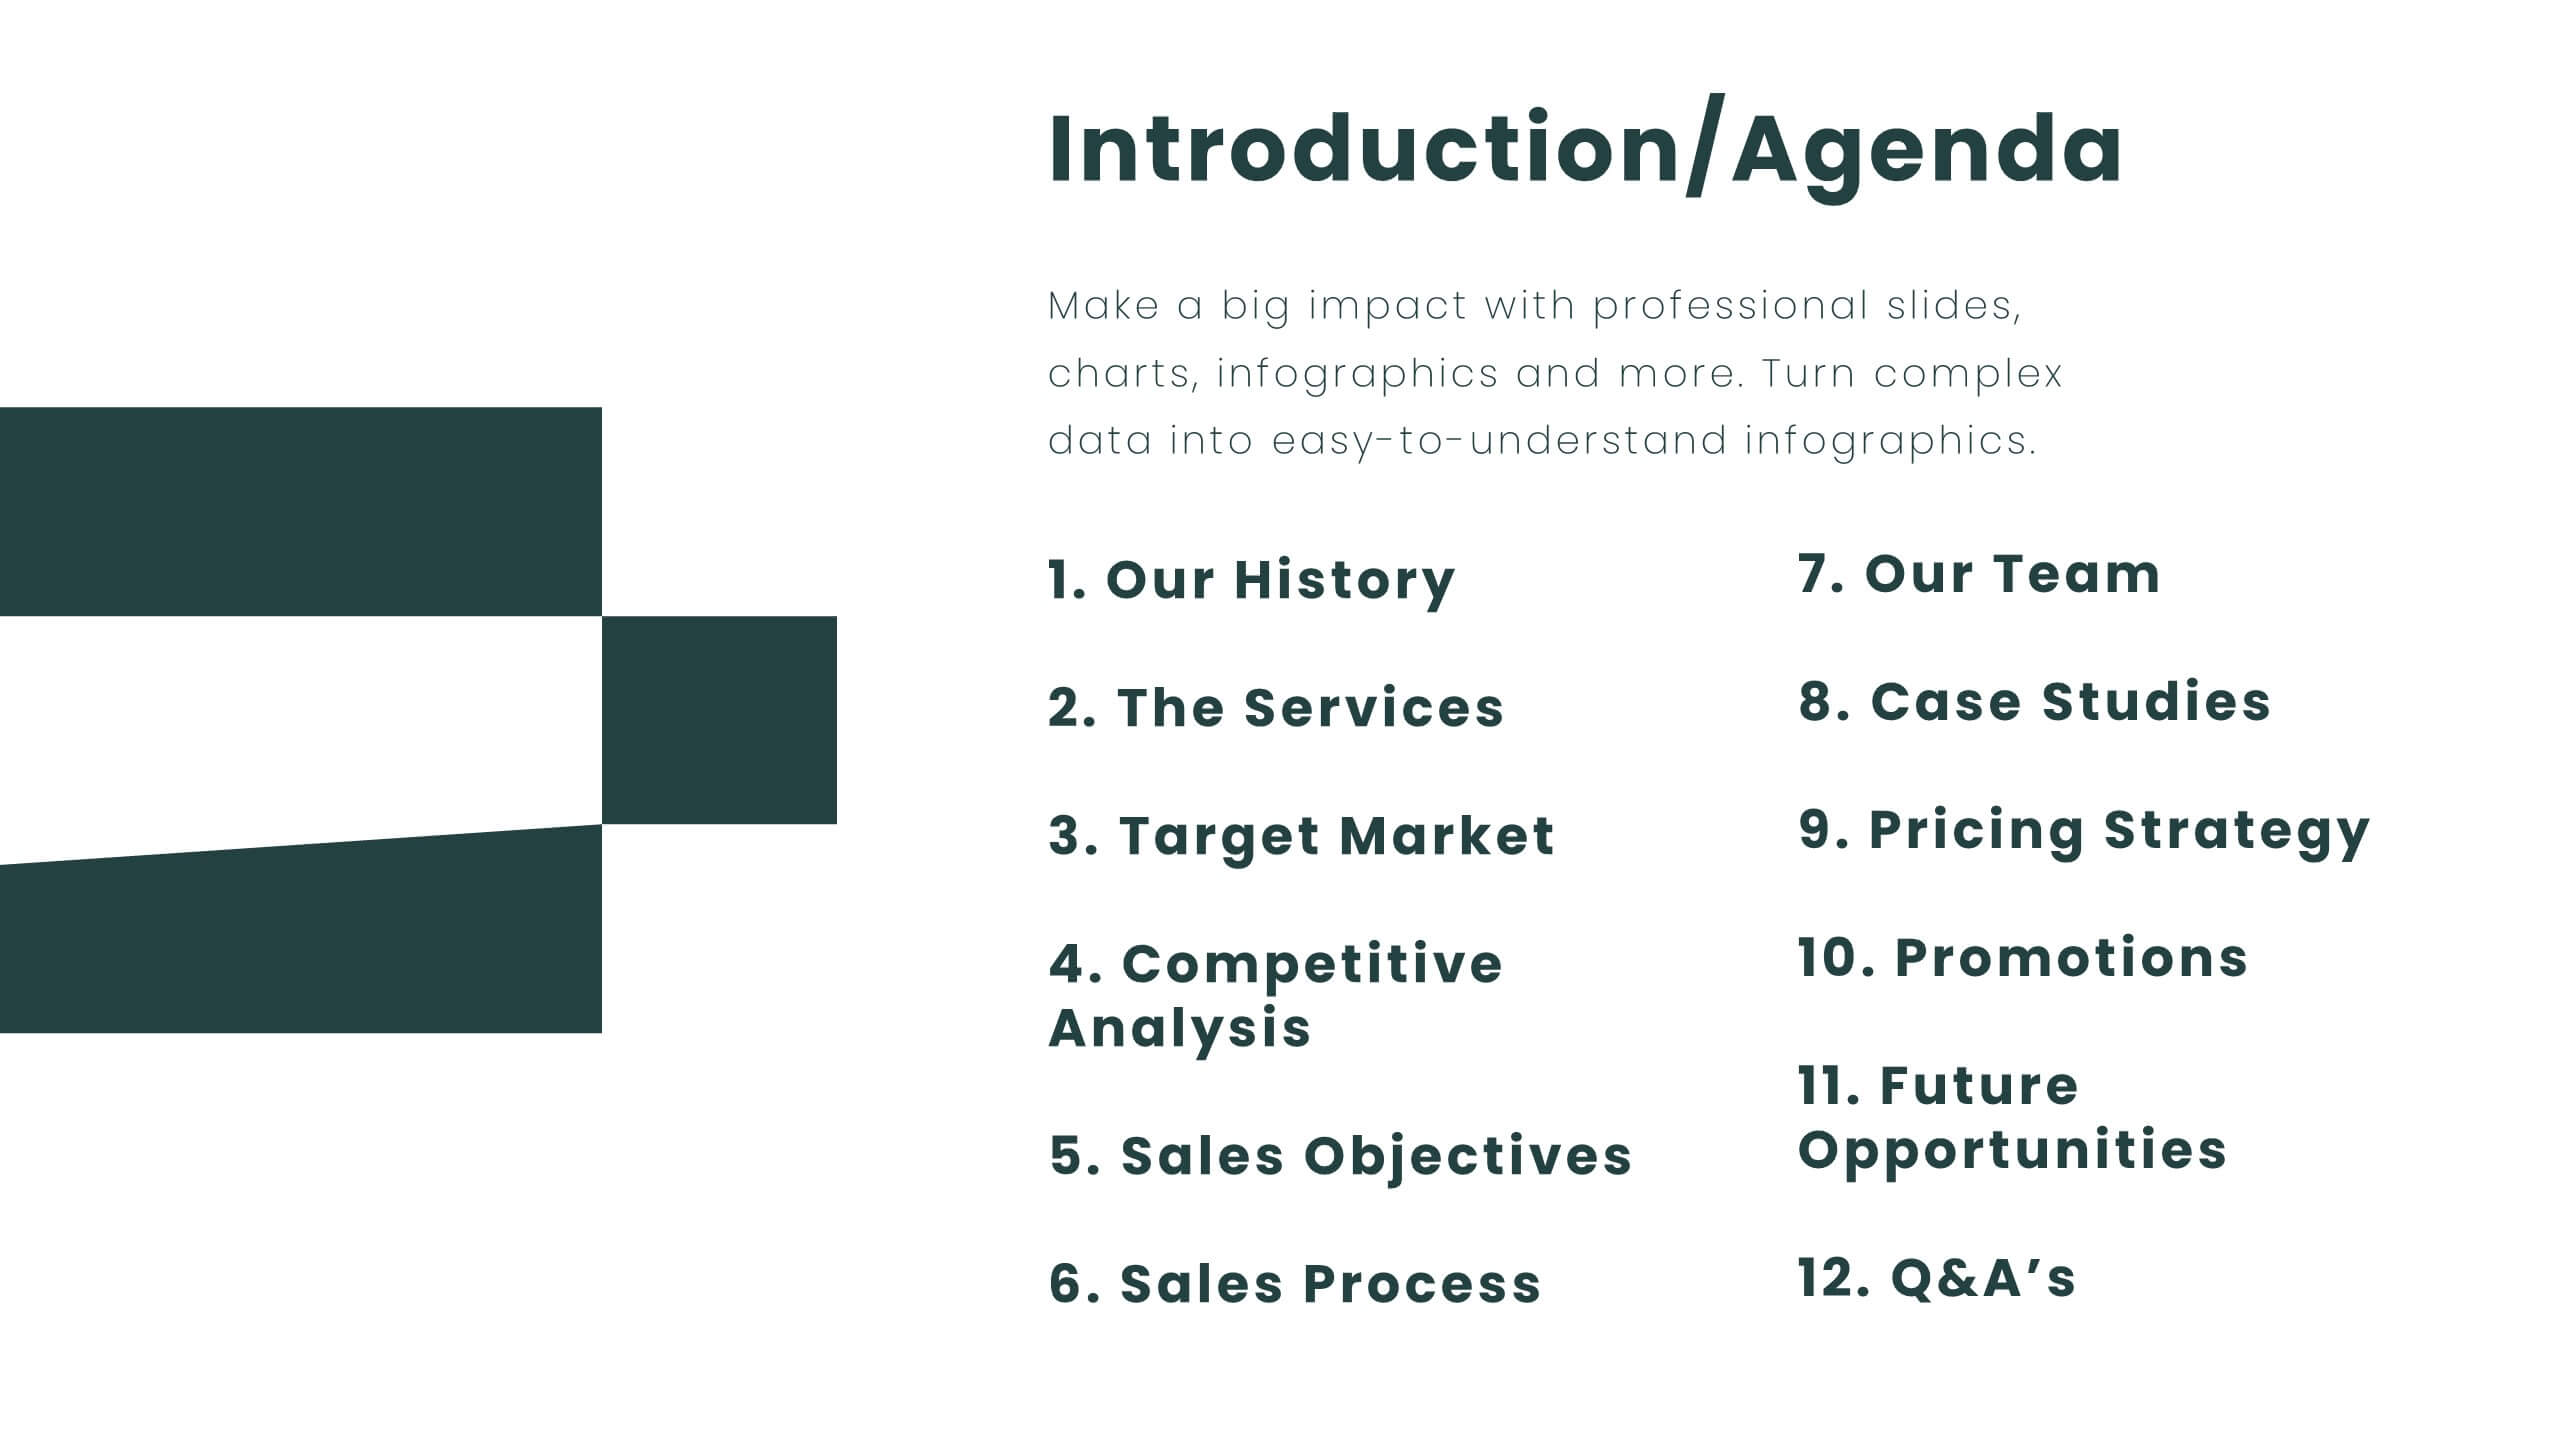
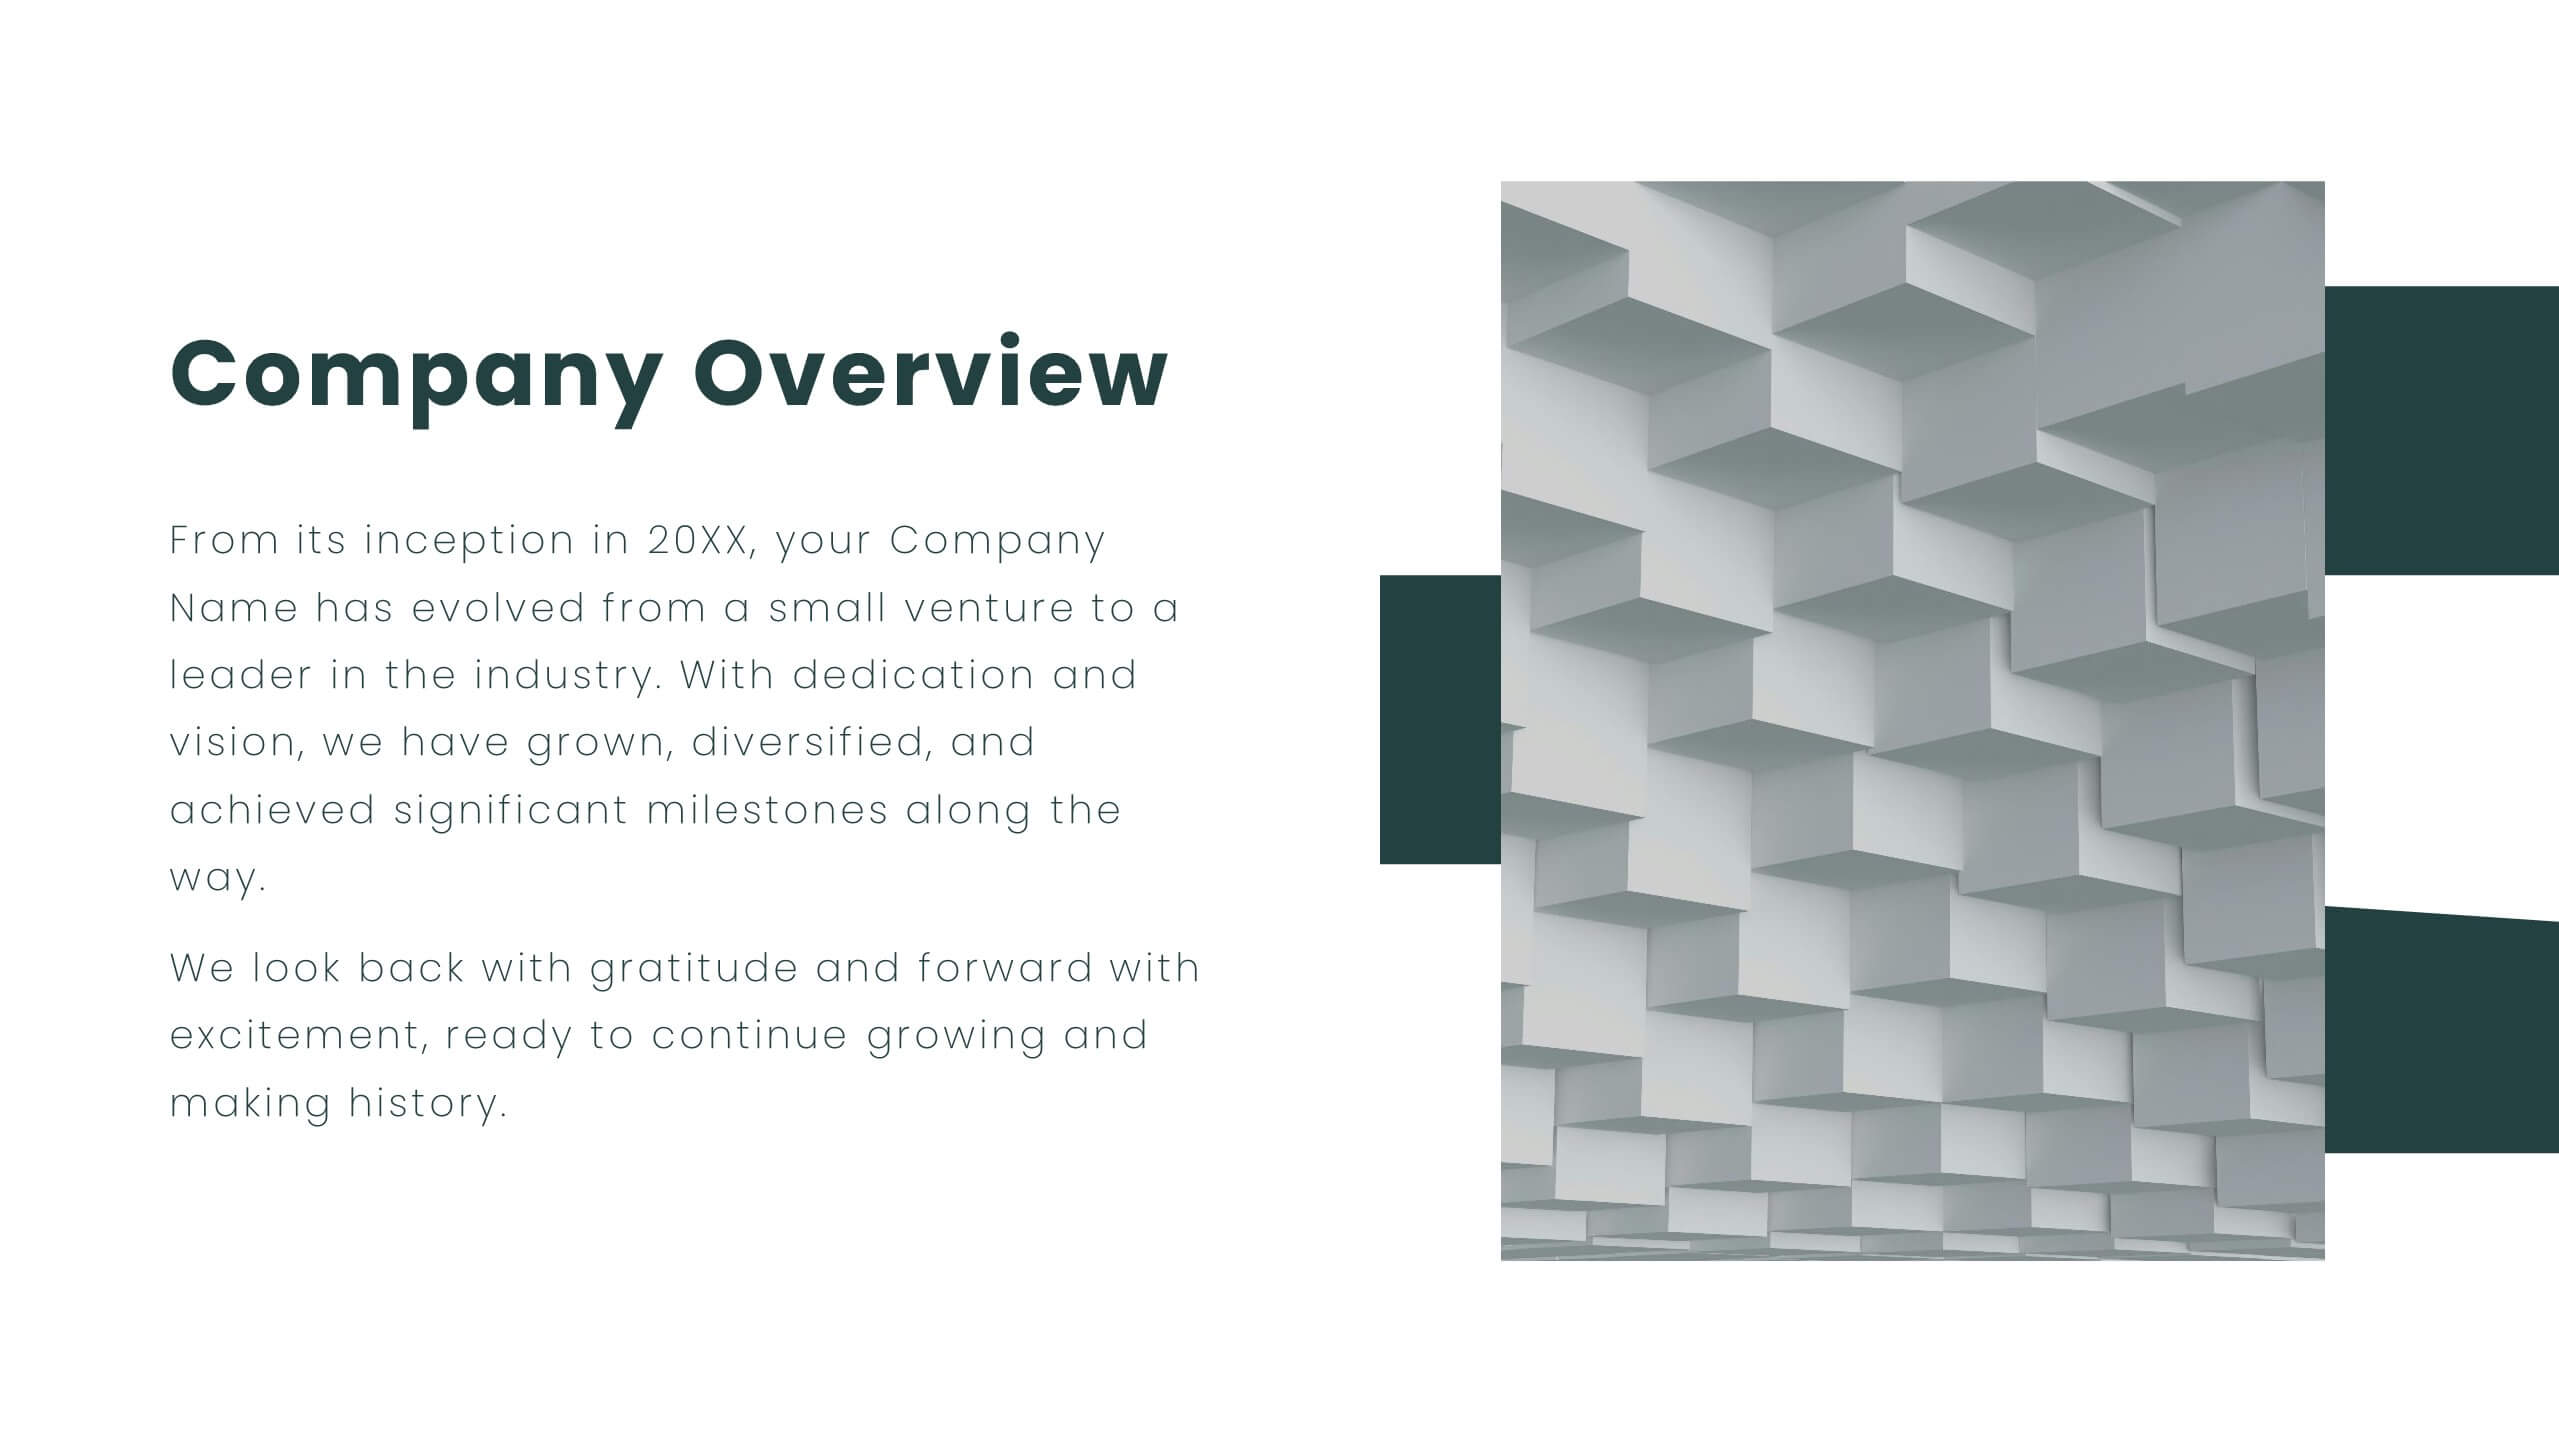
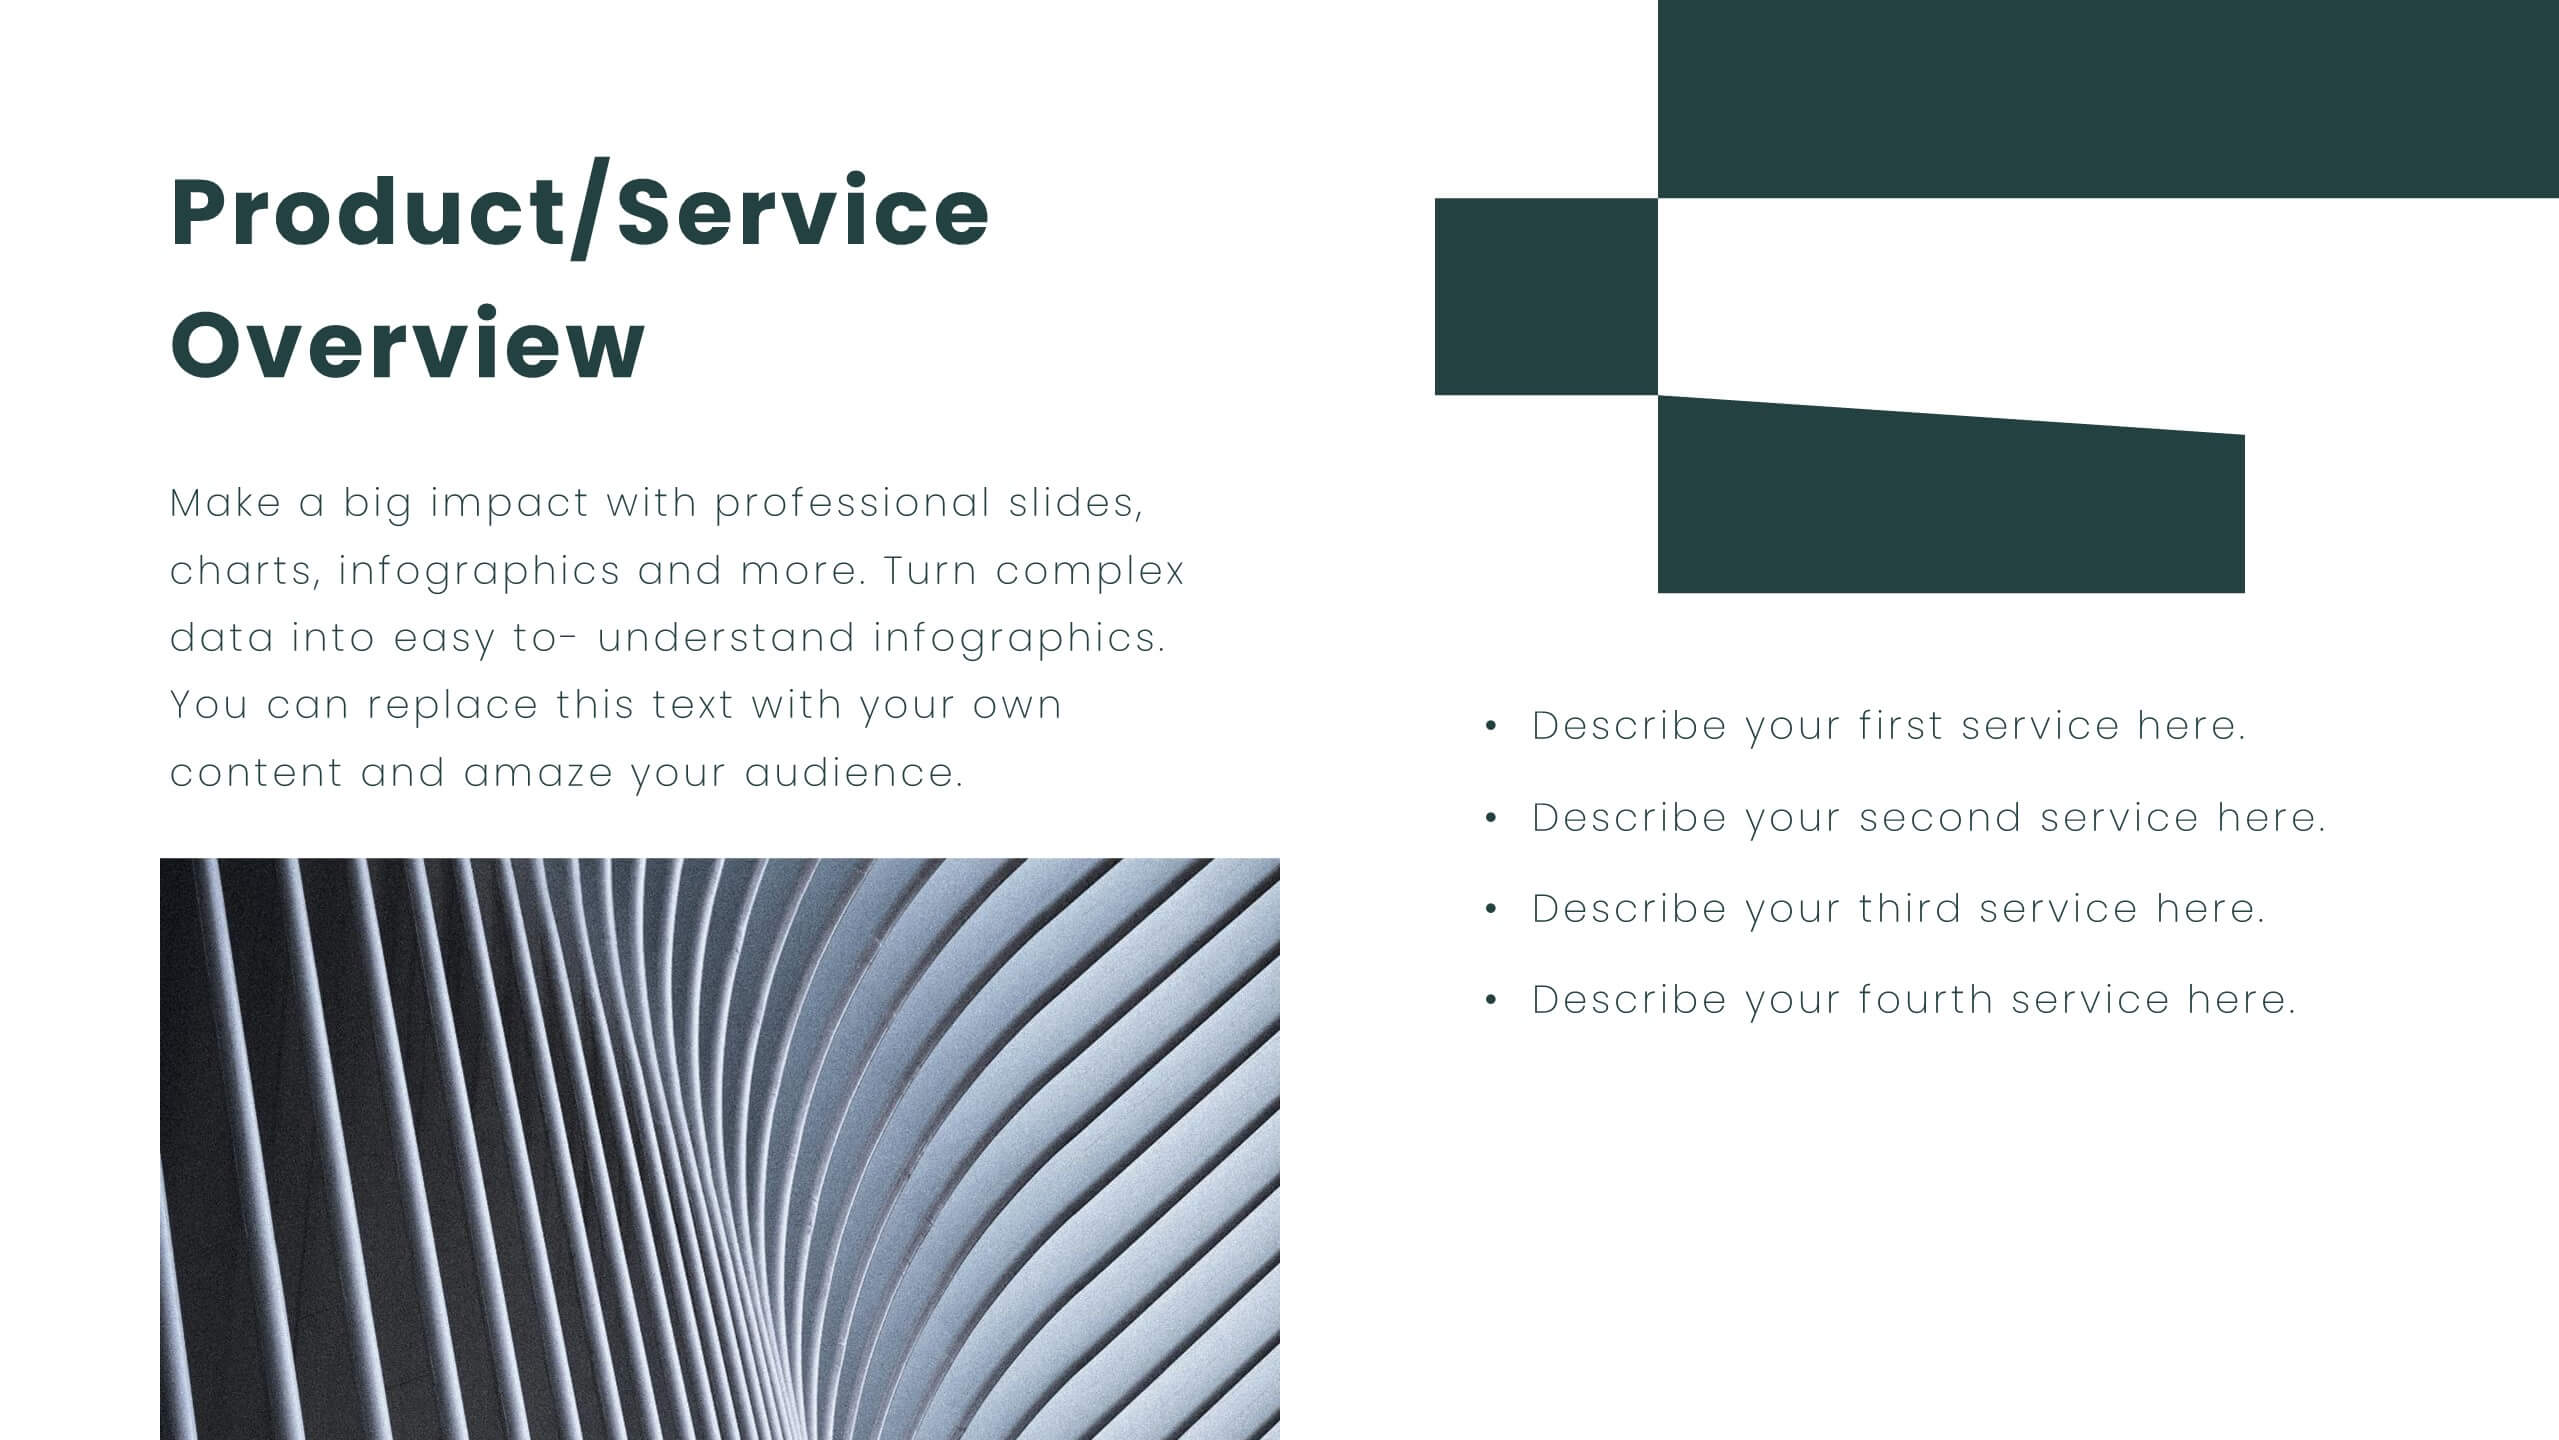
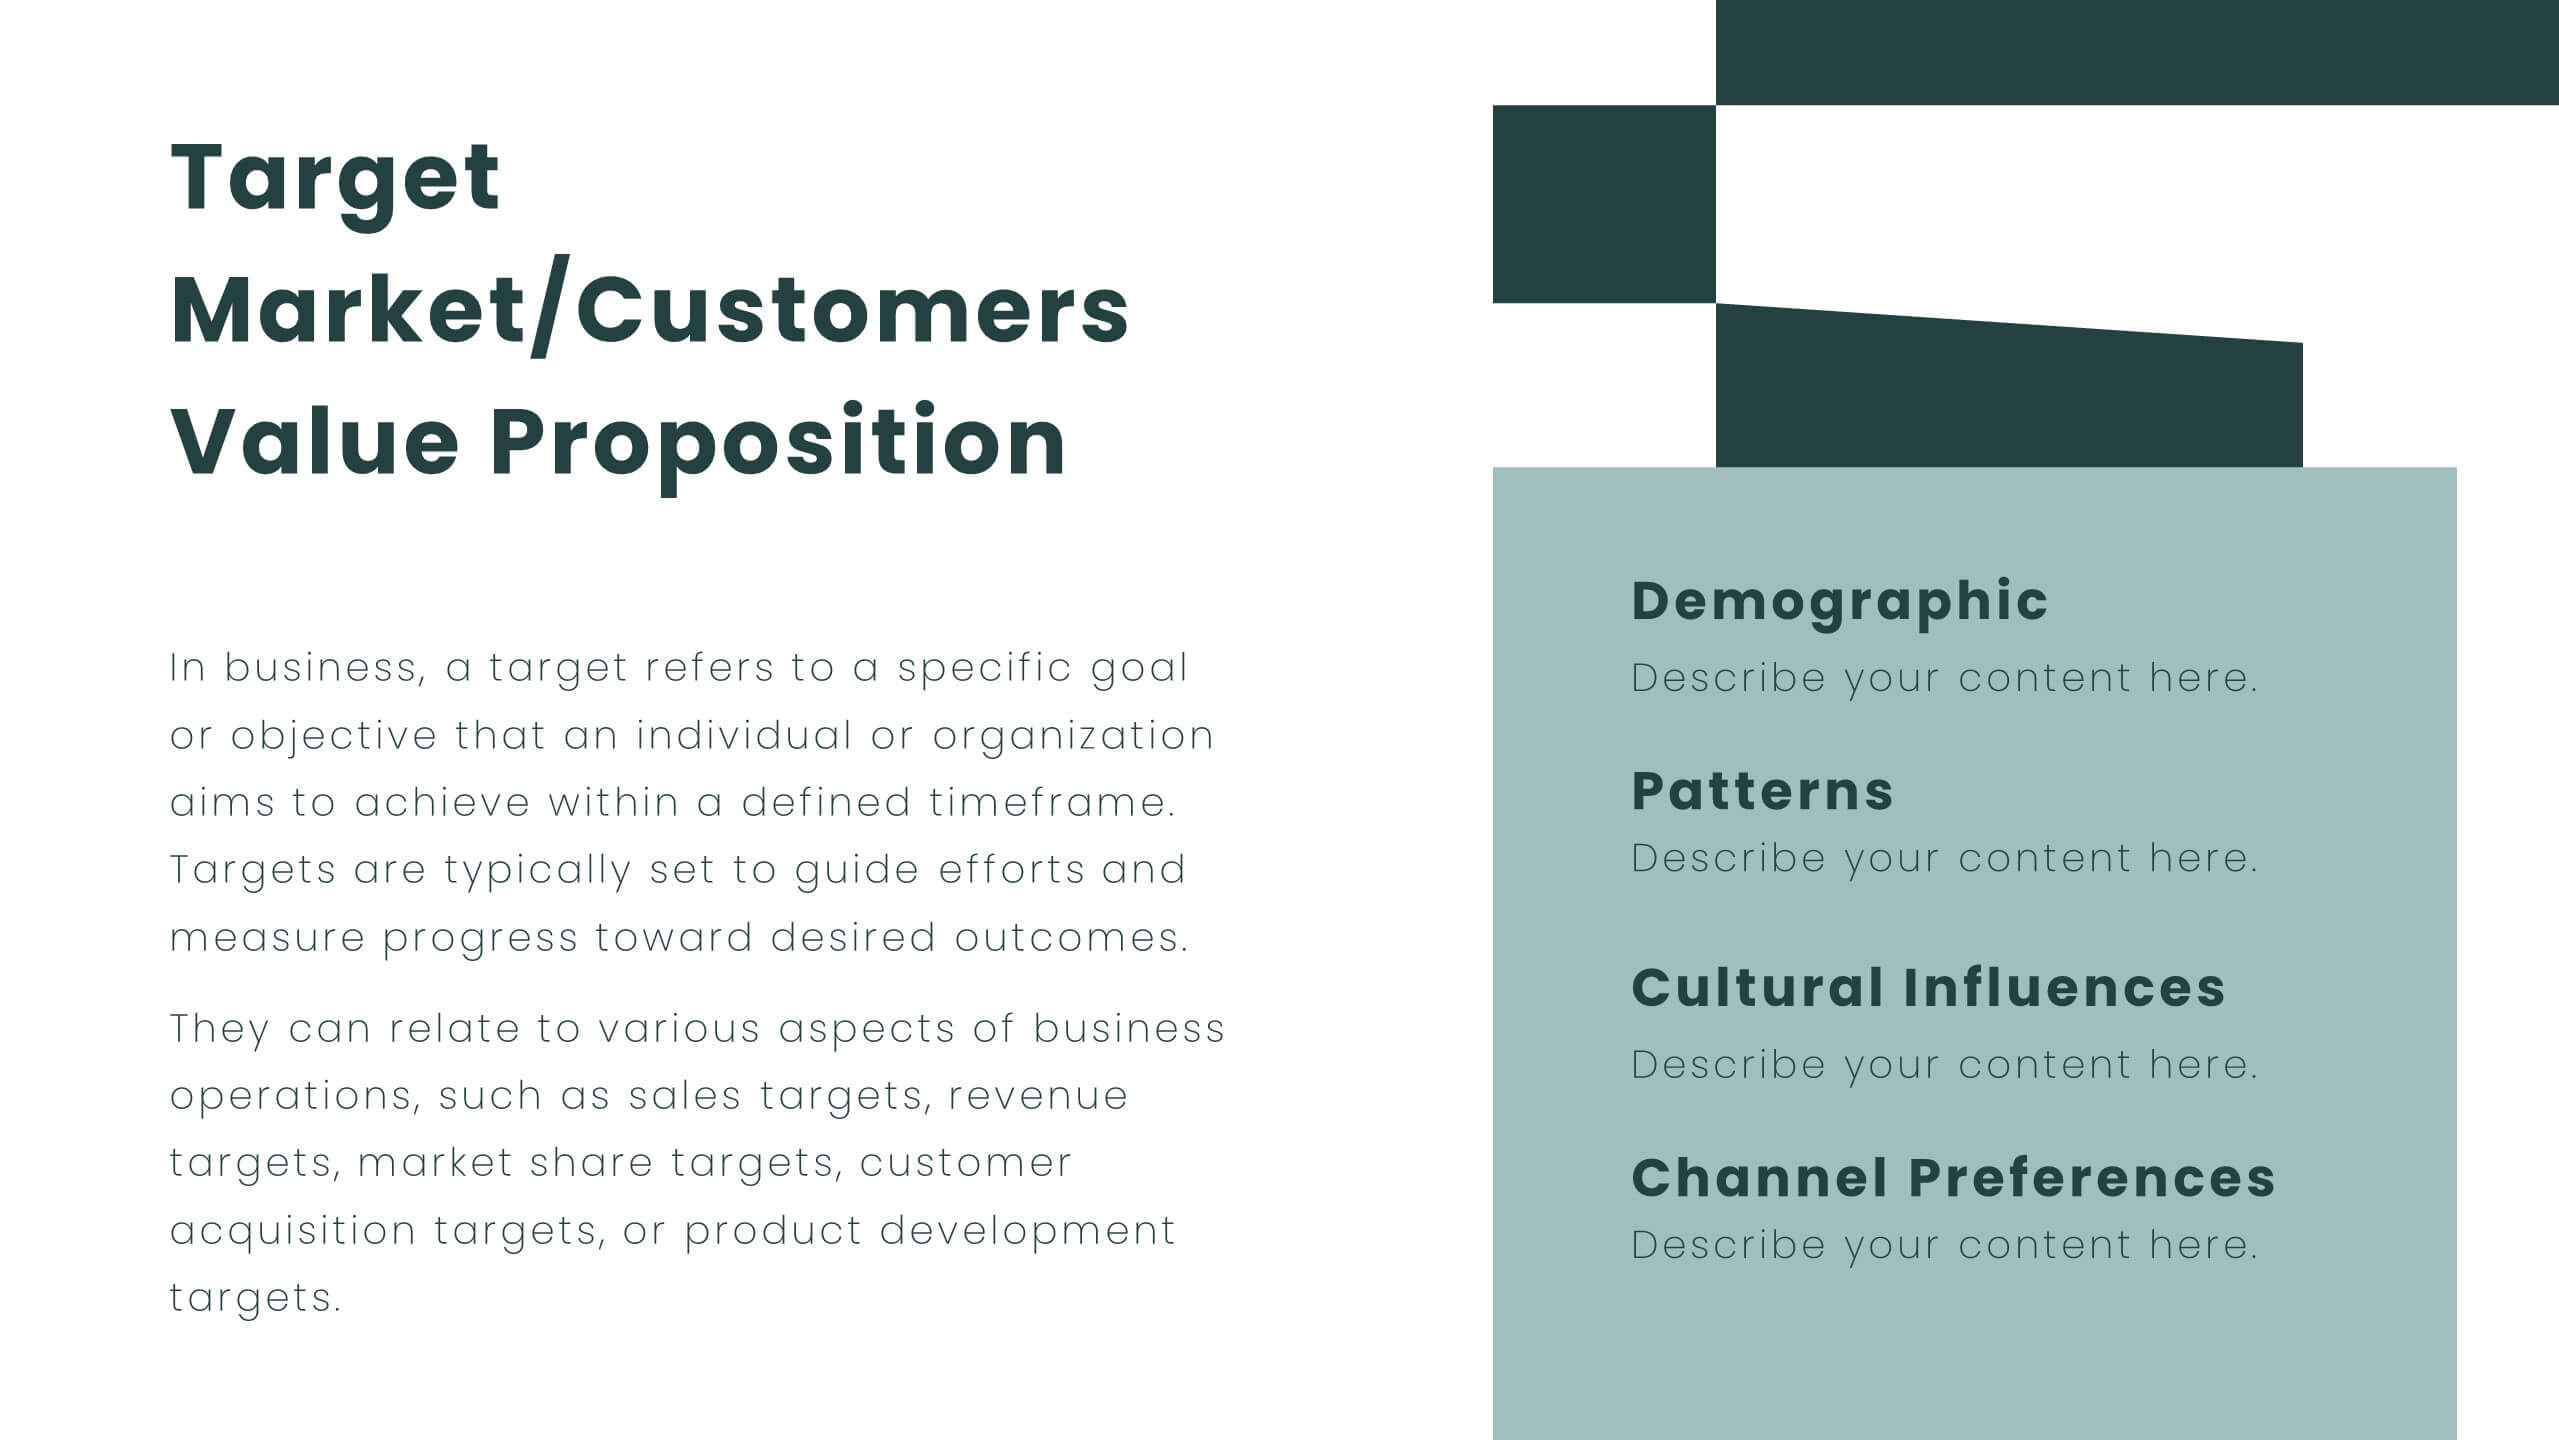
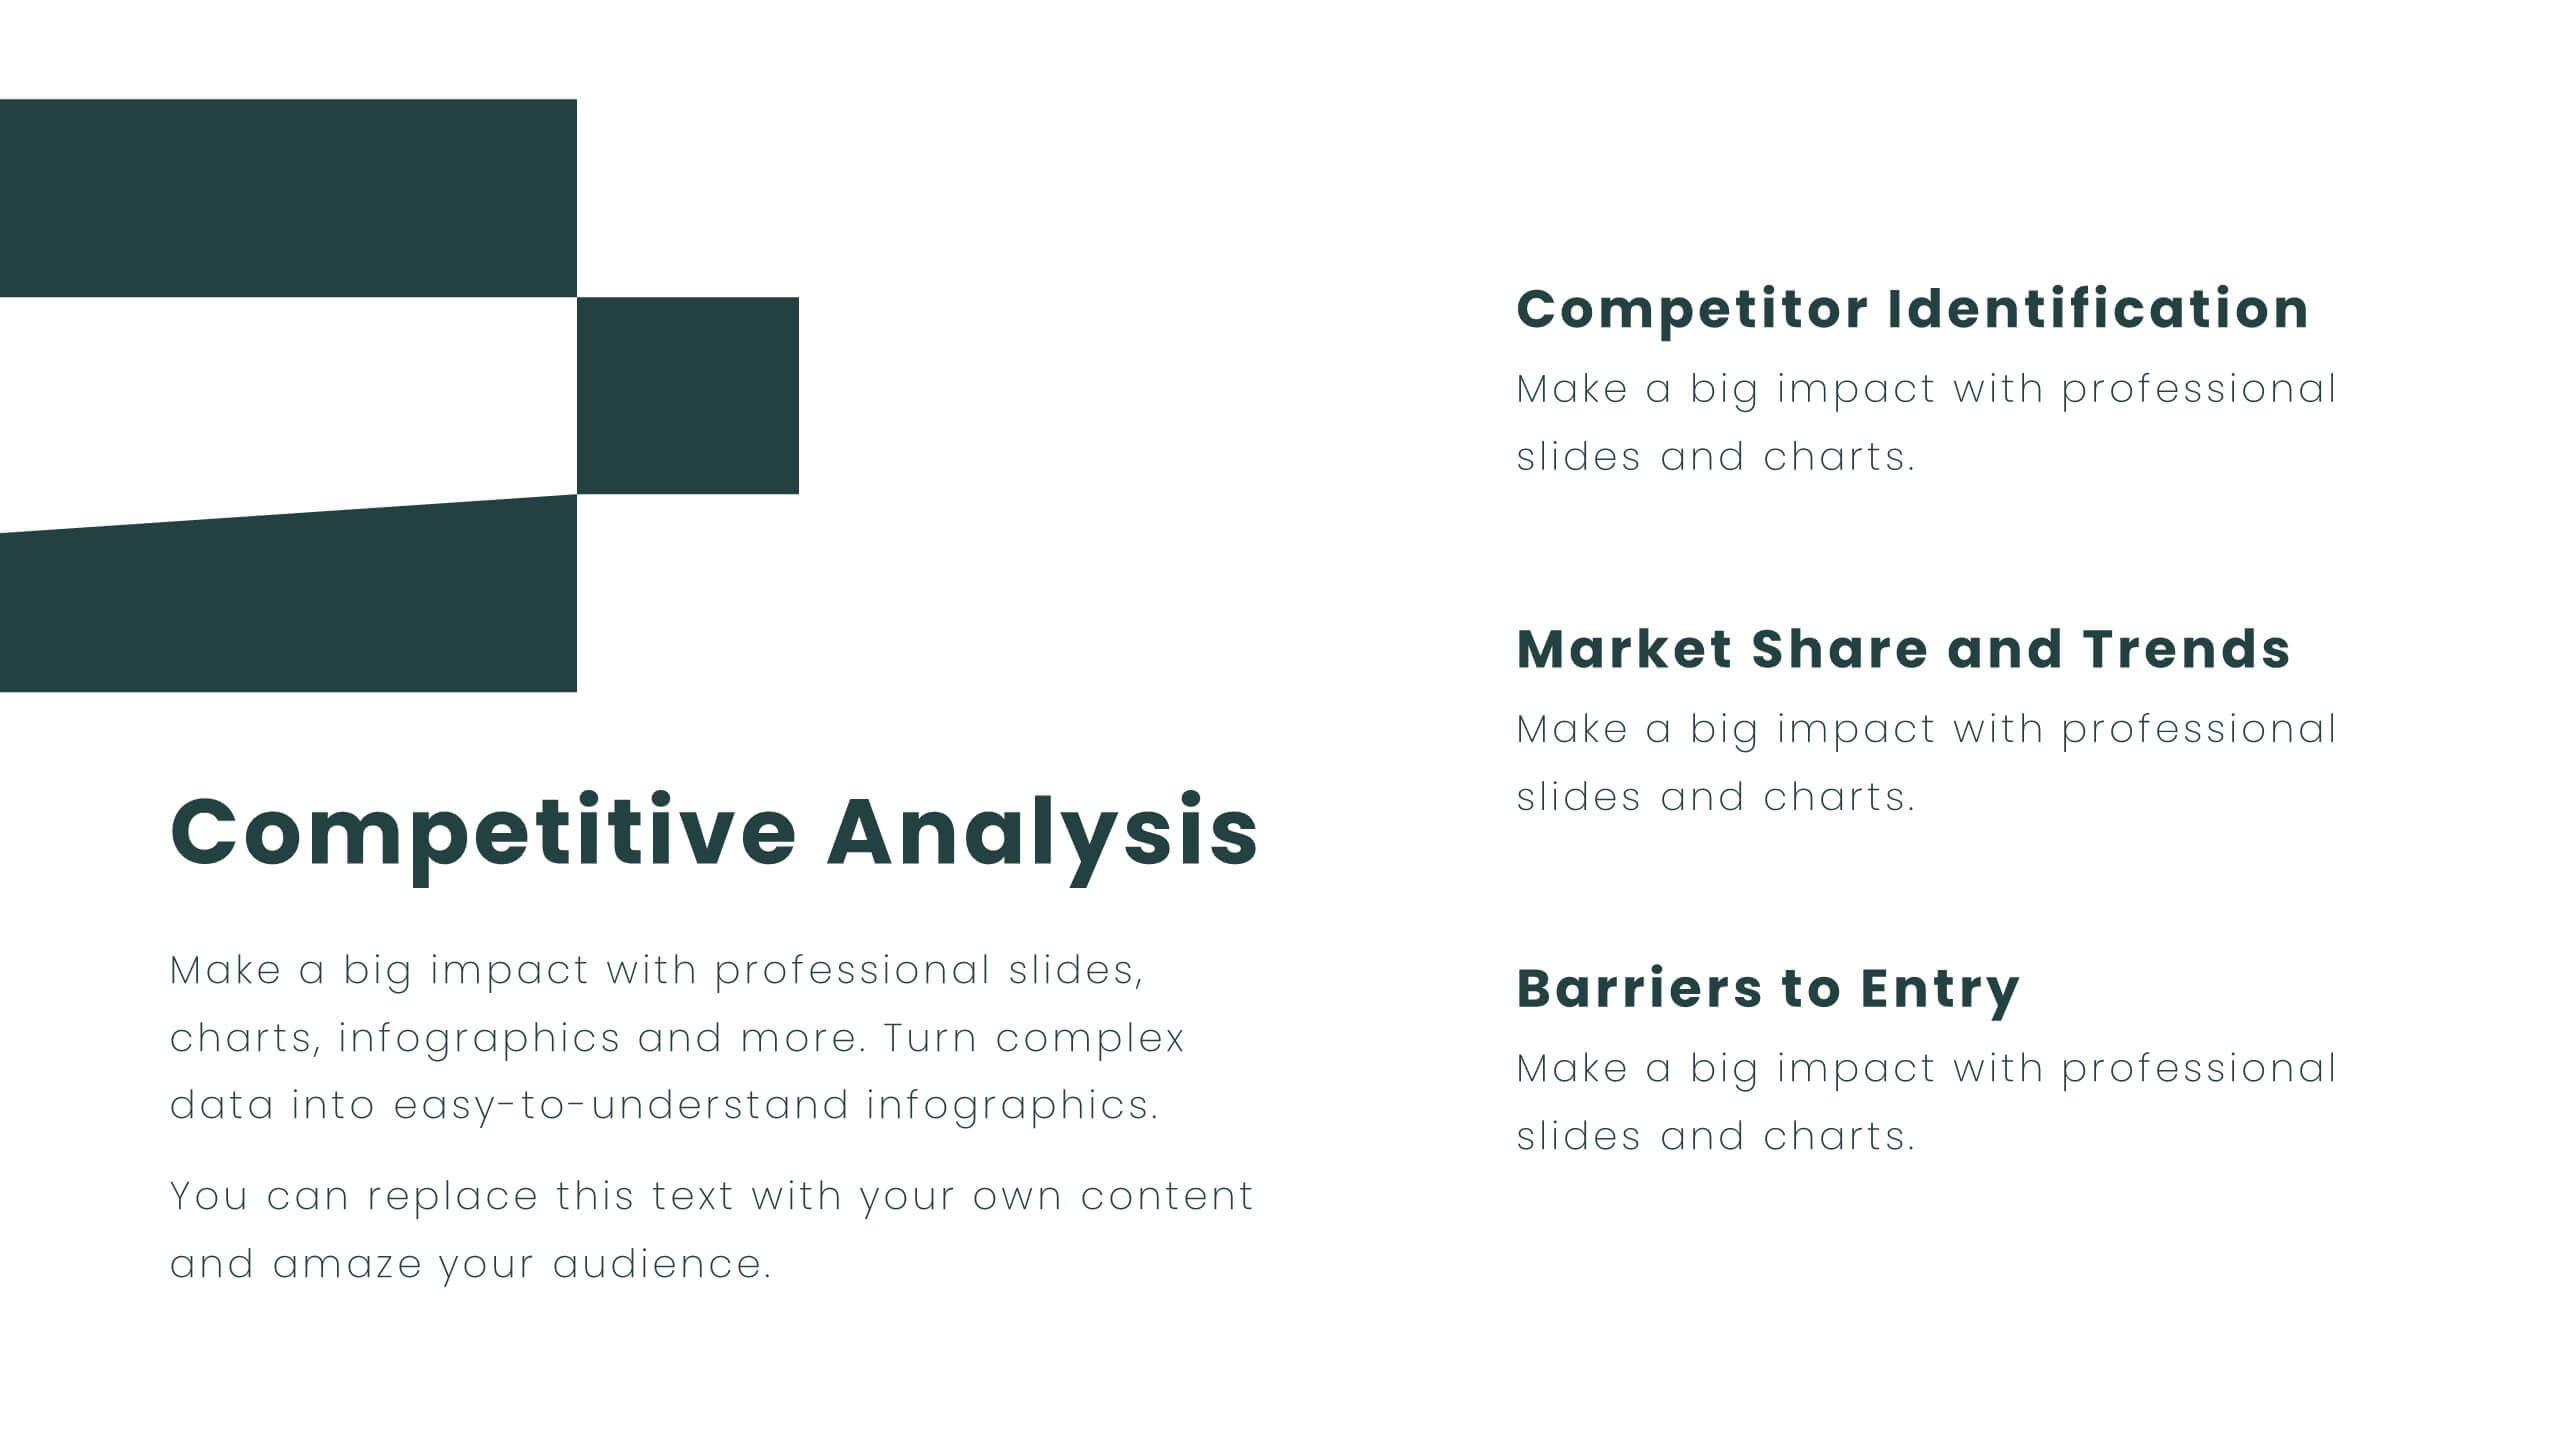
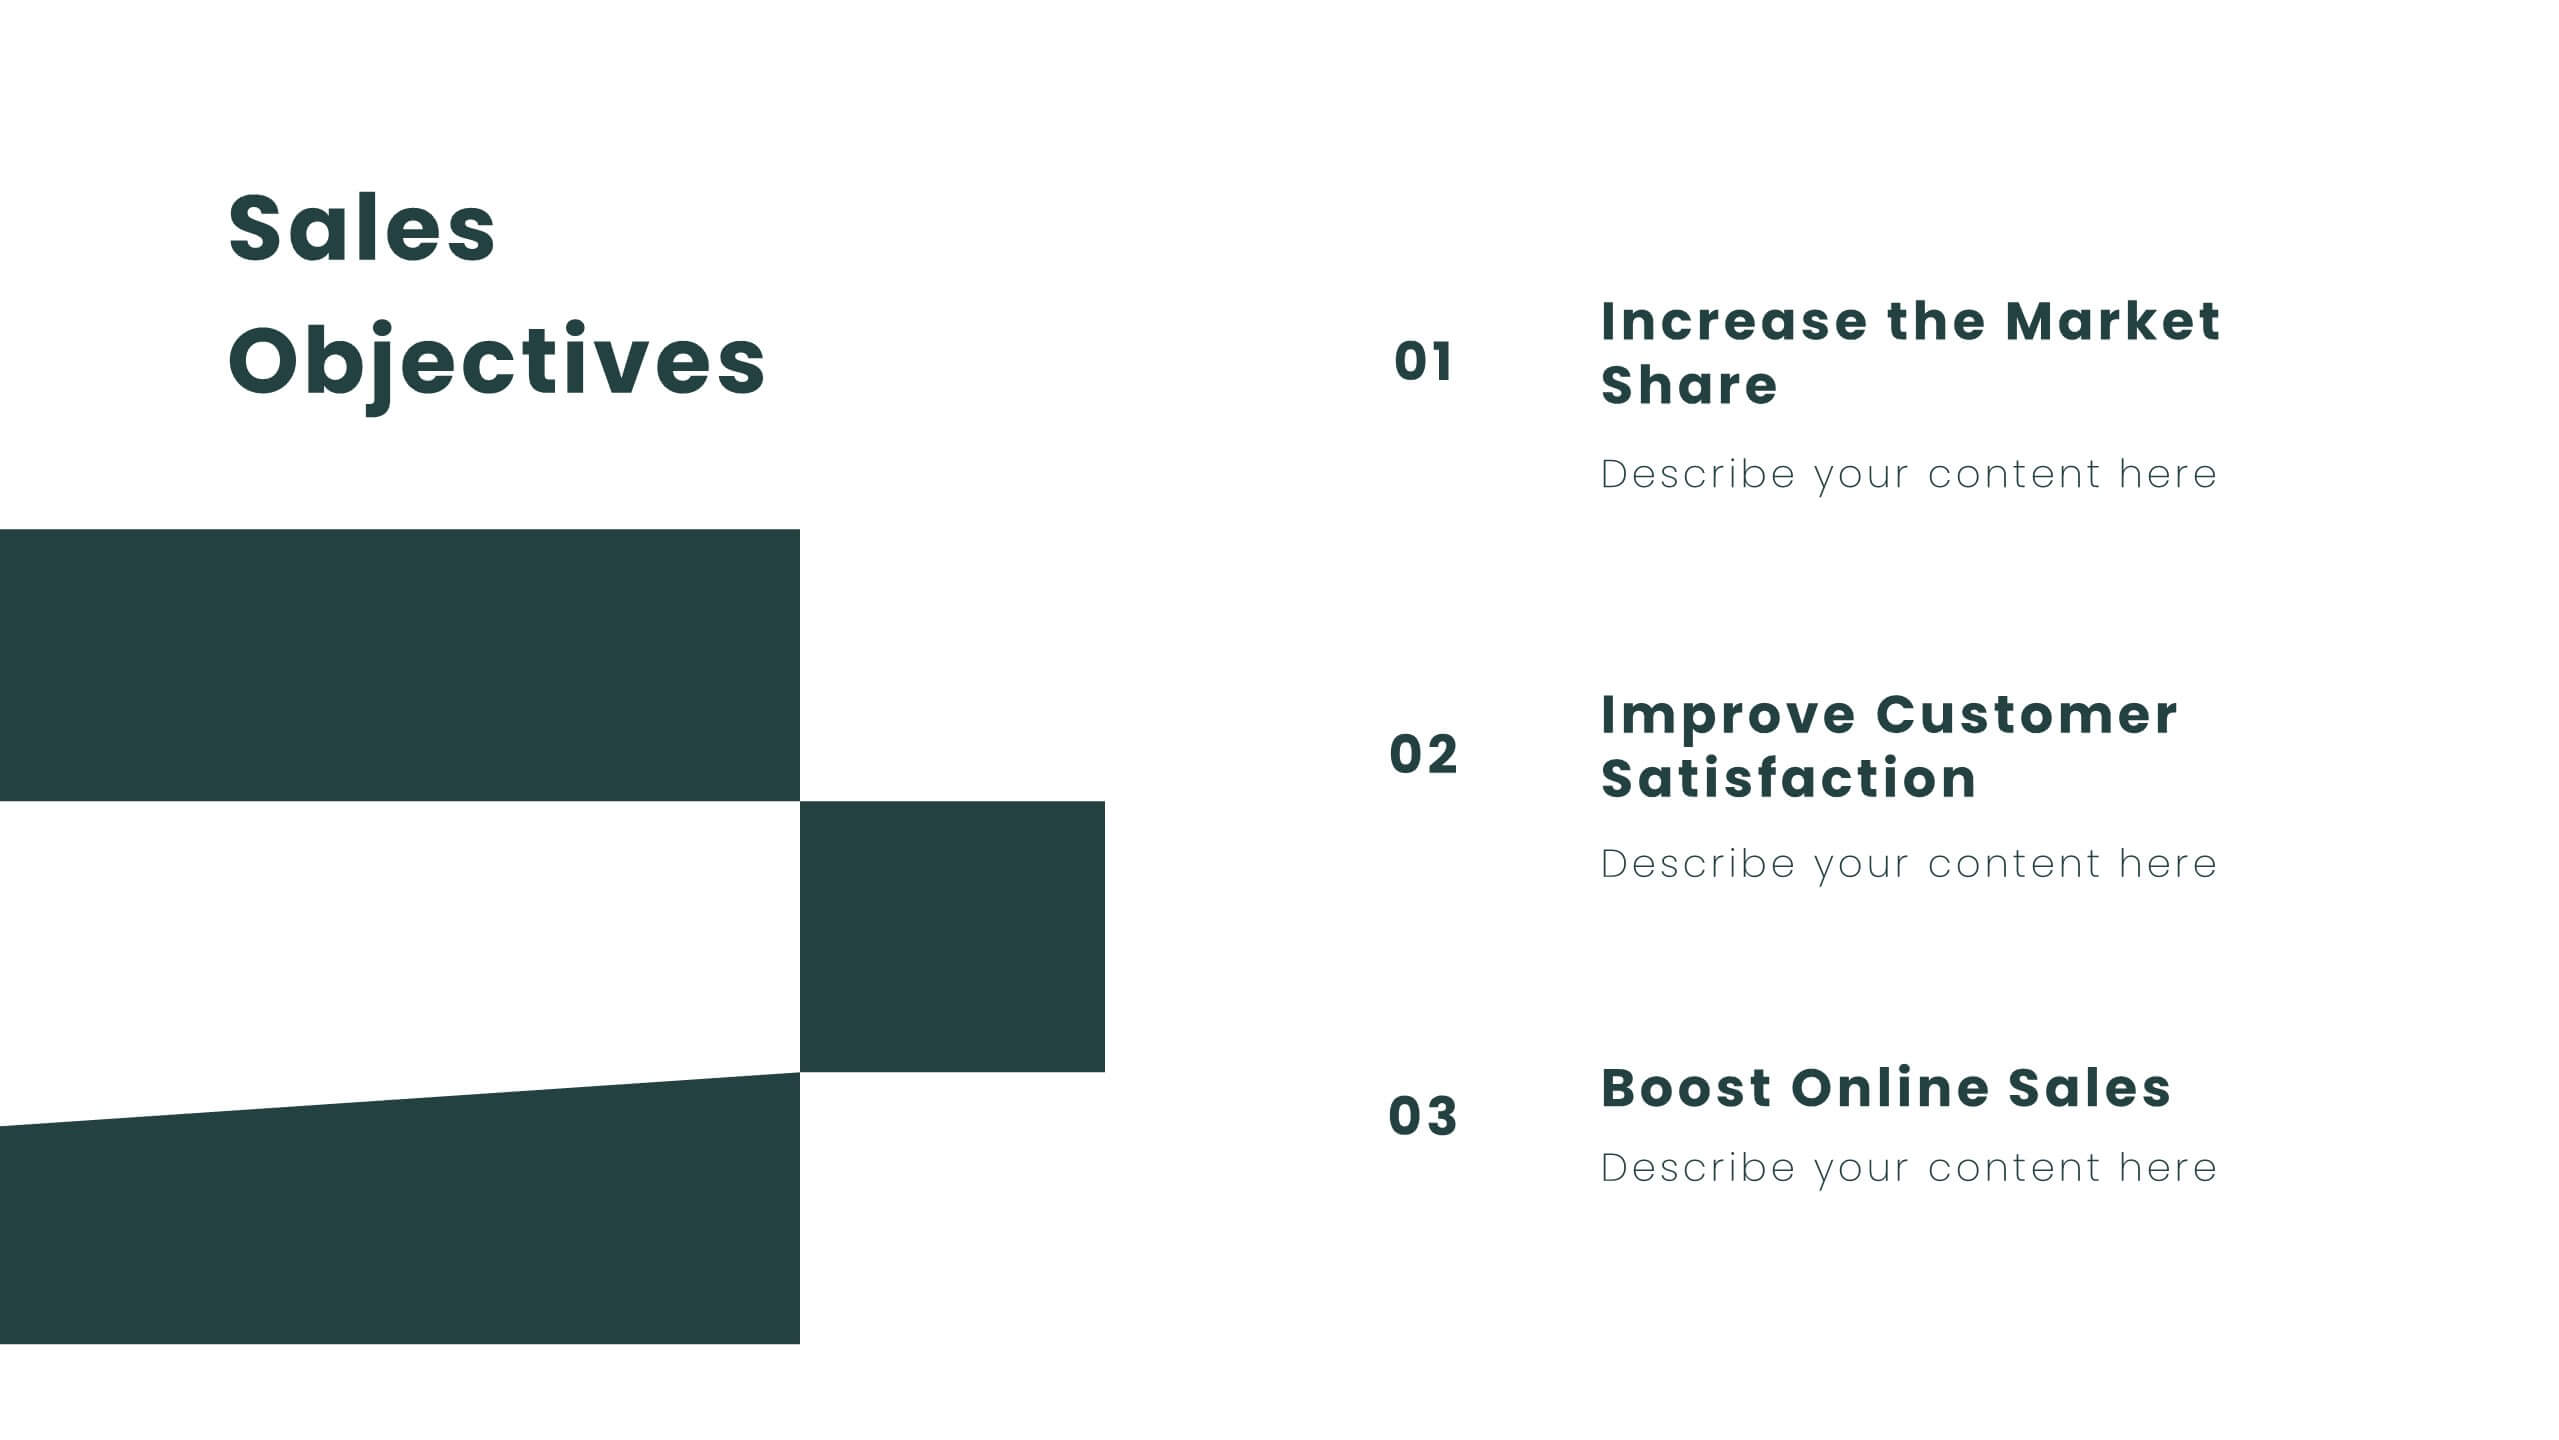
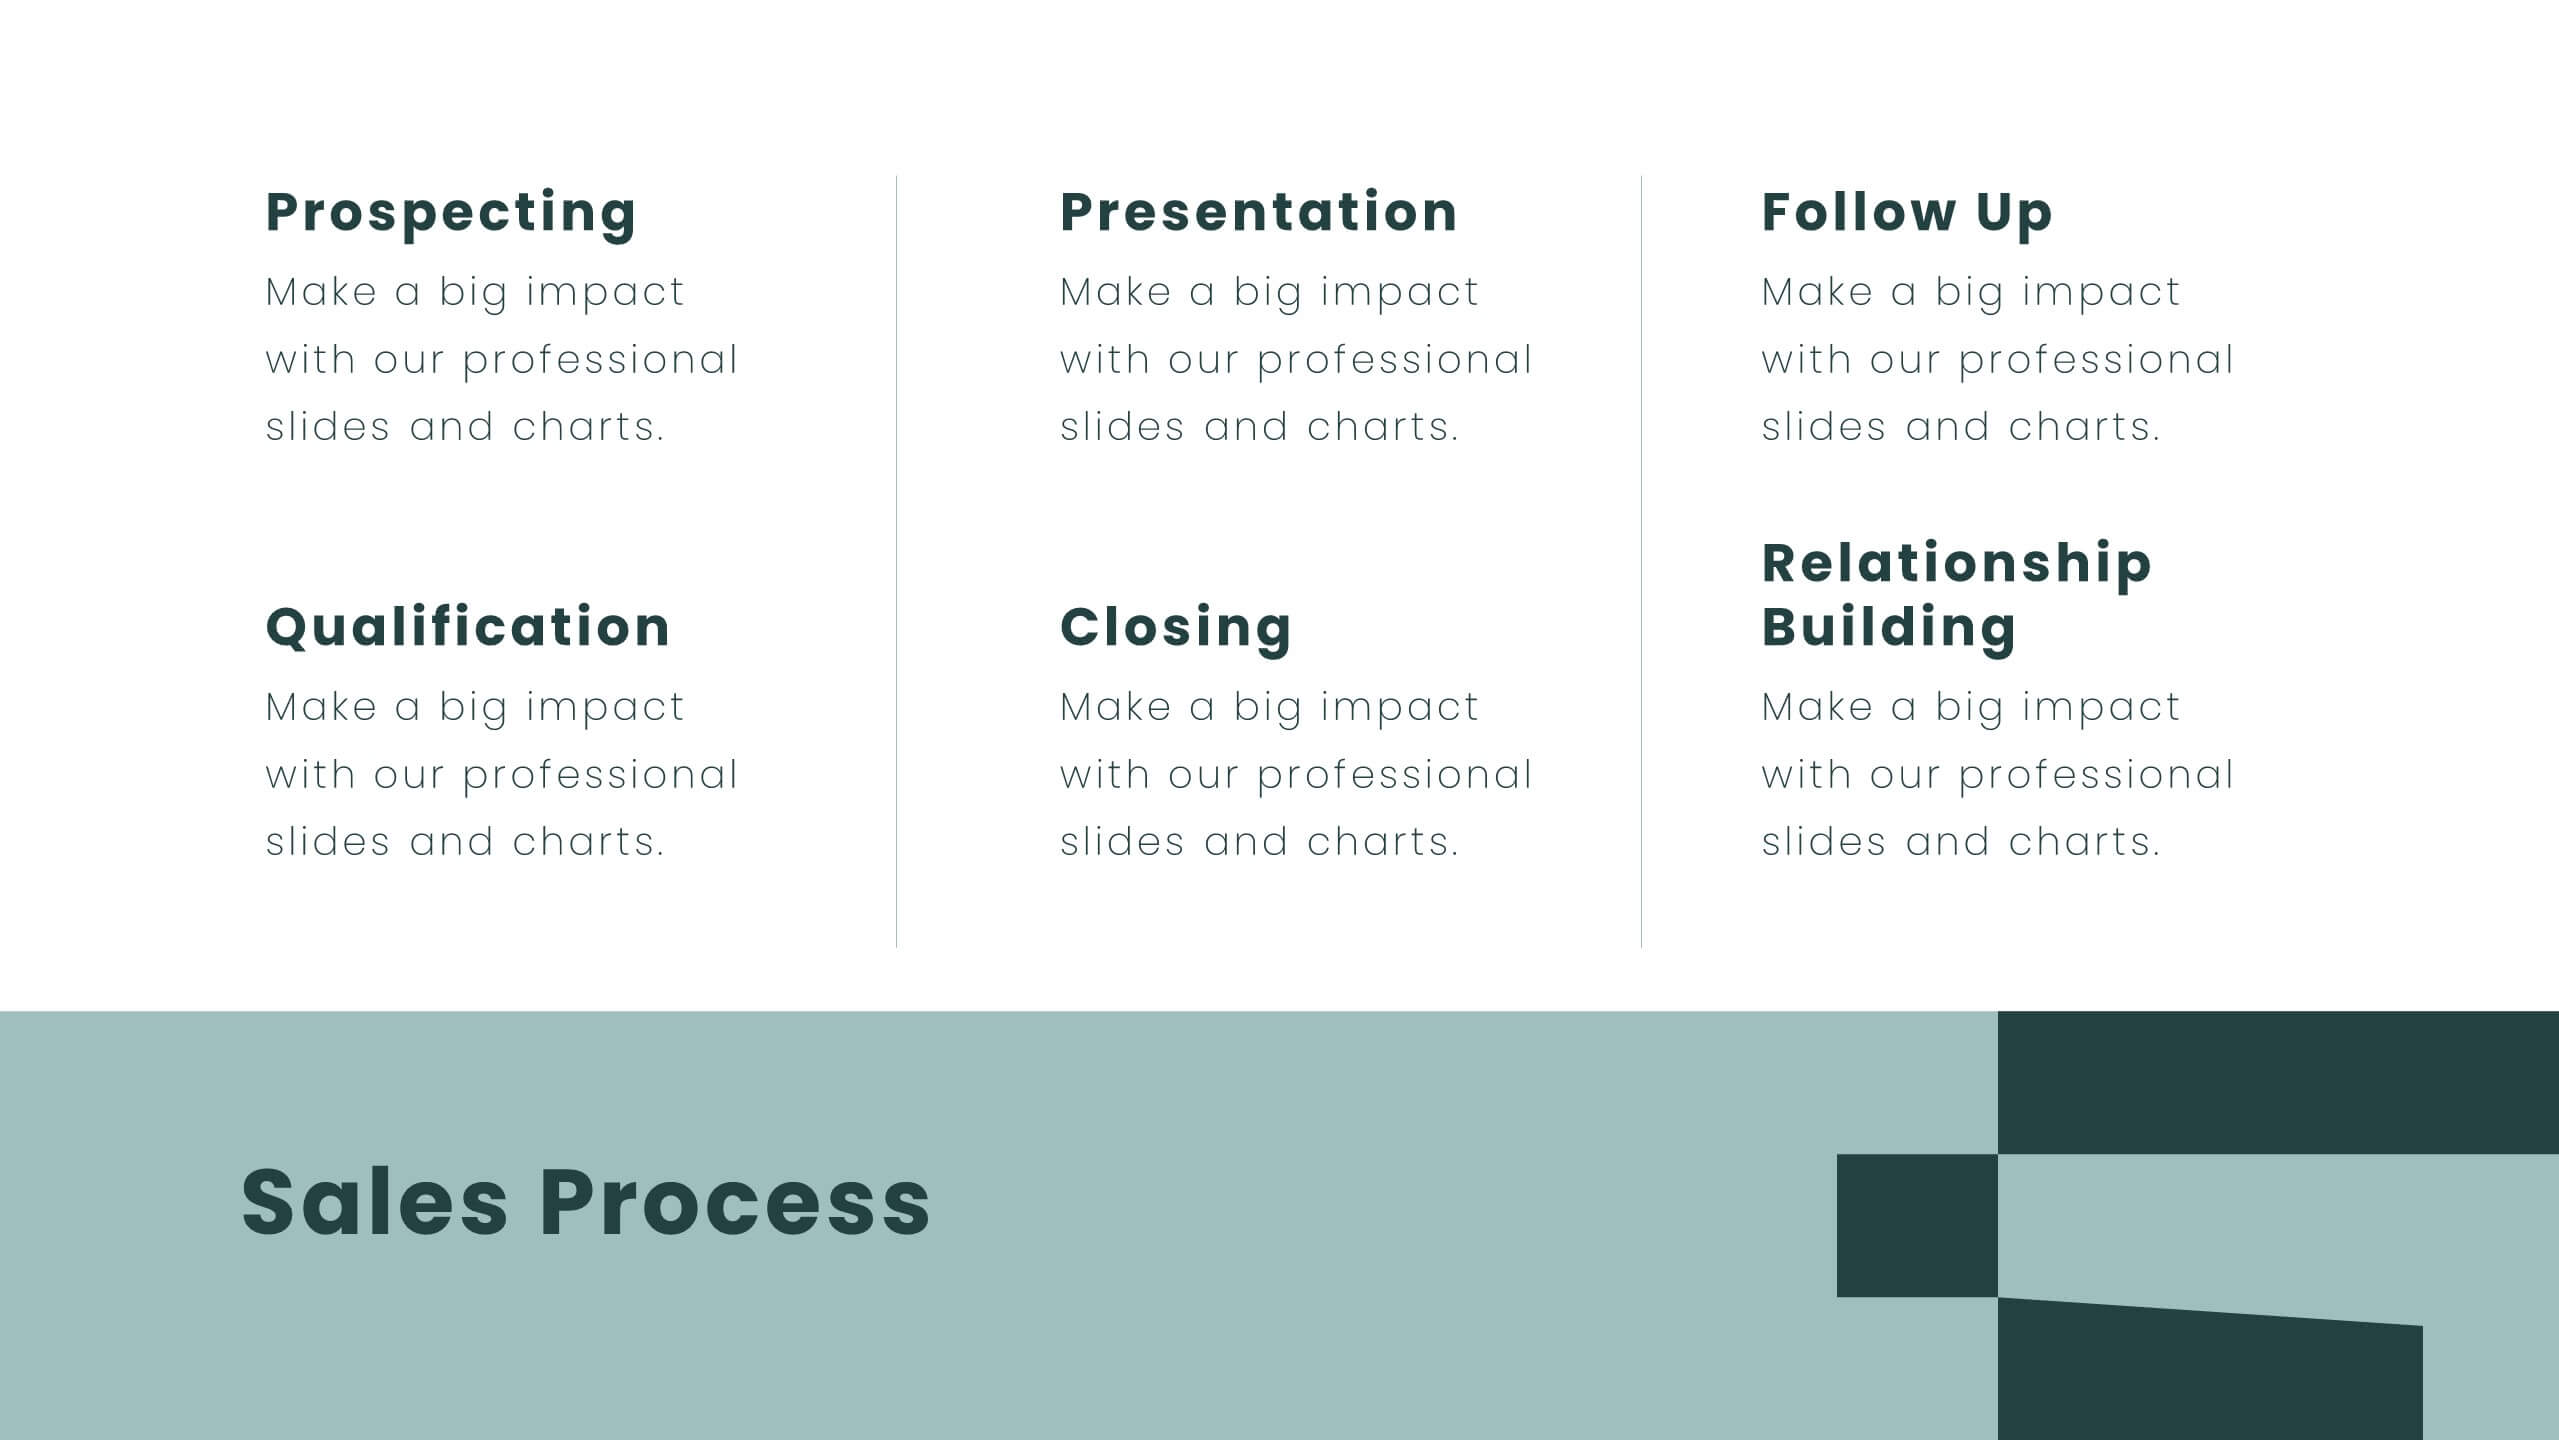
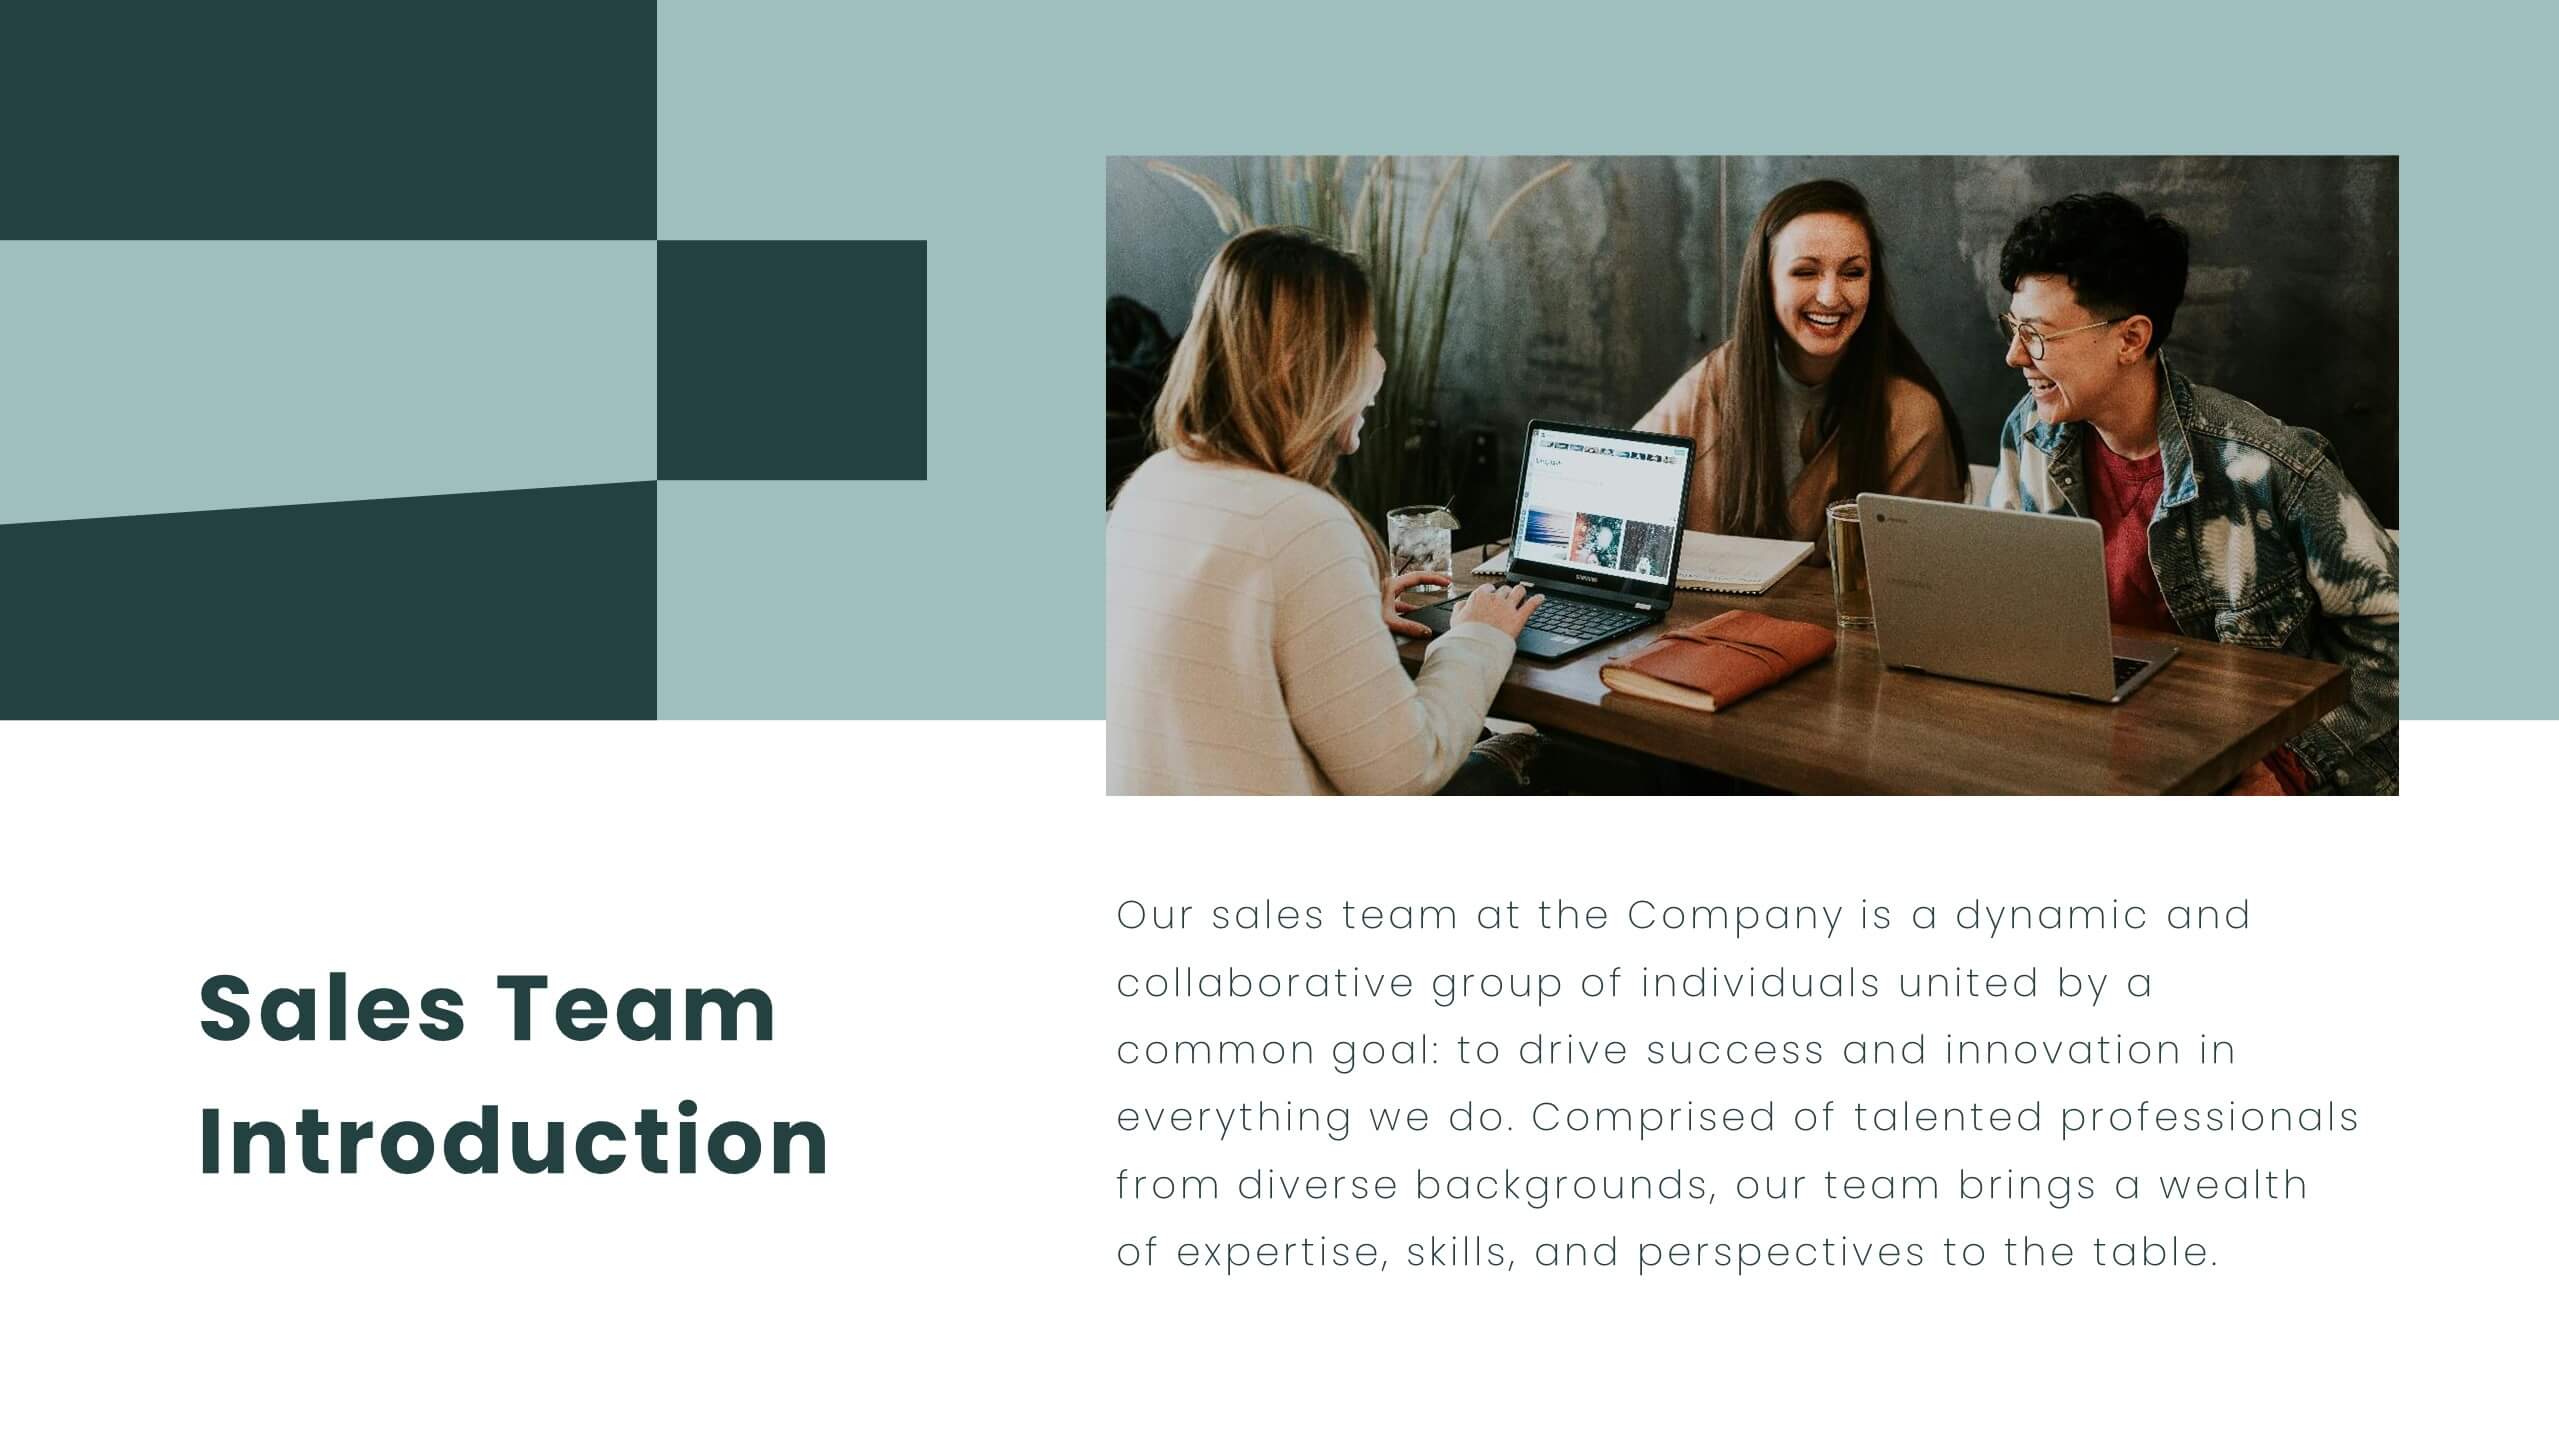
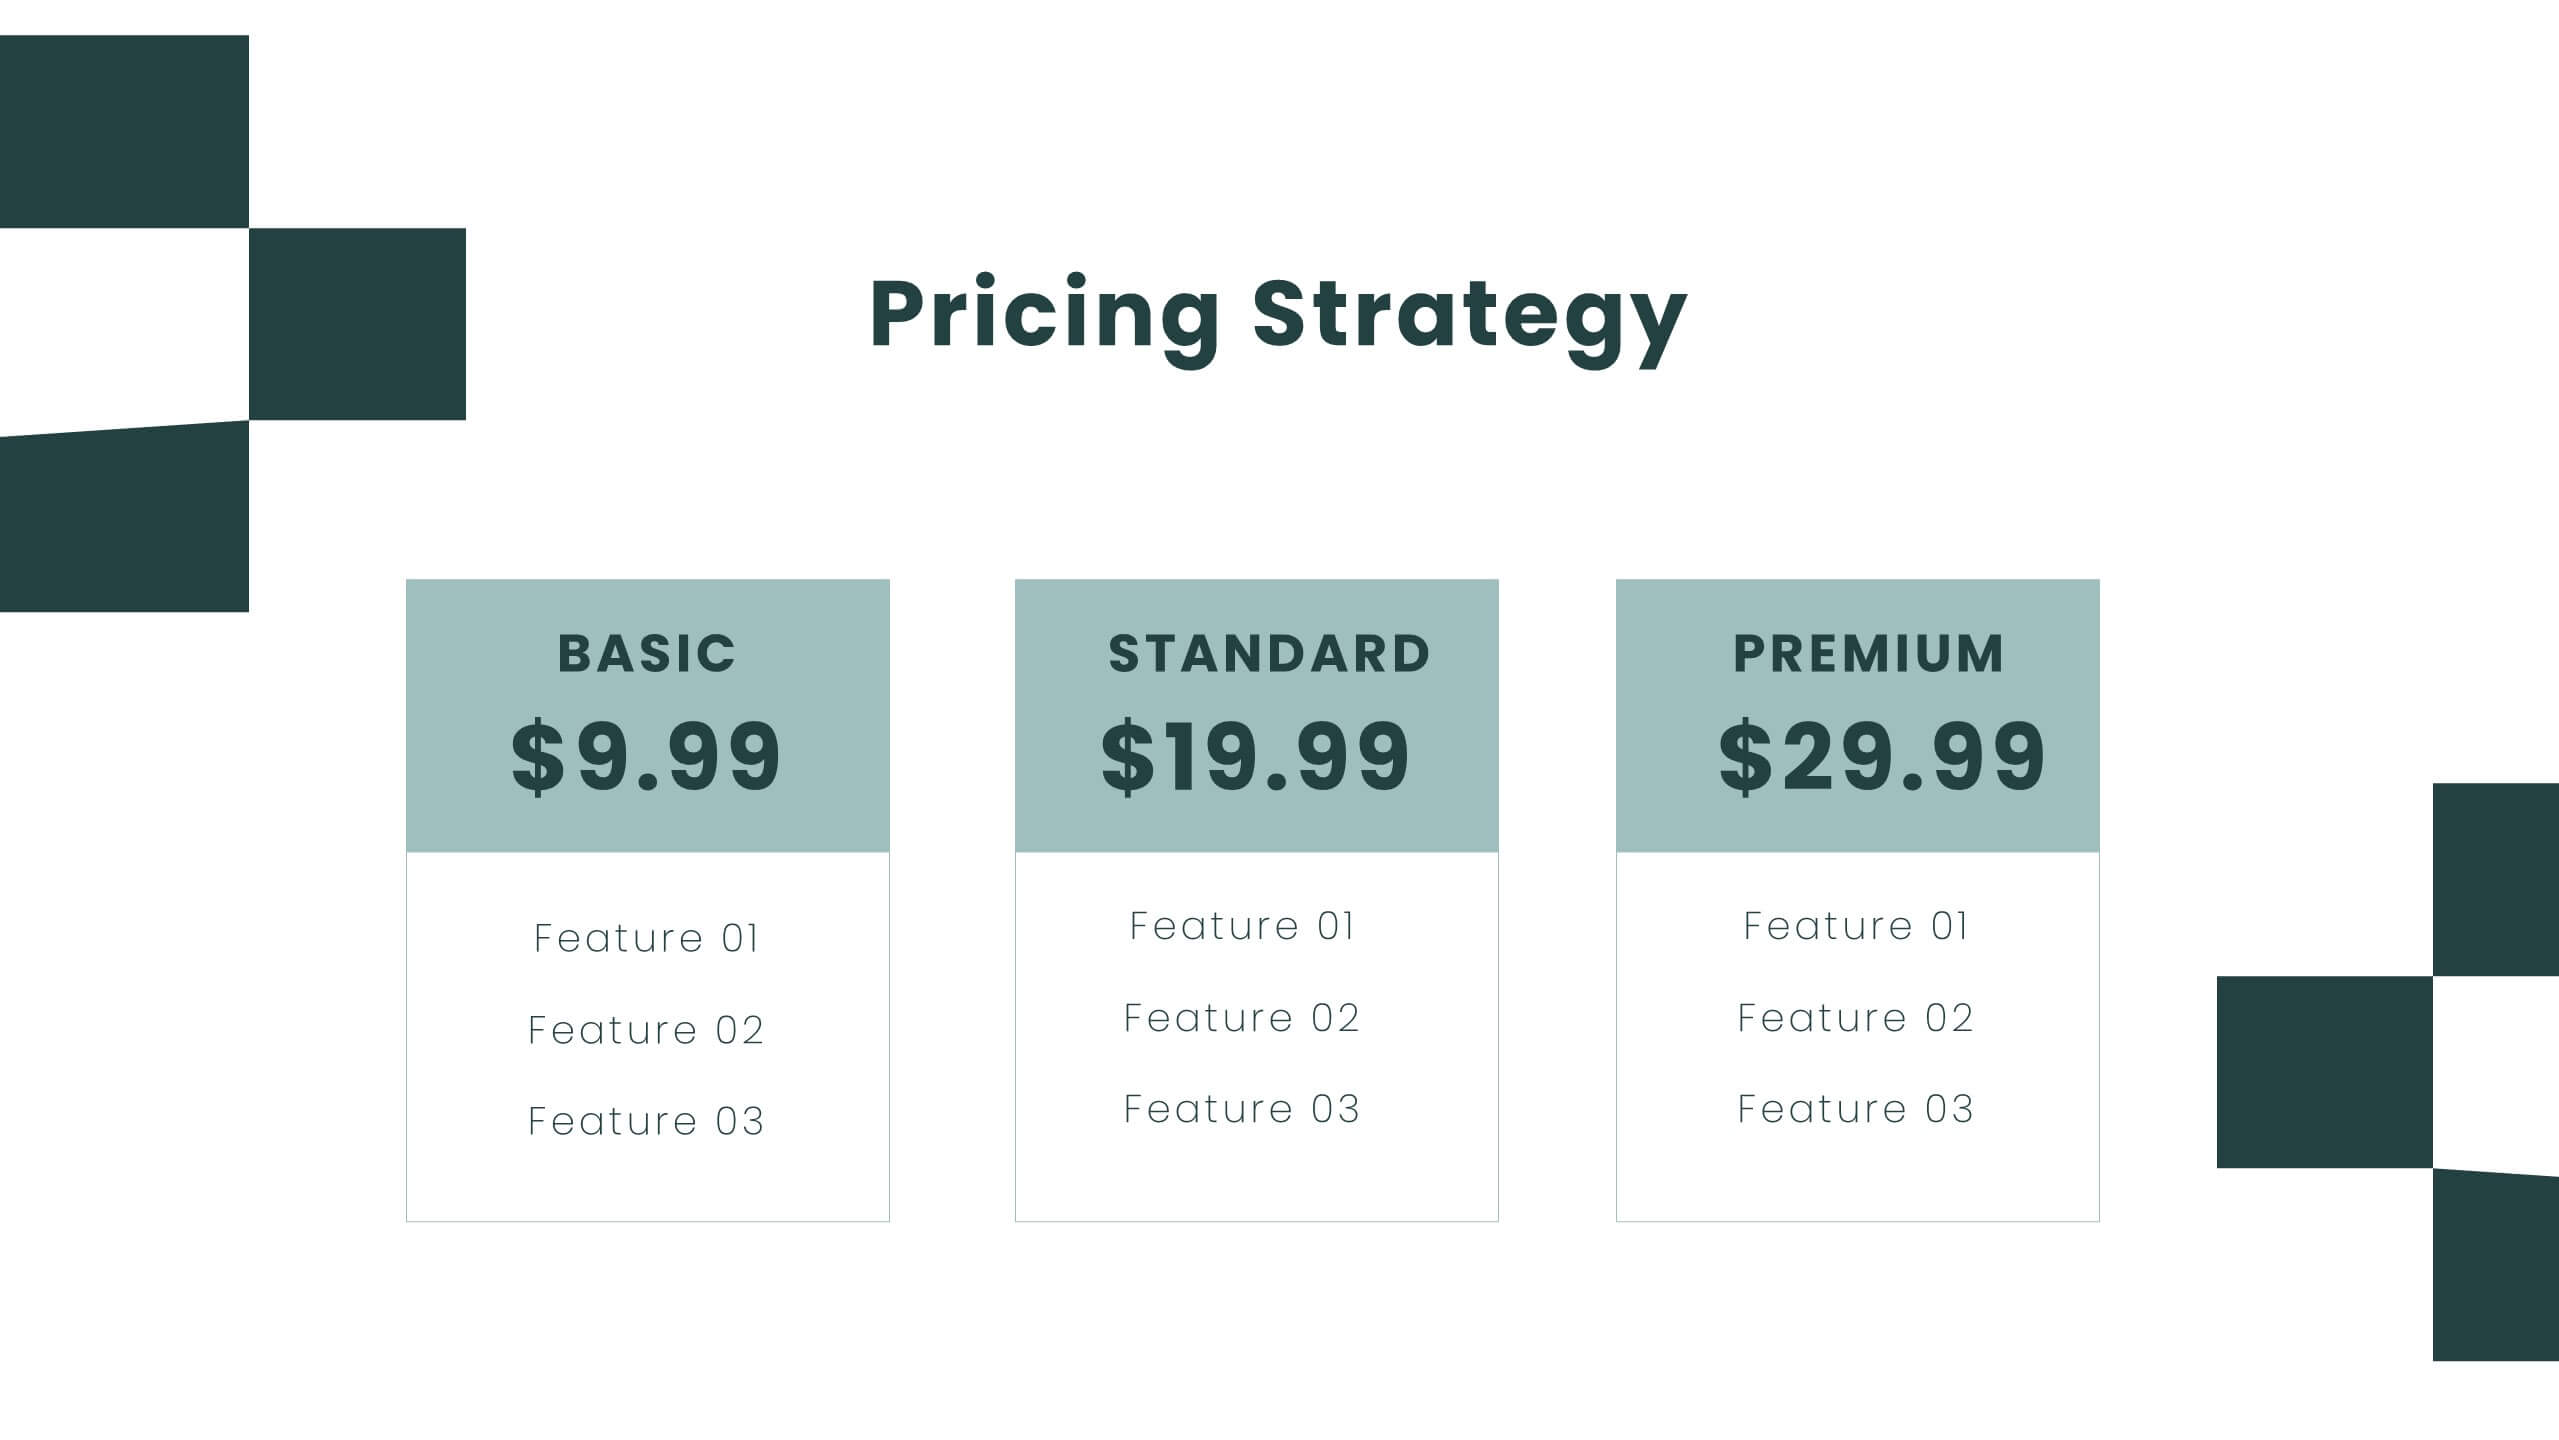
Radiant Sales Proposal Presentation
Elevate your pitch with this polished sales proposal template! Perfect for presenting company overviews, product/service details, and pricing strategies, it includes slides for competitive analysis and customer testimonials. Impress your audience with clear visuals and structured content. Compatible with PowerPoint, Keynote, and Google Slides for seamless presentations on any platform.


12 diapositivas
Market Analysis PESTEL Presentation
The "Market Analysis PESTEL" presentation efficiently segments essential factors that affect market trends into six categories: Political, Economic, Social, Technological, Environmental, and Legal. Each category is visually represented with a distinct color, allowing easy identification and organization of related data. The layout provides clear placeholders for inserting detailed information, making it a practical tool for presenting comprehensive market analyses. This visual framework supports strategic decision-making by highlighting external factors that might impact business environments.


4 diapositivas
Social and Professional Networking
Visualize global connections and collaborative ecosystems with this Social and Professional Networking presentation. Ideal for HR teams, marketers, or networking strategists, it showcases relationship-building and engagement across key hubs. Fully customizable in PowerPoint, Keynote, and Google Slides for maximum flexibility in any professional setting.