


Características


¿Tienes alguna pregunta?
Recomendar


6 diapositivas
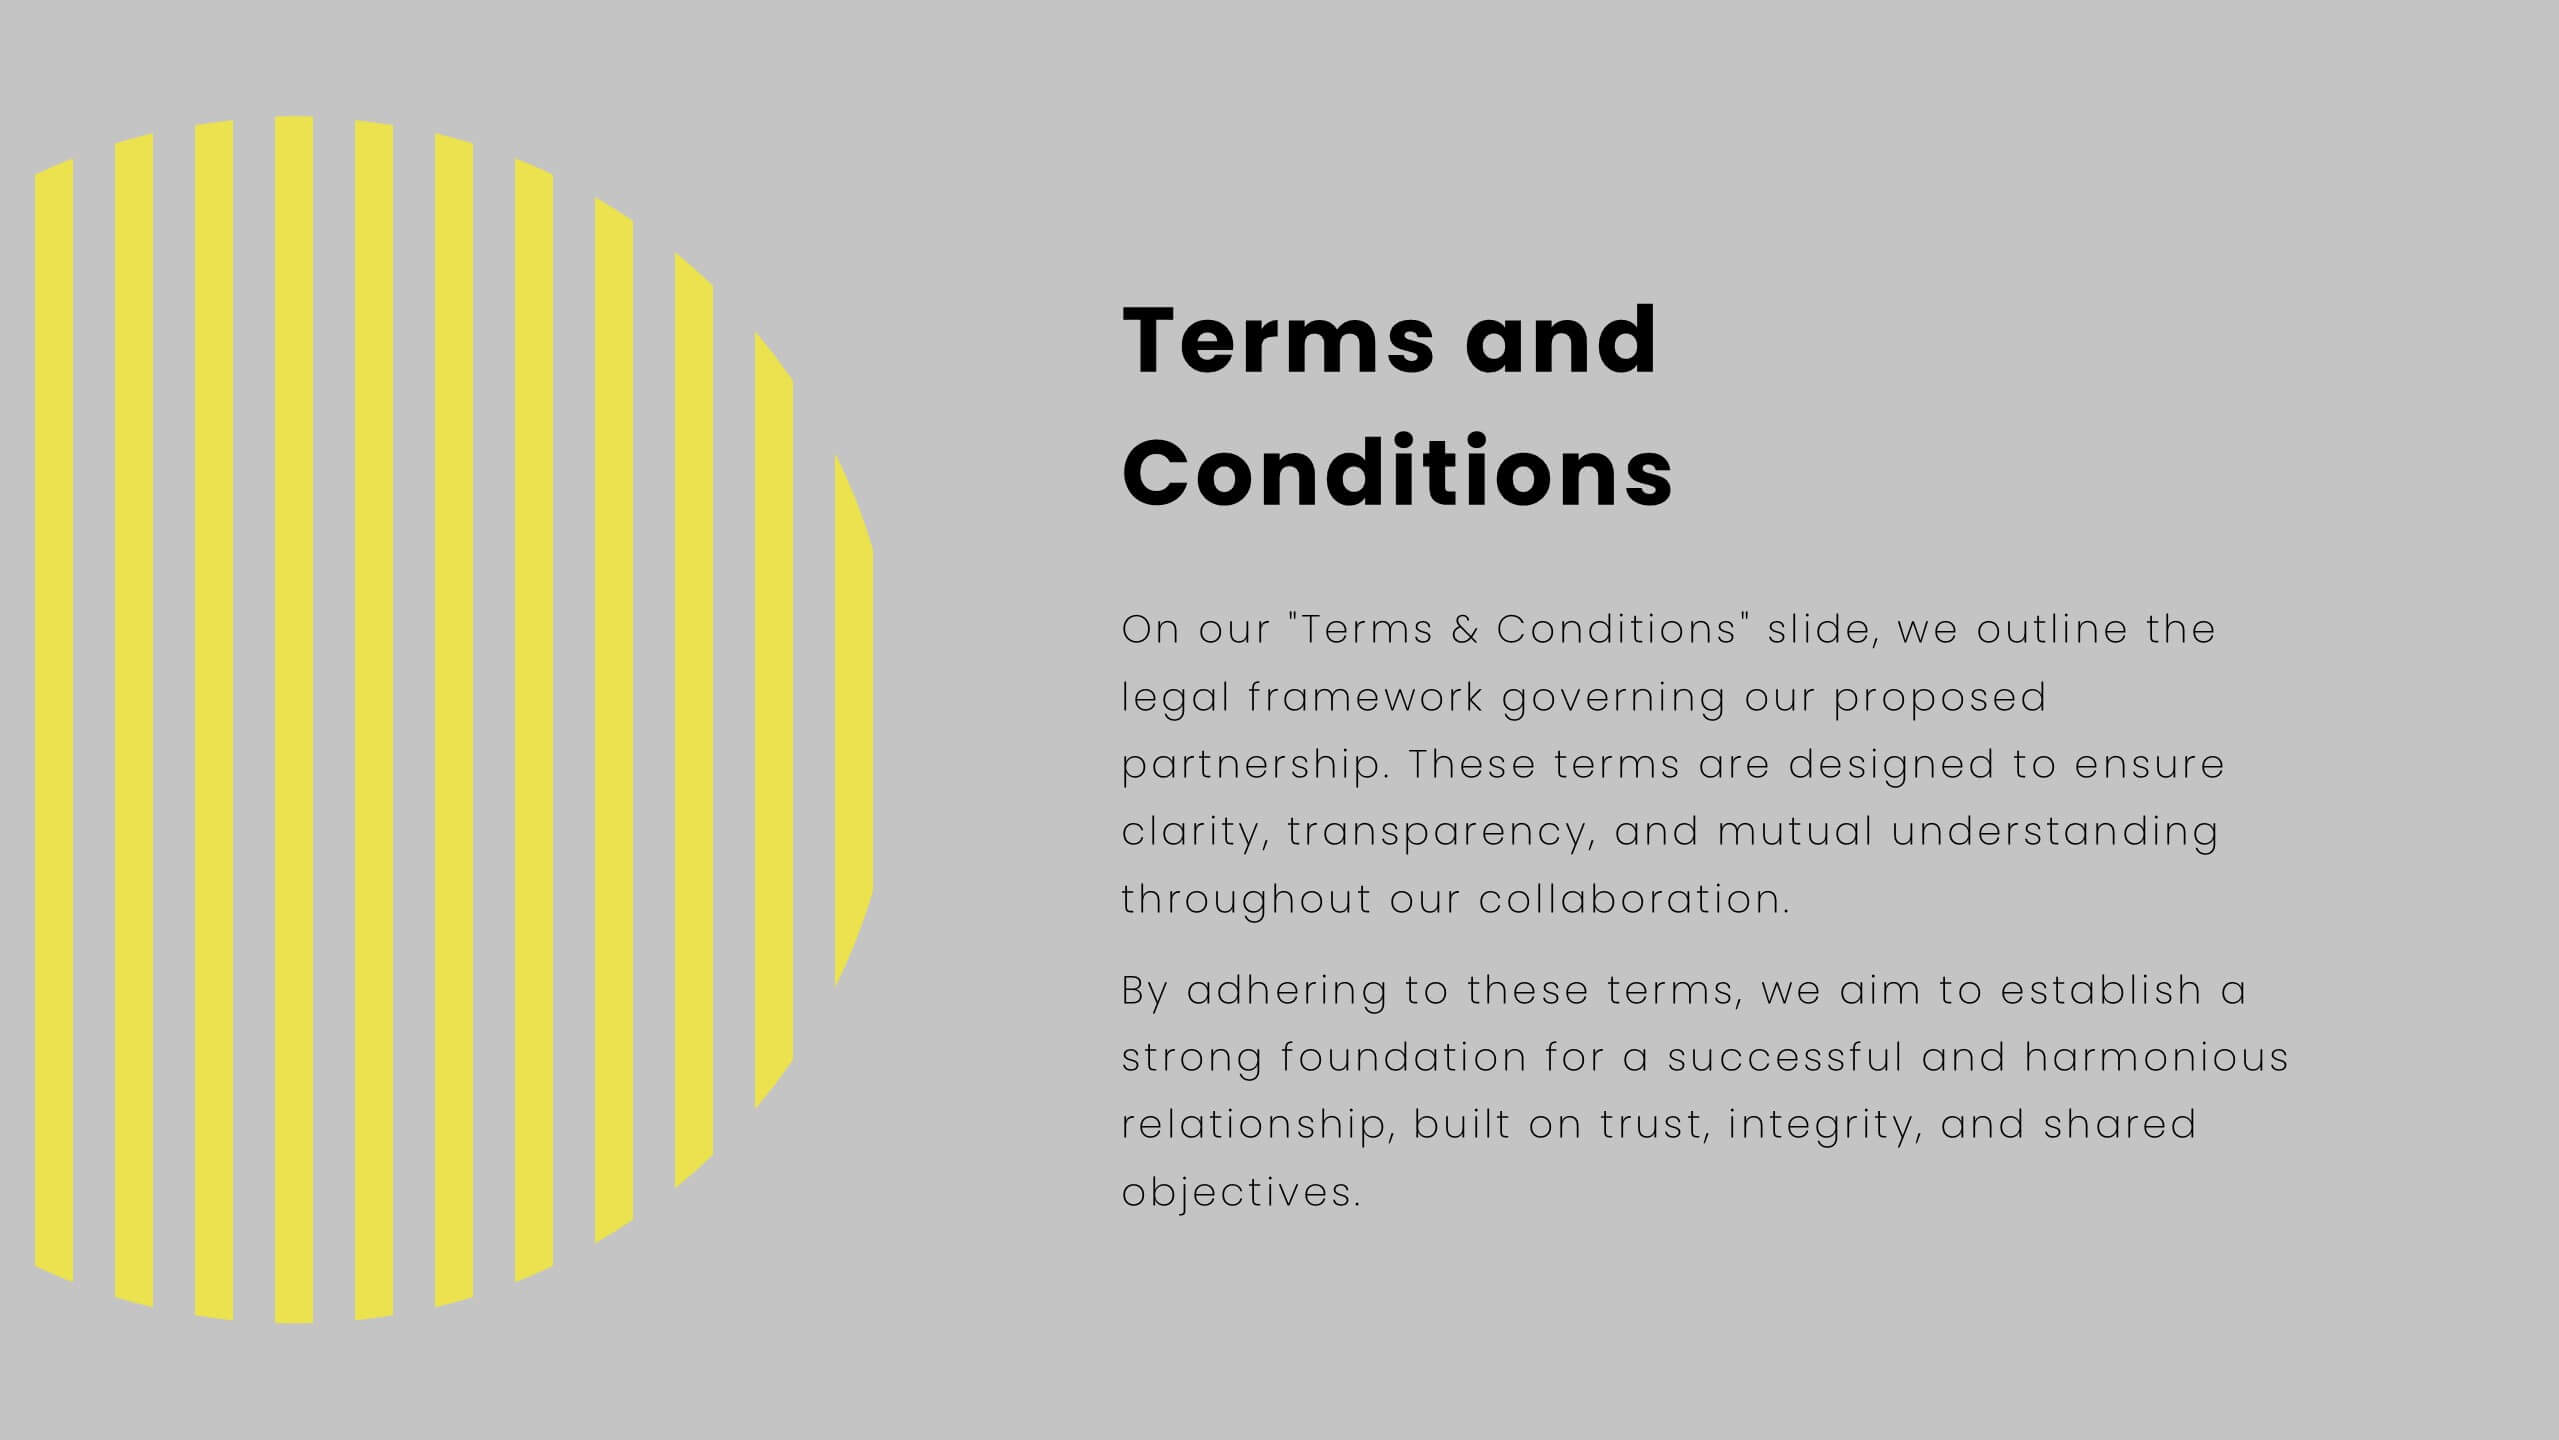
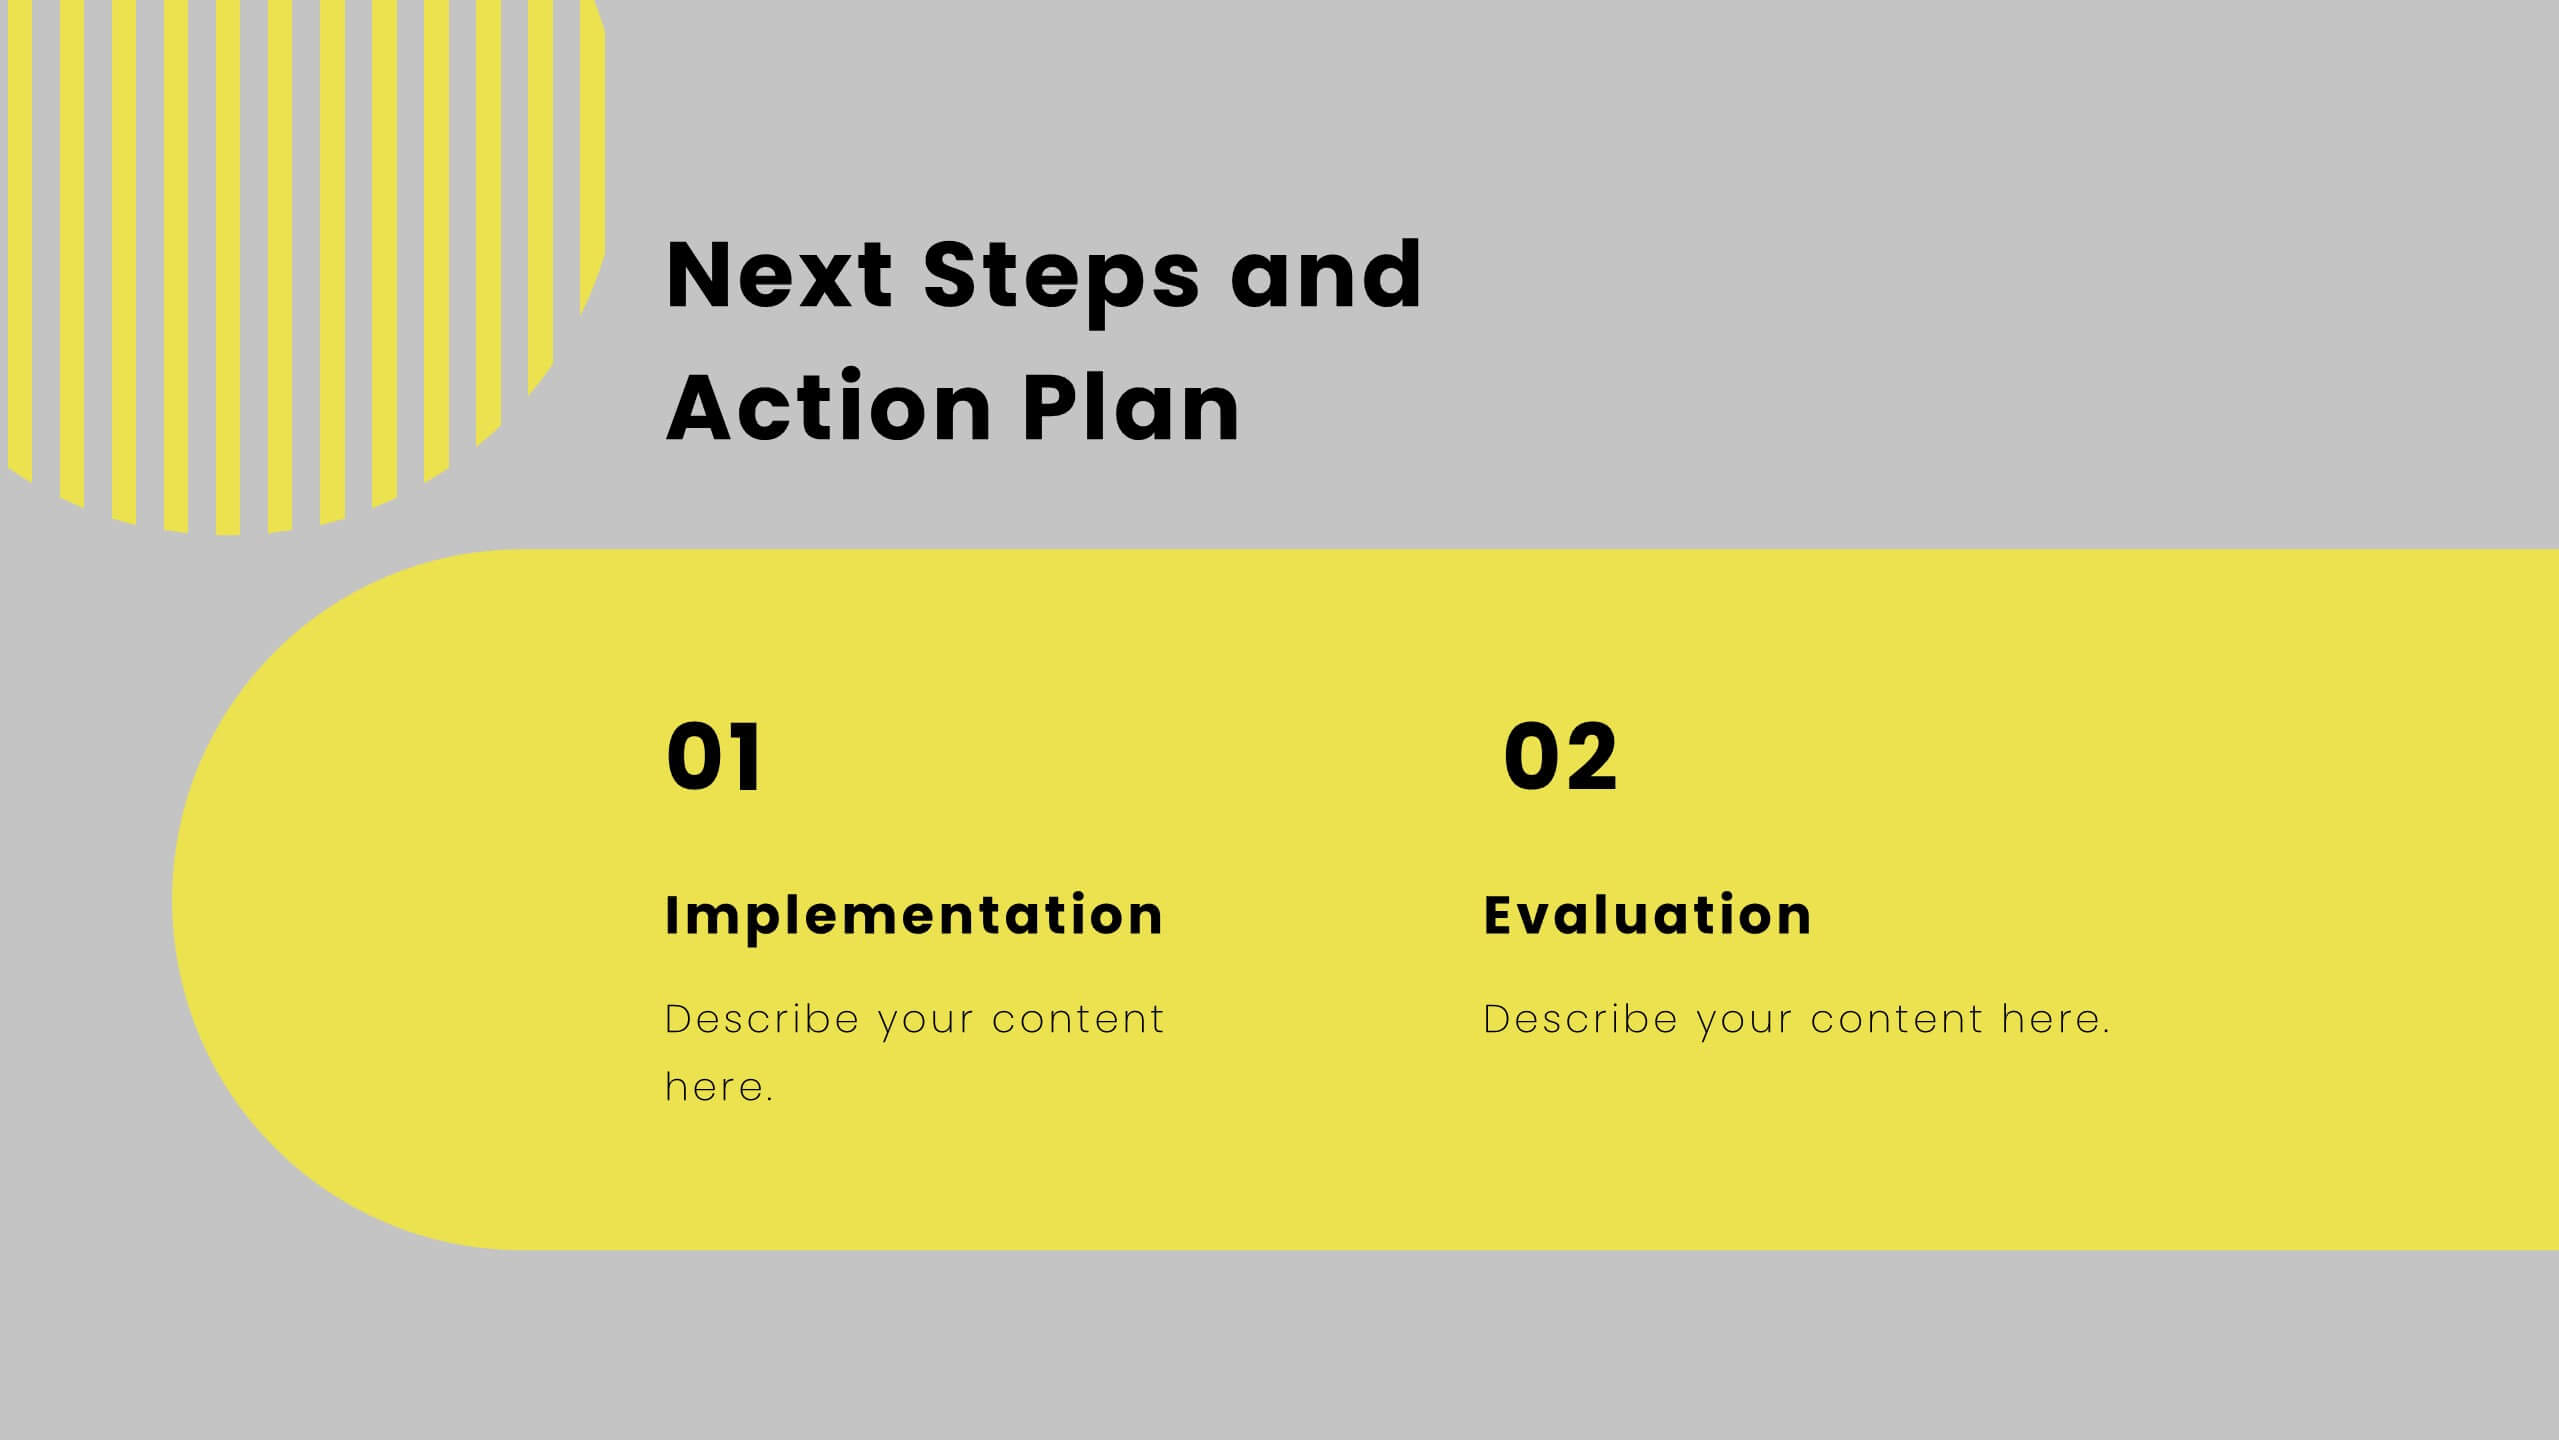
Project Governance Plan Presentation
Bring clarity and energy to your workflow with this engaging presentation that visually breaks down key steps, responsibilities, and milestones in a structured process. Its clean layout helps audiences quickly understand project priorities and decision paths. Perfect for strategy meetings and stakeholder updates. Fully compatible with PowerPoint, Keynote, and Google Slides.


6 diapositivas
Travel Itinerary and Budget Planning Presentation
Plan trips with precision using this visually organized circle-based infographic. With six labeled sections and travel-themed icons, this layout helps you outline schedules, expenses, and key milestones clearly. Perfect for tour operators, travel bloggers, or itinerary services, this slide ensures information is both engaging and easy to follow. Fully editable in PowerPoint, Keynote, and Google Slides.


23 diapositivas
Rainshadow Digital Strategy Presentation
This Digital Strategy Presentation Template is designed to provide a structured approach to planning and implementing digital initiatives. Covering essential elements such as market trends, competitive analysis, value proposition, and risk management, it offers a professional framework to align goals with actionable steps. Fully customizable and compatible with PowerPoint, Keynote, and Google Slides.


6 diapositivas
Business Model Hexagon Infographic Presentation
Break down complex strategies with the Business Model Hexagon Infographic Presentation. This sleek, six-part hexagonal layout is perfect for illustrating interconnected components like operations, value propositions, and customer segments. Fully editable and easy to customize in PowerPoint, Keynote, or Google Slides—ideal for startups, consultants, and corporate teams.


8 diapositivas
Financial Year in Review Annual Report
Showcase your company’s financial performance with clarity using this Financial Year in Review Annual Report slide. Featuring a dynamic line graph, currency visuals, and segmented insights, this slide is perfect for summarizing revenue trends and year-end highlights. Fully customizable in PowerPoint, Keynote, and Google Slides.


4 diapositivas
Daily Time Planning and Scheduling Presentation
Stay organized and maximize productivity with this Daily Time Planning and Scheduling template. Featuring a structured hourly schedule, task folders for tomorrow’s plans and to-do lists, and a dedicated notes section, this slide is designed for professionals, students, and busy individuals. Customize effortlessly to track daily tasks, set priorities, and manage time effectively. Fully compatible with PowerPoint, Keynote, and Google Slides for seamless integration.


7 diapositivas
Performance Infographics Presentation Template
This Performance Infographic template was created with the intention of highlighting business and organizational performance in a visually appealing manner. You can create a stunning and captivating infographic that conveys your message effectively. This template was designed for professionals in organizations needing to share essential information about their organizations, goals and progress. This template is a high quality infographic presentation design made in 7 slides. This template can be used in any kind of business, school, or service and is compatible with powerpoint.


7 diapositivas
Team Meeting Infographic Presentation
Are you looking for a fun and engaging way to present your next business meeting? Look no further than our new team meeting infographics template! With our template, you can add a touch of creativity to your presentation with a colorful illustration infographics. Whether you're student making a business presentation or a manager looking to engage your workers in your next meeting. With these simple easy to use infographics, you'll be able to create a top-quality presentation in no time with great engaging visuals. So why wait? Take your team meetings to the next level with our amazing template today!


4 diapositivas
Healthcare Trends and Innovations Presentation
Showcase cutting-edge medical insights using this umbrella-themed slide design tailored for healthcare trends and innovations. Ideal for highlighting advancements, protective strategies, or sector forecasts, this template offers a clean, symbolic layout. Fully editable in PowerPoint, Keynote, and Google Slides—perfect for medical professionals, health consultants, and industry analysts alike.


21 diapositivas
Astral Startup Business Plan Presentation
This sleek and professional Startup Business Plan template is designed to help you convey your startup’s potential to investors and stakeholders effectively. With a minimalist design and a structured flow, it covers all essential aspects of your business plan, from mission and vision to financial overview and growth plan. Each slide is crafted to present critical information in a clear and concise manner, making it easier for your audience to grasp the key points. This template is fully compatible with PowerPoint, Keynote, and Google Slides, allowing you to customize it to suit your branding and presentation style. Use this template to create a compelling and impactful presentation that will leave a lasting impression on your audience.


3 diapositivas
Cost-Benefit Analysis and Strategic Outcomes Presentation
Present trade-offs with clarity using the Cost-Benefit Analysis and Strategic Outcomes Presentation. Designed with visual balance scales and segmented callouts, this layout helps you compare investments versus returns, making complex decisions easier to explain. Ideal for proposals, audits, or business strategy reviews. Fully editable in PowerPoint, Keynote, and Google Slides.


20 diapositivas
Feronia Marketing Proposal Presentation
Present your marketing strategy with this visually engaging proposal deck, featuring sections on objectives, methodology, budget breakdown, and client testimonials. Ideal for structured presentations, it’s compatible with PowerPoint, Keynote, and Google Slides, offering a flexible format to captivate and convince clients or stakeholders.


4 diapositivas
Future-Focused Business Vision Planning Presentation
Plan ahead with clarity using the Future-Focused Business Vision Planning infographic. This 4-step layout helps you outline long-term goals, strategic milestones, and action points in a visually structured format. Perfect for business roadmaps, planning decks, and executive briefings. Fully editable in Canva, PowerPoint, and Google Slides.


6 diapositivas
Overcoming Market Challenges Strategy Presentation
Tackle industry obstacles with clarity using this dynamic teamwork-themed visual. Featuring illustrated characters passing puzzle pieces along a circular process, this design is perfect for illustrating phased strategies, collaborative efforts, or key milestones. Great for strategic planning or team alignment presentations. Fully editable in PowerPoint, Keynote, and Google Slides.


6 diapositivas
Business Task and To-Do List Slide
Organize tasks with clarity using this colorful checklist-style layout, perfect for showcasing priorities, timelines, or team responsibilities. With six editable sections and engaging icons, this layout brings structure and visual appeal to business updates or project meetings. Fully customizable in PowerPoint, Keynote, and Google Slides.


7 diapositivas
Progress Energy Infographic
Progress generally refers to forward movement or advancement towards a goal, or improvement. This is a dynamic infographic designed to visually represent your journey towards success and growth. This template serves as a visual roadmap, allowing you to showcase milestones, achievements, and key steps toward your objectives in a clear and captivating manner. Compatible with Powerpoint, Keynote, and Google Slides. This easily illustrates the impact of your progress. This infographic is designed to showcase your achievements, marking key milestones that demonstrate your progress and the impact they've had on your journey.


4 diapositivas
Impact of 5G on Business and Innovation Presentation
Illustrate how next-gen connectivity is transforming industries with this sleek 5G innovation infographic. Featuring a 3D smartphone and signal waves, this slide presents four gradient-colored segments ideal for showcasing business use cases, digital transformation, and market impact. Ideal for tech startups, consultants, and enterprise innovation teams. Easily editable in PowerPoint, Keynote, and Google Slides.