


Características


¿Tienes alguna pregunta?
Recomendar


4 diapositivas
Meetings Agenda Slide Presentation
Make every meeting feel purposeful with a clean layout that highlights topics, timing, and key discussion points effortlessly. This presentation helps teams stay aligned, organized, and ready to follow the flow of the session. Perfect for planning or reporting. Fully compatible with PowerPoint, Keynote, and Google Slides.


5 diapositivas
Poaching Facts Infographics
Poaching refers to the illegal hunting, capturing, or killing of wildlife, typically for profit or personal gain. These compelling and informative infographic templates are designed to shed light on the issue of poaching and its impact on wildlife and ecosystems. They present key facts, statistics, and illustrations to raise awareness about the seriousness of poaching and the need for conservation efforts. By increasing awareness and understanding of the poaching crisis, these templates contribute to the collective efforts in protecting our precious wildlife and preserving the natural world.


3 diapositivas
Key Stats and Market Figures Slide Presentation
Communicate comparisons clearly with the Key Stats and Market Figures Slide presentation. This template uses a balanced scale graphic to visually contrast two data sets—ideal for weighing pros and cons, competitor benchmarks, or before-and-after scenarios. Fully customizable in PowerPoint, Keynote, and Google Slides.


5 diapositivas
Global Warming Crisis Infographics
Global Warming refers to the long-term increase in the Earth's average surface temperature, primarily caused by the buildup of greenhouse gases in the atmosphere. This vertical infographics includes information about the effects of climate change on the planet. There are designed sections where you can feature data on rising temperatures, sea levels, and extreme weather events. These infographics feature unique designs that incorporate colors and images that convey the severity and urgency of this crisis. The goal of this template is to raise awareness about the need to address the global warming crisis and mitigate the impact of climate change.


20 diapositivas
Oracle Startup Strategy Presentation
Launch your startup strategy with this sleek template! Perfect for detailing your mission, vision, business model, and market analysis. Ideal for entrepreneurs aiming to impress investors and stakeholders. Compatible with PowerPoint, Keynote, and Google Slides, this template ensures your startup strategy is professional, clear, and compelling. Secure your path to success!


21 diapositivas
Everwyrm Startup Strategy Presentation
The Startup Strategy Presentation Template is crafted to highlight your business vision, growth plans, and financial insights. With 21 fully editable slides, it covers areas like business model, market analysis, and milestones. Perfect for entrepreneurs and investors, compatible with PowerPoint, Keynote, and Google Slides.


4 diapositivas
Business Challenge Overview Presentation
Kick off your message with a dynamic overview that makes complex challenges feel clear, visual, and manageable. This presentation helps you break down obstacles, compare factors, and guide teams toward smarter decisions with an organized, flowing layout. Fully compatible with PowerPoint, Keynote, and Google Slides.


8 diapositivas
Business Challenge & Solution Presentation
Address complex issues with clarity using this business challenges and solutions presentation. Featuring a chess knight visual, it helps outline problems and corresponding strategies. Ideal for strategic planning, risk management, and executive briefings. Fully customizable in PowerPoint, Keynote, and Google Slides to fit your corporate or consulting presentation needs.


2 diapositivas
Creative Gratitude Slide
Wrap up your presentation with impact using this clean, modern “Thank You” slide. Featuring space for a photo, contact details, and playful design elements, it's perfect for leaving a lasting impression. Ideal for business proposals, pitch decks, and educational slide decks. Fully editable in PowerPoint, Keynote, and Google Slides.


6 diapositivas
Market Share Analysis Pie Chart
Clearly communicate competitive positioning with this market share pie chart layout. Ideal for showcasing data segments such as revenue splits, customer base percentages, or geographic market distribution. Each pie chart highlights a distinct insight, with editable text and values. Compatible with PowerPoint, Keynote, and Google Slides.


4 diapositivas
Business Growth in Numbers Presentation
Showcase business performance with the Business Growth in Numbers Presentation template. Designed for sales reports, financial reviews, and market analysis, this template includes visualized statistics, percentage comparisons, and trend graphs to highlight key growth metrics. Fully customizable and compatible with PowerPoint, Keynote, and Google Slides, it ensures clear and compelling data storytelling.


12 diapositivas
Digital Marketing Strategy Presentations
Turn complex campaigns into captivating visuals with this modern, data-driven layout designed for marketing professionals. Perfect for outlining strategies, performance metrics, and digital funnels, it keeps information clear and visually engaging. Easily customizable and fully compatible with PowerPoint, Keynote, and Google Slides for seamless editing across your favorite platforms.


4 diapositivas
Defining Company Purpose Presentation
This template provides a visually engaging platform to articulate your organization's core values and mission. It features vibrant, clear sections for detailed insights, helping to communicate the foundational elements that drive business decisions and culture. Each slide is designed to support a cohesive narrative about your company's objectives and strategic direction, ensuring a professional presentation of your corporate ethos. This template is perfect for workshops, stakeholder meetings, or internal team alignments and is fully compatible with PowerPoint, Keynote, and Google Slides.


20 diapositivas
Solstice Research Proposal Presentation
This sleek research proposal template is crafted to impress! Highlighting sections like research methodology, literature review, key findings, and recommendations, it’s designed for in-depth presentations with a modern touch. Perfect for academic, business, or technical reports, this template is fully compatible with PowerPoint, Keynote, and Google Slides. Ideal for delivering insights with style!


8 diapositivas
Data-Driven Feedback Analysis
Break down insights with precision using this Data-Driven Feedback Analysis presentation. Designed to showcase key points in a logical flow, this layout uses labeled segments (A–D) to categorize findings, highlight action items, and visualize patterns. Ideal for reports, audits, and feedback reviews. Fully editable in PowerPoint, Keynote, and Google Slides.


28 diapositivas
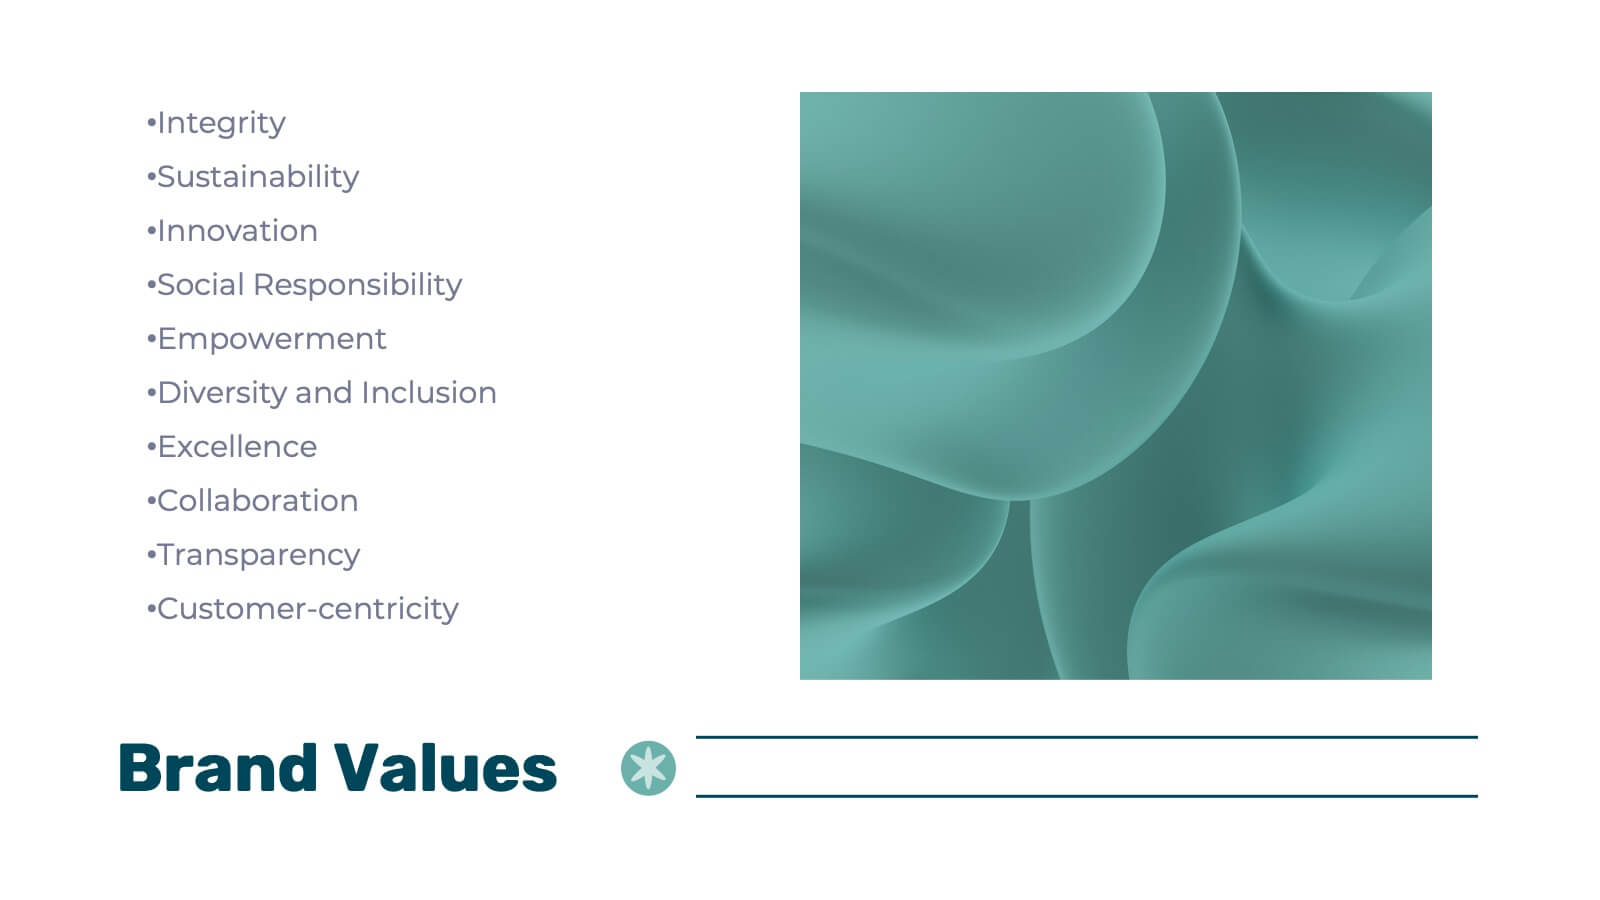
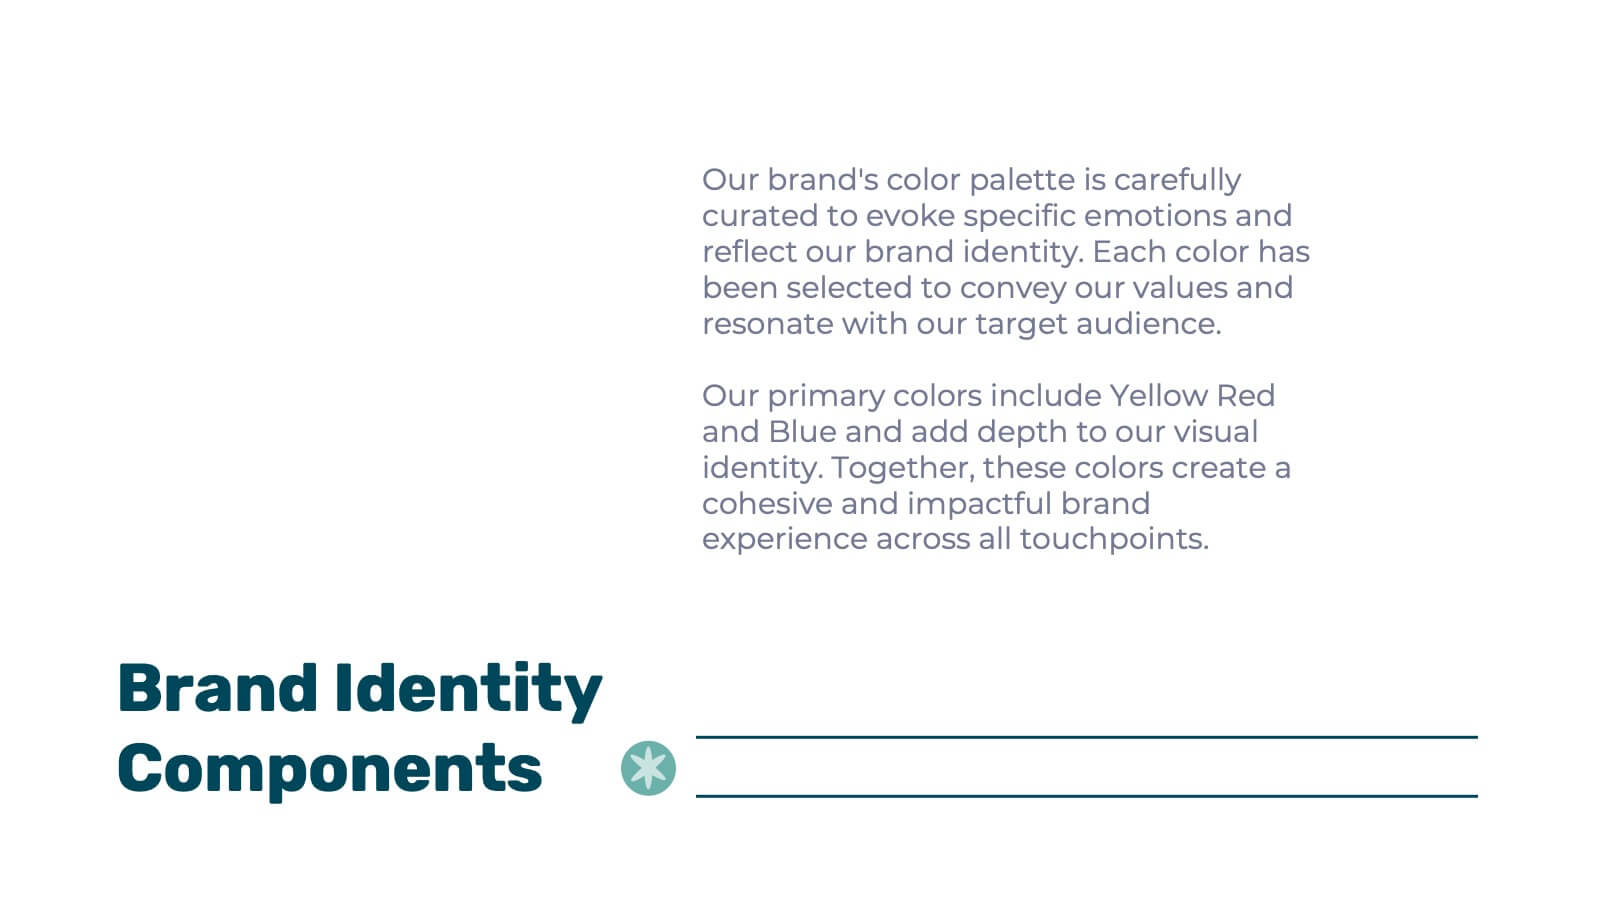
Hawking Brand Strategy Report Presentation
Introduce your brand's vision with this polished and professional strategy report presentation template. Designed for businesses, marketers, and branding agencies, it features comprehensive sections for communicating your brand identity, goals, and market positioning. This template highlights areas such as brand philosophy, target audience insights, competitive analysis, and visual identity systems. Showcase your brand’s unique selling proposition with engaging slides dedicated to colors, typography, logos, and packaging. With layouts tailored for presenting data, strategies, and case studies, you’ll ensure every aspect of your brand resonates clearly. Compatible with PowerPoint, Google Slides, and Keynote, this template is fully customizable to match your style and branding needs. Its clean, modern design and easy-to-edit structure make it a versatile choice for strategy reports, pitches, or team presentations. Elevate your branding efforts and communicate your story with confidence and clarity.


4 diapositivas
Simple and Effective Steps Presentation
Guide your audience through a seamless workflow with this "Simple and Effective Steps" template. Designed for clarity and impact, this layout breaks down processes into four distinct steps, making it ideal for project planning, decision-making, and strategy execution. Fully customizable and compatible with PowerPoint, Keynote, and Google Slides.