


Características


¿Tienes alguna pregunta?
Recomendar


5 diapositivas
Customer Profile and Persona Insights Presentation
Showcase your target audience with style using this modern persona insights deck. Highlight demographics, traits, and behaviors through visual cards and editable text placeholders. Perfect for marketing strategy, user research, or campaign planning. Fully customizable in PowerPoint, Keynote, and Google Slides to align with your branding and presentation needs.


4 diapositivas
Core Company Value Mapping Presentation
Spotlight your business strengths with the Core Company Value Mapping Presentation. This slide design helps you break down and compare key value drivers using a structured visual format—ideal for internal strategy discussions, executive briefings, or stakeholder updates. Highlight metrics, priorities, or departments with side-by-side percentage comparisons and icon indicators. Fully editable in PowerPoint, Keynote, and Google Slides. A must-have for operations teams, consultants, and leadership presentations.


5 diapositivas
Team Goals and Alignment Strategy Presentation
Align your team with clarity using the Team Goals and Alignment Strategy Presentation. This slide visually connects individual roles to a central target, making it ideal for showcasing strategic alignment, shared objectives, or team contributions. Fully customizable in Canva, PowerPoint, or Google Slides for seamless team planning.


7 diapositivas
Training Infographic Presentation Template
Training is the foundation of a successful business. It gives everyone a great understanding of their responsibilities and the knowledge and skills they need to do that job. Training is essential for your new employees. The purpose of this template is to promote effective communication and understanding on the importance of training. Training is an essential part of growing your company. This presentation will allow you to show how training is an opportunity to learn new skills and improve on existing ones. This template provides a fun and professional layout that your employees will love.


6 diapositivas
6-Step Circular Process Diagram Presentation
Bring your workflow to life with a clean circular layout that makes every phase feel connected and easy to follow. This presentation breaks complex processes into six intuitive steps, ideal for strategy, planning, or operations. Fully compatible with PowerPoint, Keynote, and Google Slides.


4 diapositivas
Task Management Checklist Presentation
Stay organized and boost productivity with the Task Management Checklist template. This structured design helps you categorize tasks into Do’s and Don’ts, ensuring a clear workflow for efficient task execution. Fully editable and compatible with PowerPoint, Keynote, and Google Slides, making it perfect for teams and professionals alike.


4 diapositivas
Device Mockup Display Slide Presentation
Showcase your digital products with this device mockup slide. Ideal for highlighting landing pages, dashboards, or app interfaces, the layout includes clean typography and vibrant shapes for visual balance. Fully editable in PowerPoint, Keynote, and Google Slides—customize text, colors, and images to fit your tech brand or presentation style.


6 diapositivas
Business Flow Chart Design Presentation
Bring clarity and momentum to your process with a clean, visual layout that turns complex steps into an easy-to-follow flow. This presentation helps teams map stages, responsibilities, and progress with confidence, making it perfect for planning, strategy, and operations. Fully compatible with PowerPoint, Keynote, and Google Slides.


7 diapositivas
Thank You Card Infographic
Celebrate the art of gratitude with this sophisticated collection, perfectly blending contemporary design with a personal touch. Each layout is crafted with aesthetic finesse, featuring subtle color palettes, elegant typography, and thoughtful placement of visual elements that enhance the warmth of your message. Offering a variety of designs from minimalist to richly textured backgrounds, this collection provides a unique backdrop for expressing thanks. Customize these cards for any occasion, whether it's professional gratitude towards colleagues and clients, or personal appreciation for friends and family. Ideal for both digital expressions and printed notes, this set ensures your message of thanks is received with the sentiment it’s intended. It’s a wonderful way to convey appreciation and leave a memorable impression on its recipients.


23 diapositivas
Pulse Project Status Report Presentation
This vibrant and sleek report template delivers a powerful visual impact while ensuring clear communication. Perfect for tracking progress, reviewing key metrics, and analyzing client feedback, it covers everything from project highlights to competitor insights. Compatible with PowerPoint, Keynote, and Google Slides, this template elevates every report presentation with professional flair!


3 diapositivas
Customers Loyalty Program Strategy Presentation
Turn customer rewards into a story worth sharing with this modern, visually engaging layout. Ideal for showcasing loyalty program concepts, benefits, and engagement strategies, it helps businesses highlight how they retain and reward loyal clients. Fully customizable and compatible with PowerPoint, Keynote, and Google Slides for effortless presentation design.
22 diapositivas
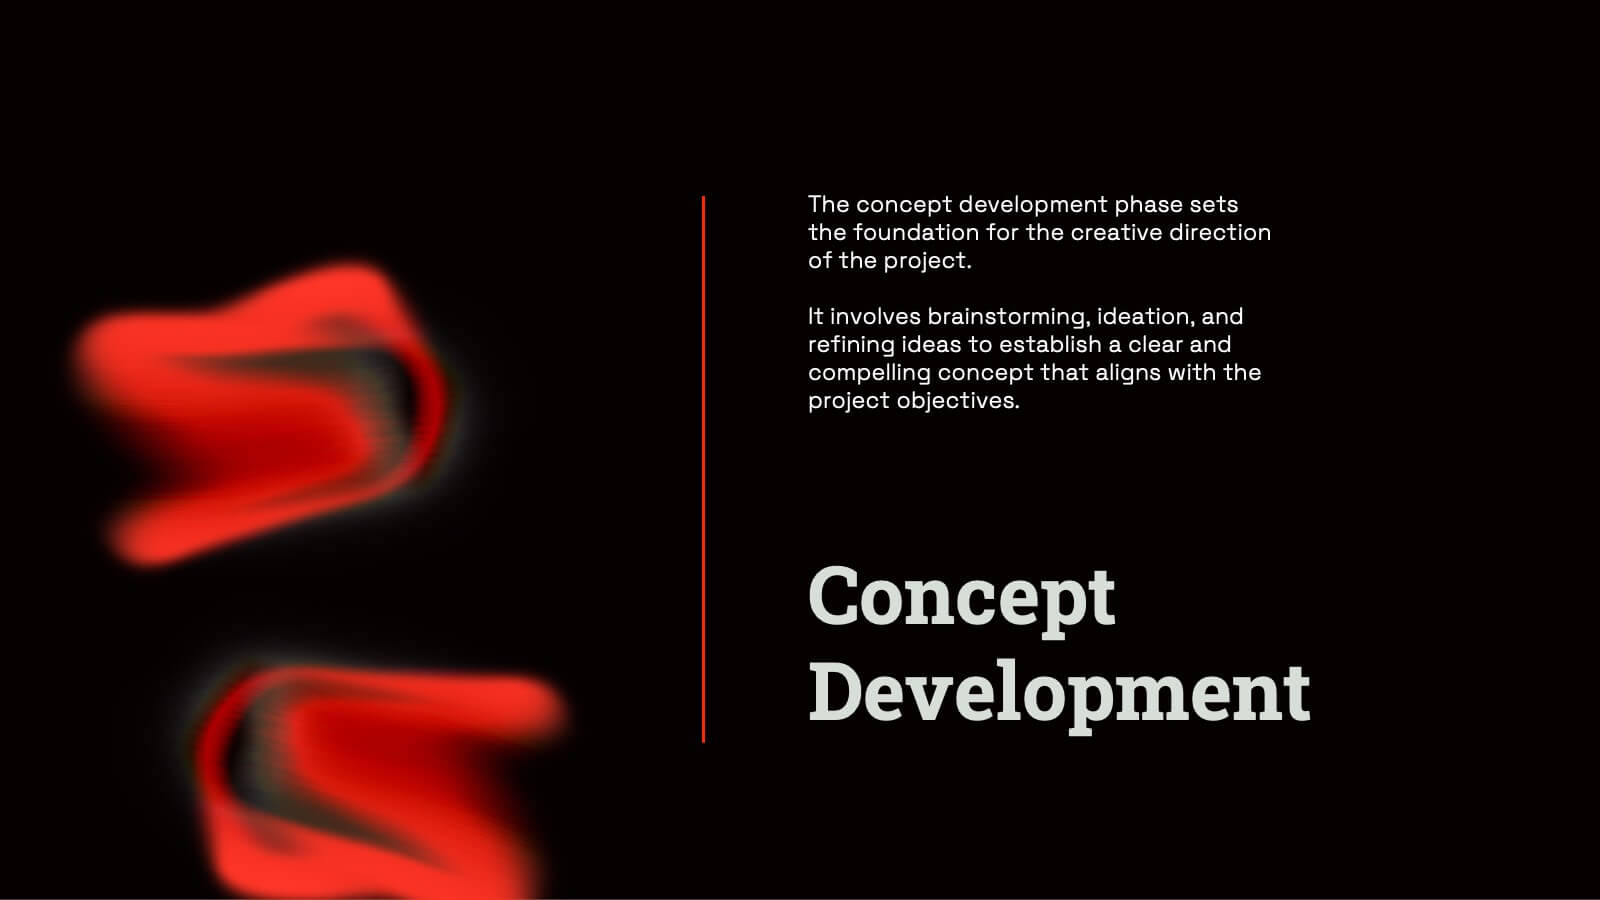
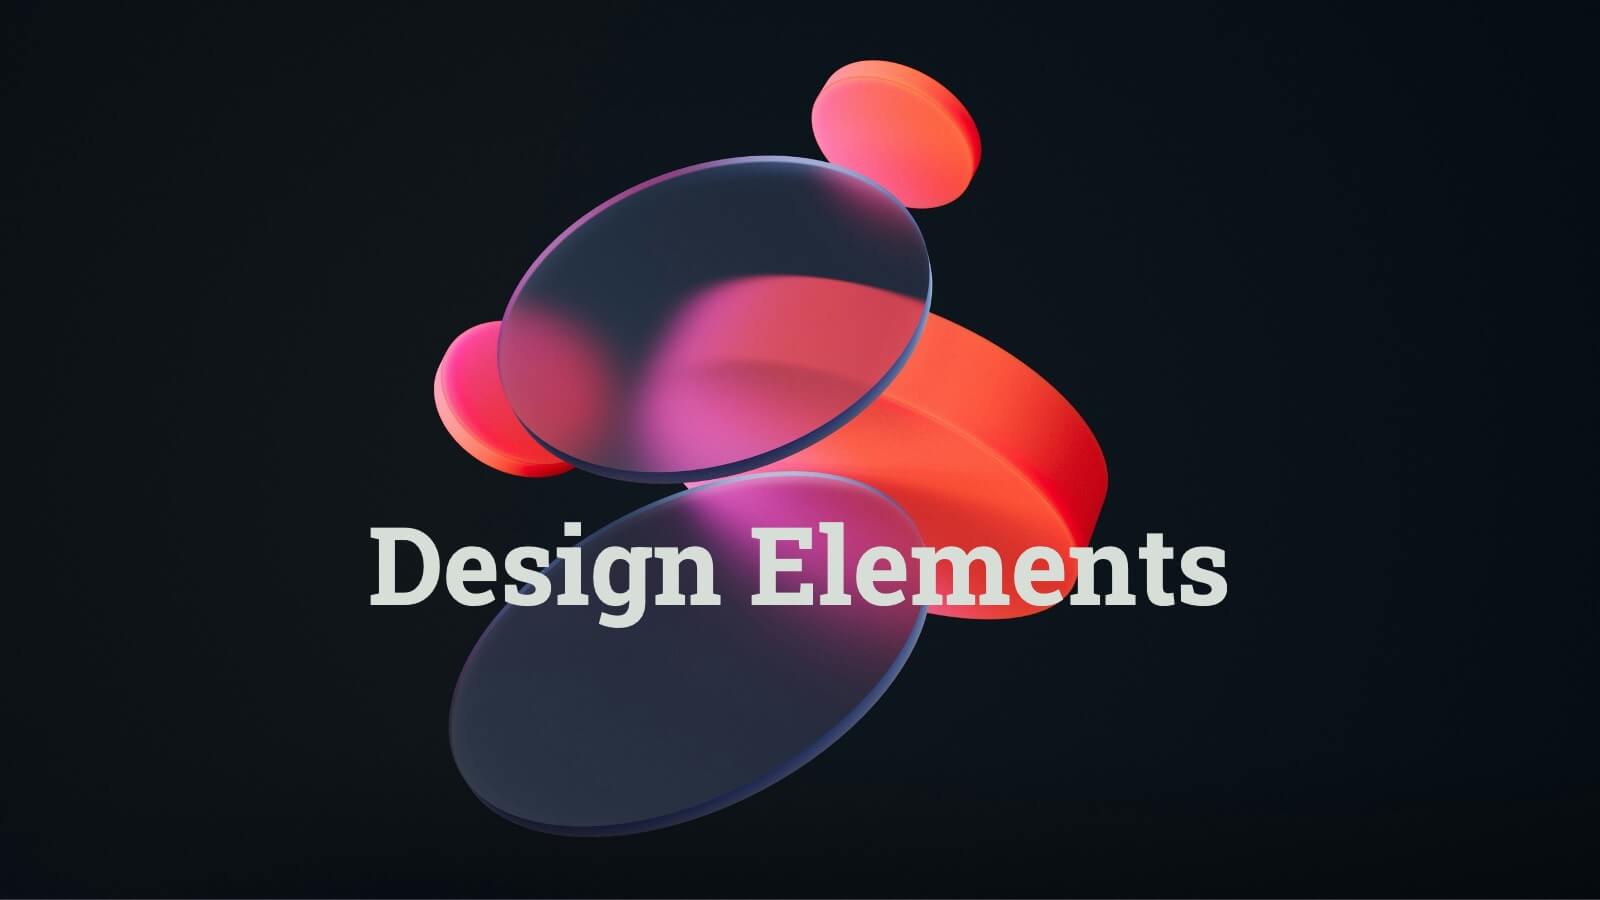
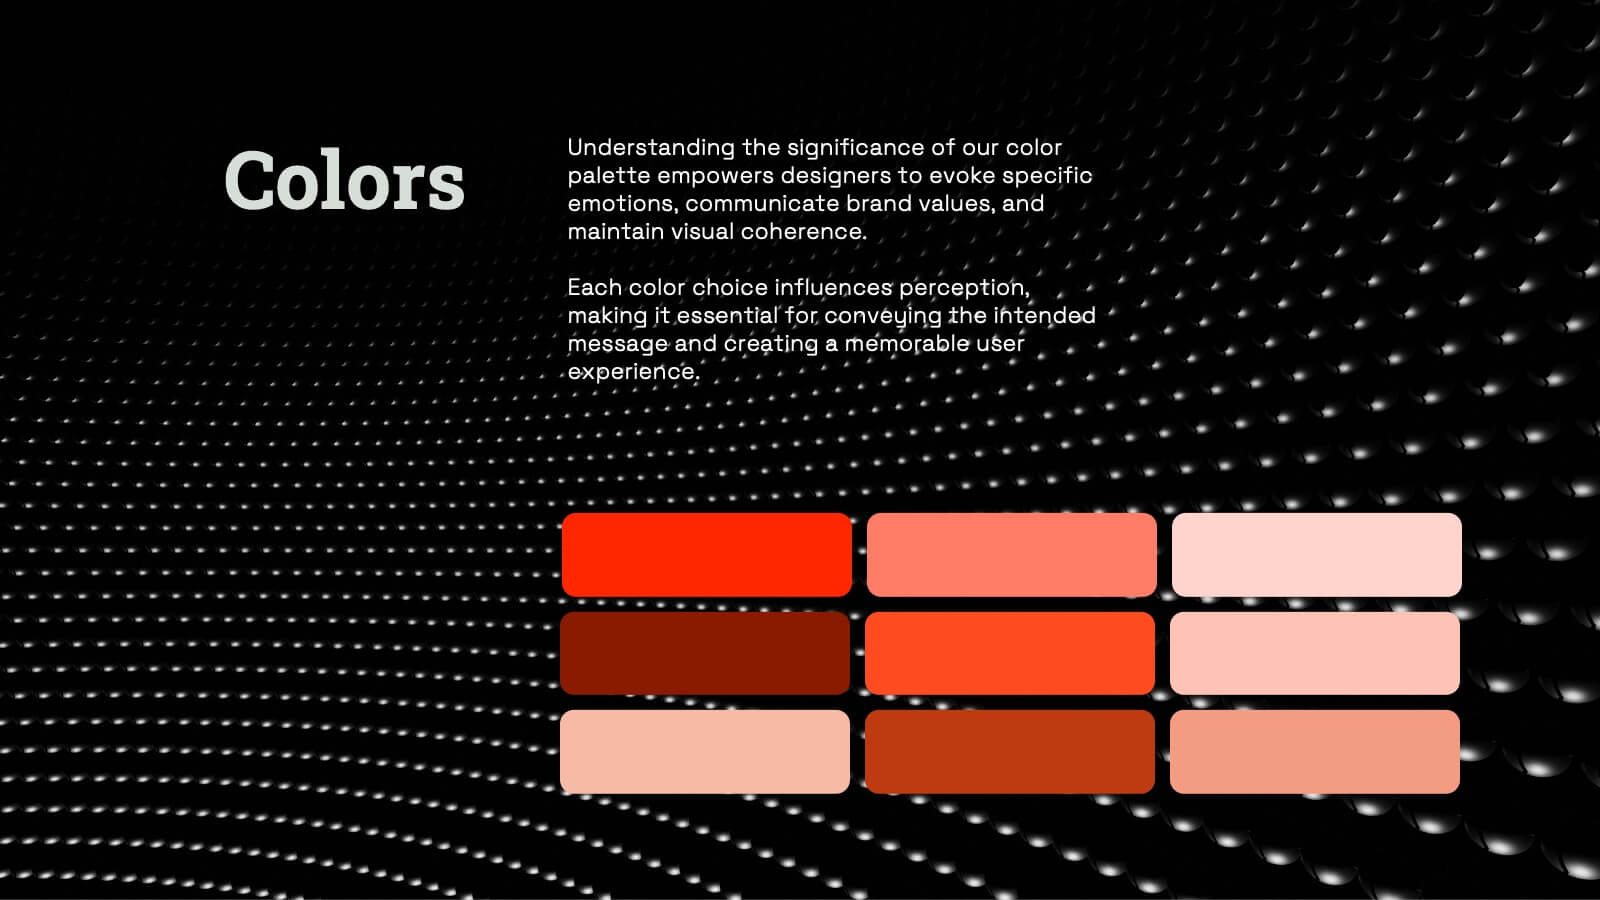
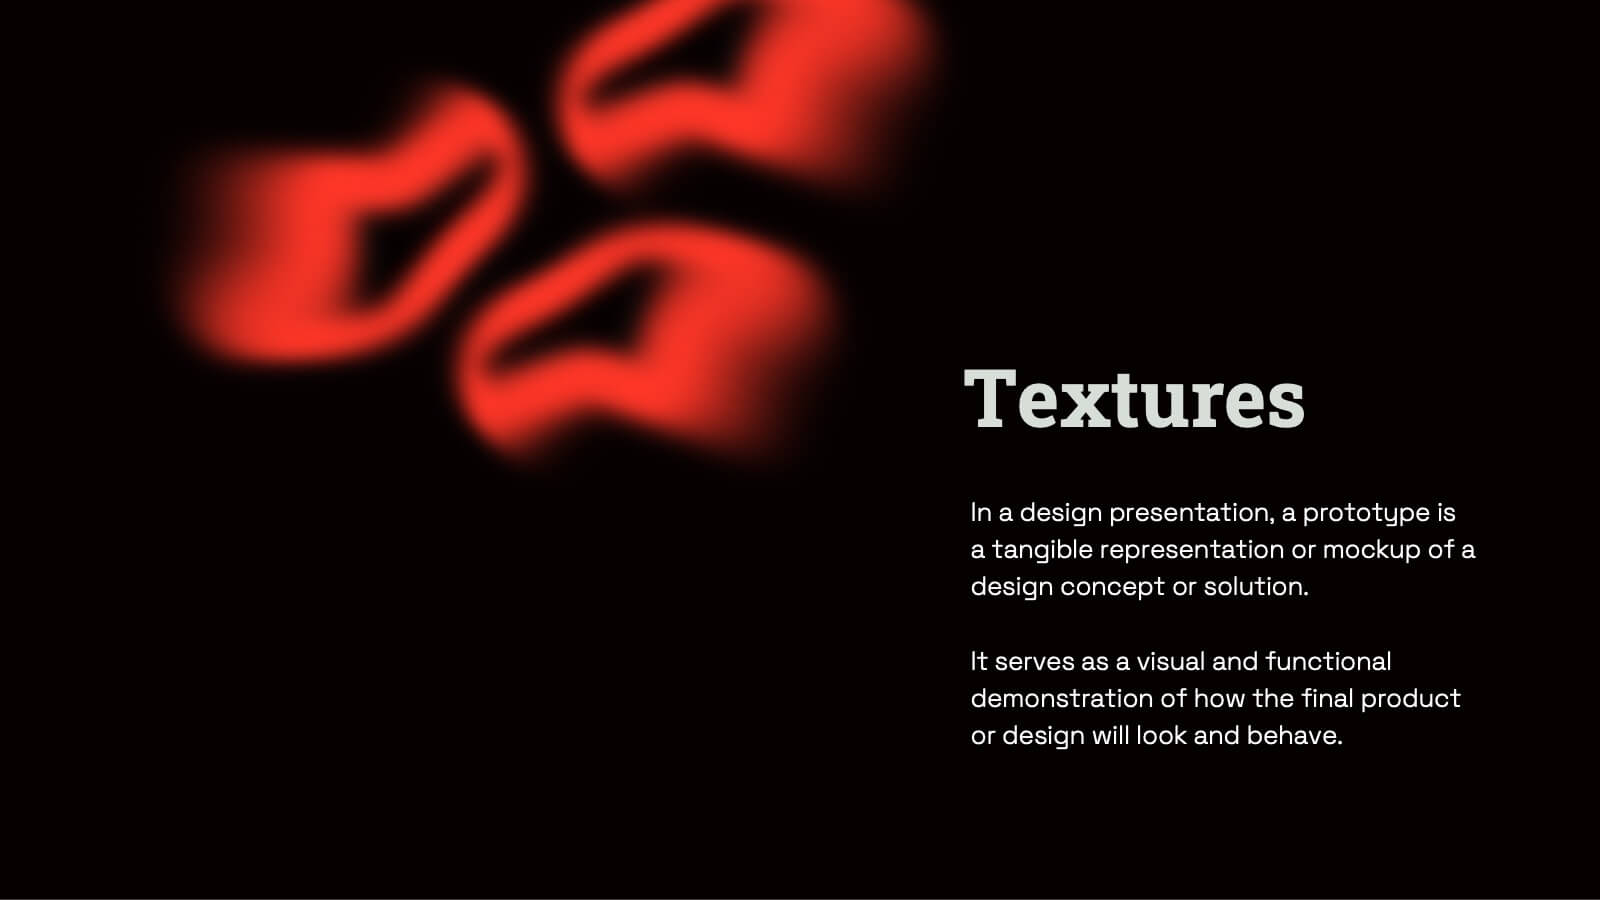
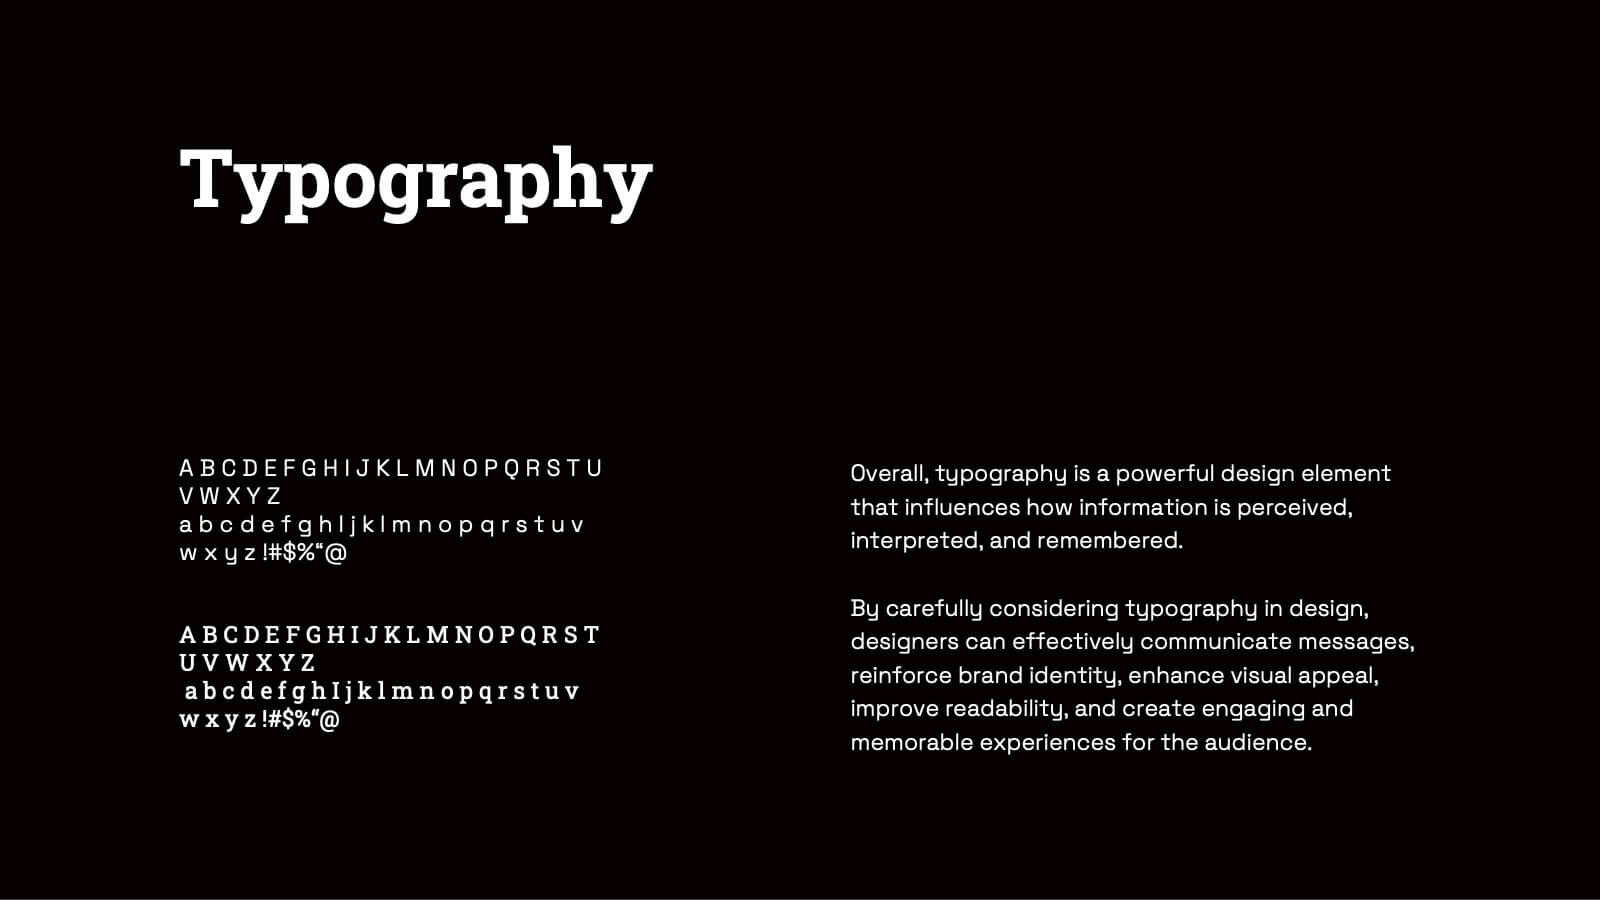
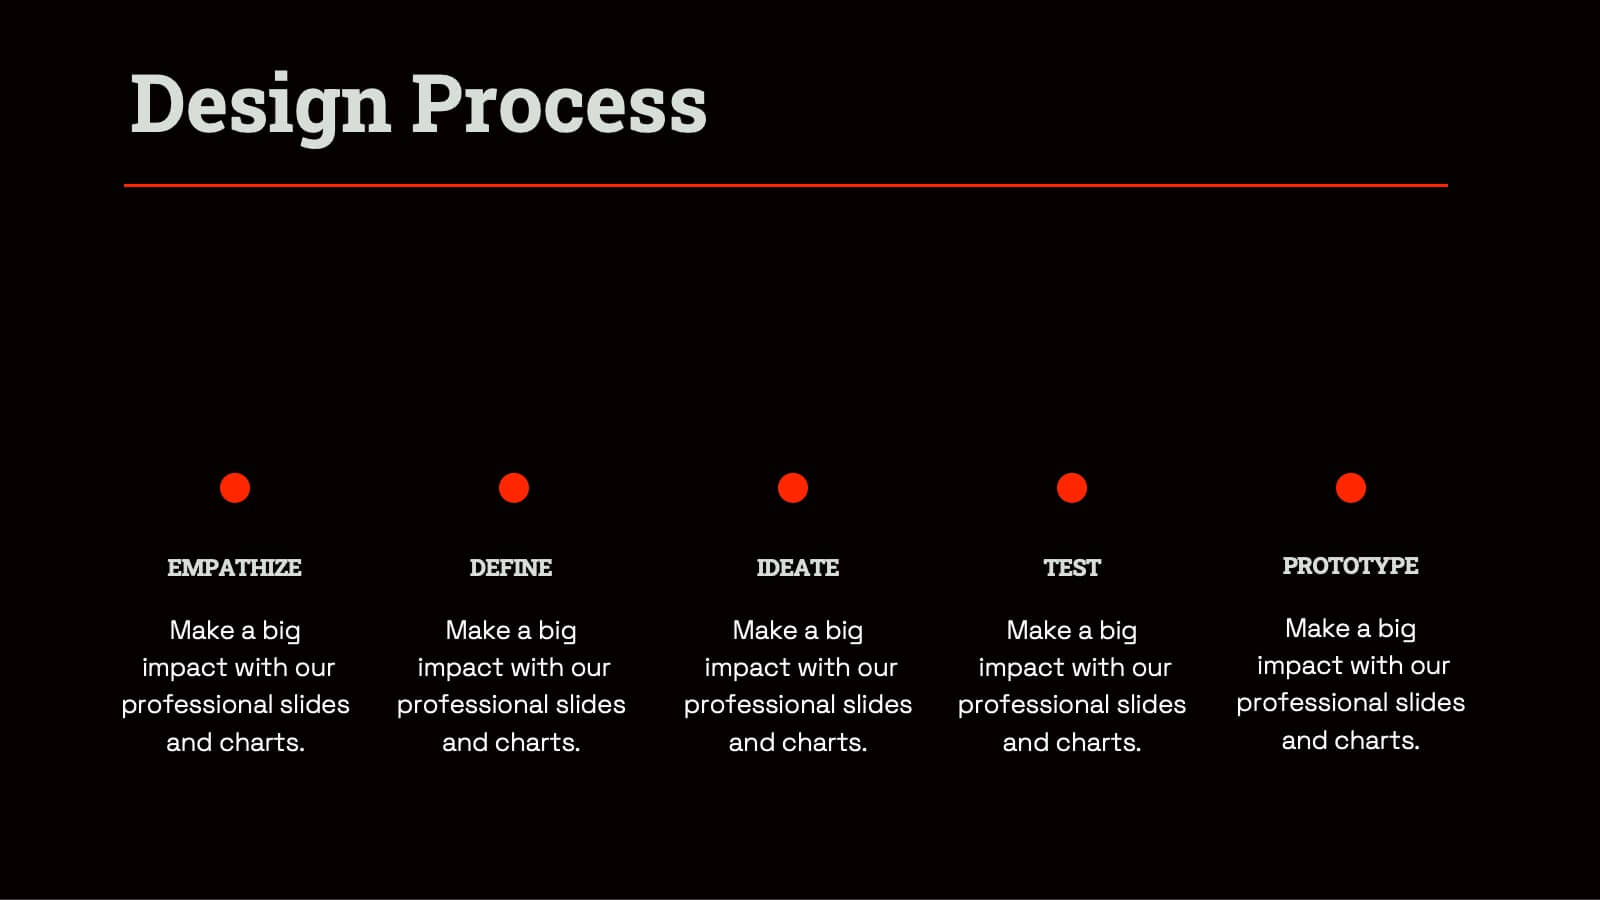
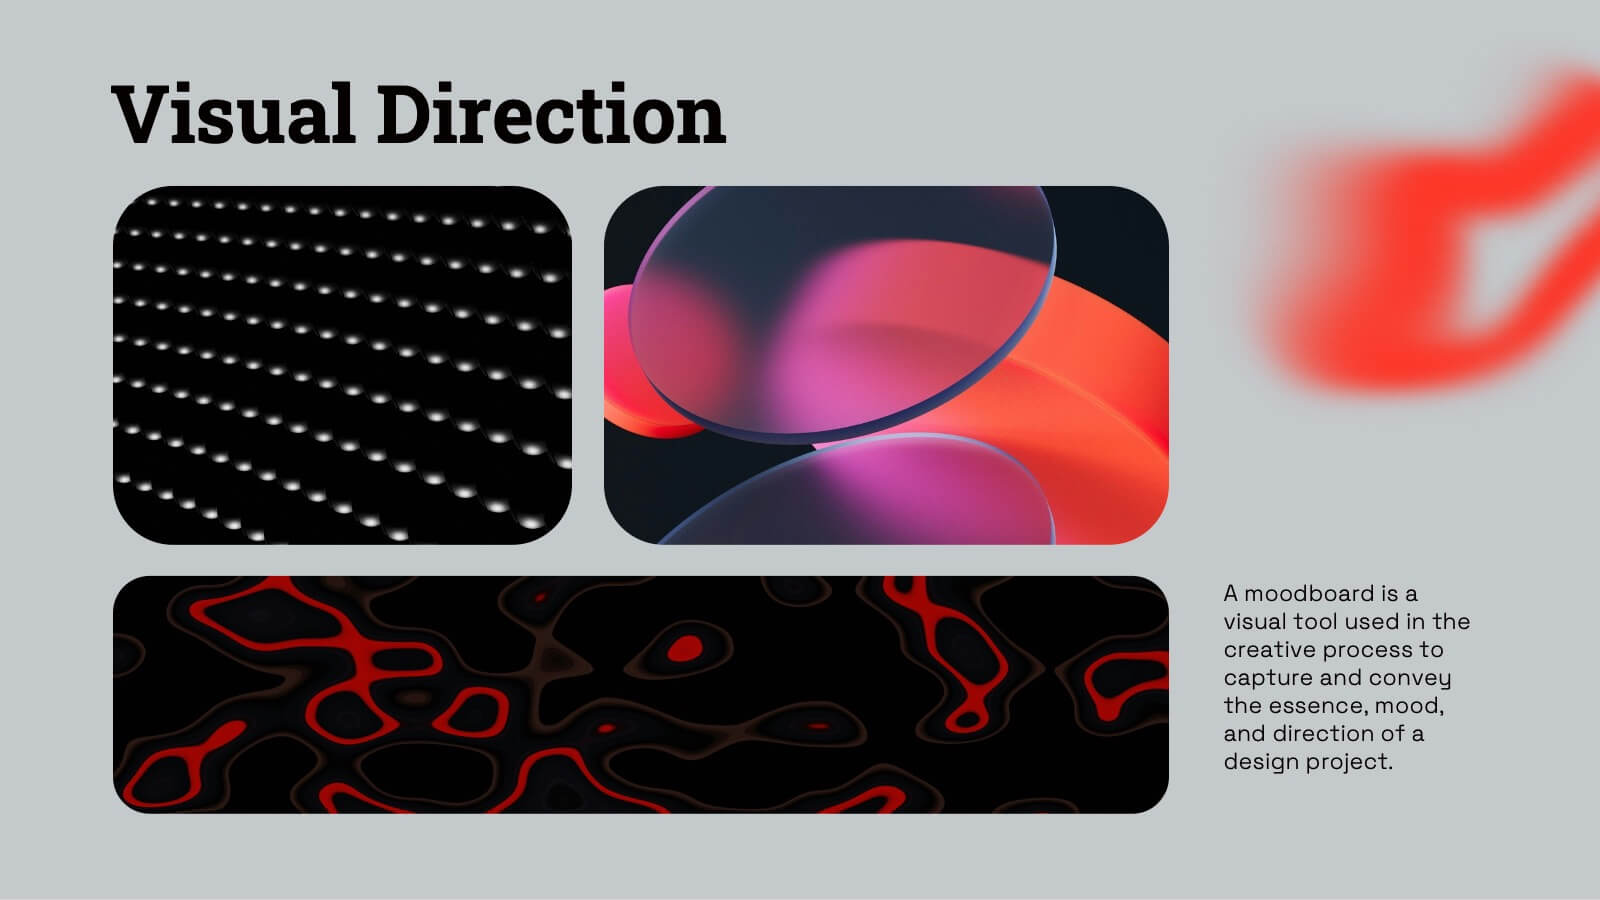
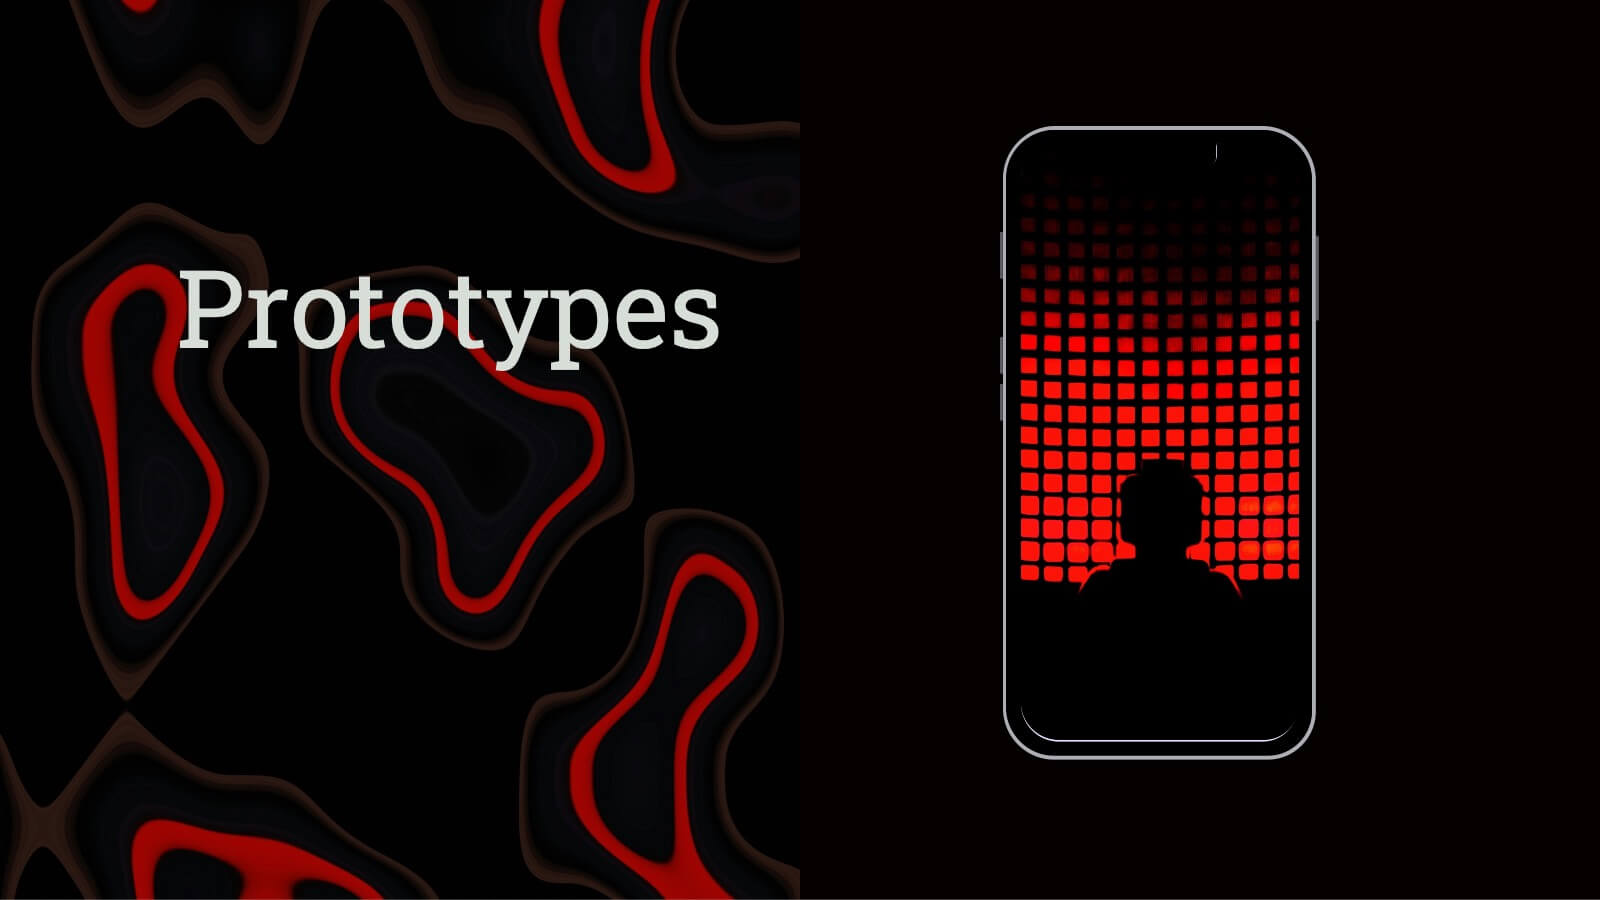
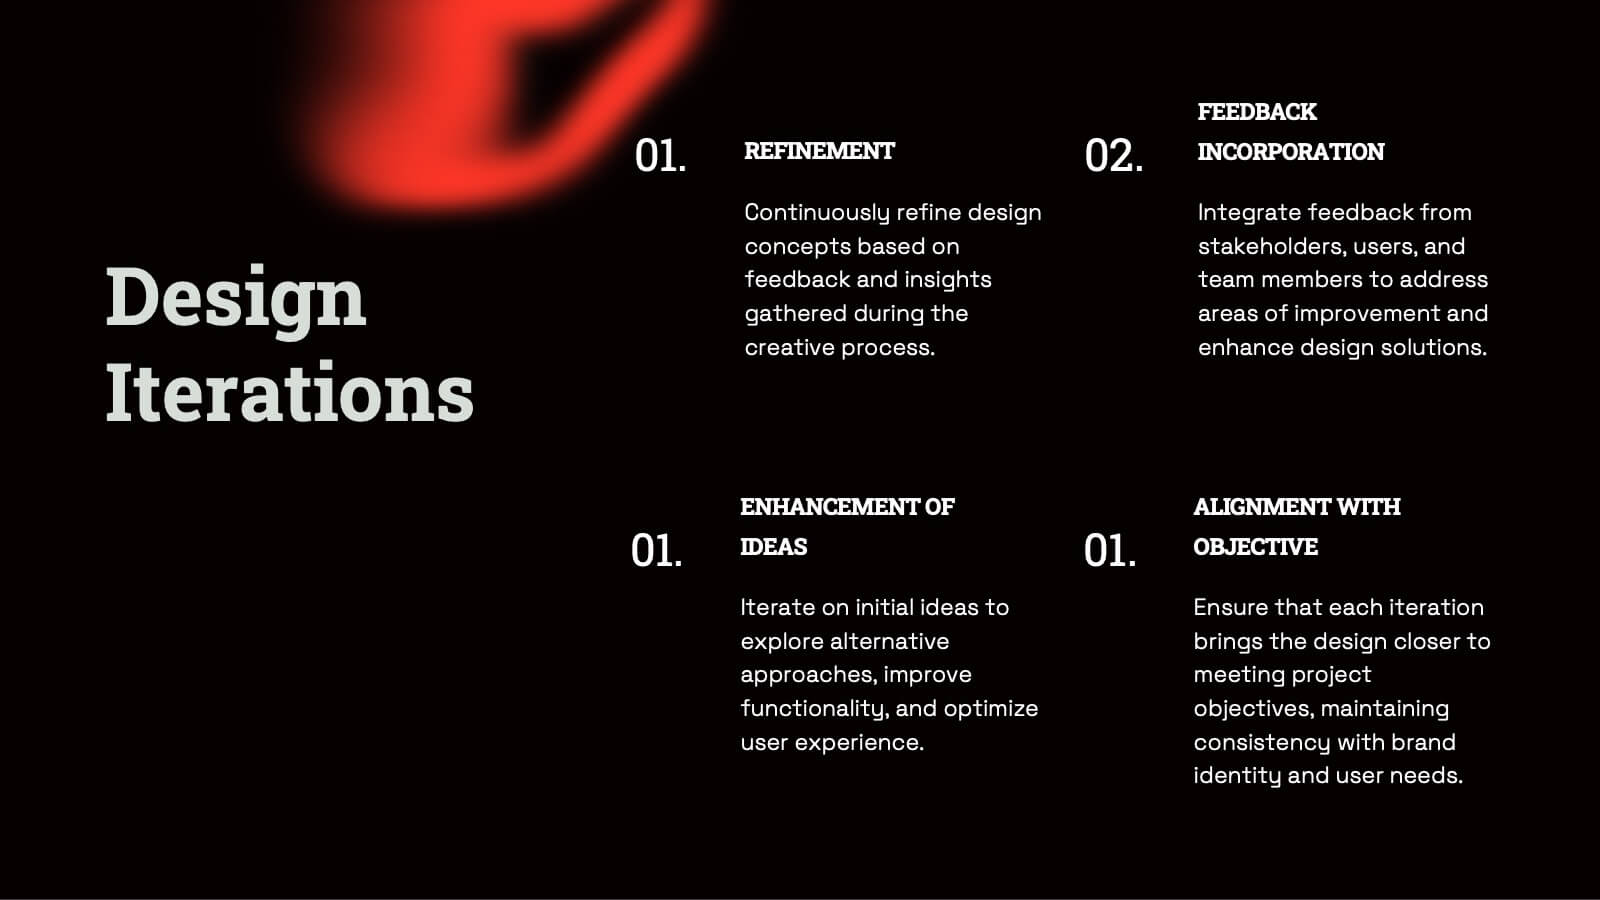
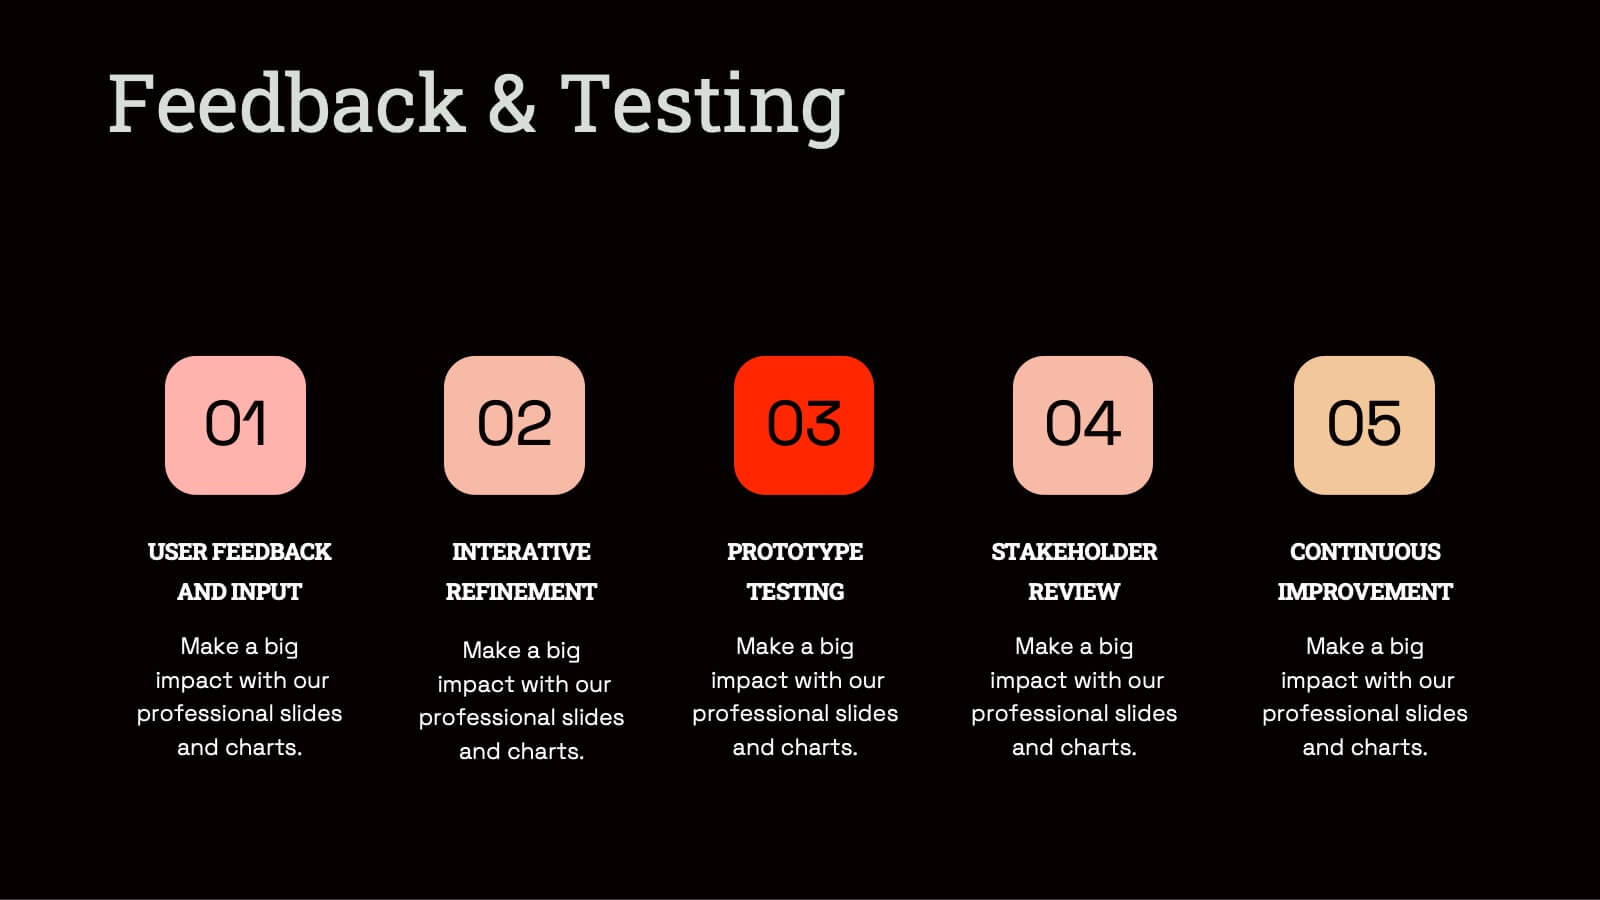
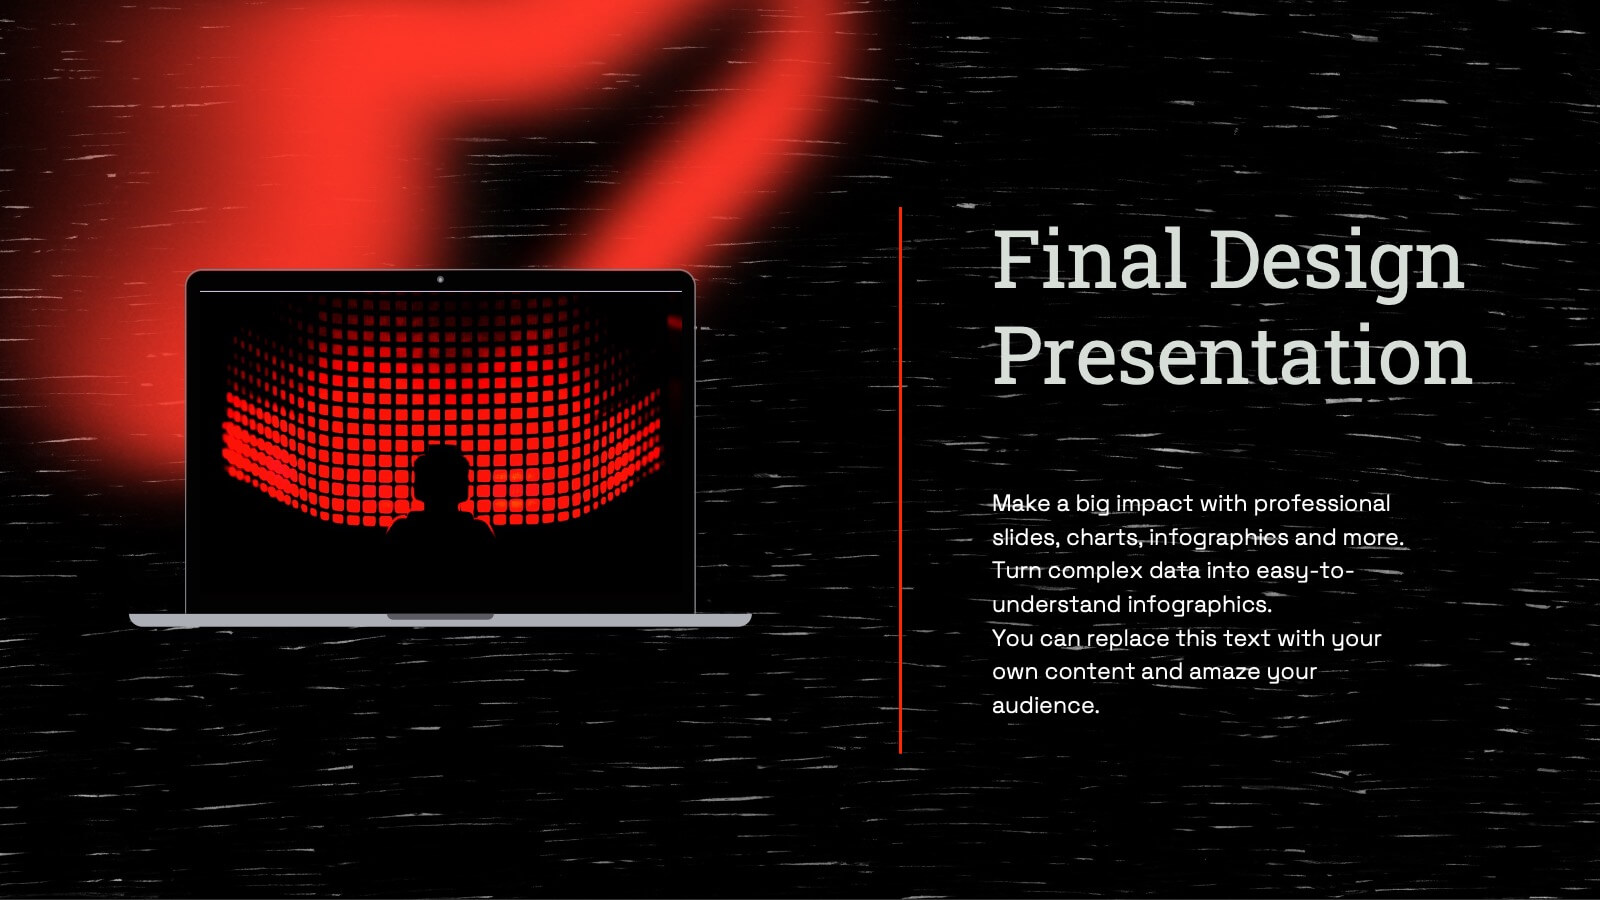
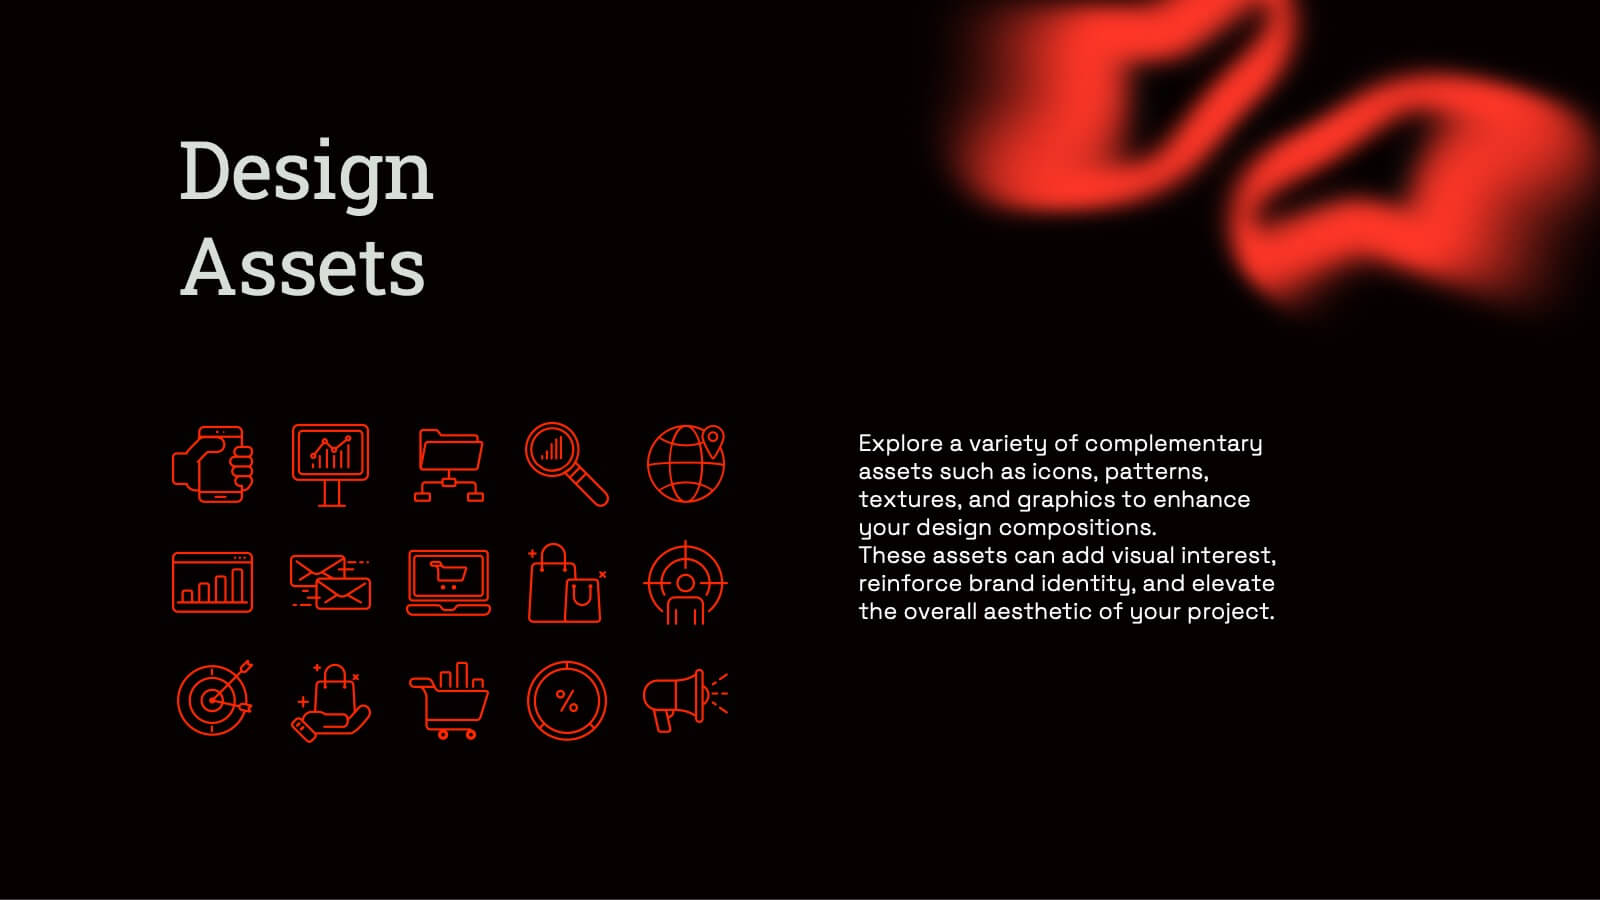
Radiant Graphic Design Project Plan Presentation
Unleash your creativity with this bold and dynamic graphic design project plan template! Perfect for showcasing design elements, textures, and typography, this template guides you through every phase, from concept development and prototyping to feedback and final presentations. Ideal for visual direction and design asset management, it’s fully compatible with PowerPoint, Keynote, and Google Slides for seamless use.


4 diapositivas
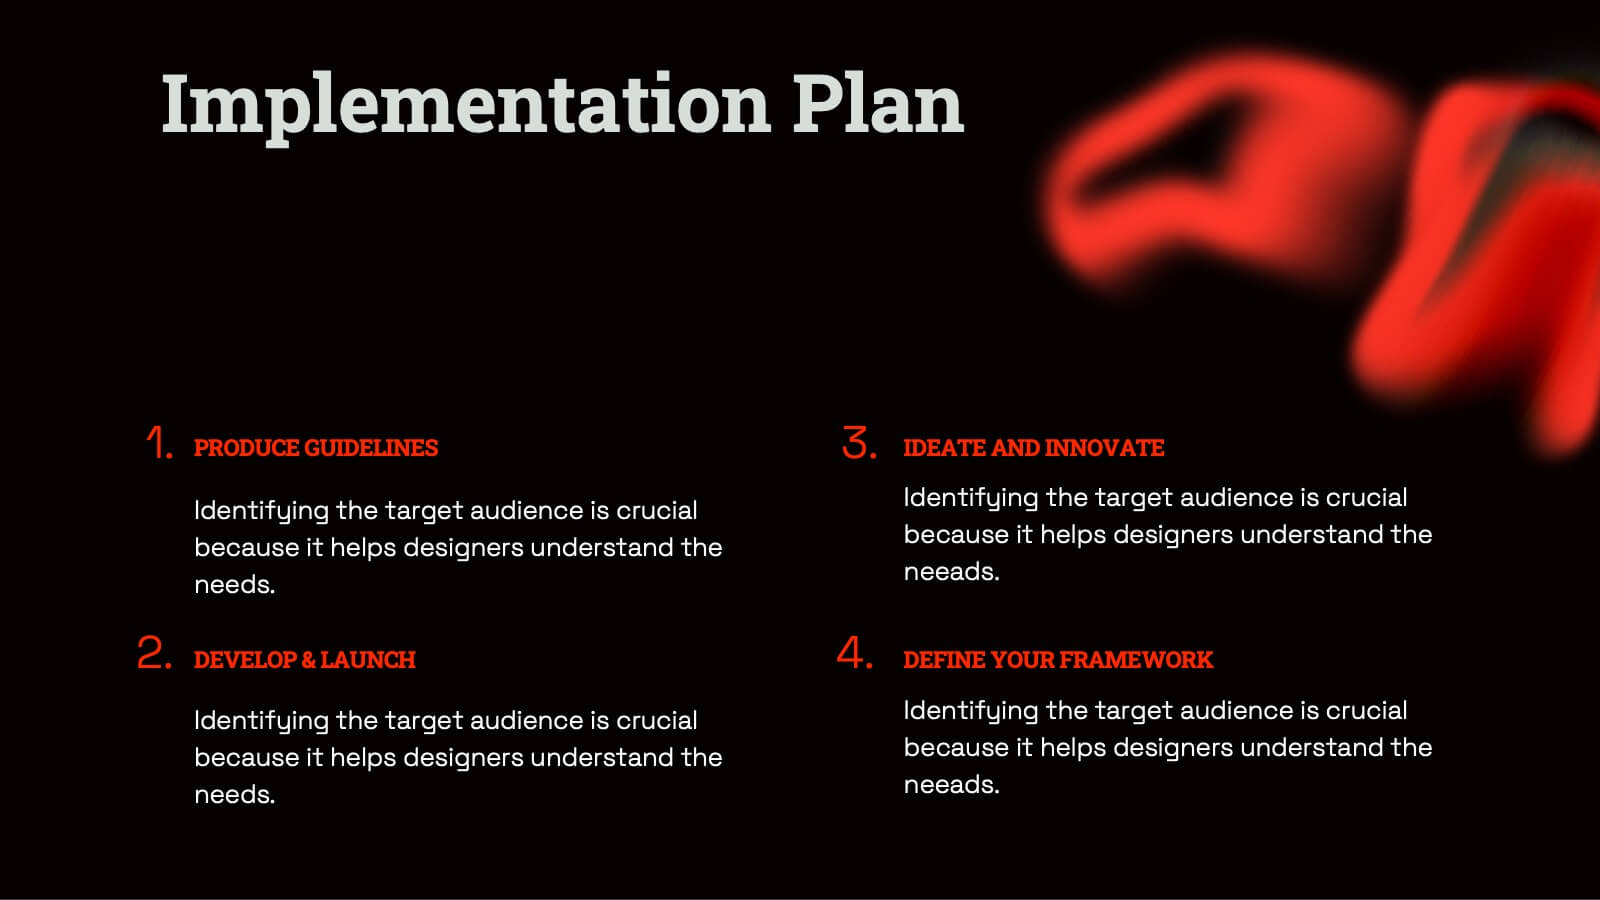
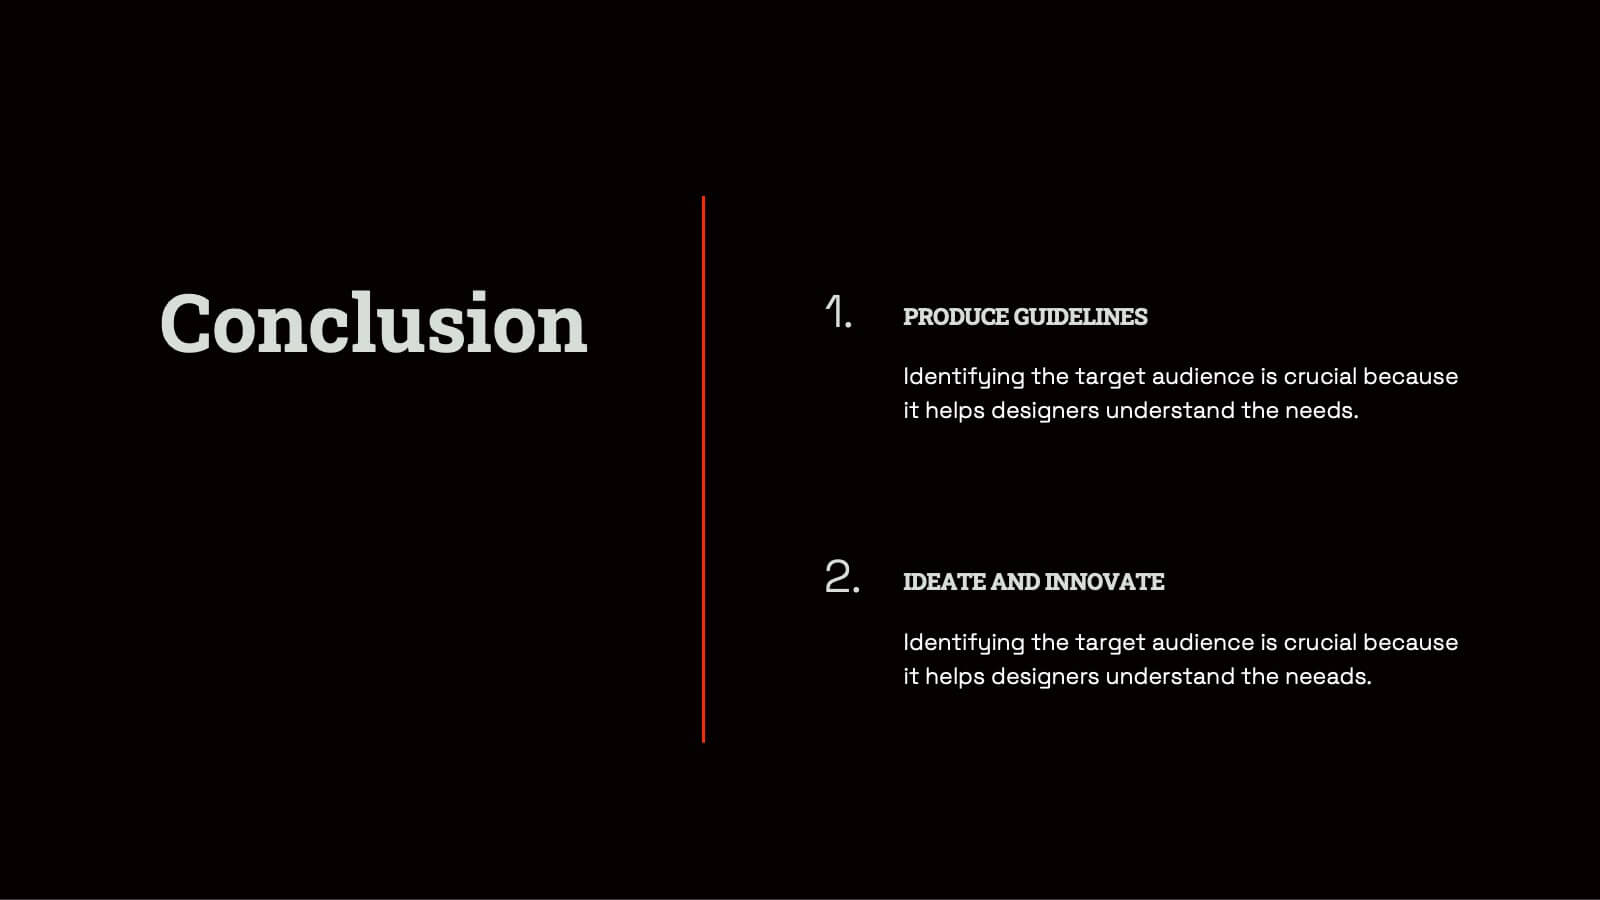
Strategic Takeaways and Final Points Presentation
Summarize key insights and final thoughts with this clean, icon-based layout. Ideal for wrapping up business reviews, strategy decks, or executive briefings, each section includes room for concise summaries and visuals. Easily customizable in PowerPoint, Keynote, and Google Slides to match your brand and presentation goals.


6 diapositivas
Market Sizing with TAM SAM SOM Strategy Presentation
Clearly define your market opportunity using the Market Sizing with TAM SAM SOM Strategy Presentation. This template breaks down Total Addressable Market, Serviceable Available Market, and Serviceable Obtainable Market with a visual bullseye format that’s intuitive and persuasive. Easily editable in PowerPoint, Keynote, and Google Slides.


7 diapositivas
Milestones Infographic Presentation Template
Our milestones infographic template includes a professional background and imagery to create a high-quality presentation that’s sure to grab your audience’s attention. This template is full of visual and engaging elements that will draw your audience in. It's a great starting point to make your own presentation, or to use as a template for future presentations. All slides are fully editable in PowerPoint so you can add and change text and images as desired, It's very easy to edit and customize the shapes and colors. Use this high-resolution template to present your topic in a professional way!


4 diapositivas
Executive Business Planning Roadmap Presentation
Outline your strategic initiatives with this Executive Business Planning Roadmap. Ideal for mapping product development, quarterly goals, or department plans, this slide helps visualize key stages across multiple projects. Easy to edit in PowerPoint, Keynote, and Google Slides—perfect for leadership updates, planning meetings, or executive-level presentations.


6 diapositivas
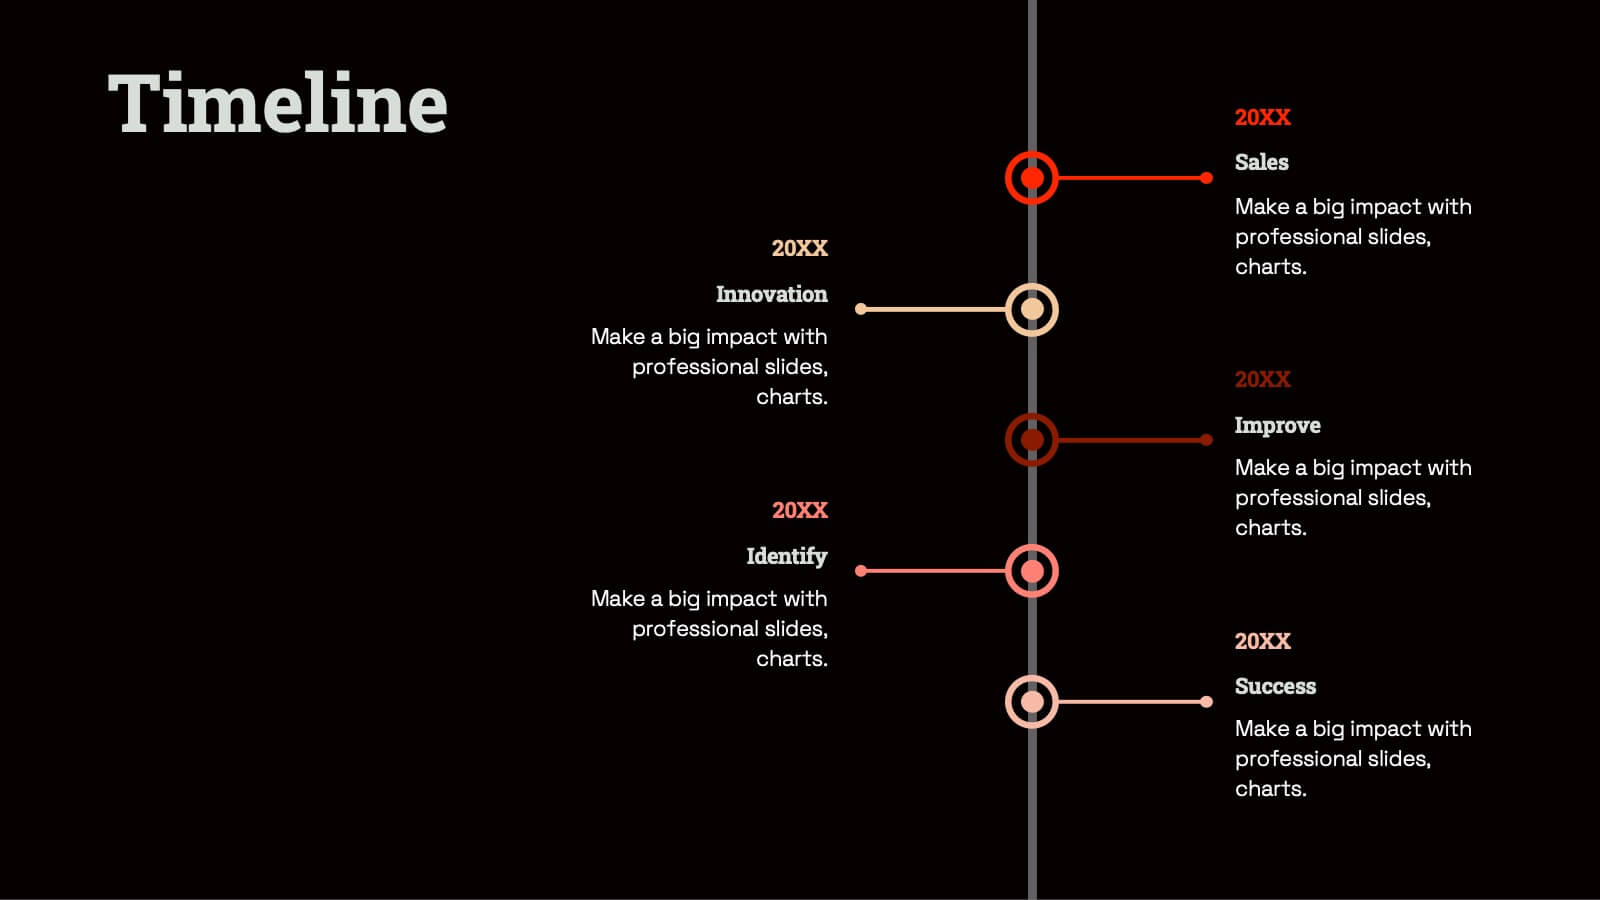
IT Operations Workflow Strategy Presentation
Optimize your IT strategy with the IT Operations Workflow Strategy Presentation. This vertically aligned timeline slide illustrates six sequential steps, each paired with a bold icon and title placeholder—perfect for outlining operational procedures, tech stack implementation, or process audits. Color-coded markers help distinguish each stage clearly. Fully editable in PowerPoint, Keynote, and Google Slides.