


Características


¿Tienes alguna pregunta?
Recomendar


6 diapositivas
Year-End Company Report Overview Presentation
Summarize your annual results with this modern year-end report slide. Designed to showcase KPIs, growth stats, and financial outcomes, it features clean icons and a clear six-section layout. Ideal for performance reviews or stakeholder updates. Fully editable and compatible with PowerPoint, Keynote, and Google Slides for quick customization.


30 diapositivas
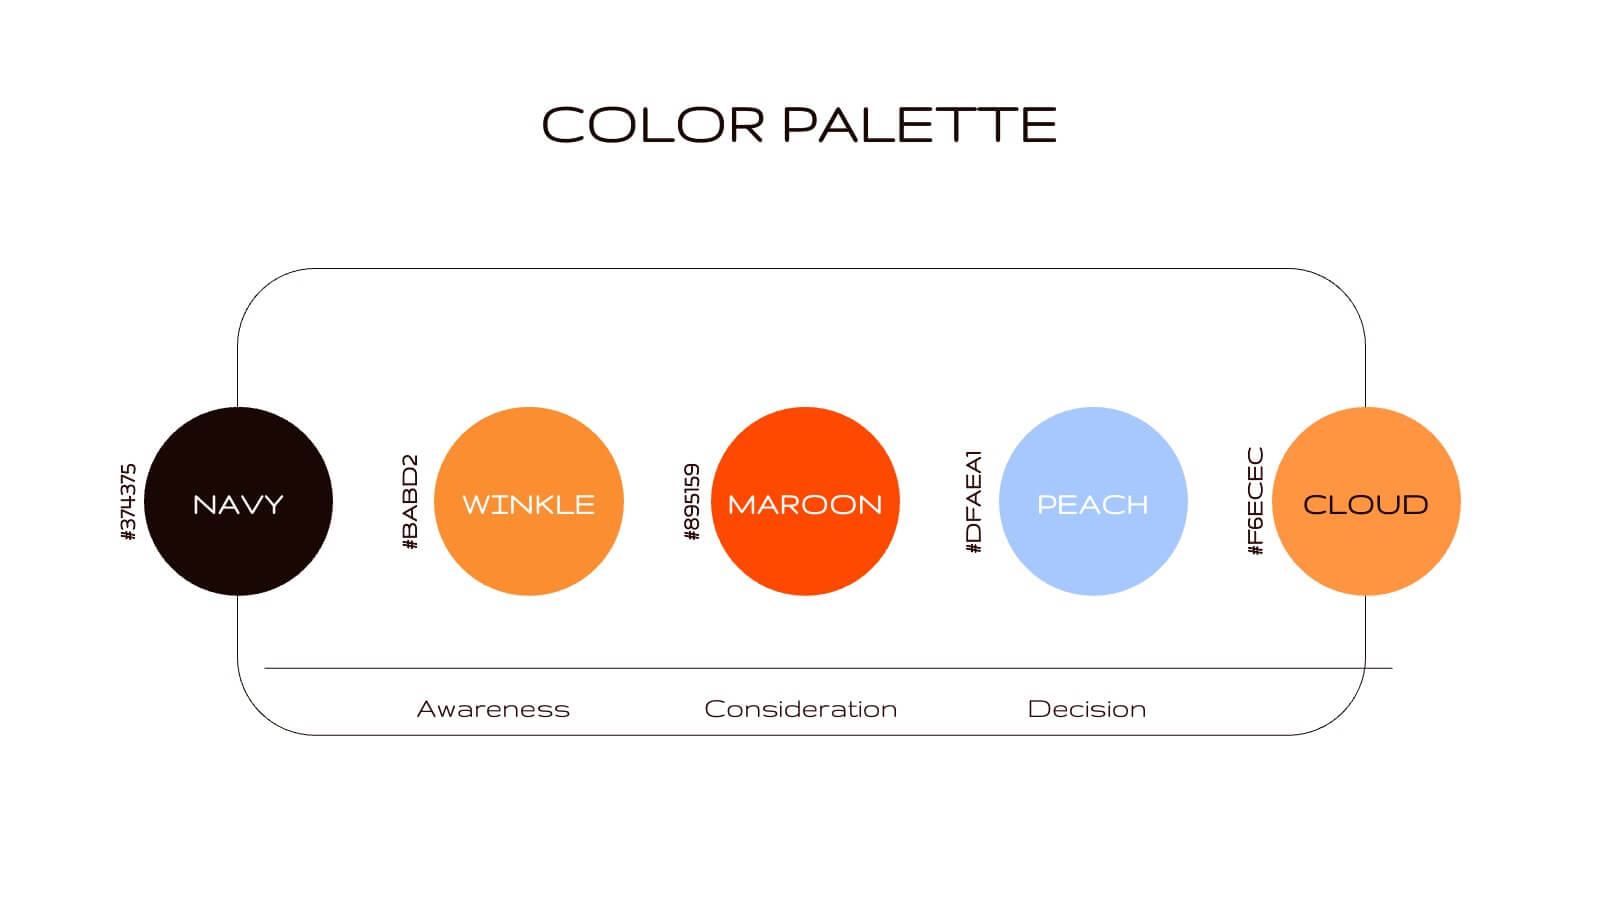
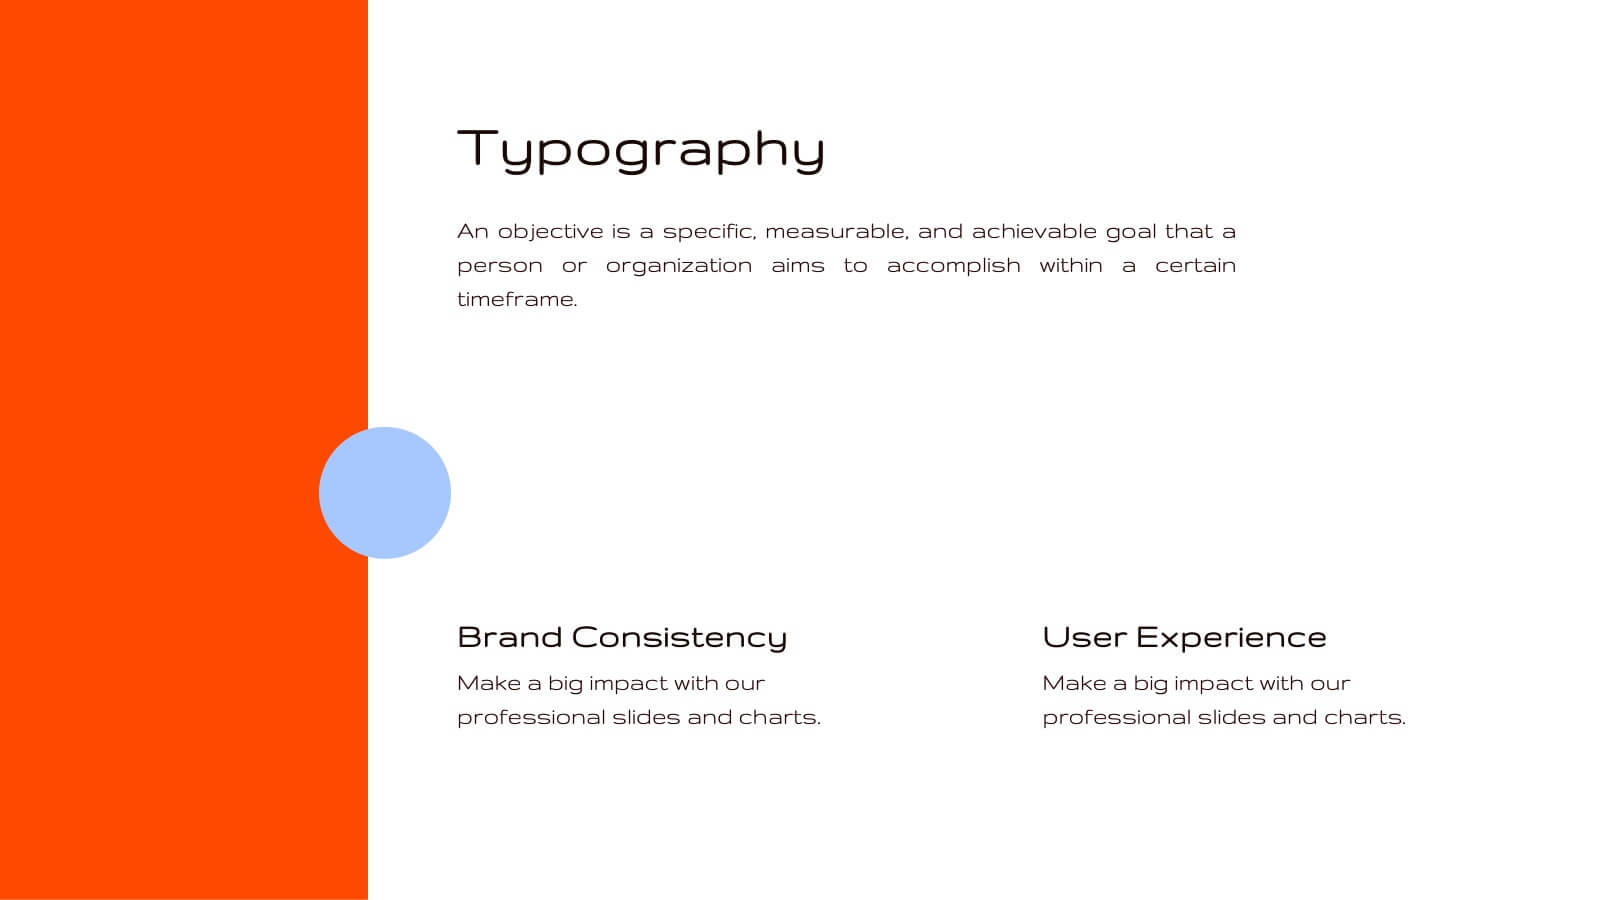
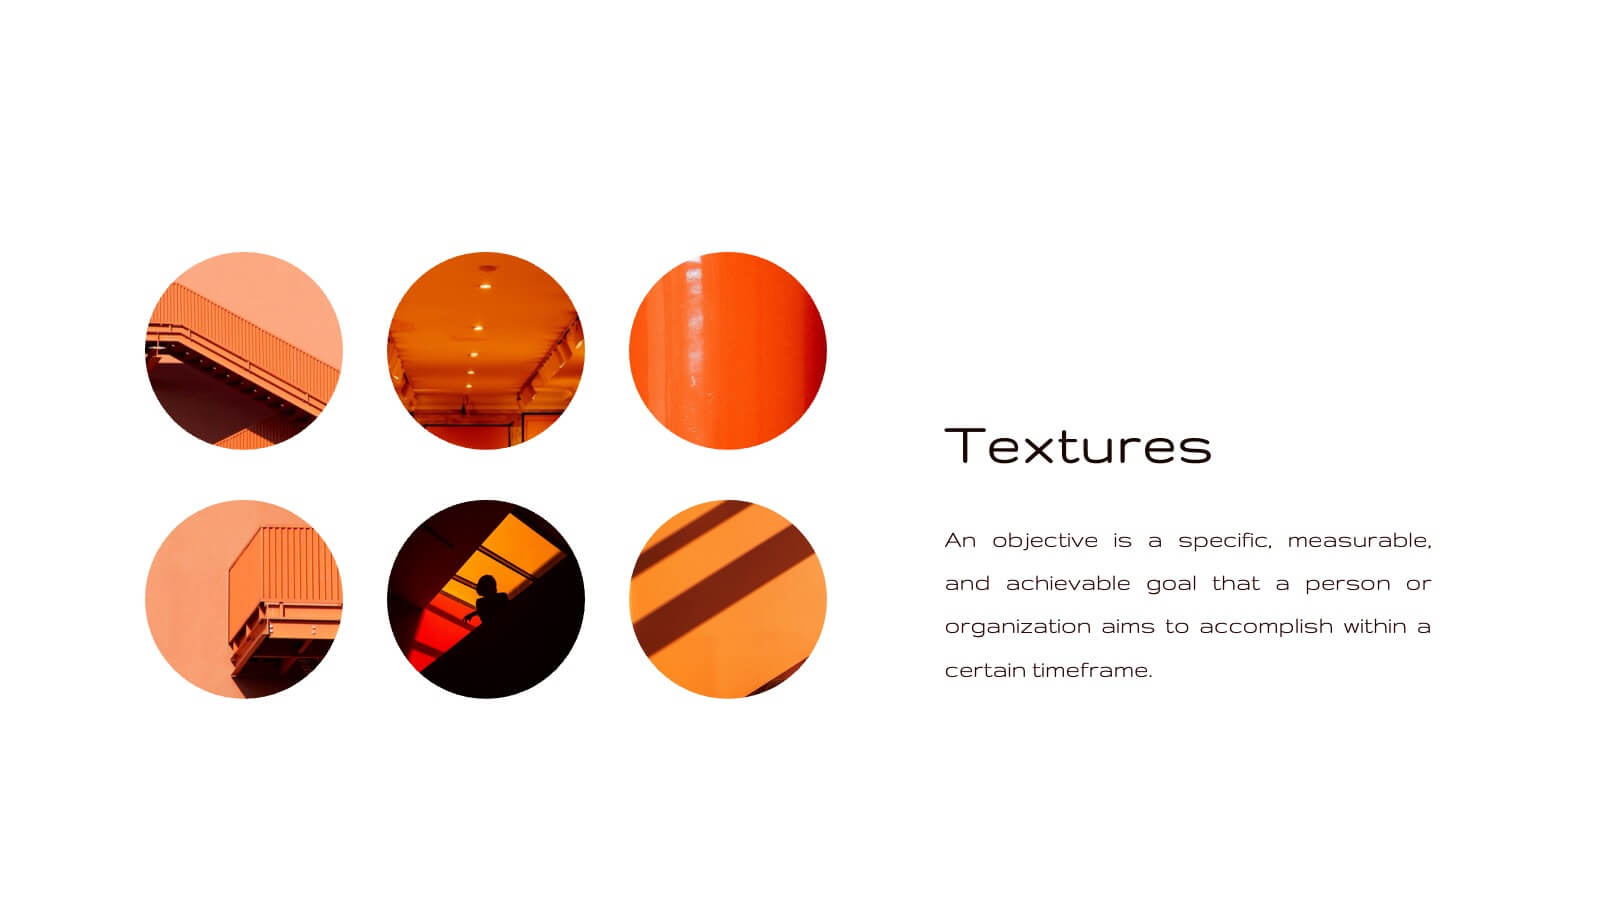
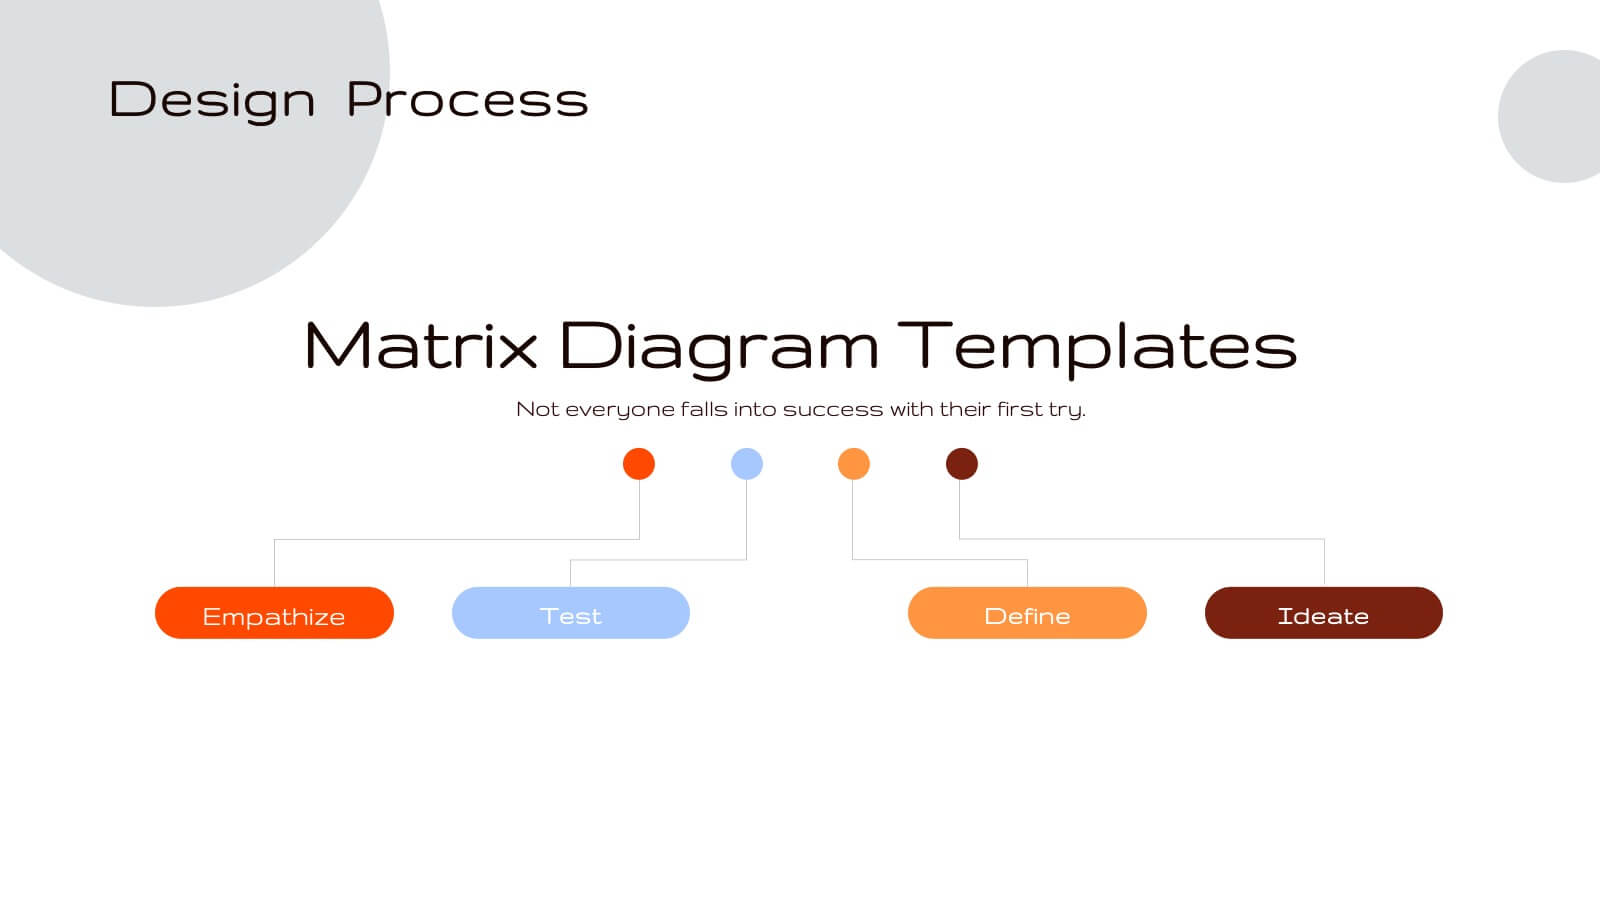
Chromalight Brand Guidelines Proposal Presentation
Elevate your brand's story with this visually engaging presentation template that embodies modern, professional aesthetics. From mission and vision statements to brand identity and market positioning, each slide is crafted to showcase your brand's core essence. Ideal for brand strategists and marketers, this template is compatible with PowerPoint, Keynote, and Google Slides.


6 diapositivas
E-learning Tools for Modern Classrooms Presentation
Present digital learning strategies with this engaging, education-themed template. Ideal for teachers, trainers, or tech coordinators introducing e-learning tools. Includes labeled sections for highlighting key features and software benefits. Fully customizable and compatible with PowerPoint, Keynote, and Google Slides—perfect for virtual classrooms, workshops, or academic tech presentations.


21 diapositivas
Stonelight Qualitative Research Findings Presentation
Present your research findings with clarity and impact using this sleek and modern presentation template. Designed for professionals and researchers, it guides you through all key aspects of your project, from introduction and background to detailed literature reviews, methodology, and data collection processes. Showcase your insights with sections for data analysis, key findings, and results interpretation, ensuring your audience stays engaged. This template also includes areas for recommendations, implications, and future research opportunities, making it ideal for academic, business, or industry presentations. Fully customizable and compatible with PowerPoint, Google Slides, and Keynote, it adapts seamlessly to your branding and content needs. Communicate your findings effectively and make a lasting impression with this professional and polished design.


4 diapositivas
Sales Performance Heat Map Overview Presentation
Get a quick visual pulse on your data with the Sales Performance Heat Map Overview Presentation. Ideal for showing activity levels or trends across time, this slide uses a gradient color scale to help teams identify high and low performance instantly. Fully editable in Canva, PowerPoint, Keynote, and Google Slides—great for sales managers, team leads, and marketing analysts.


5 diapositivas
Collaboration Tools for Team Efficiency Presentation
Visualize teamwork like never before with the Collaboration Tools for Team Efficiency Presentation. Featuring a puzzle-style layout, this slide highlights four interconnected ideas or steps—perfect for team workflows, project milestones, or tool comparisons. Easy to customize in Canva, PowerPoint, or Google Slides.


5 diapositivas
Hospital Operations and Services Overview Presentation
Deliver a clear, structured view of healthcare operations with this stethoscope-themed presentation slide. Ideal for medical service breakdowns, hospital department overviews, or care process explanations. Fully customizable in PowerPoint, Keynote, and Google Slides, this layout supports healthcare professionals, administrators, and educators aiming to present medical services with precision and professionalism.


7 diapositivas
Time Management Goal Infographic
Time management is the process of organizing and planning how to divide your time between specific activities effectively and efficiently to achieve desired goals or outcomes. This infographic template is designed to empower you in mastering time, optimizing productivity, and seizing the day. This infographic provides a visually striking way to illustrate time management strategies, tips, and hacks for anyone looking to make the most of their time. Fully customizable and compatible with Powerpoint, Keynote, and Google Slides. This showcases time-bound tasks, emphasizing the importance of setting deadlines and managing tasks within periods.


6 diapositivas
Preventative Healthcare and Fitness Presentation
Promote wellness and proactive care with this colorful and clean slide layout. Featuring a clipboard-style design with stacked icons and aligned descriptions from A to E, it’s perfect for presenting fitness tips, health programs, or preventative strategies. The vibrant sections help guide viewers through key points at a glance. Fully editable and compatible with PowerPoint, Keynote, and Google Slides.


7 diapositivas
Ecology Restoration Infographic
Dive into the world of eco-conscious solutions with our ecology restoration infographic. Adorned in soothing shades of white and fresh green, this template captures the essence of nature's rejuvenation. Compatible with Powerpoint, Keynote, and Google Slides, it boasts meticulously crafted graphics, intuitive icons, and user-friendly image placeholders, all tailored to emphasize the urgency and methods of restoring our planet's ecological balance. Ideal for environmentalists, educators, NGOs, or anyone aiming to spread awareness about our planet's well-being.


6 diapositivas
Customer Needs and Segmentation Profile Presentation
Pinpoint what truly drives your audience with the Customer Needs and Segmentation Profile Presentation. This template helps you clearly map customer motivations, preferences, and pain points through segmented icons and visuals. Ideal for marketers and business analysts. Fully editable in Canva, PowerPoint, or Google Slides for easy customization.


4 diapositivas
Team Collaboration Puzzle Slide Presentation
Showcase team synergy with the Team Collaboration Puzzle Slide Presentation. This engaging design uses interlocking human figures to symbolize unity and contribution, making it perfect for presenting roles, responsibilities, or collaborative workflows. Fully editable in Canva, PowerPoint, or Google Slides—ideal for team introductions, project planning, or partnership overviews.


25 diapositivas
Jasper Rebranding Project Plan Presentation
Elevate your brand transformation with this sleek rebranding presentation template! It covers everything from mission and values to market analysis and brand positioning. Perfect for showcasing your brand guidelines and touchpoints. Fully customizable, and compatible with PowerPoint, Keynote, and Google Slides, making your rebranding process seamless and professional.


7 diapositivas
South America Infographic Presentation Template
South America is the fourth largest continent in size and the fifth largest in population. It is located primarily in the southern hemisphere, situated between the Pacific and Atlantic Oceans, with mostly colonies on other continents. South America is a continent entirely in the Western Hemisphere, mostly in the Southern Hemisphere. This South America map template is a great base for lesson plans, reference guides and much more. This map template is fully editable and can be easily customized to suit your presentation needs, add multiple layers of text, pictures and various other features.


23 diapositivas
Artarix Business Development Proposal Presentation
Streamline your growth strategy with this modern and professional presentation template. Covering key elements such as collaboration opportunities, performance metrics, process improvement, and resource allocation, it provides a structured approach to business expansion. Fully customizable and compatible with PowerPoint, Keynote, and Google Slides for seamless editing.


7 diapositivas
Side-by-Side Feature Comparison Presentation
Clearly showcase differences across multiple categories with this Side-by-Side Feature Comparison Presentation. Designed with a visual grid system and bold colors, it's perfect for highlighting product or service variations at a glance. Fully customizable in PowerPoint, Keynote, and Google Slides.
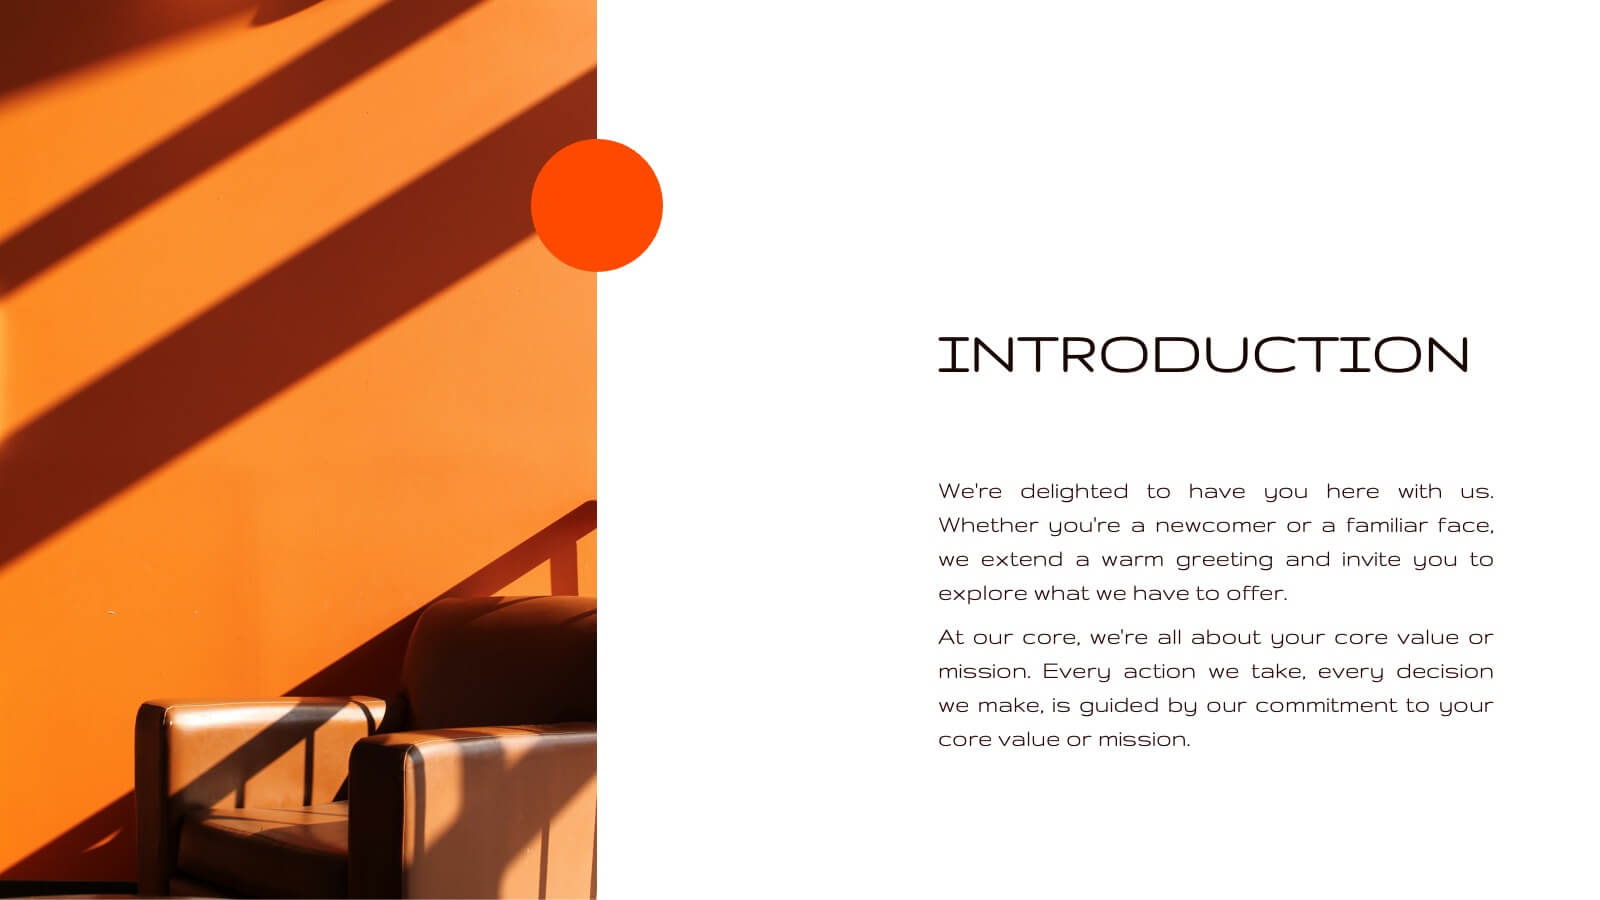
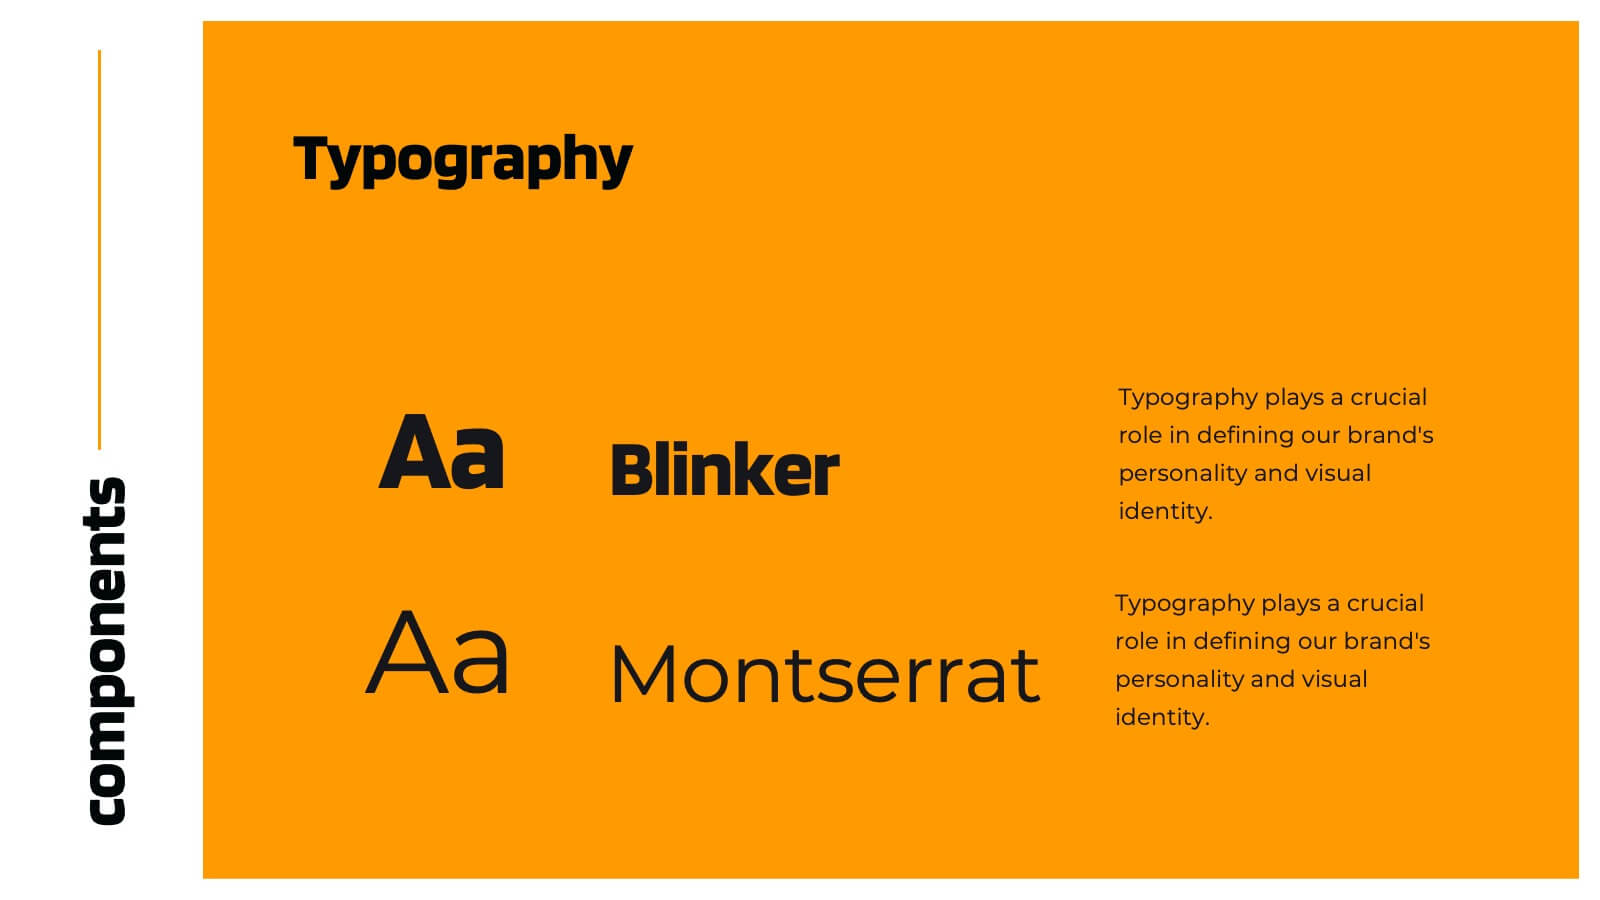
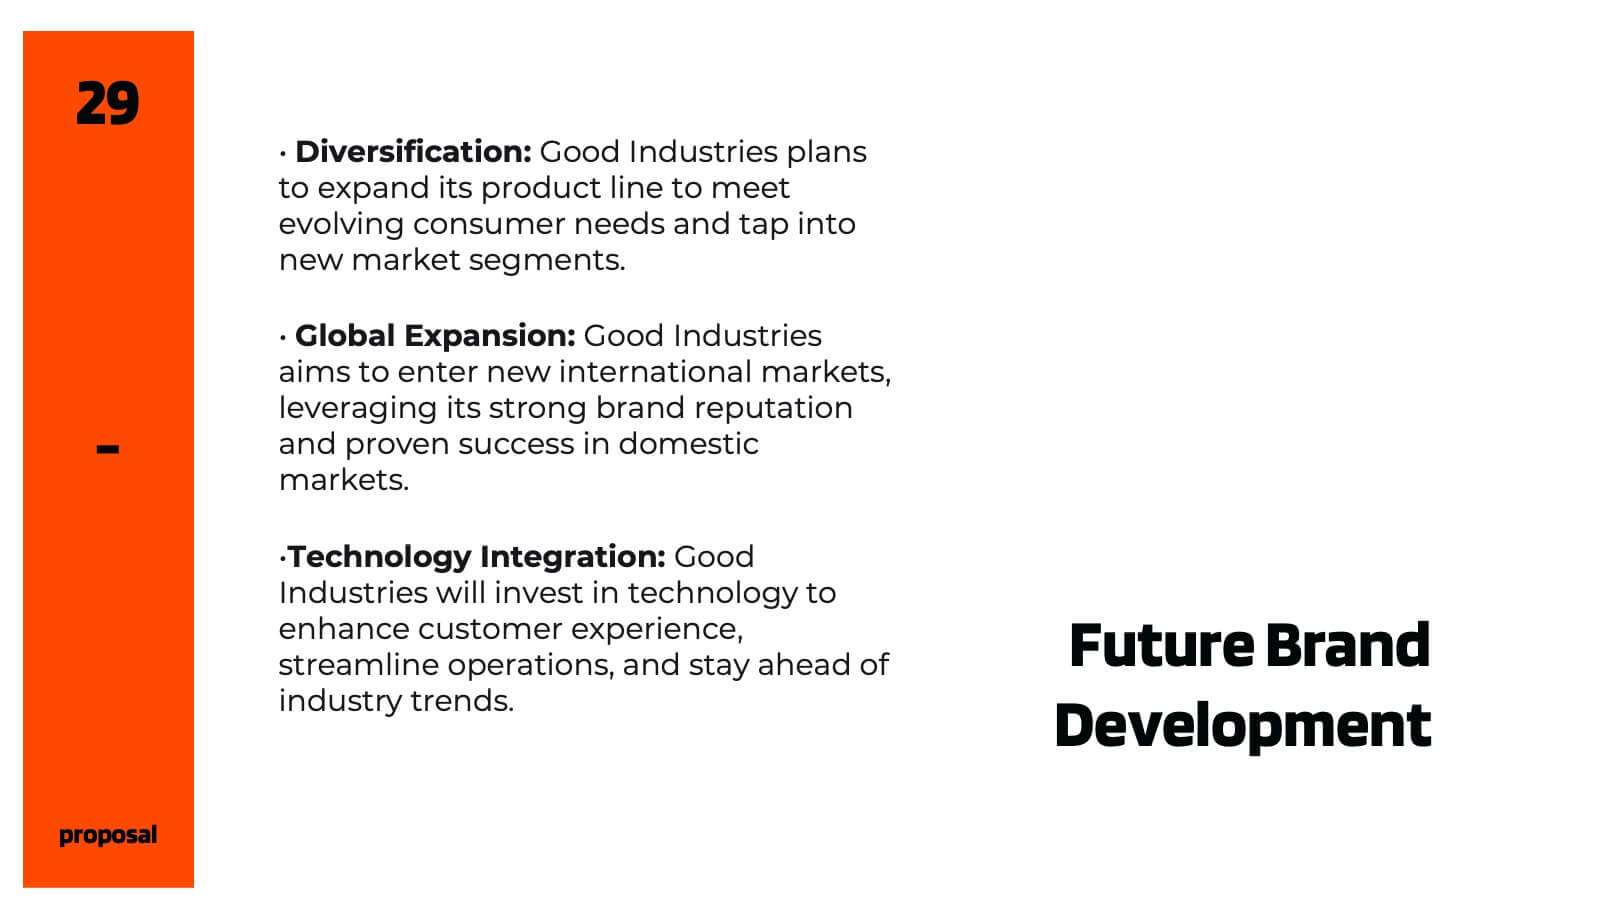
22 diapositivas
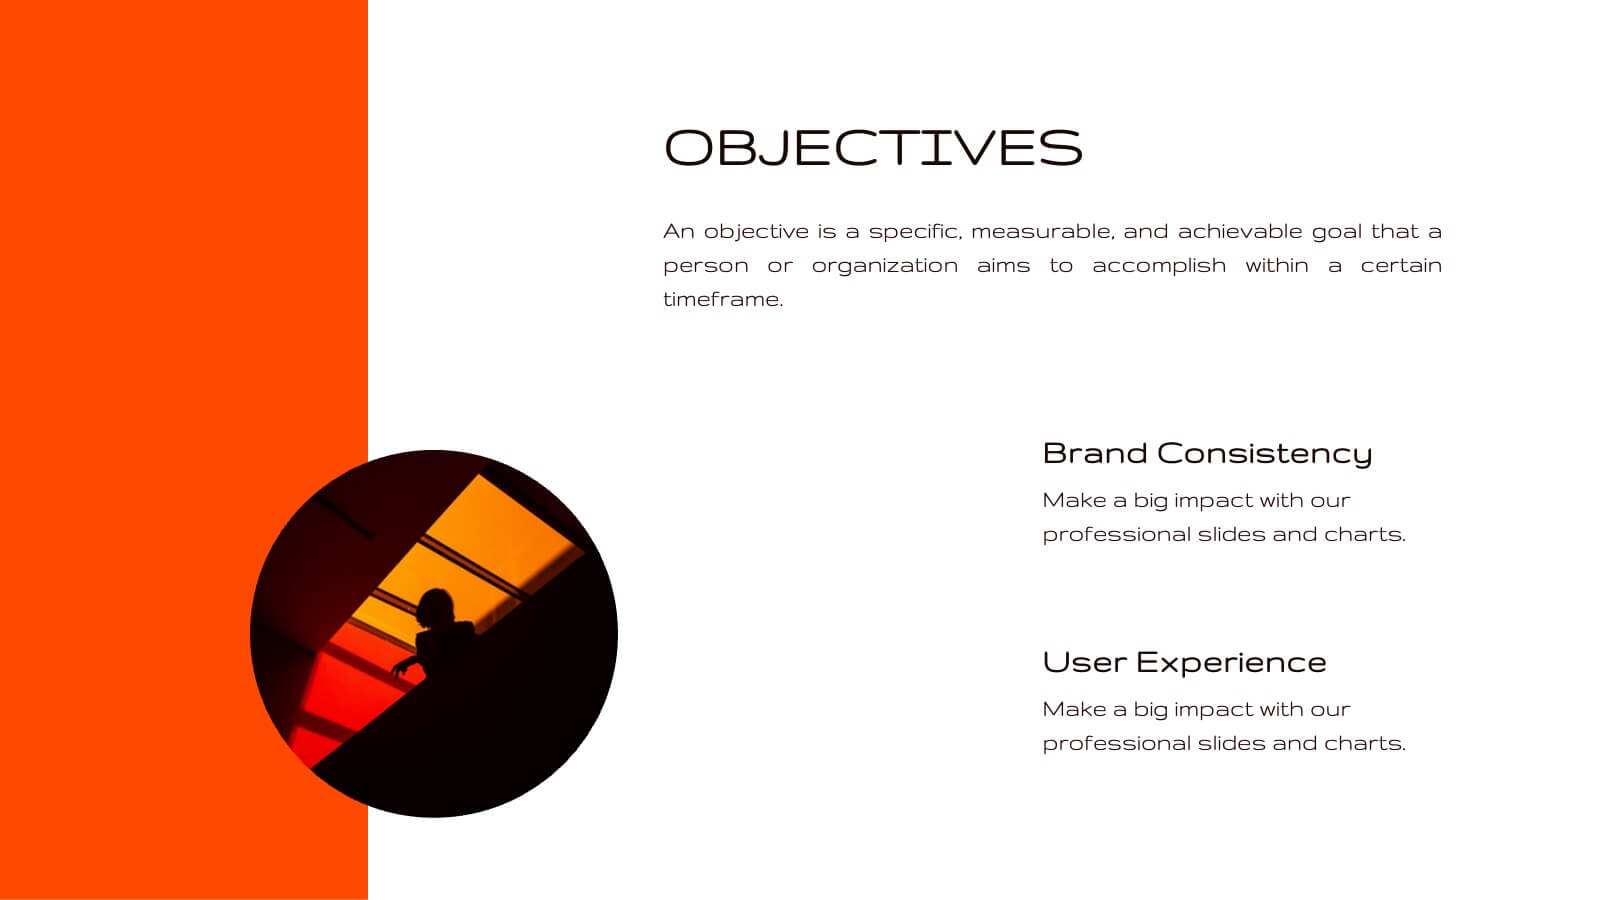
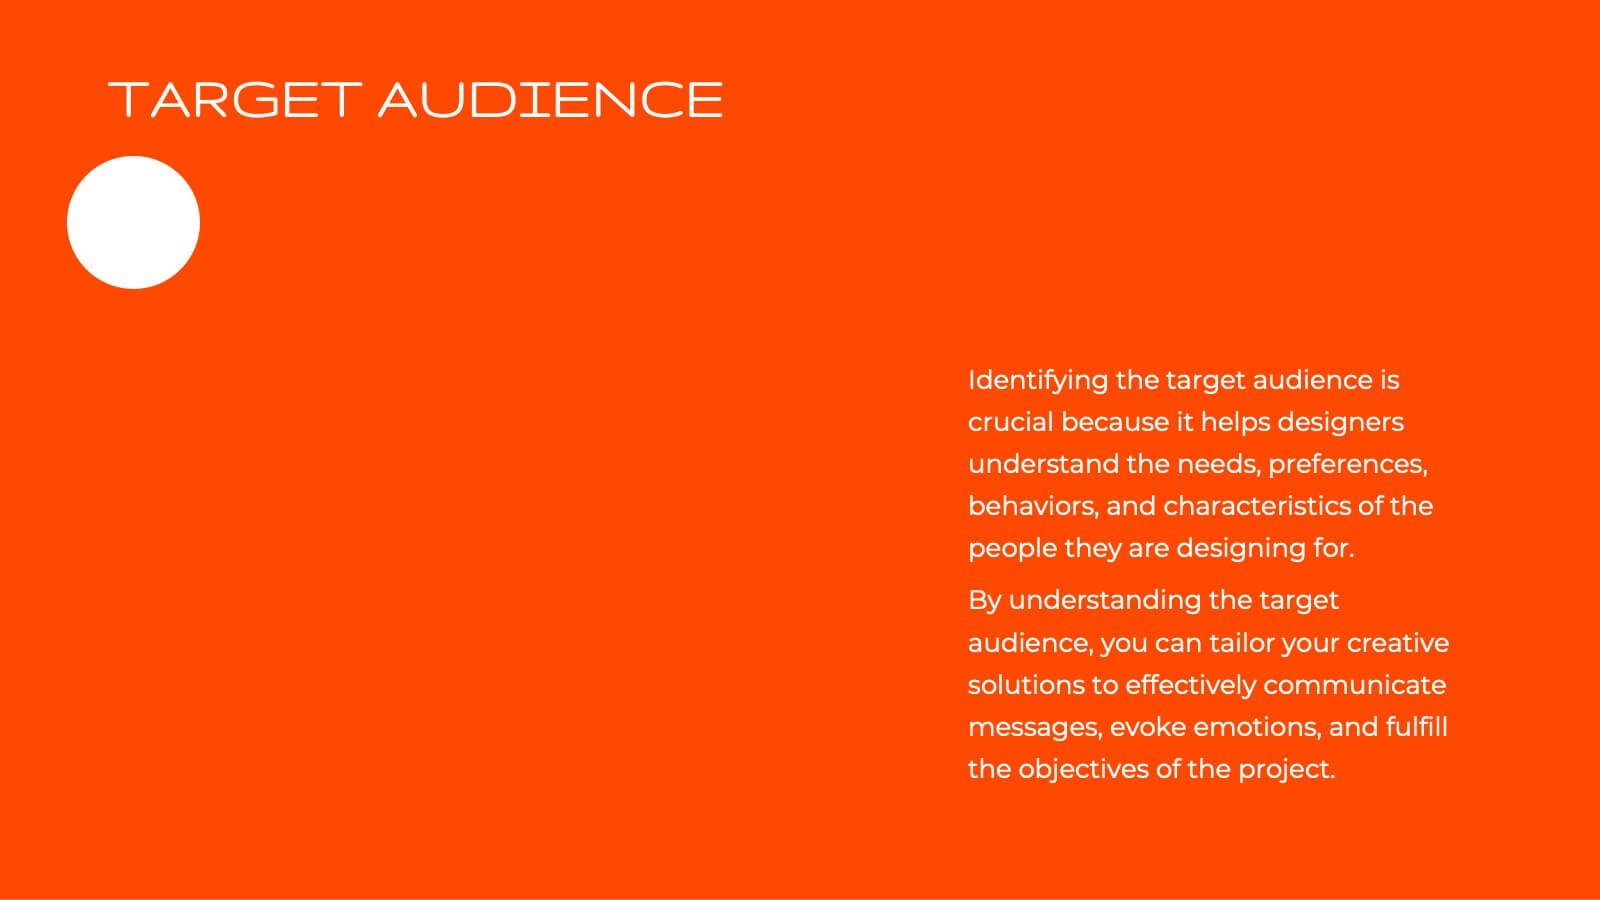
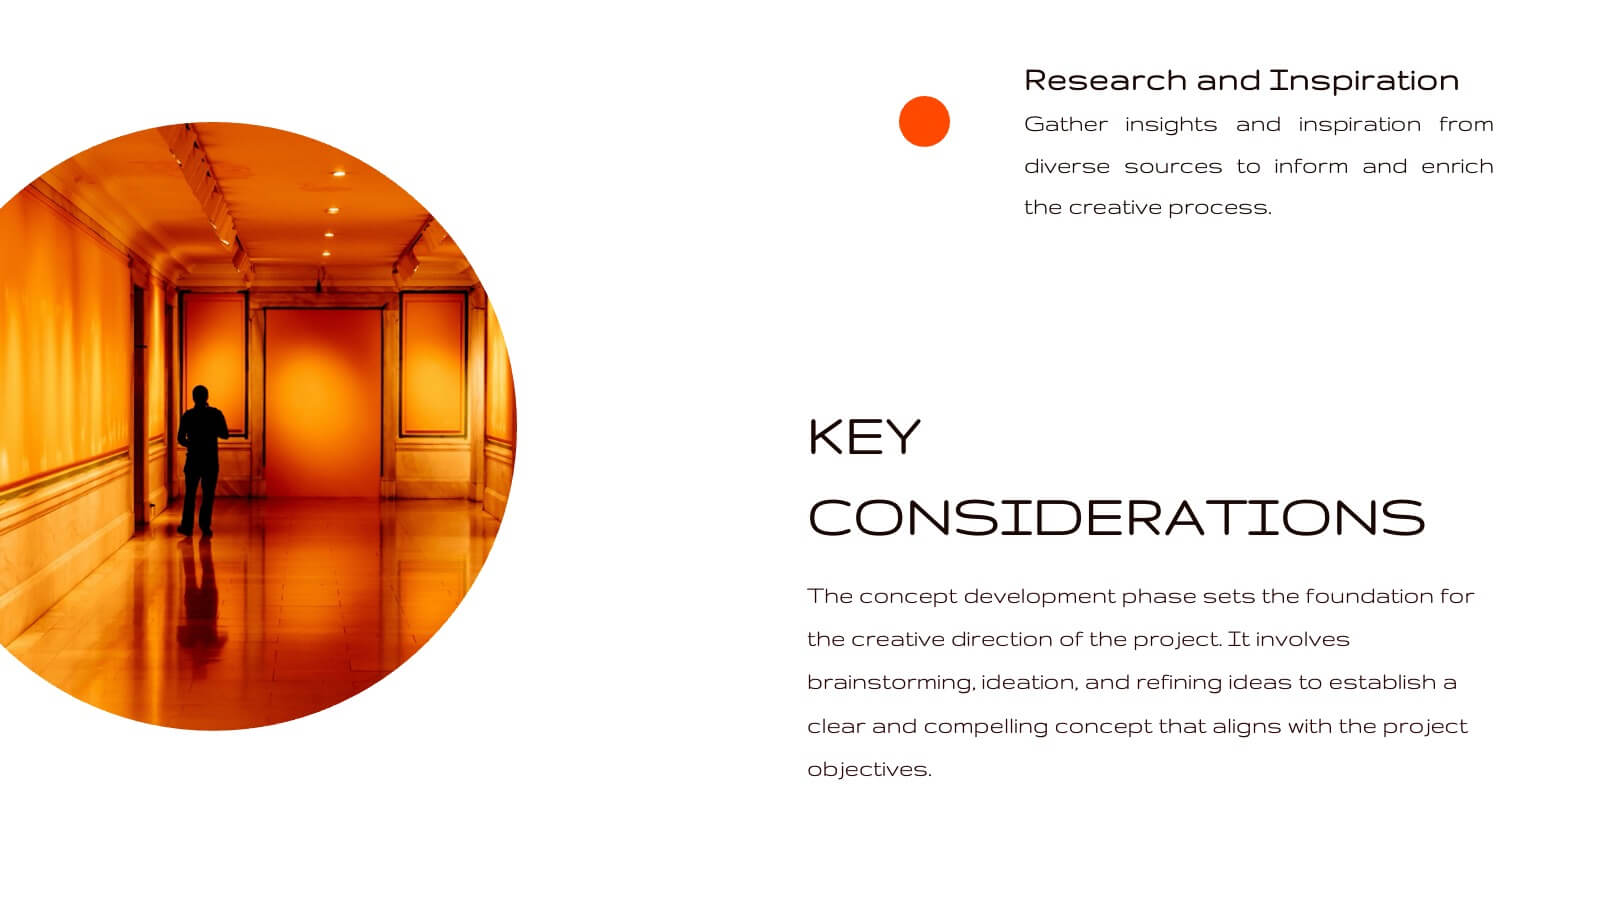
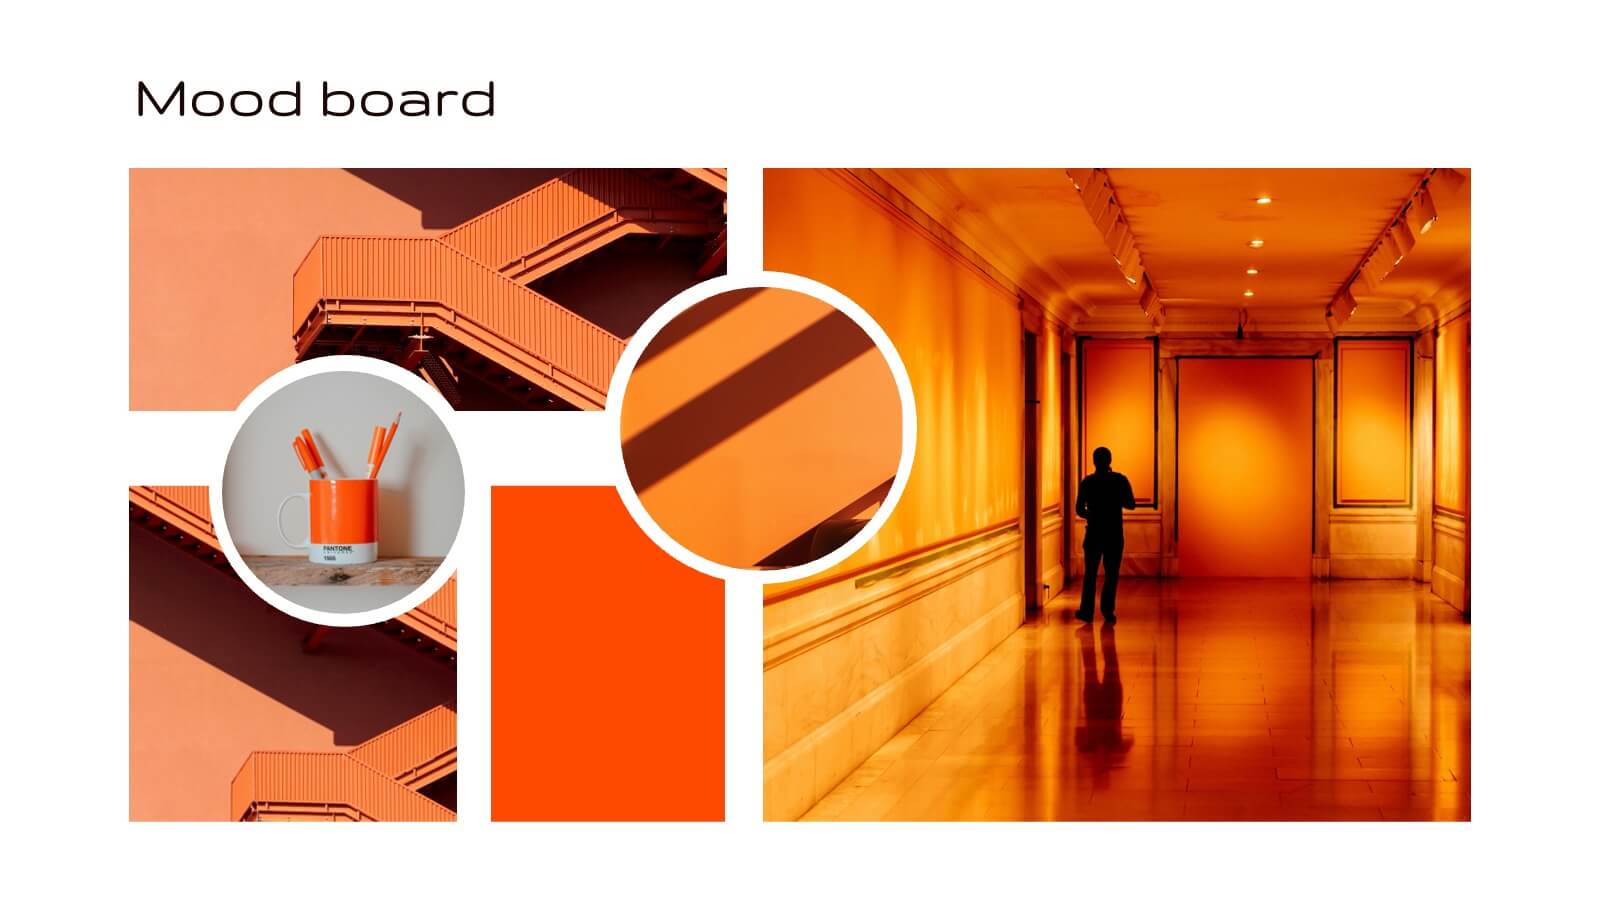
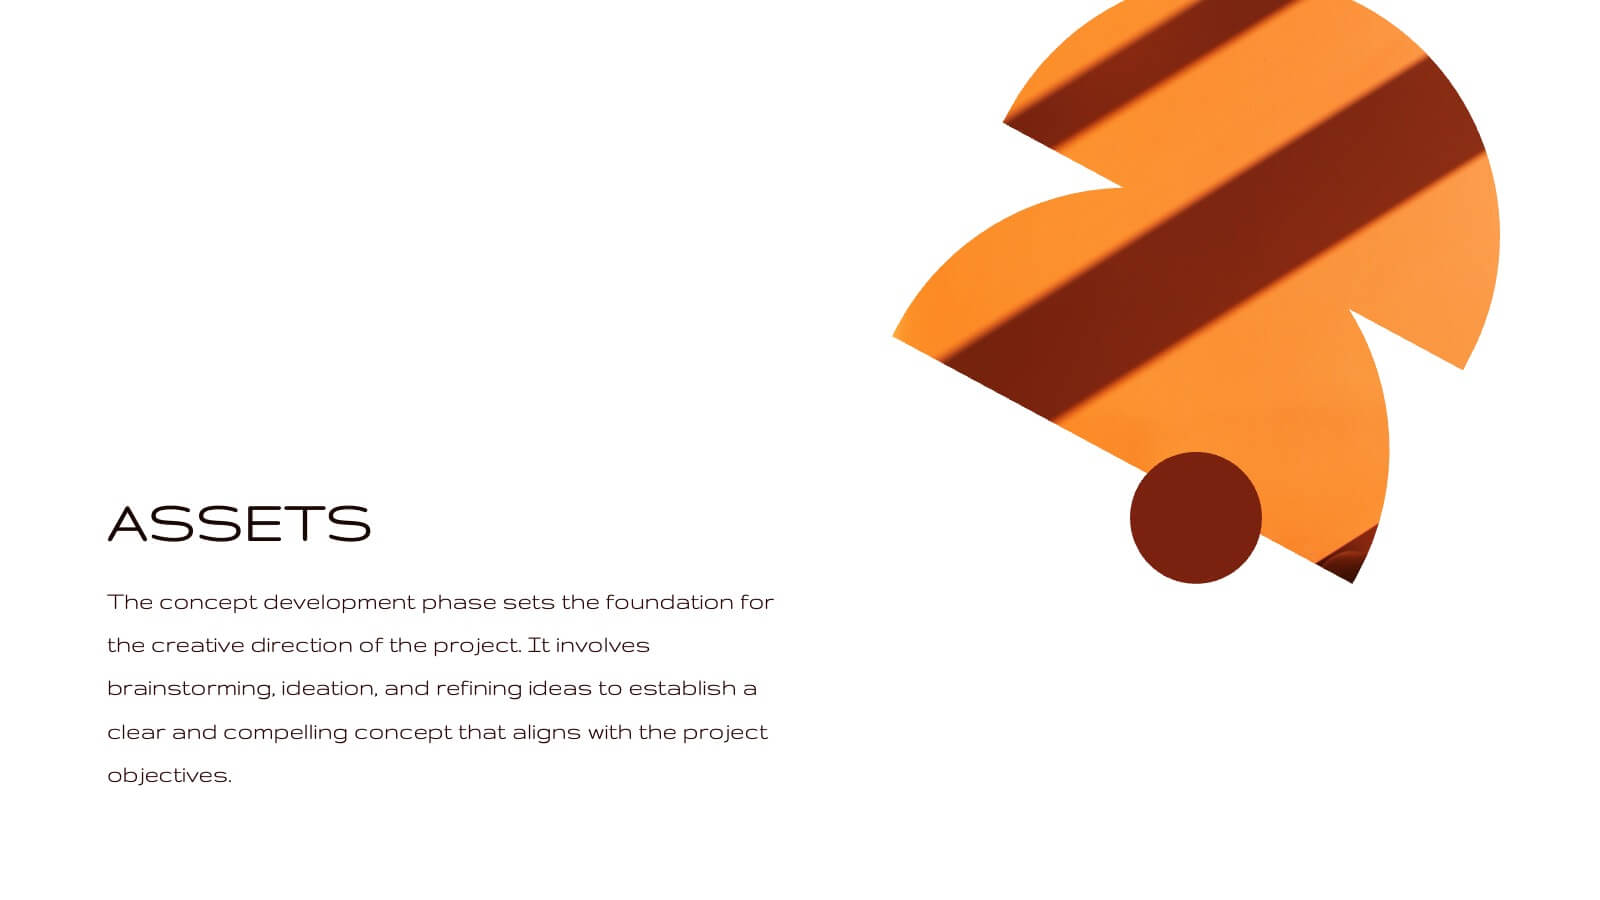
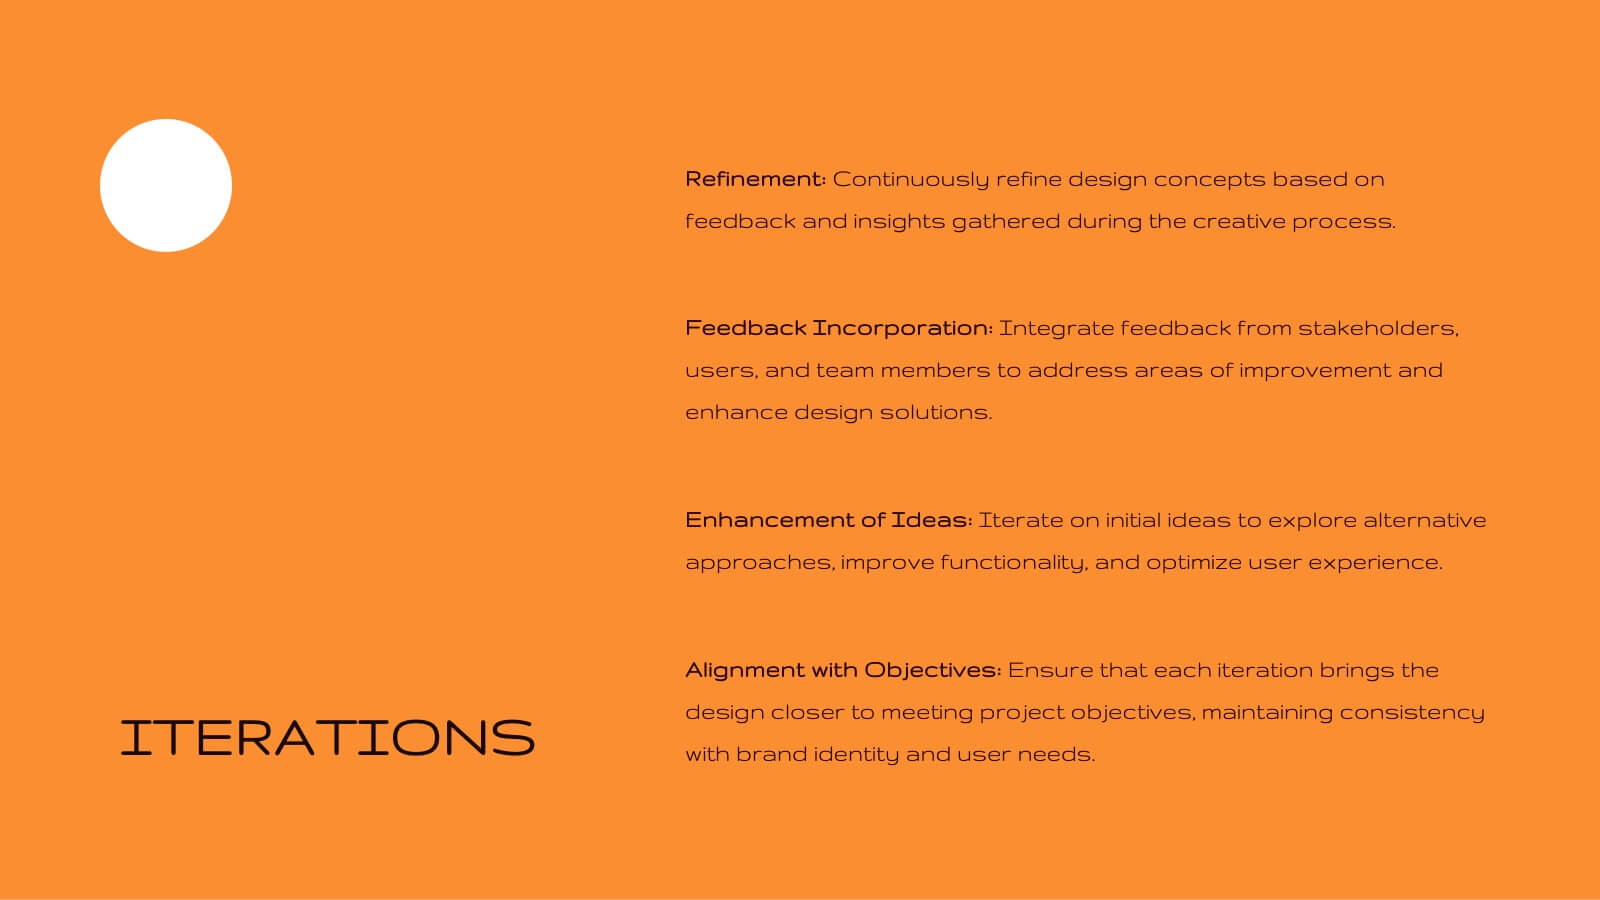
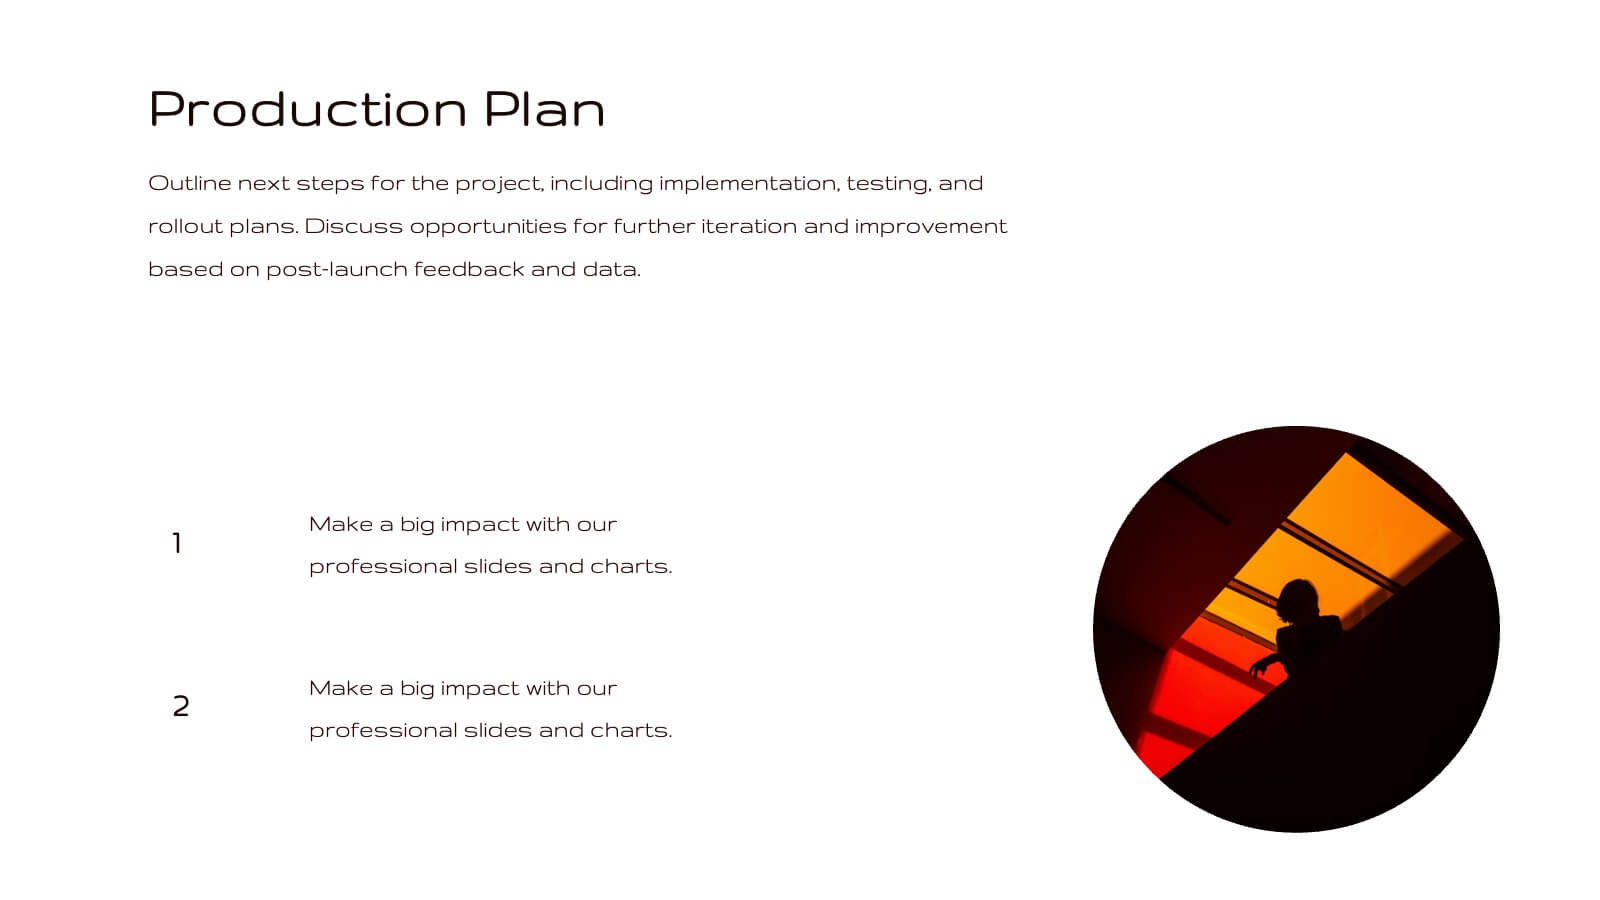
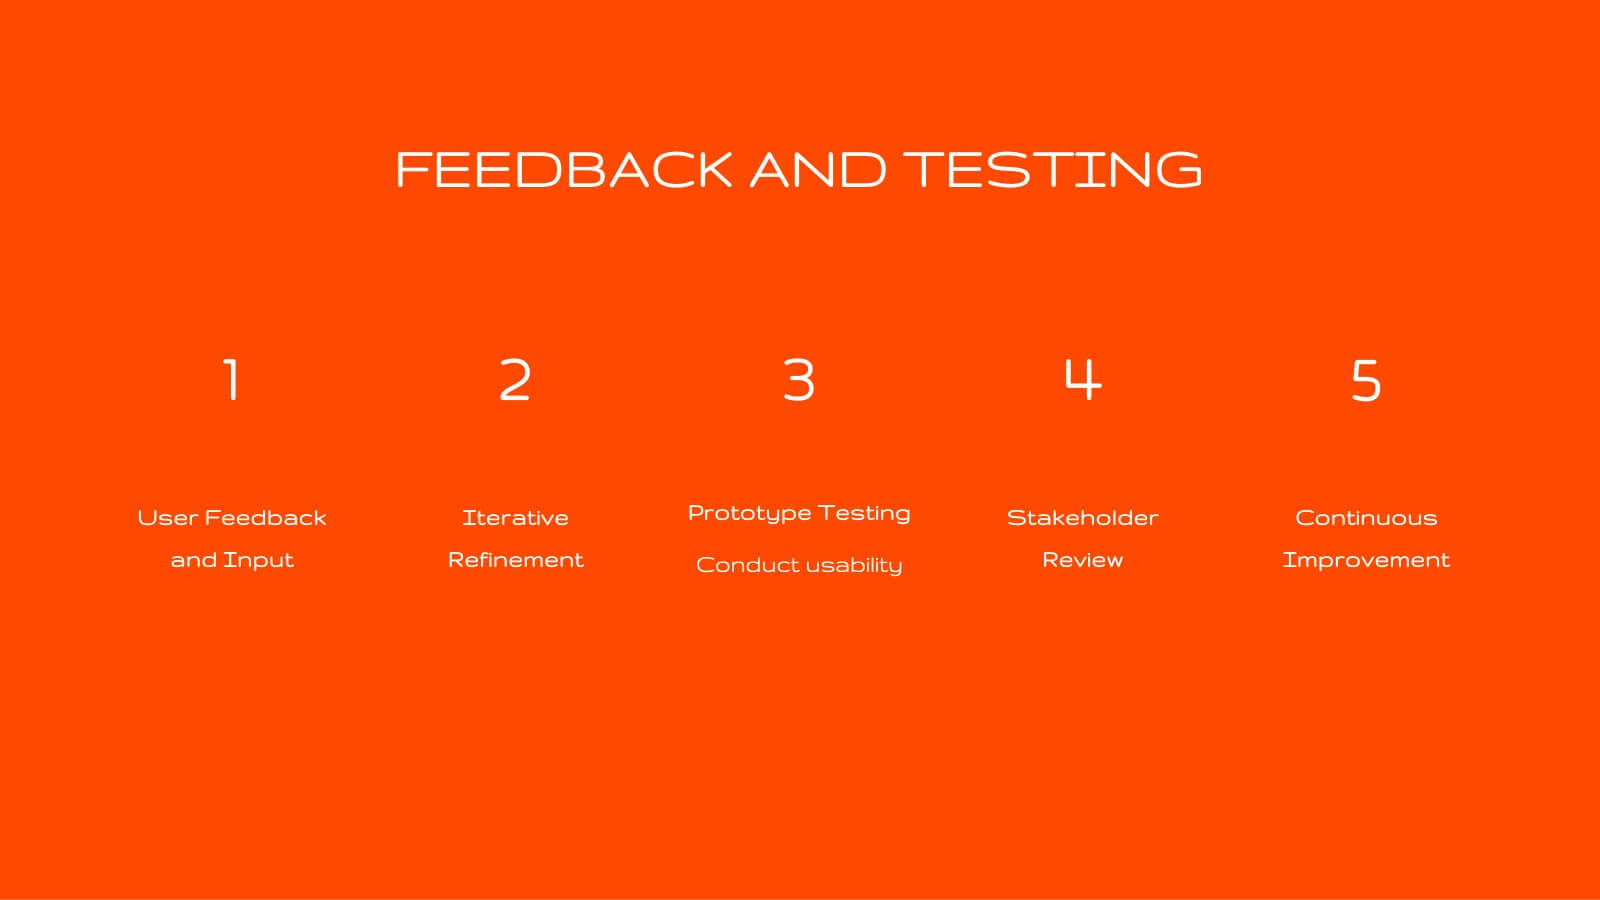
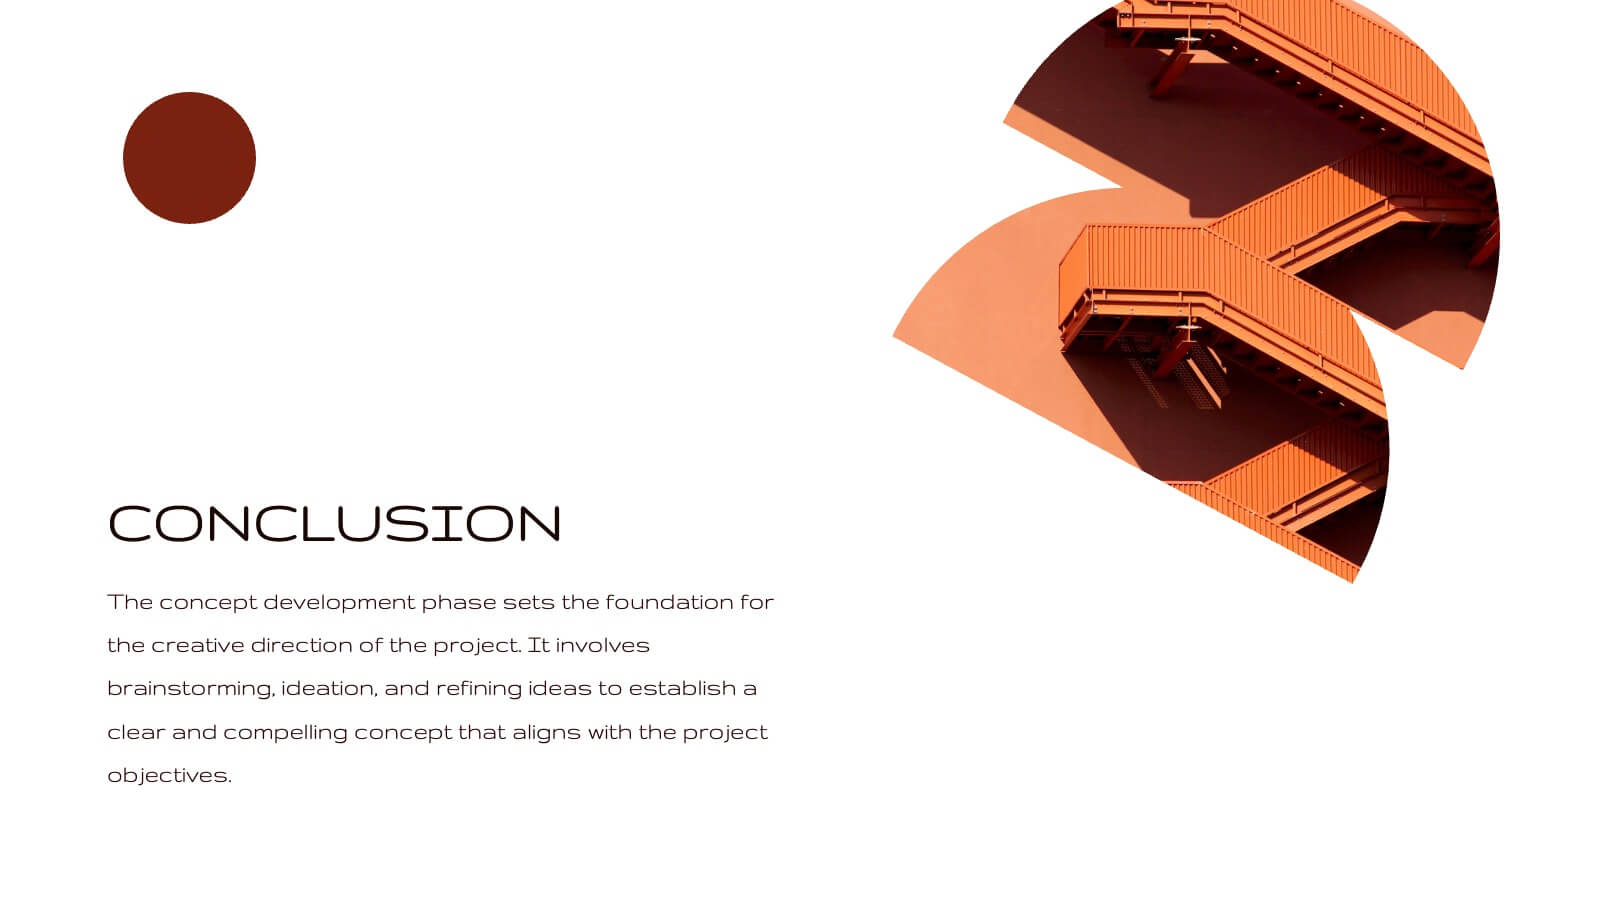
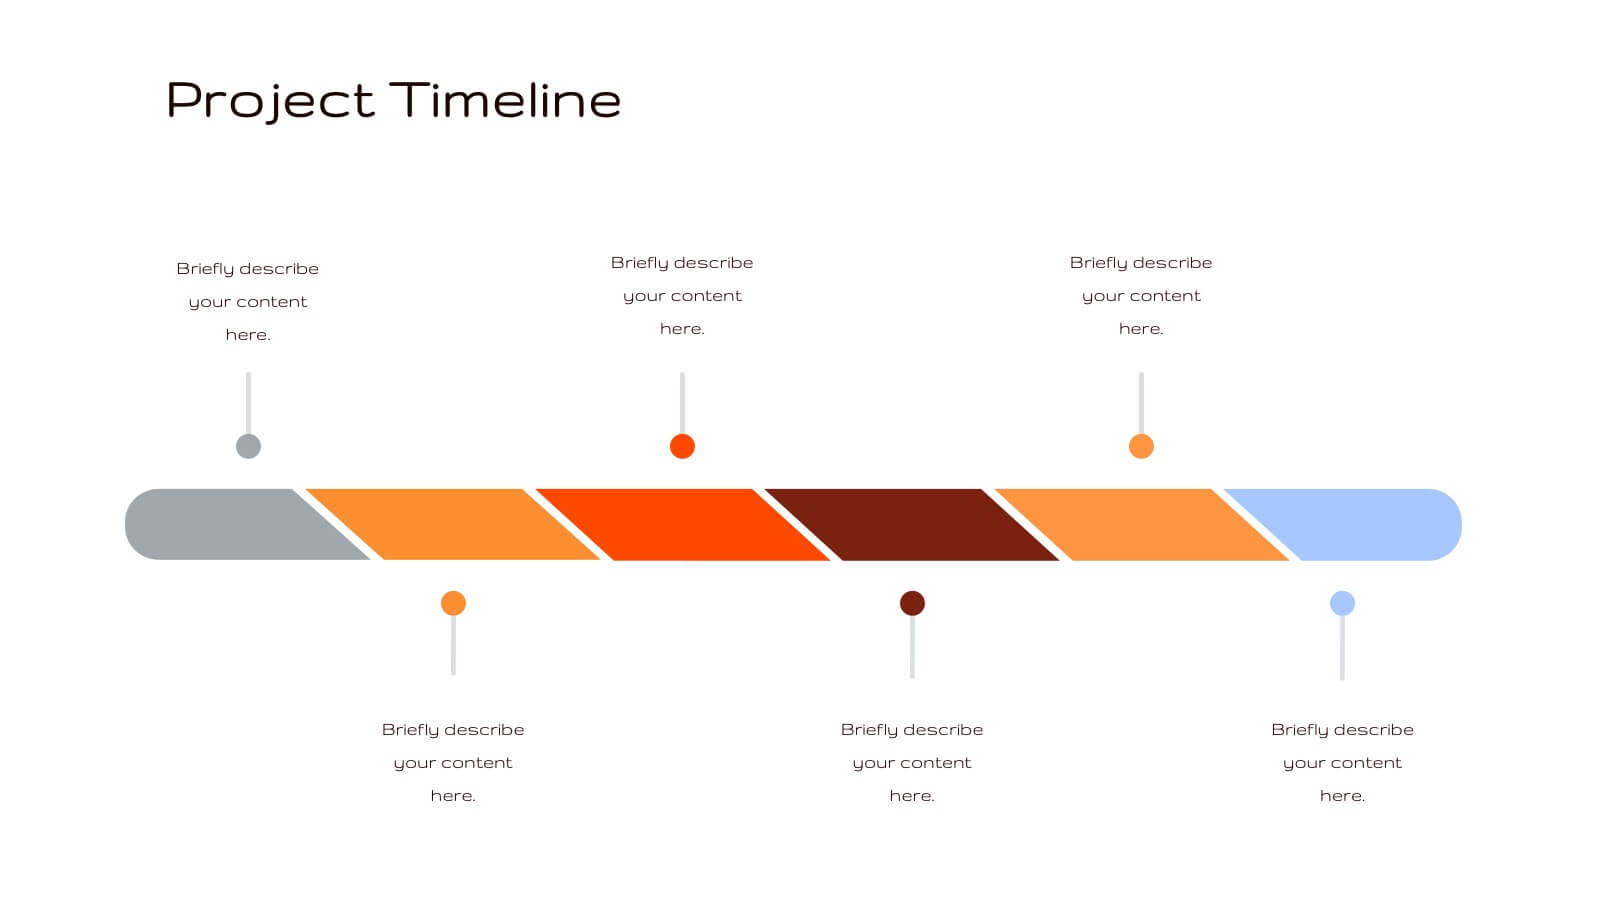
Radiance Creative Design Report Presentation
Bring your design ideas to life with this vibrant, engaging presentation template. Ideal for showcasing creative processes, concept development, and project timelines, it features a striking color palette and clean layout. This template is designed to captivate your audience and clearly communicate your design vision. Compatible with PowerPoint, Keynote, and Google Slides, it’s perfect for any platform.