


Características


¿Tienes alguna pregunta?
Recomendar


5 diapositivas
Strengths, Weaknesses, Opportunities & Threats Presentation
Visualize your SWOT analysis with clarity using the Strengths, Weaknesses, Opportunities & Threats Presentation. This editable puzzle-style slide makes it easy to present key insights and strategic positioning in a visually engaging format. Compatible with PowerPoint, Canva, and Google Slides for seamless customization and professional business planning.


7 diapositivas
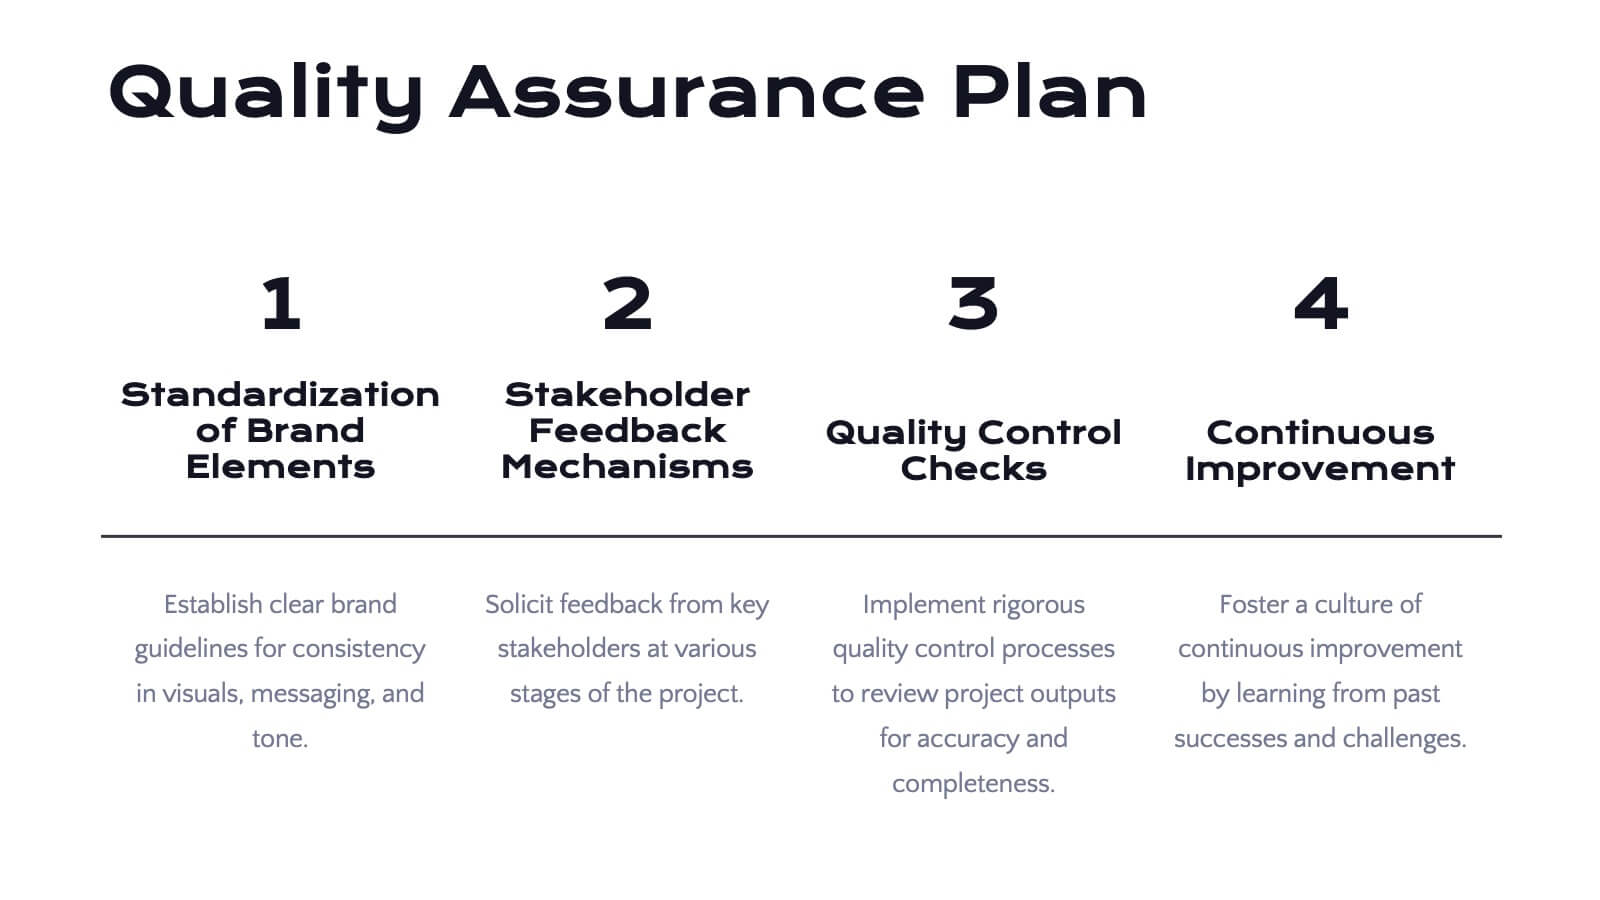
Standard Process Infographic
Streamline operations with clarity with our standard process infographic. This template is your ultimate tool for presenting complex processes in a clear, easy-to-understand manner. This infographic is designed to break down intricate procedures into visual, digestible segments. This includes a step-by-step diagram presenting each step clearly. Compatible with Powerpoint, Keynote, and Google Slides. Include a versatile color palette to choose from, matching your brand or adding visual interest. With this template you'll make even the most complicated processes understandable and actionable. Start streamlining your operations today!


4 diapositivas
Veterinary Practice Overview Presentation
Give your veterinary insights a professional touch with this clean, modern infographic layout. Designed to showcase workflows, patient care processes, and team structures, it helps present information clearly and visually. Fully customizable and compatible with PowerPoint, Keynote, and Google Slides for easy editing and seamless presentation design.
22 diapositivas
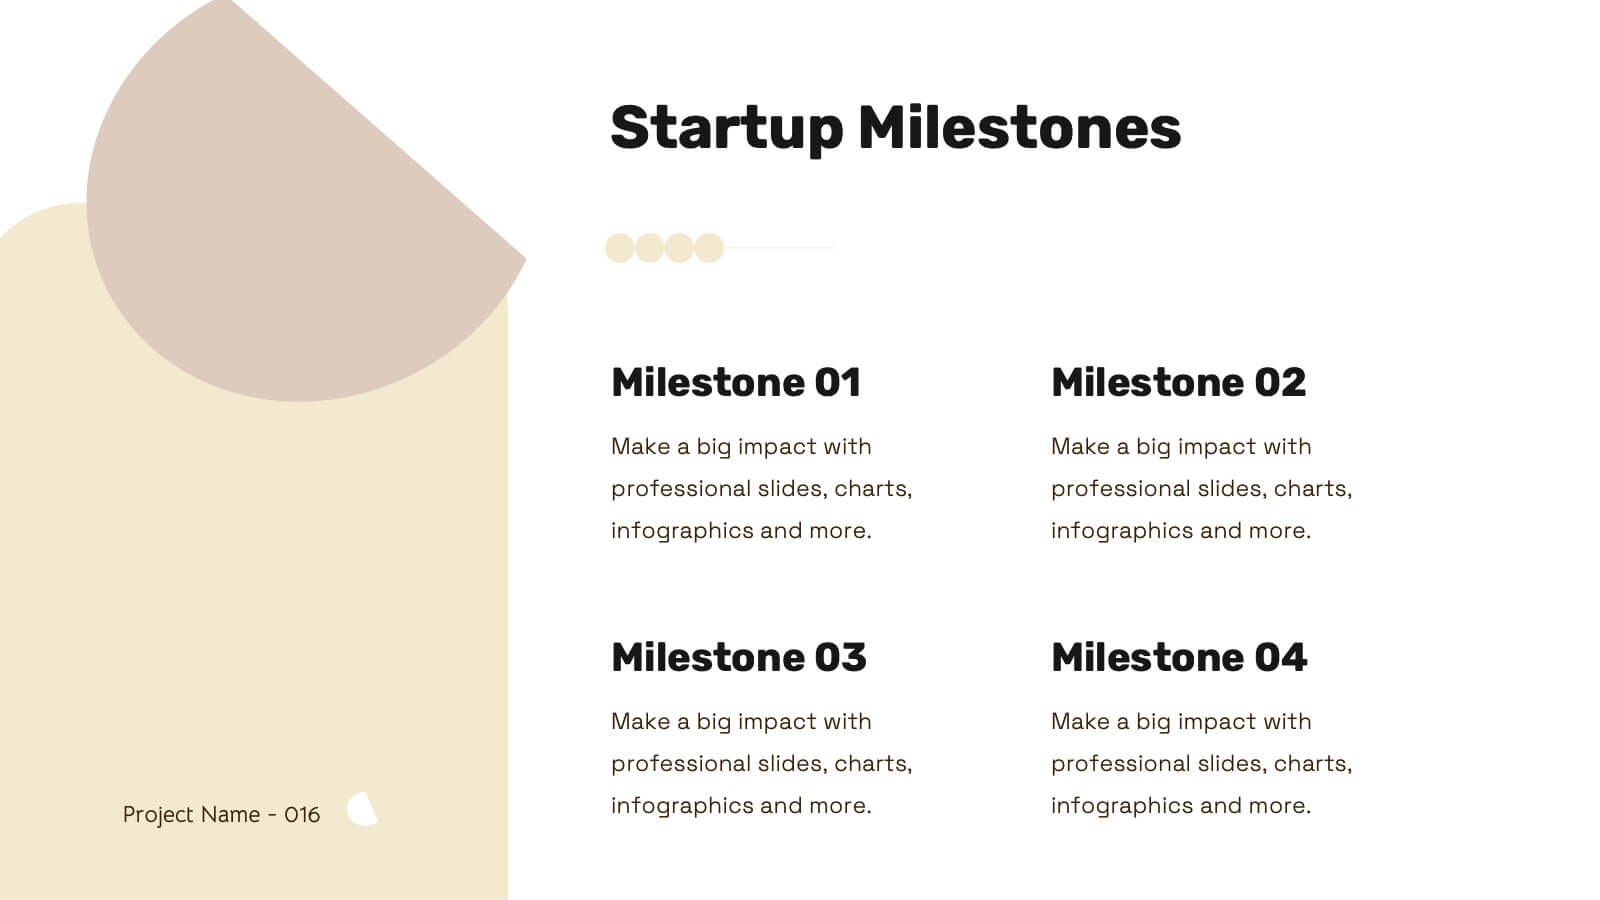
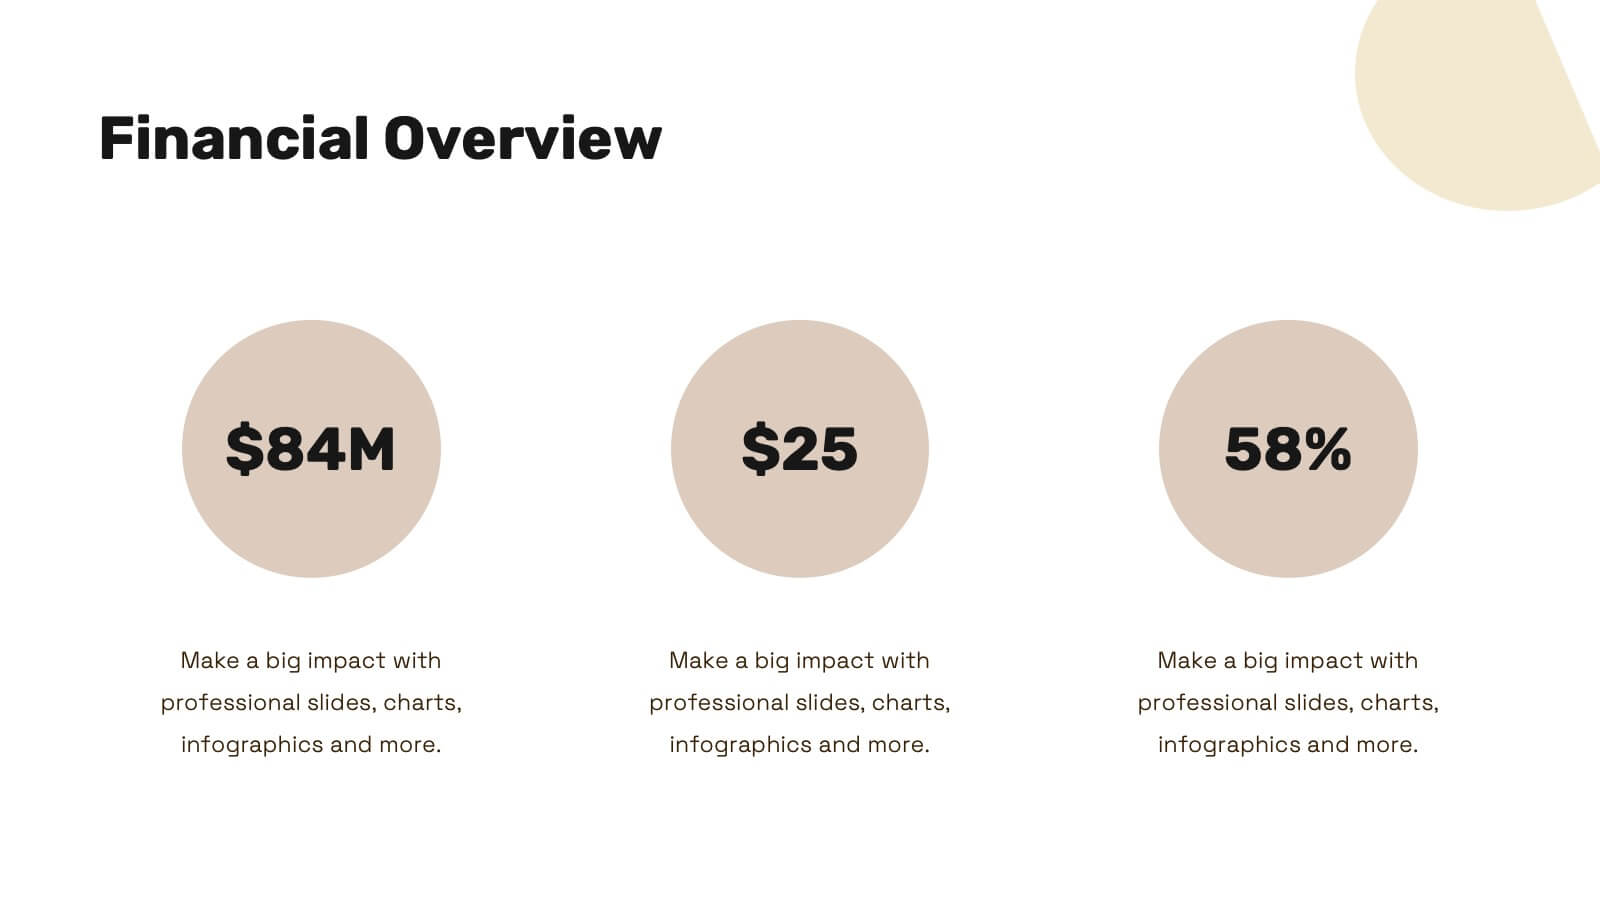
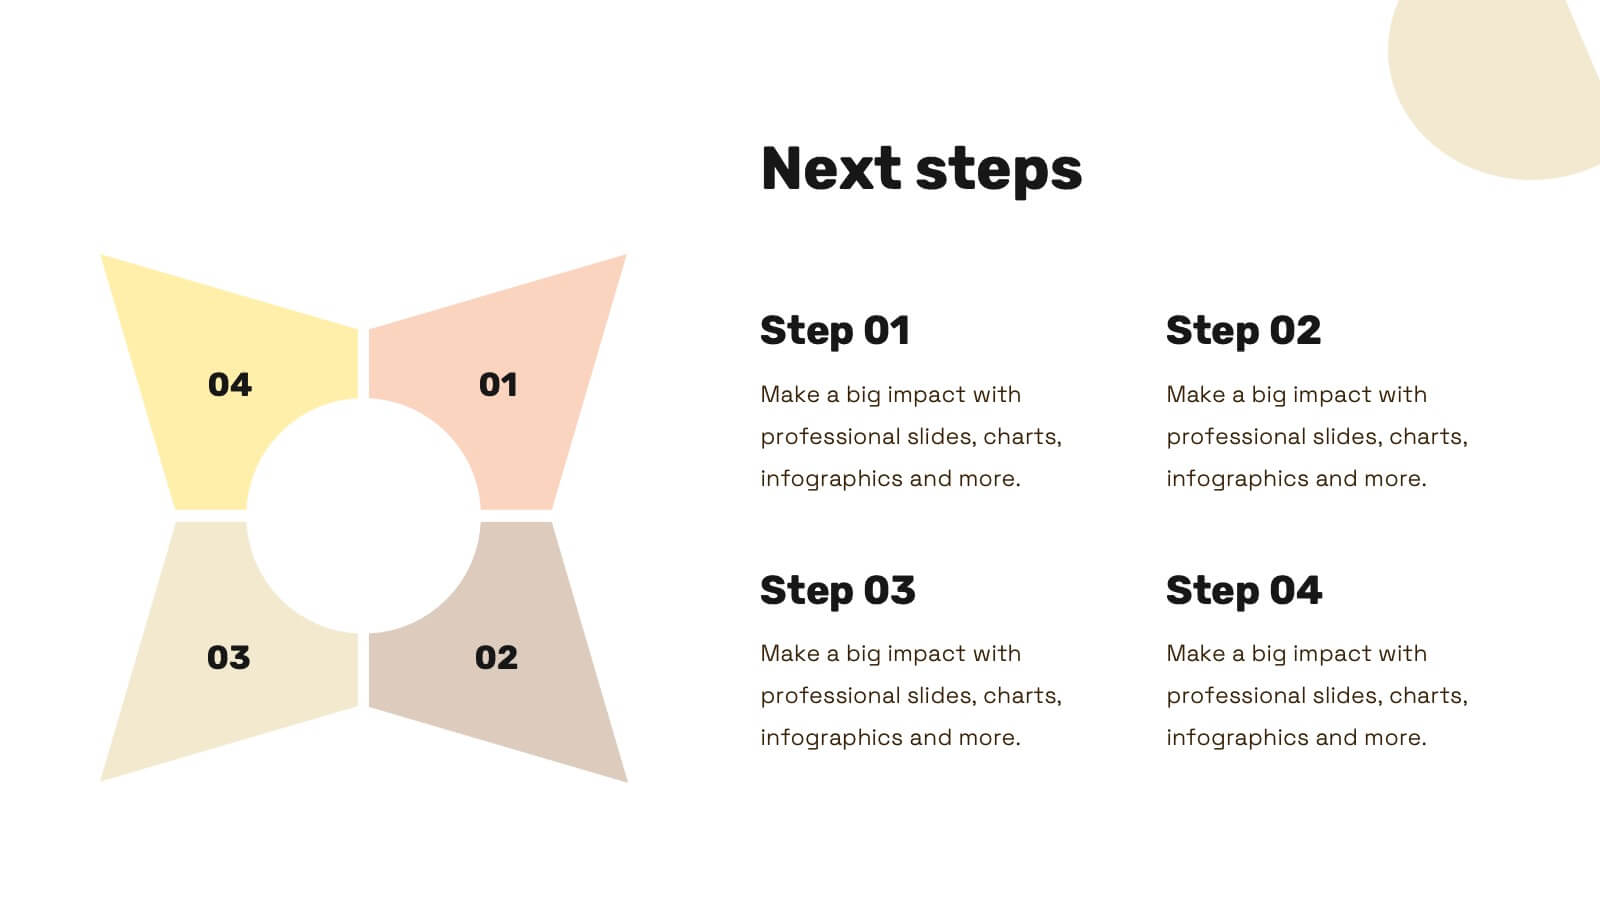
Nova Startup Funding Proposal Presentation
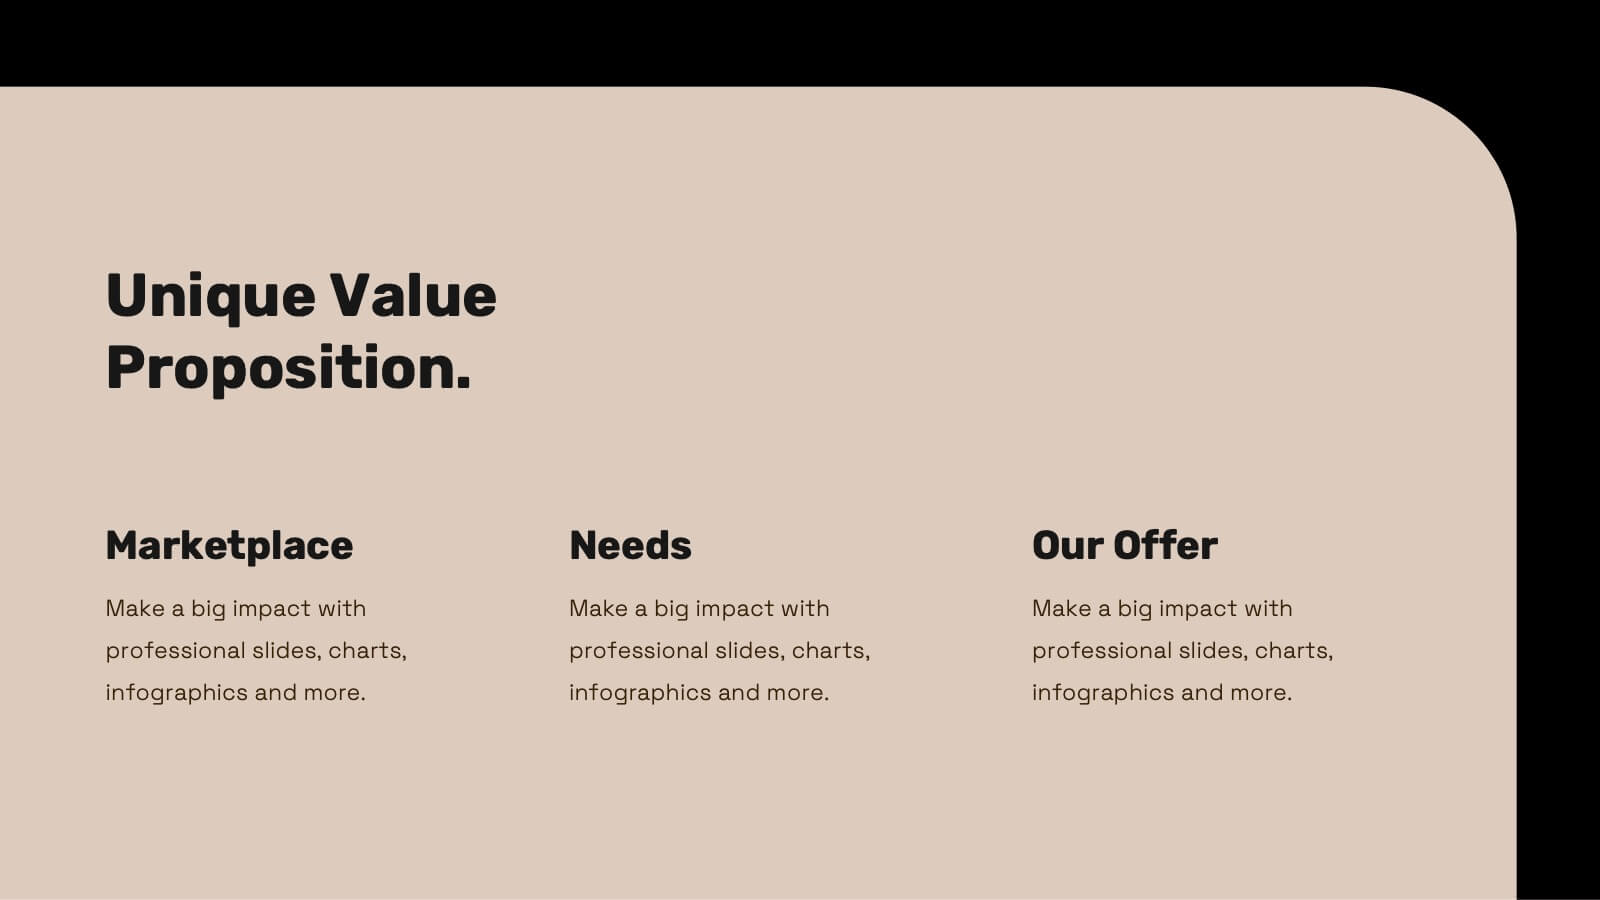
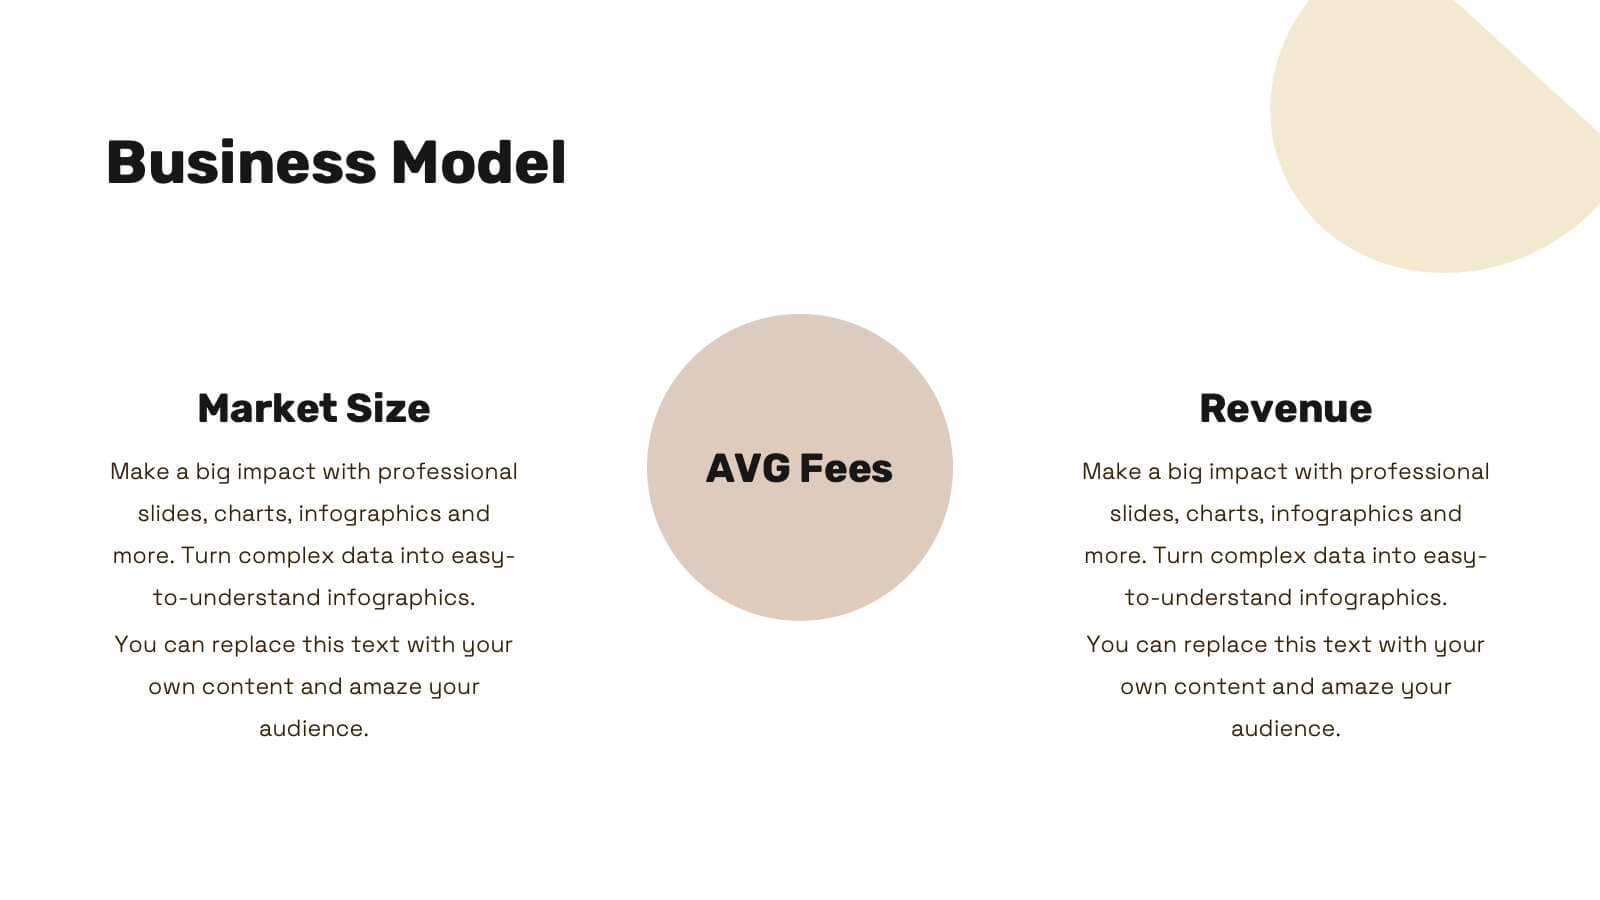
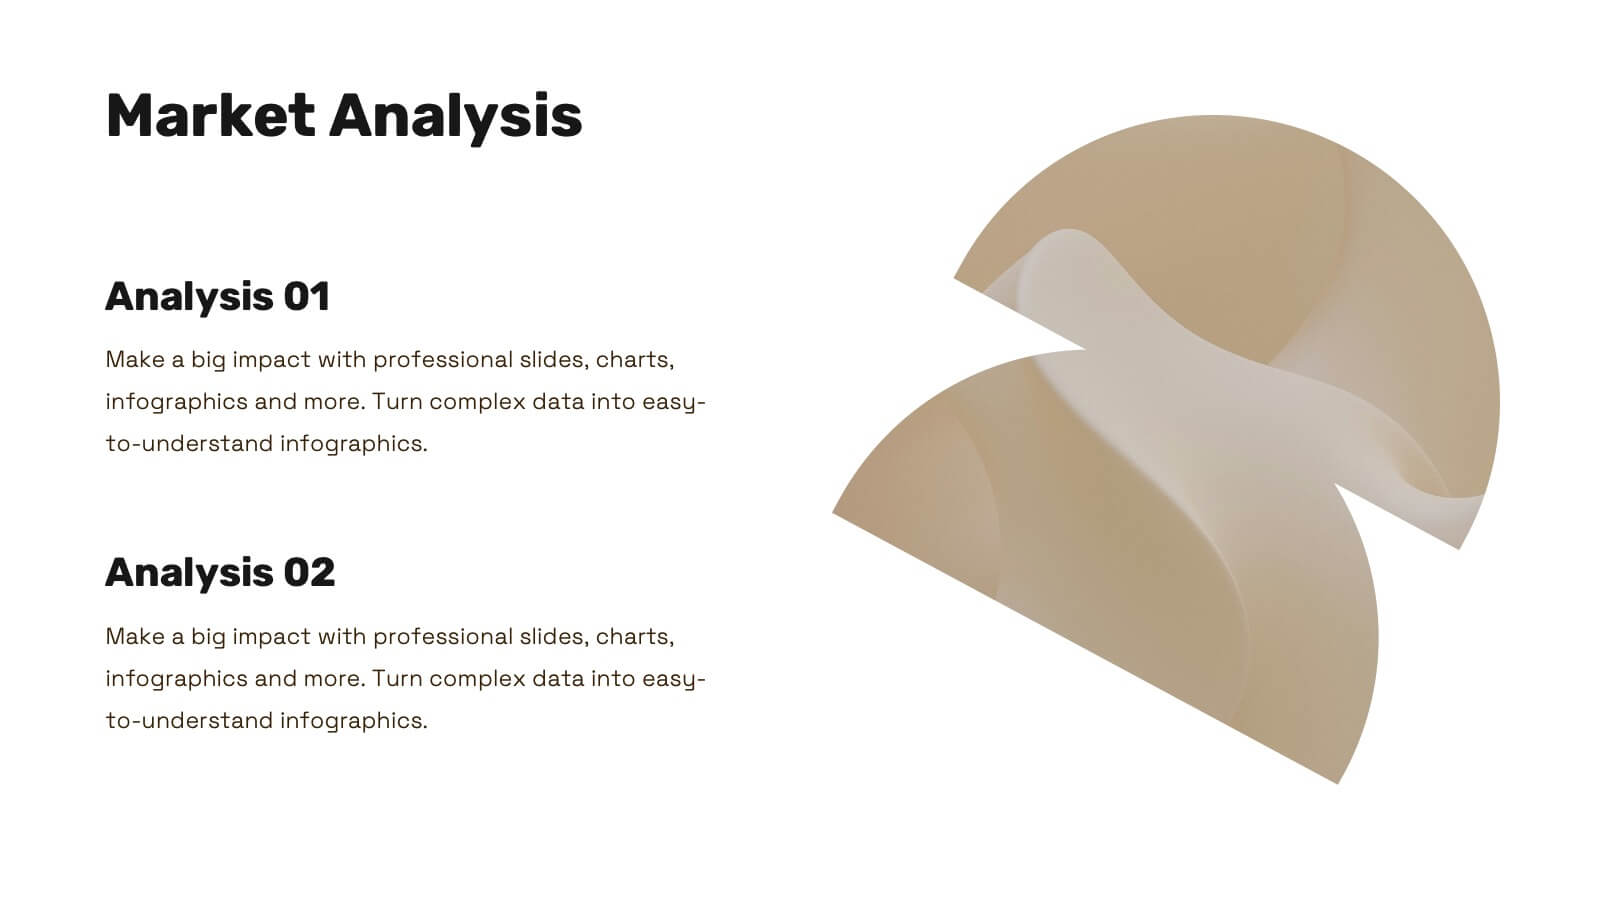
Craft an impressive startup funding proposal with this elegant template. It includes sections for mission, vision, market analysis, business model, and financial overview. Ideal for clear and professional presentations. Fully compatible with PowerPoint, Keynote, and Google Slides for easy customization.


6 diapositivas
Process Flow Charts Presentation
Bring your workflow to life with a clean, modern layout that transforms complex steps into a simple visual path. This presentation helps teams explain processes, percentages, and progress with clarity and ease, making it ideal for planning and optimization. Fully compatible with PowerPoint, Keynote, and Google Slides.


8 diapositivas
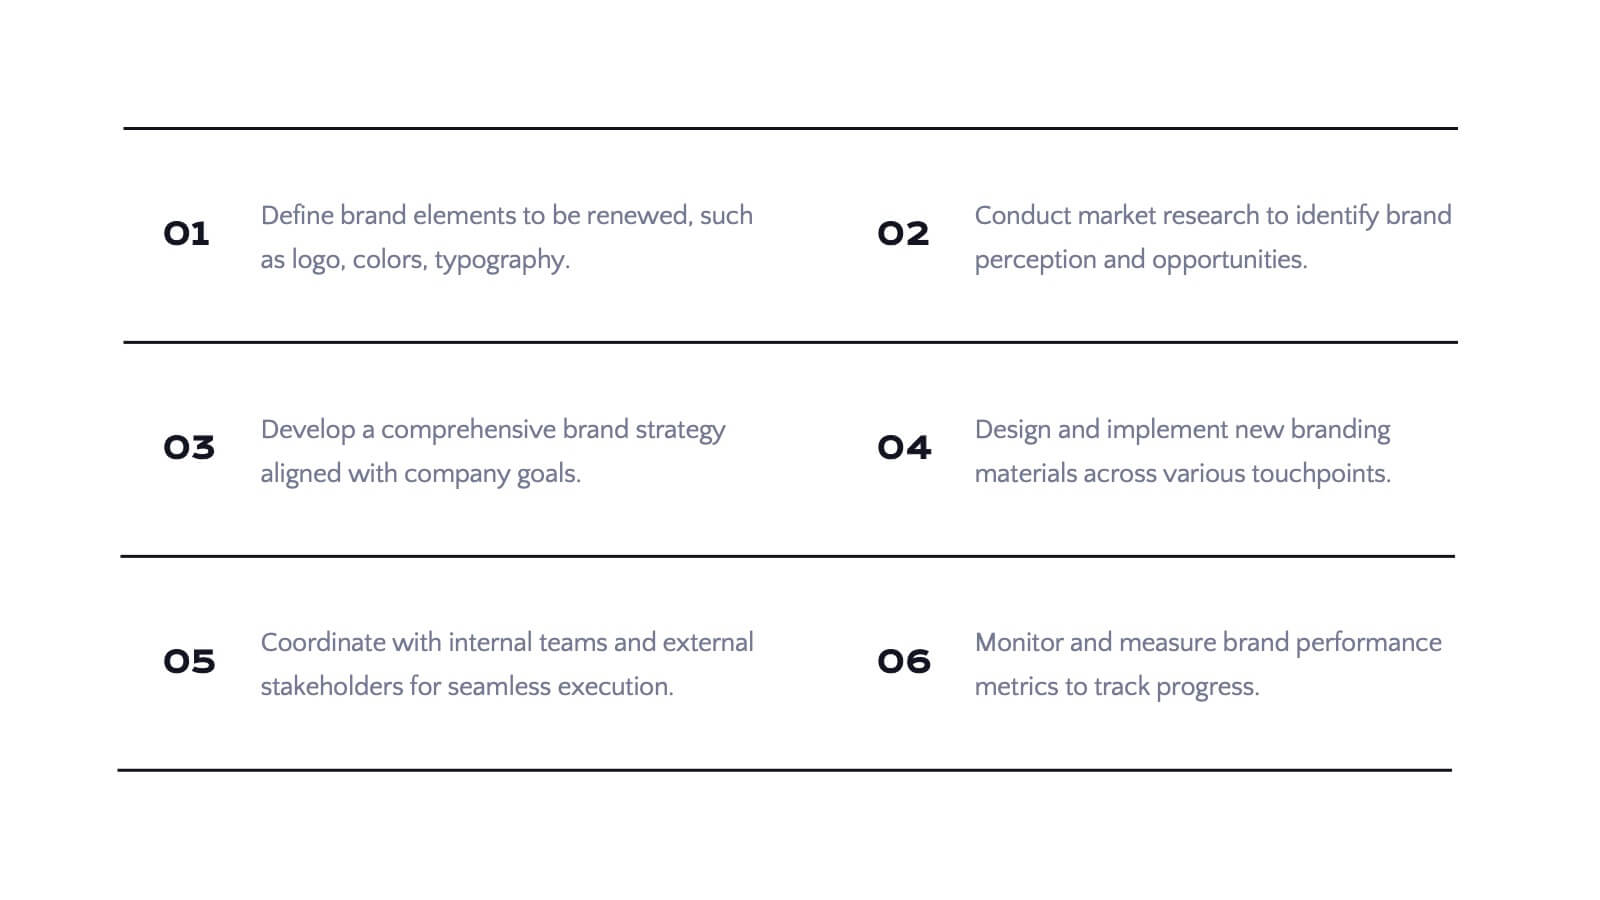
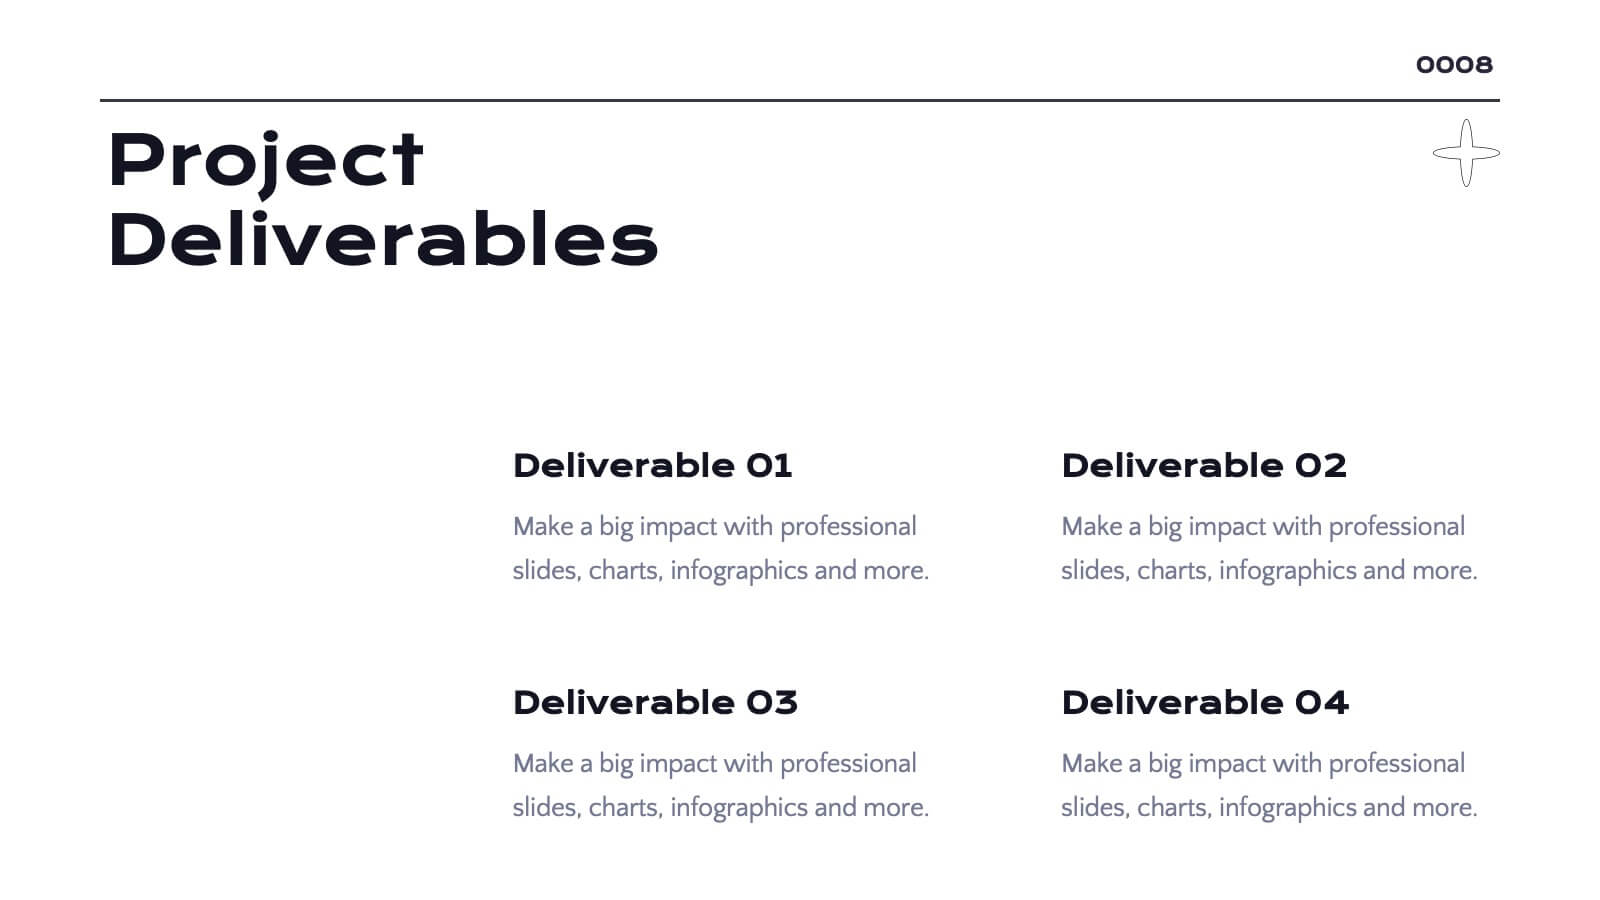
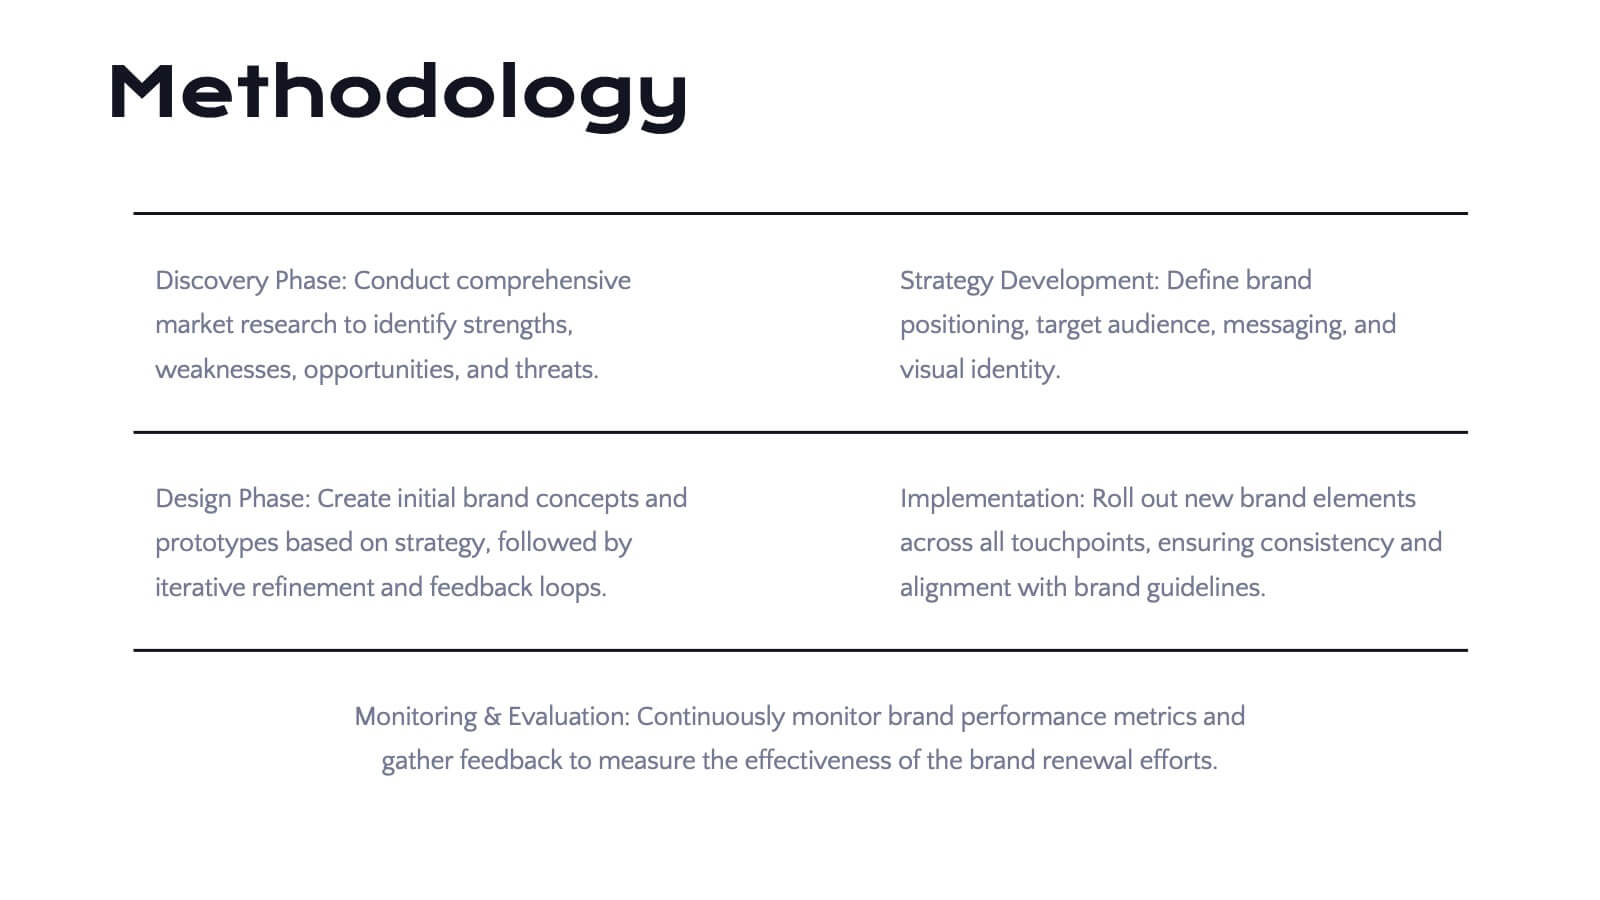
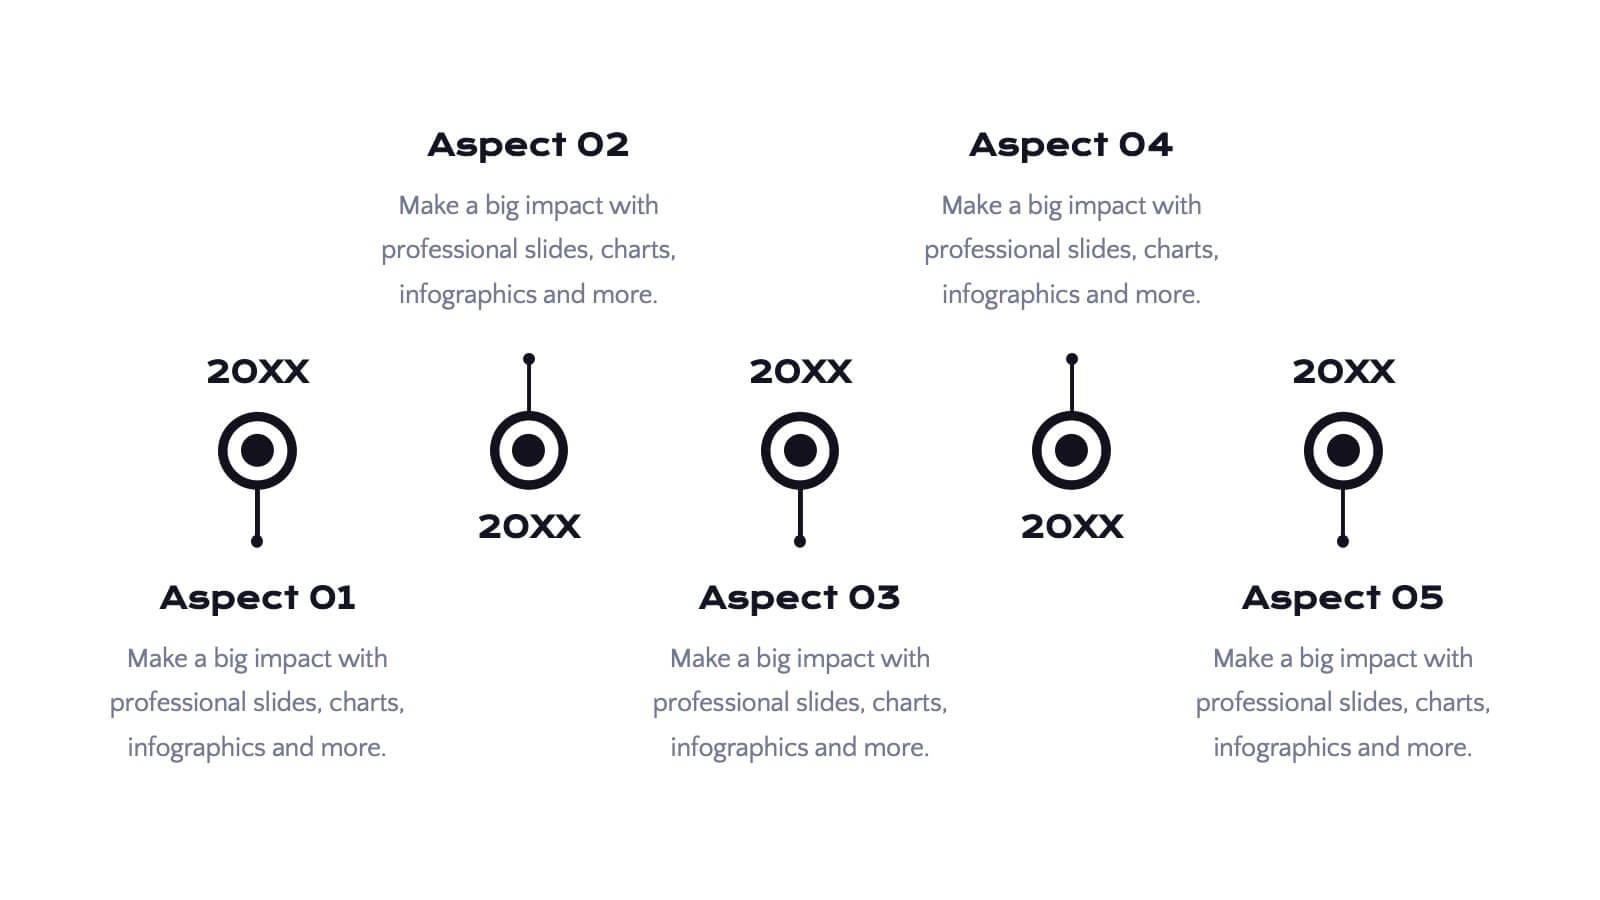
Project Goals and Deliverables
Visualize your project milestones with this dynamic layout, designed to clearly differentiate between goals and deliverables. Use color-coded hexagons and numbered segments to communicate each stage with clarity and impact. Fully editable in PowerPoint, Keynote, and Google Slides.


21 diapositivas
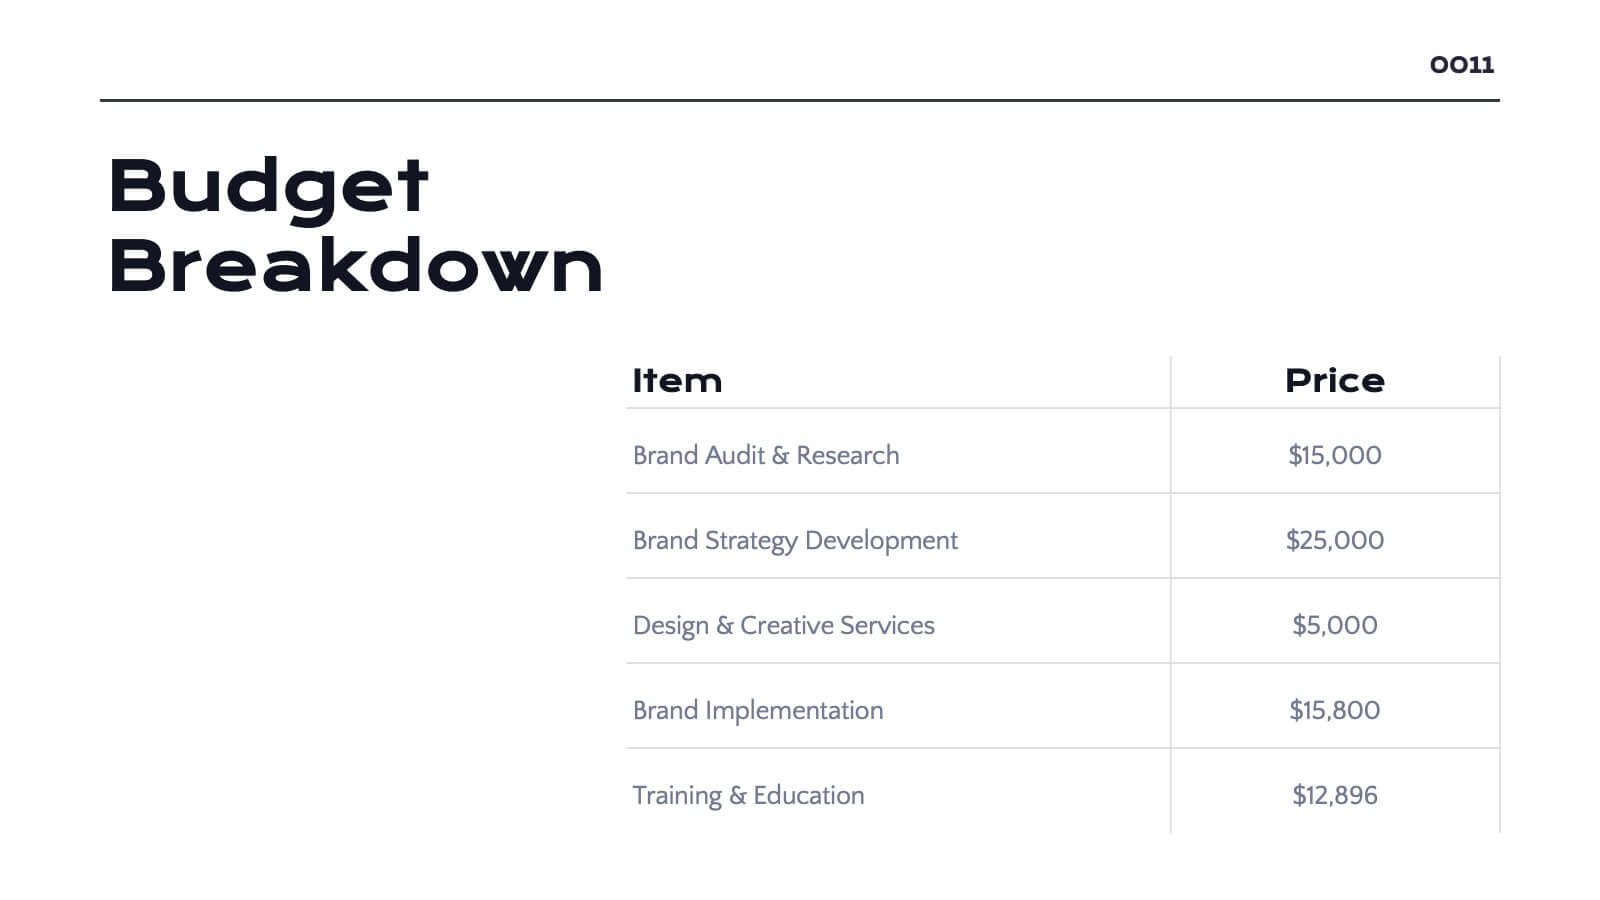
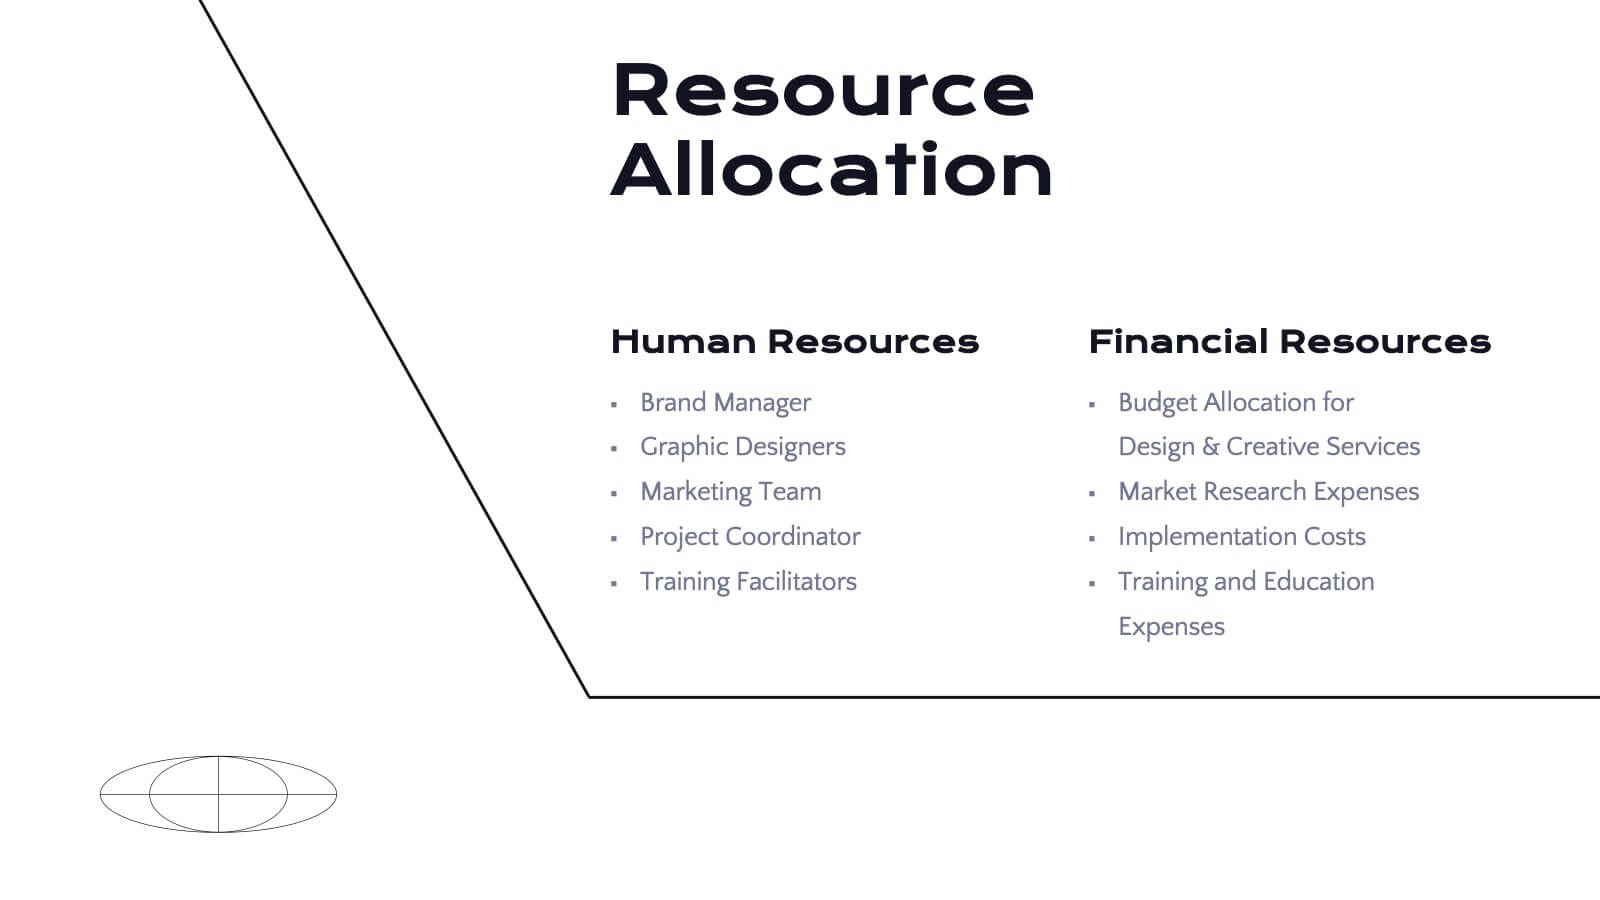
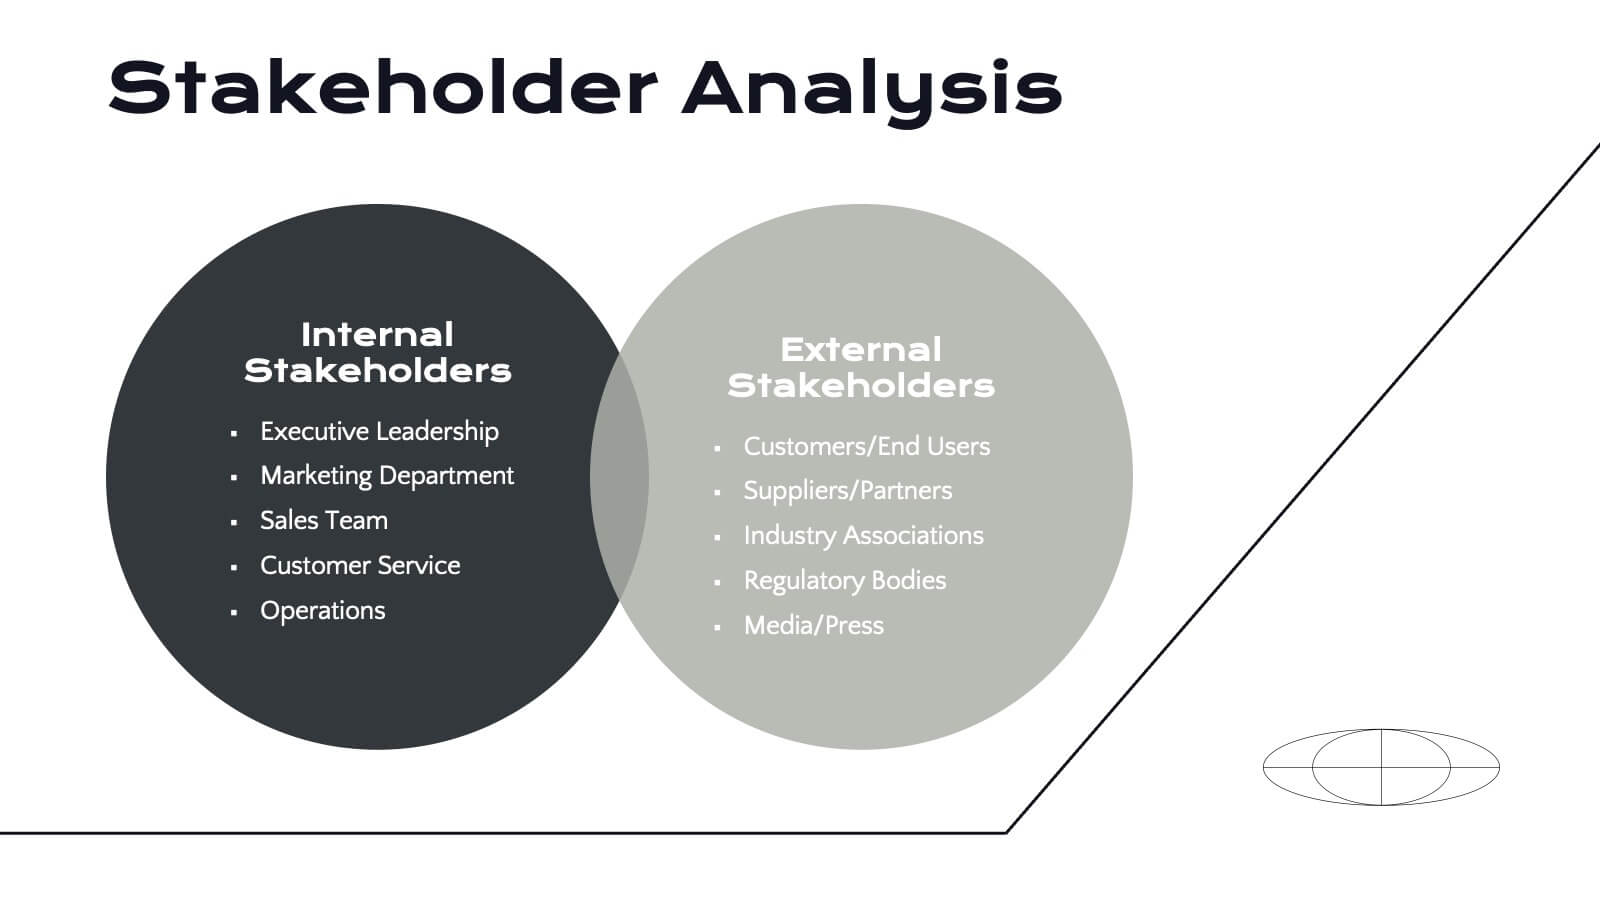
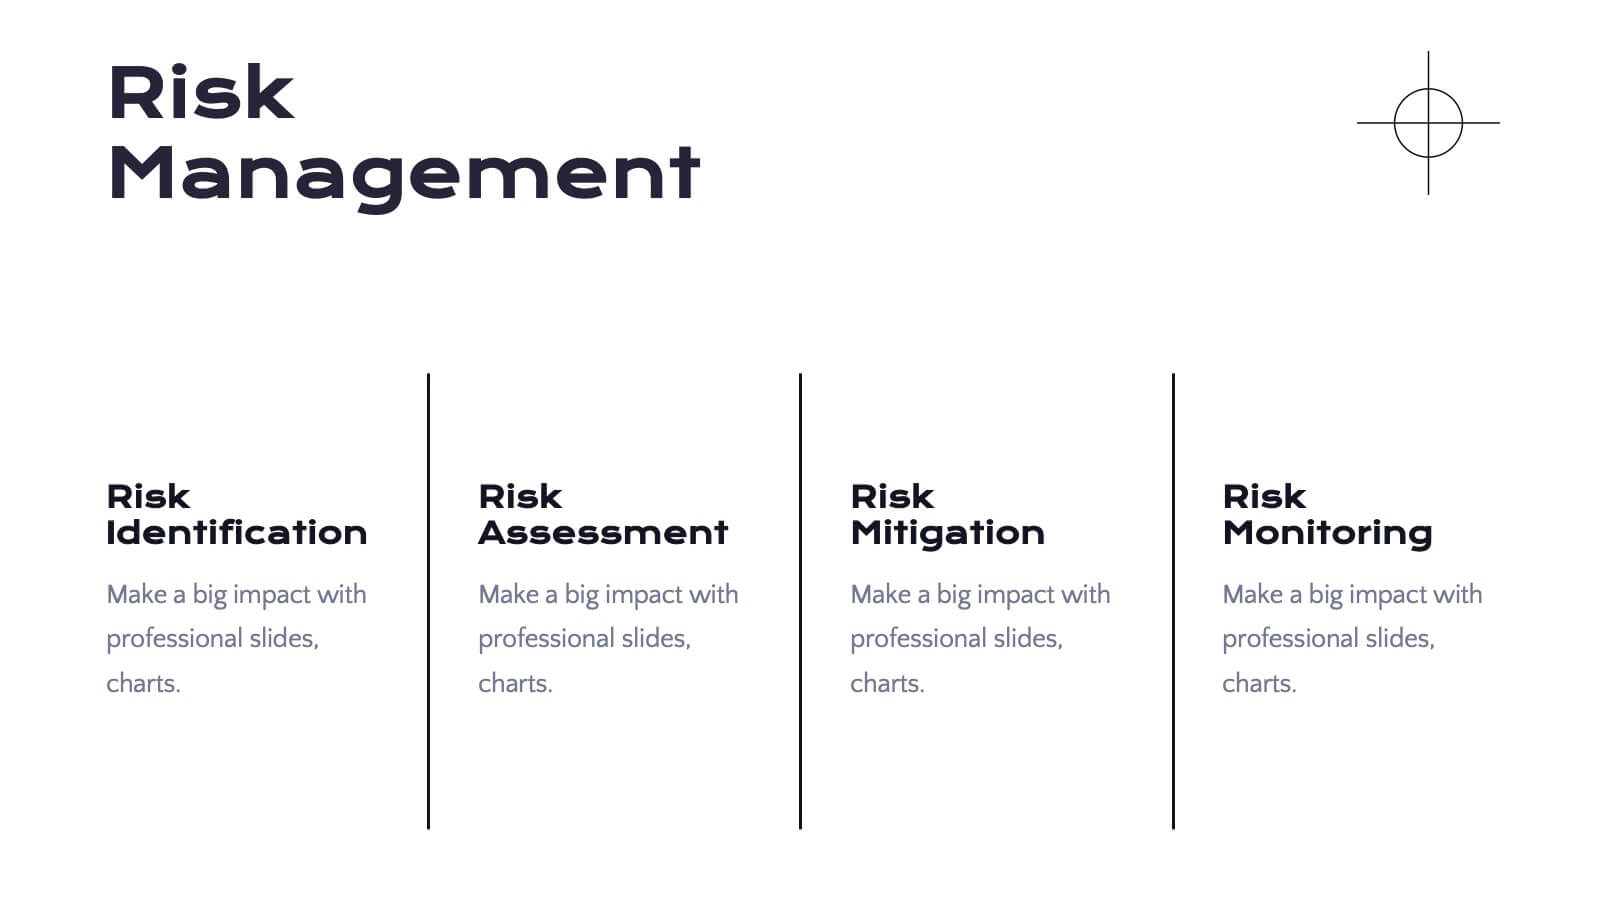
Radiance Detailed Project Execution Plan Presentation
Elevate your project execution presentations with this sleek template, covering everything from objectives to timelines and budget breakdowns. It's perfect for aligning your team and stakeholders. Compatible with PowerPoint, Keynote, and Google Slides, it ensures professionalism and clarity in showcasing your project plans.


5 diapositivas
Business Strategy Planning Puzzle Presentation
Visualize interconnected initiatives with this Business Strategy Planning Puzzle Presentation. The magnifying glass design and five-piece puzzle format help you break down complex strategy components into digestible segments. Ideal for highlighting core objectives, key performance drivers, and strategic focus areas. Fully customizable with editable text boxes and icons. Compatible with PowerPoint, Keynote, and Google Slides.


5 diapositivas
Financial Credit Card Management Presentation
Present credit card processes, workflows, or customer engagement steps with this clean, step-by-step infographic layout. Featuring five clearly defined stages, icons, and space for key insights, it’s perfect for visualizing application journeys, fraud prevention, or usage optimization. Great for banks, fintech presentations, or financial coaching. Fully editable in PowerPoint, Keynote, and Google Slides.


20 diapositivas
Ashen Sales Proposal Presentation
The Sales Proposal Presentation Template is designed to help you showcase your sales strategy effectively. With 20 fully customizable slides, it covers key areas such as market analysis, sales objectives, pricing strategy, and future opportunities. Ideal for professionals, it’s compatible with PowerPoint, Keynote, and Google Slides.


21 diapositivas
Prismtrail Product Roadmap Presentation
Guide your product development journey with this structured roadmap template, covering everything from target market and product features to pricing strategy and production process. Designed for clarity and impact, this template streamlines presentations and is compatible with PowerPoint, Keynote, and Google Slides, ensuring seamless use across platforms.


4 diapositivas
High-Performance Team Collaboration Presentation
Showcase teamwork, trust, and synergy with this bold, interconnected arms graphic. Ideal for illustrating roles, partnerships, or team frameworks, this infographic is perfect for leadership, HR, or corporate strategy slides. Fully customizable in PowerPoint, Keynote, and Google Slides.


7 diapositivas
Project Management Process Infographic
Navigate the vast arena of project management with our project management infographic. Anchored on a clear white base, the design is adorned with the calm of green, the trustworthiness of blue, and the innovative spirit of purple. Engage with meticulously designed infographics, tailored icons, and flexible image placeholders, providing a comprehensive visual guide to the realms of project planning, execution, and evaluation. Perfectly sculpted for Powerpoint, Keynote, or Google Slides. An invaluable asset for project managers, team leaders, consultants, or anyone in the corporate landscape wanting to visualize and optimize project stages.


5 diapositivas
Quarterly Sales Funnel Overview Presentation
Visualize conversion performance with clarity using the Quarterly Sales Funnel Overview Presentation. This sleek funnel chart design breaks down each sales stage—from lead generation to closing—helping you present key percentages and insights effectively. Perfect for marketing reports, sales updates, and business reviews. Fully editable in Canva, PowerPoint, Keynote, and Google Slides.


4 diapositivas
Interactive Learning Models Presentation
Illustrate step-by-step learning journeys with this creative, hand-drawn infographic layout. Ideal for training modules, course planning, or educational workflows, this slide highlights three key insights with interactive appeal. Fully editable in PowerPoint, Keynote, and Google Slides—perfect for educators, trainers, and instructional designers looking to boost engagement.


8 diapositivas
Medical Anatomy Study
Deliver engaging medical insights with this professionally designed anatomy slide. Perfect for health education, biology lessons, or healthcare proposals, this layout highlights key internal systems with clean visuals. Editable in PowerPoint, Keynote, and Google Slides—customize the organs, labels, and notes with ease.


5 diapositivas
Health Care Infographics
Taking care of your health is an investment in your future self and can lead to a happier and more fulfilling life. These vertical health care infographics are visual representations of information related to health care. They can cover a wide range of topics, such as disease prevention, medical treatments, and patient care. These are designed to be easily understandable and engaging for a general audience. They use colorful graphics and illustrations to convey complex information in an eye-catching manner. These also include graphs, diagrams text boxes, and other design elements to highlight key information.