


Características


¿Tienes alguna pregunta?
Recomendar


22 diapositivas
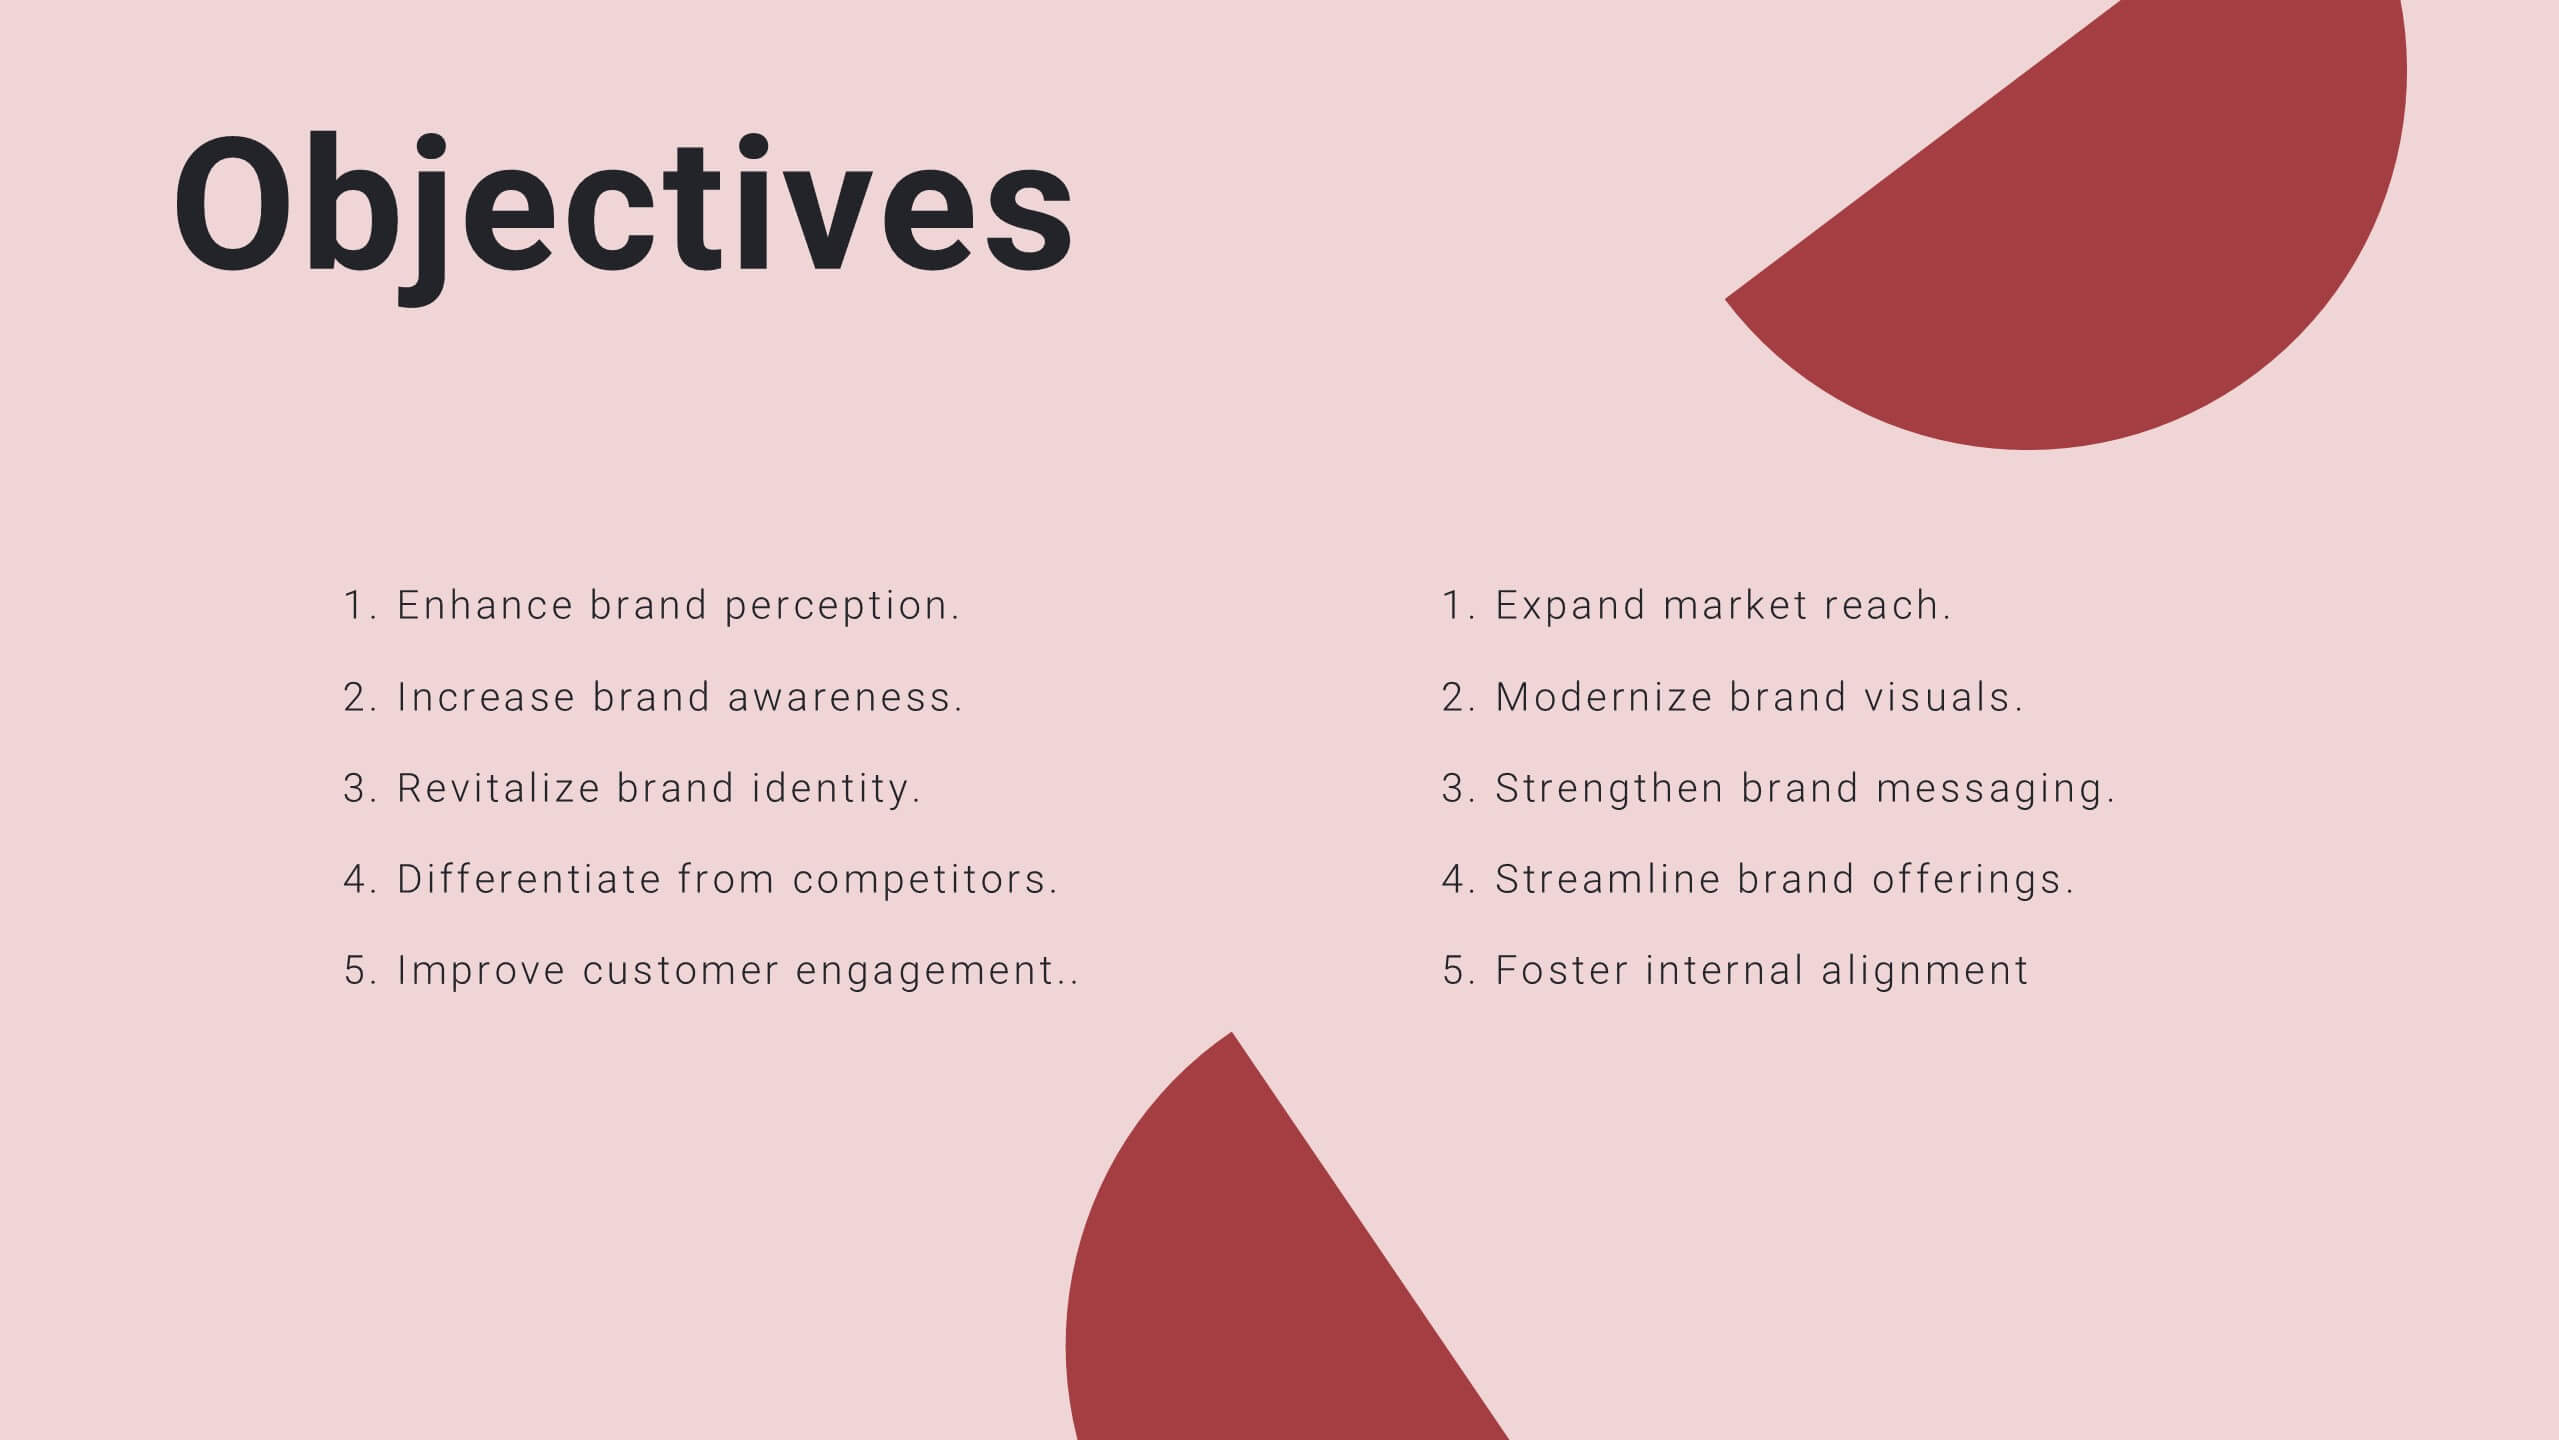
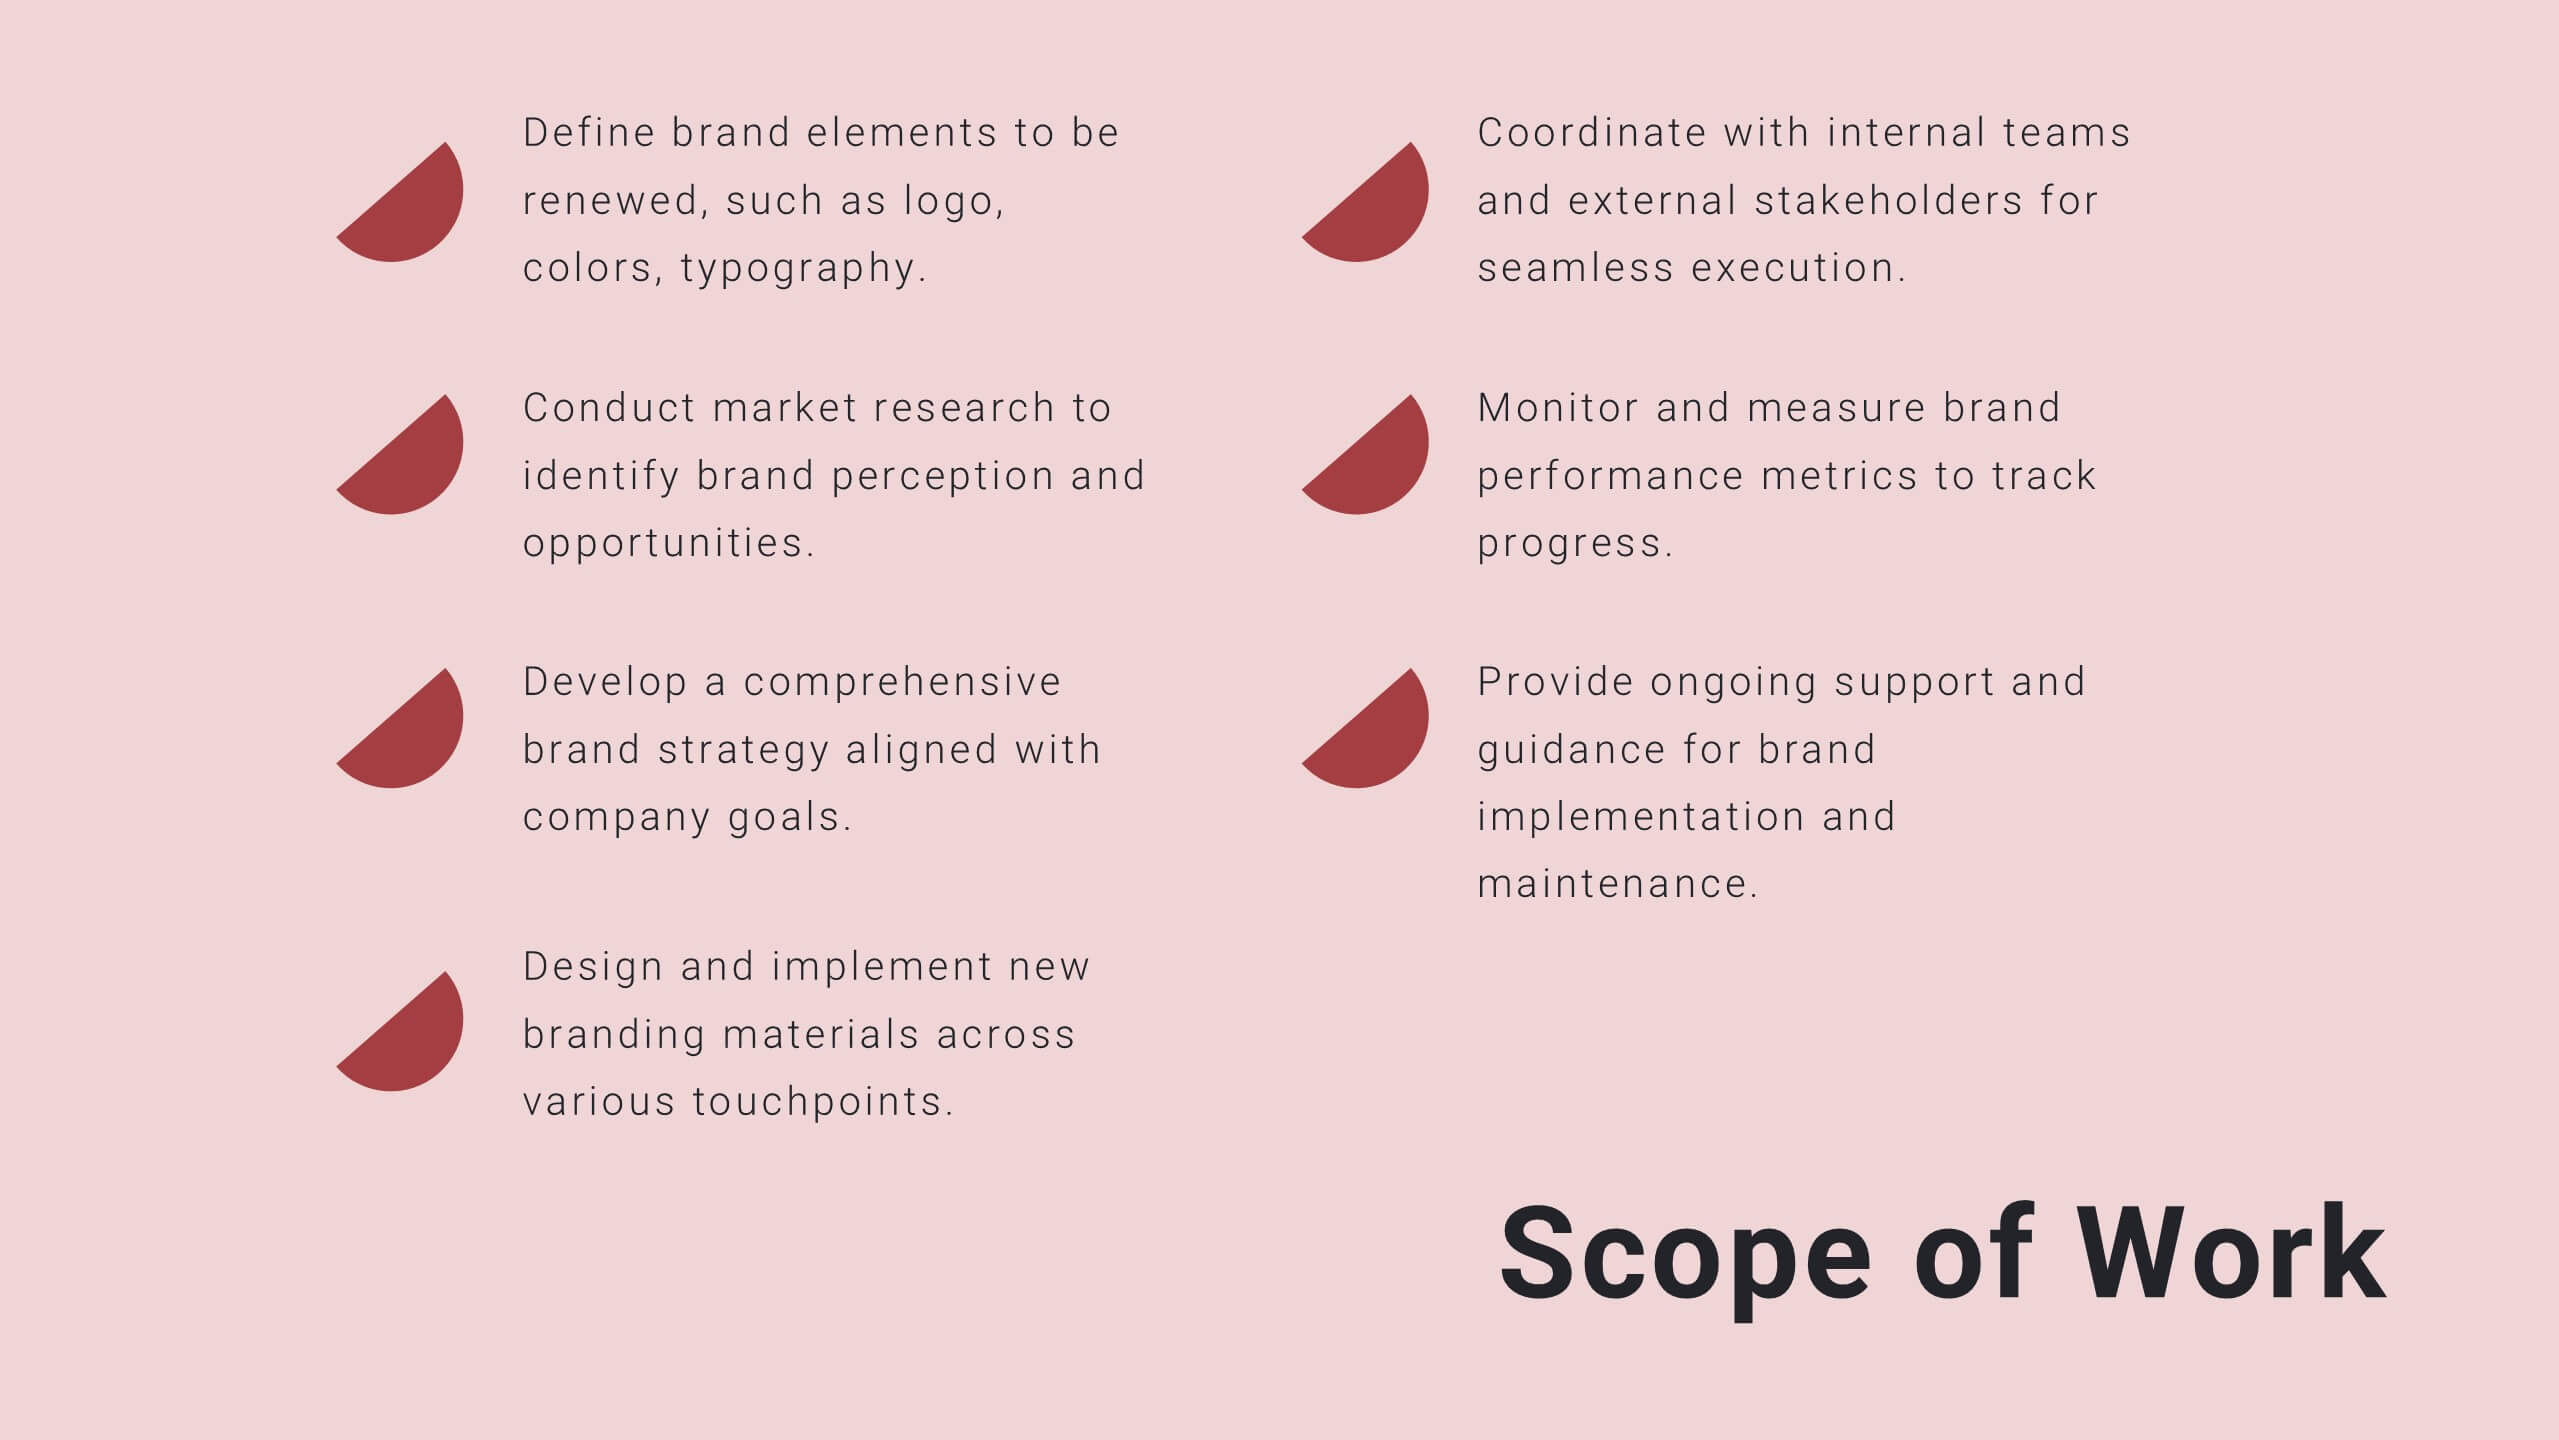
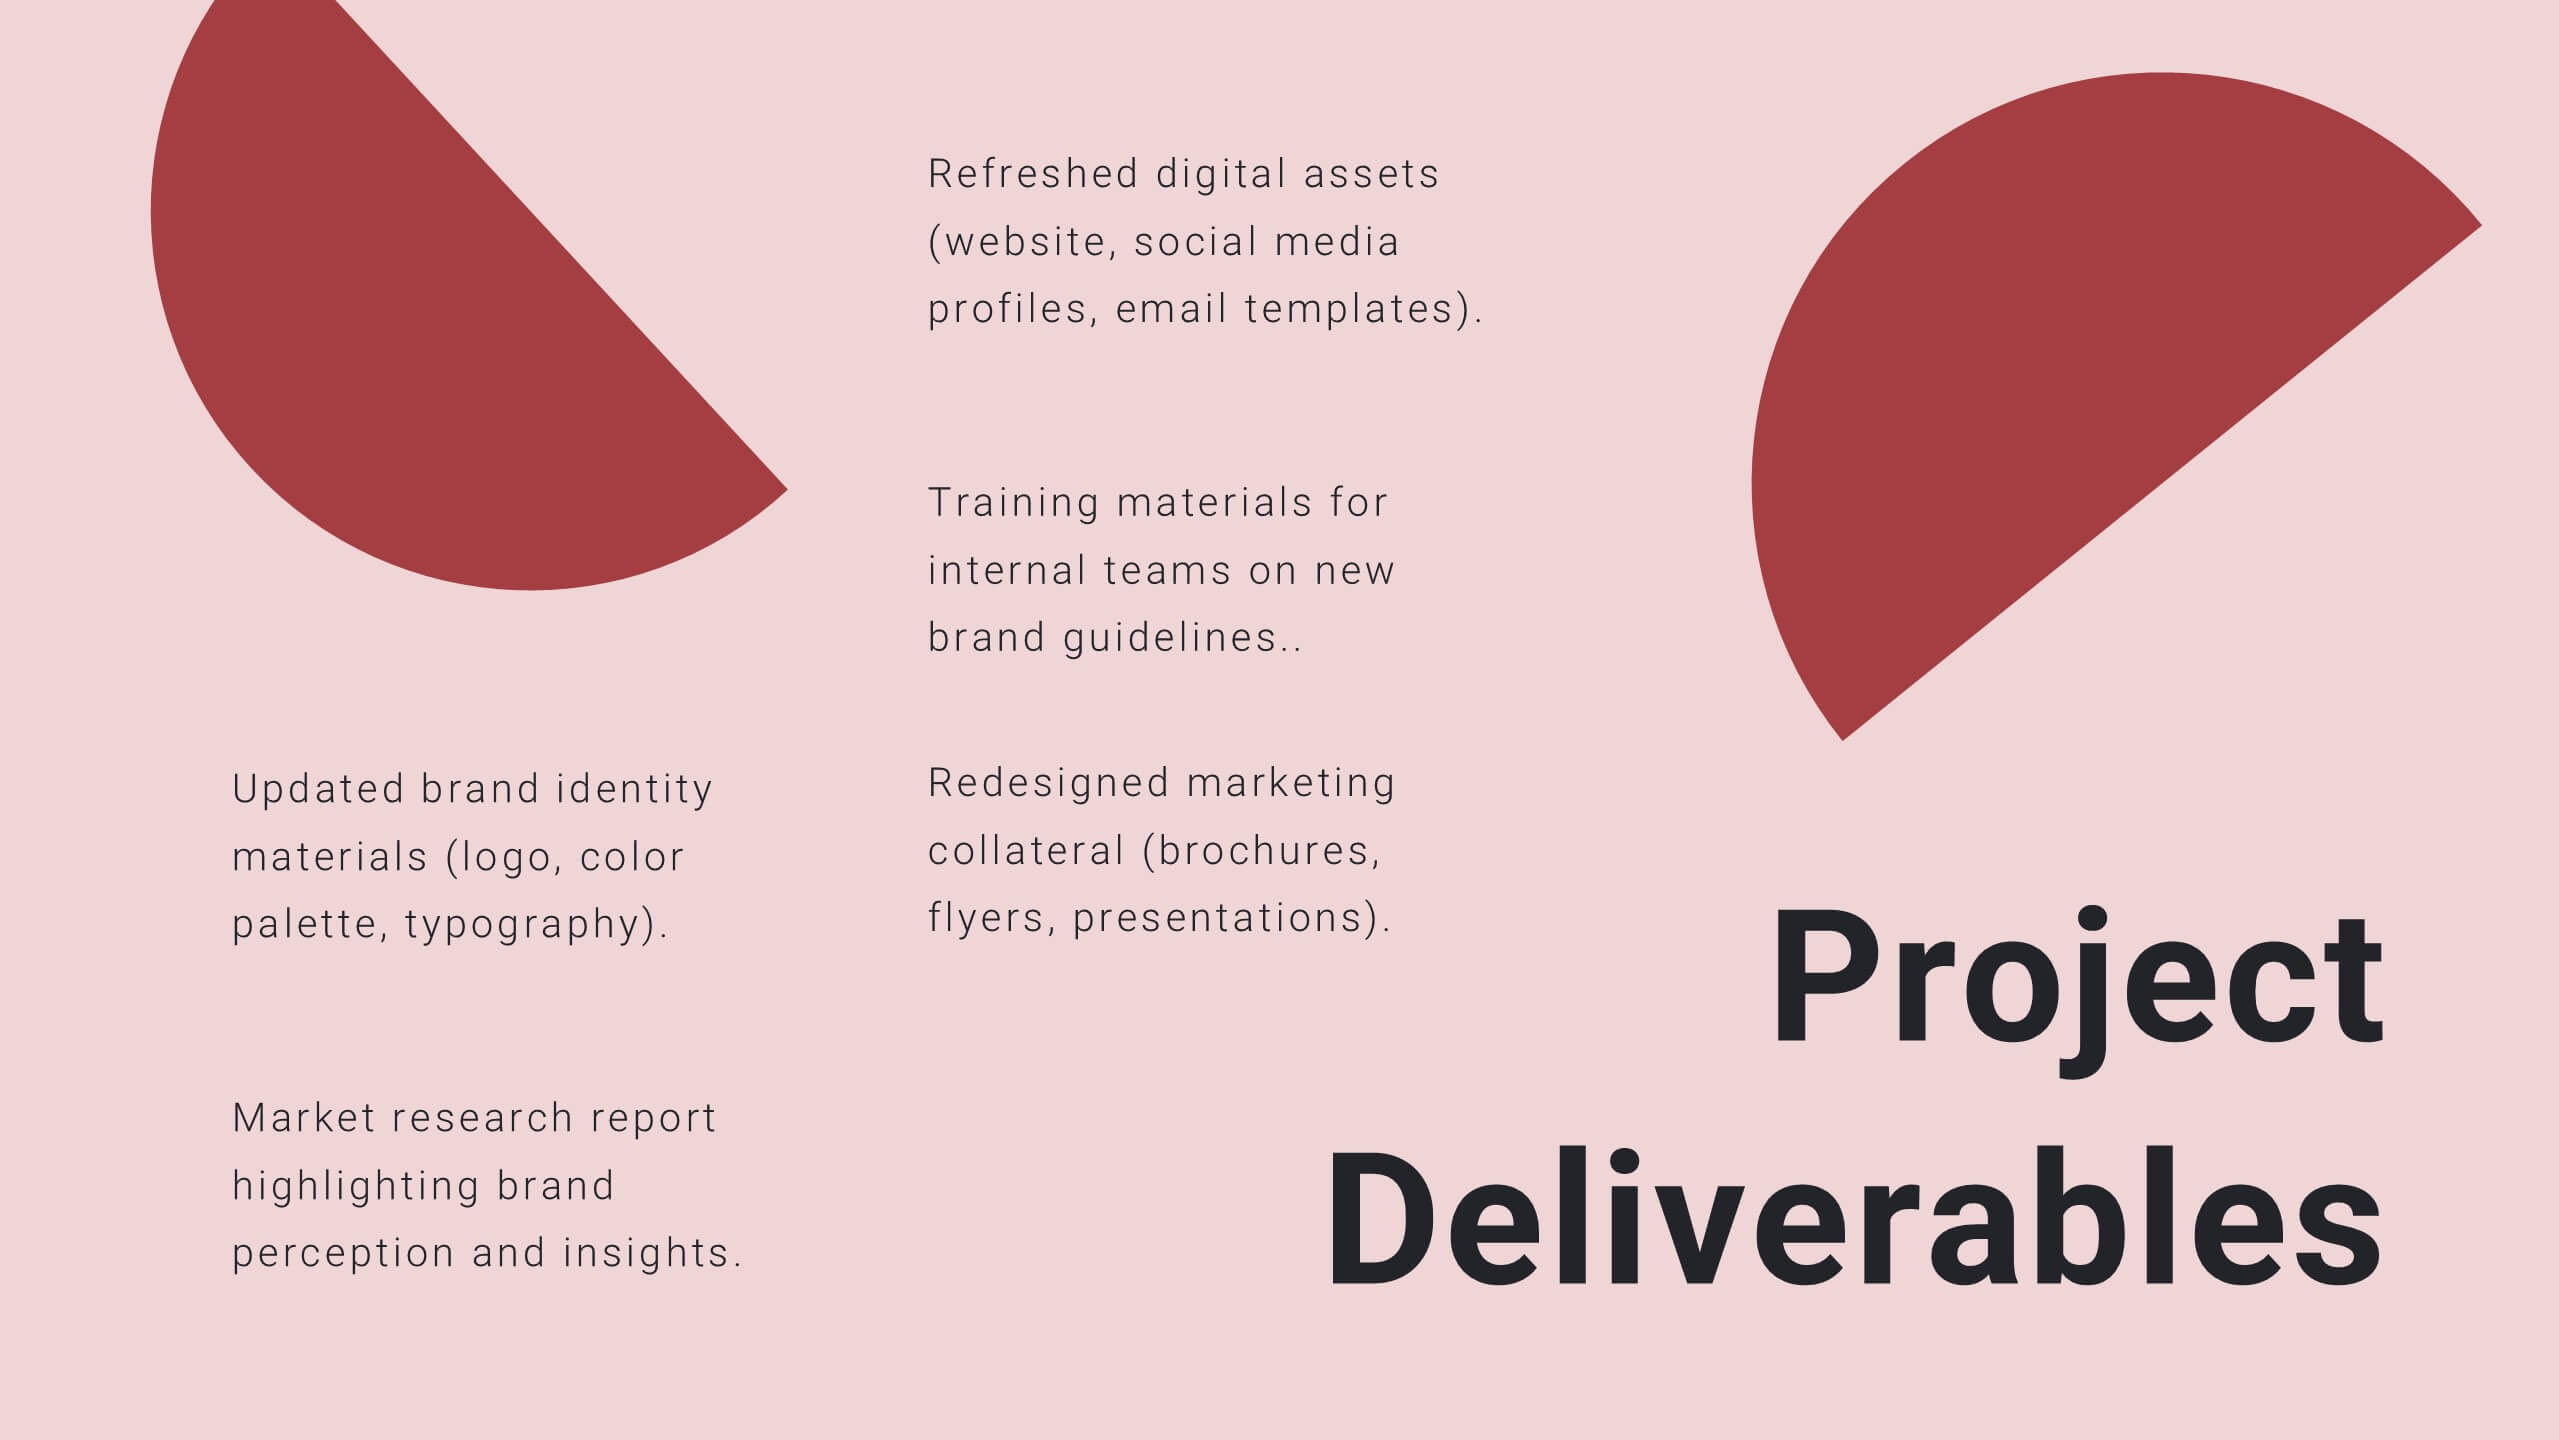
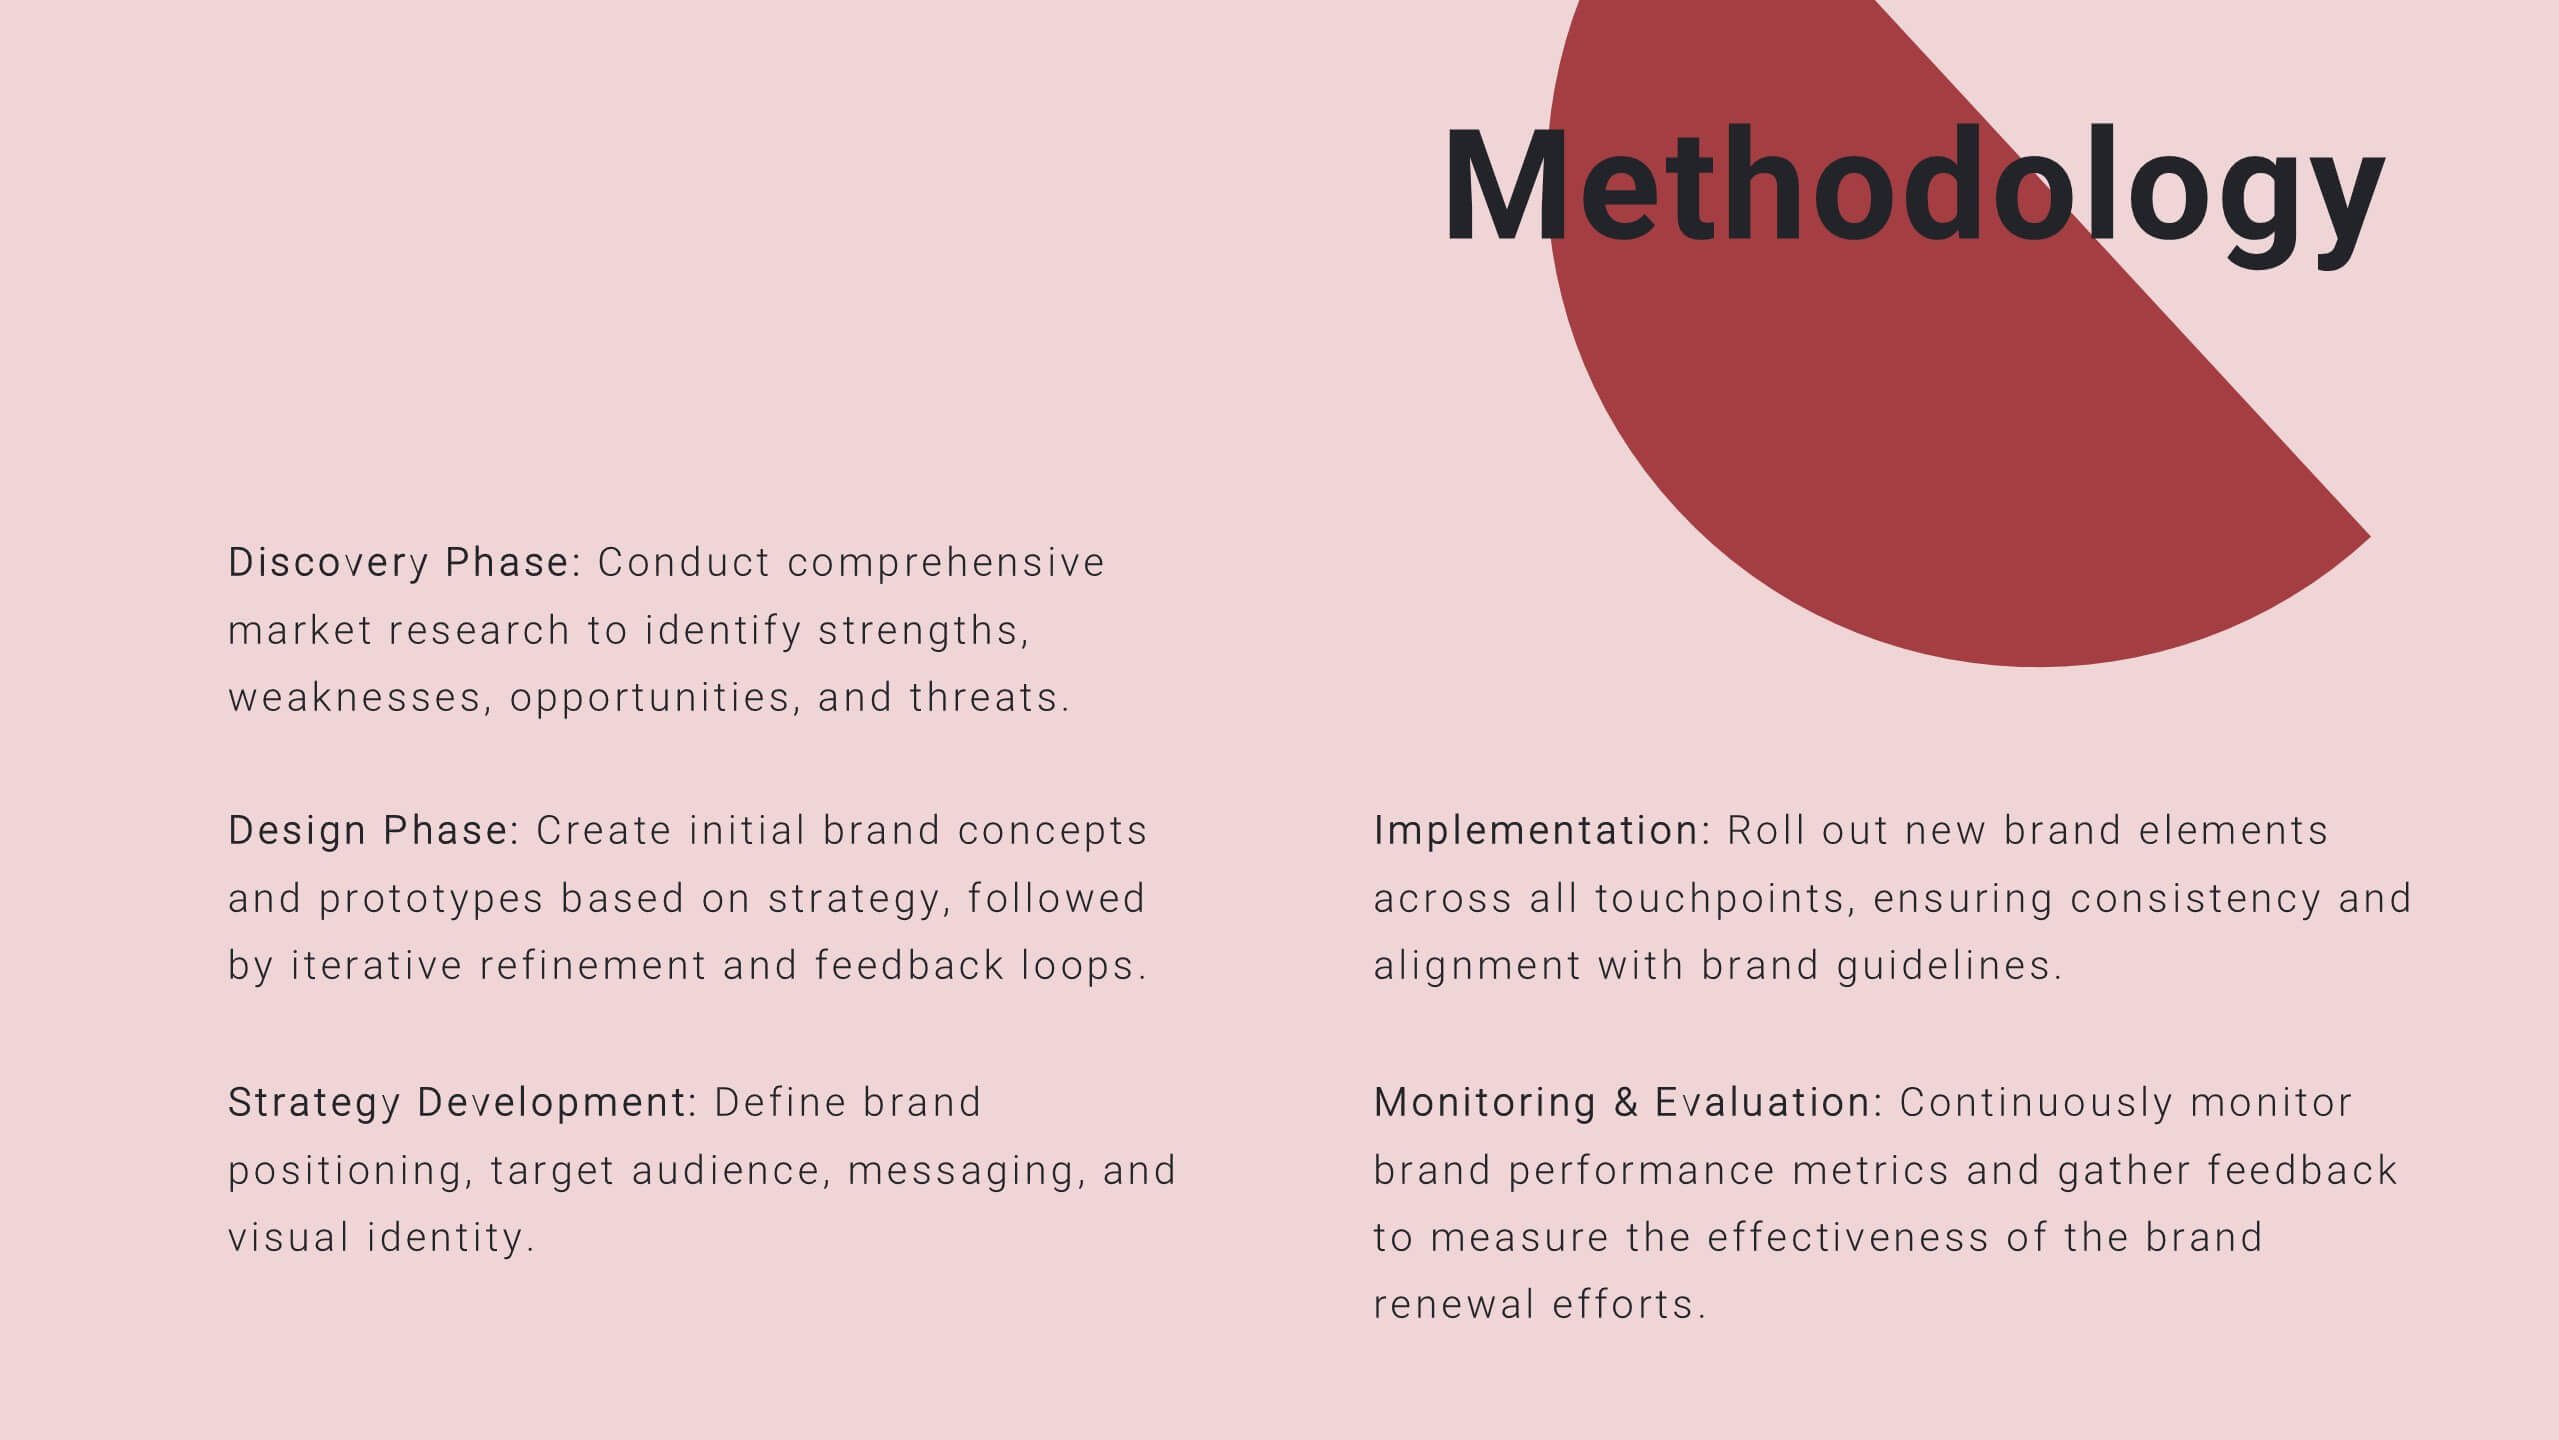
Chromatic Academic Research Report Presentation
A structured template for academic research proposals, covering objectives, methodology, findings, and implications. Ideal for detailed presentations of data, analysis, and future research directions. Compatible with PowerPoint, Keynote, and Google Slides, it offers a professional layout for academic, scientific, or market research presentations.


21 diapositivas
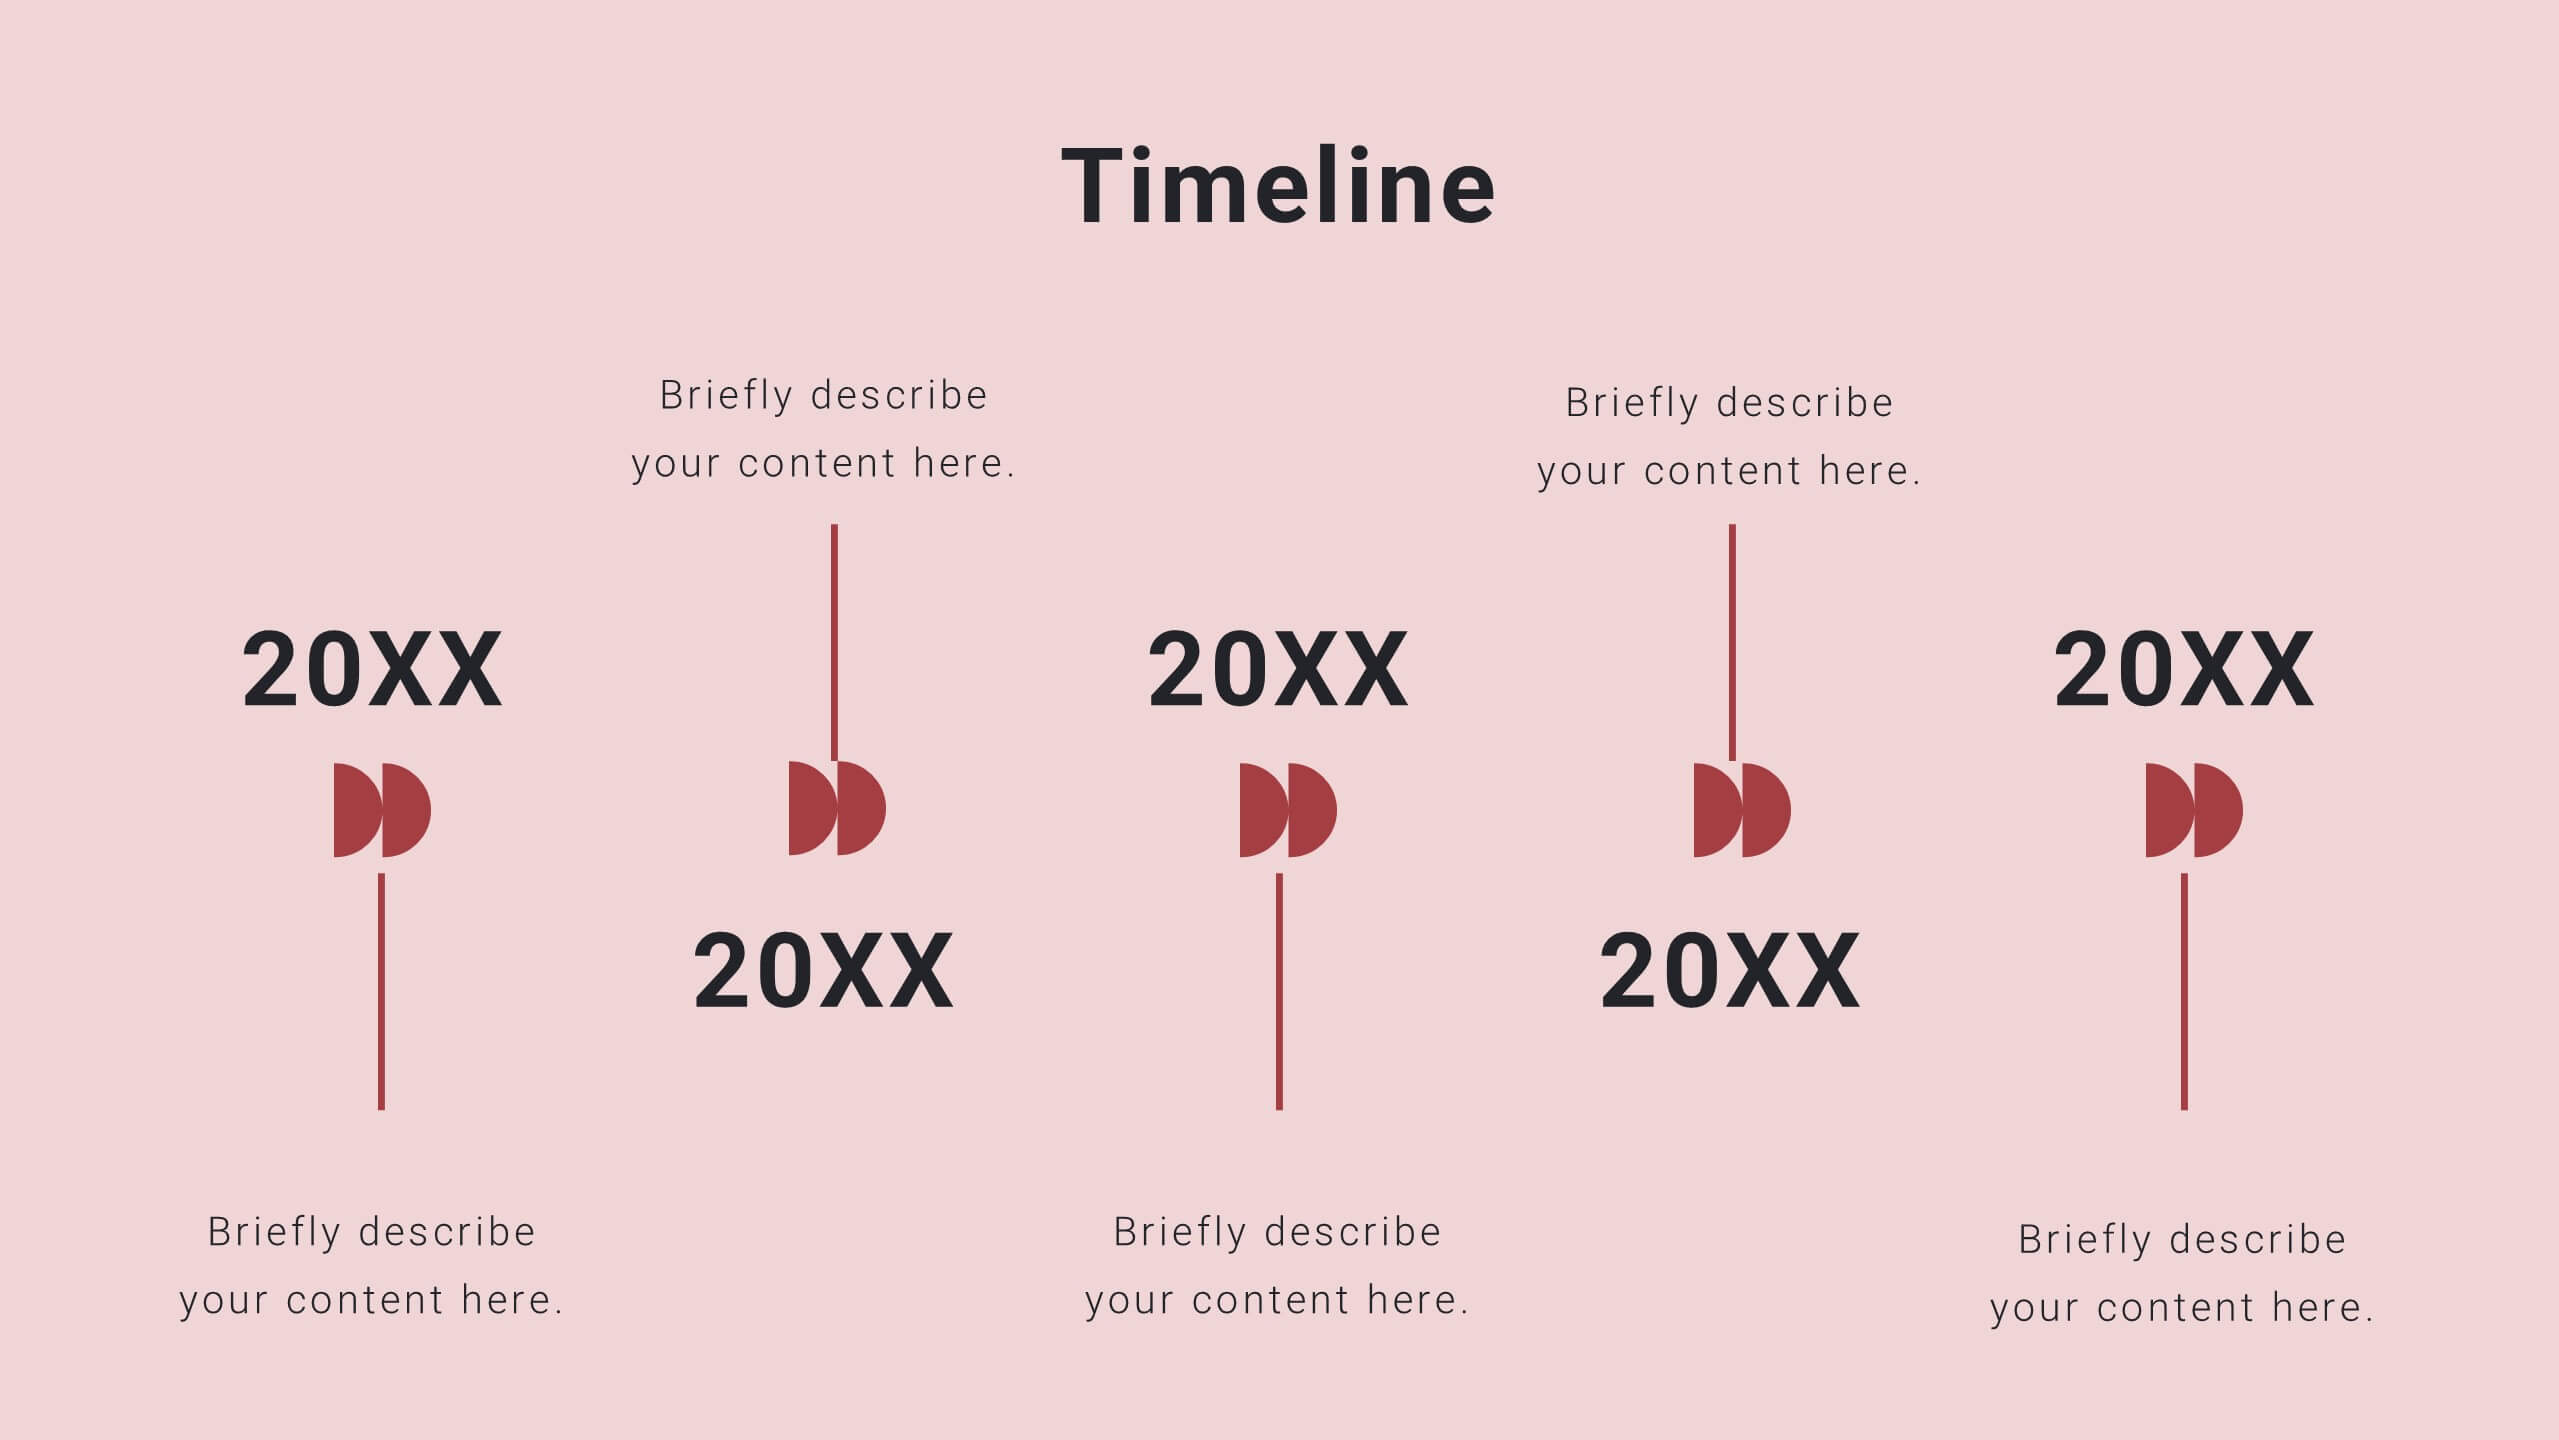
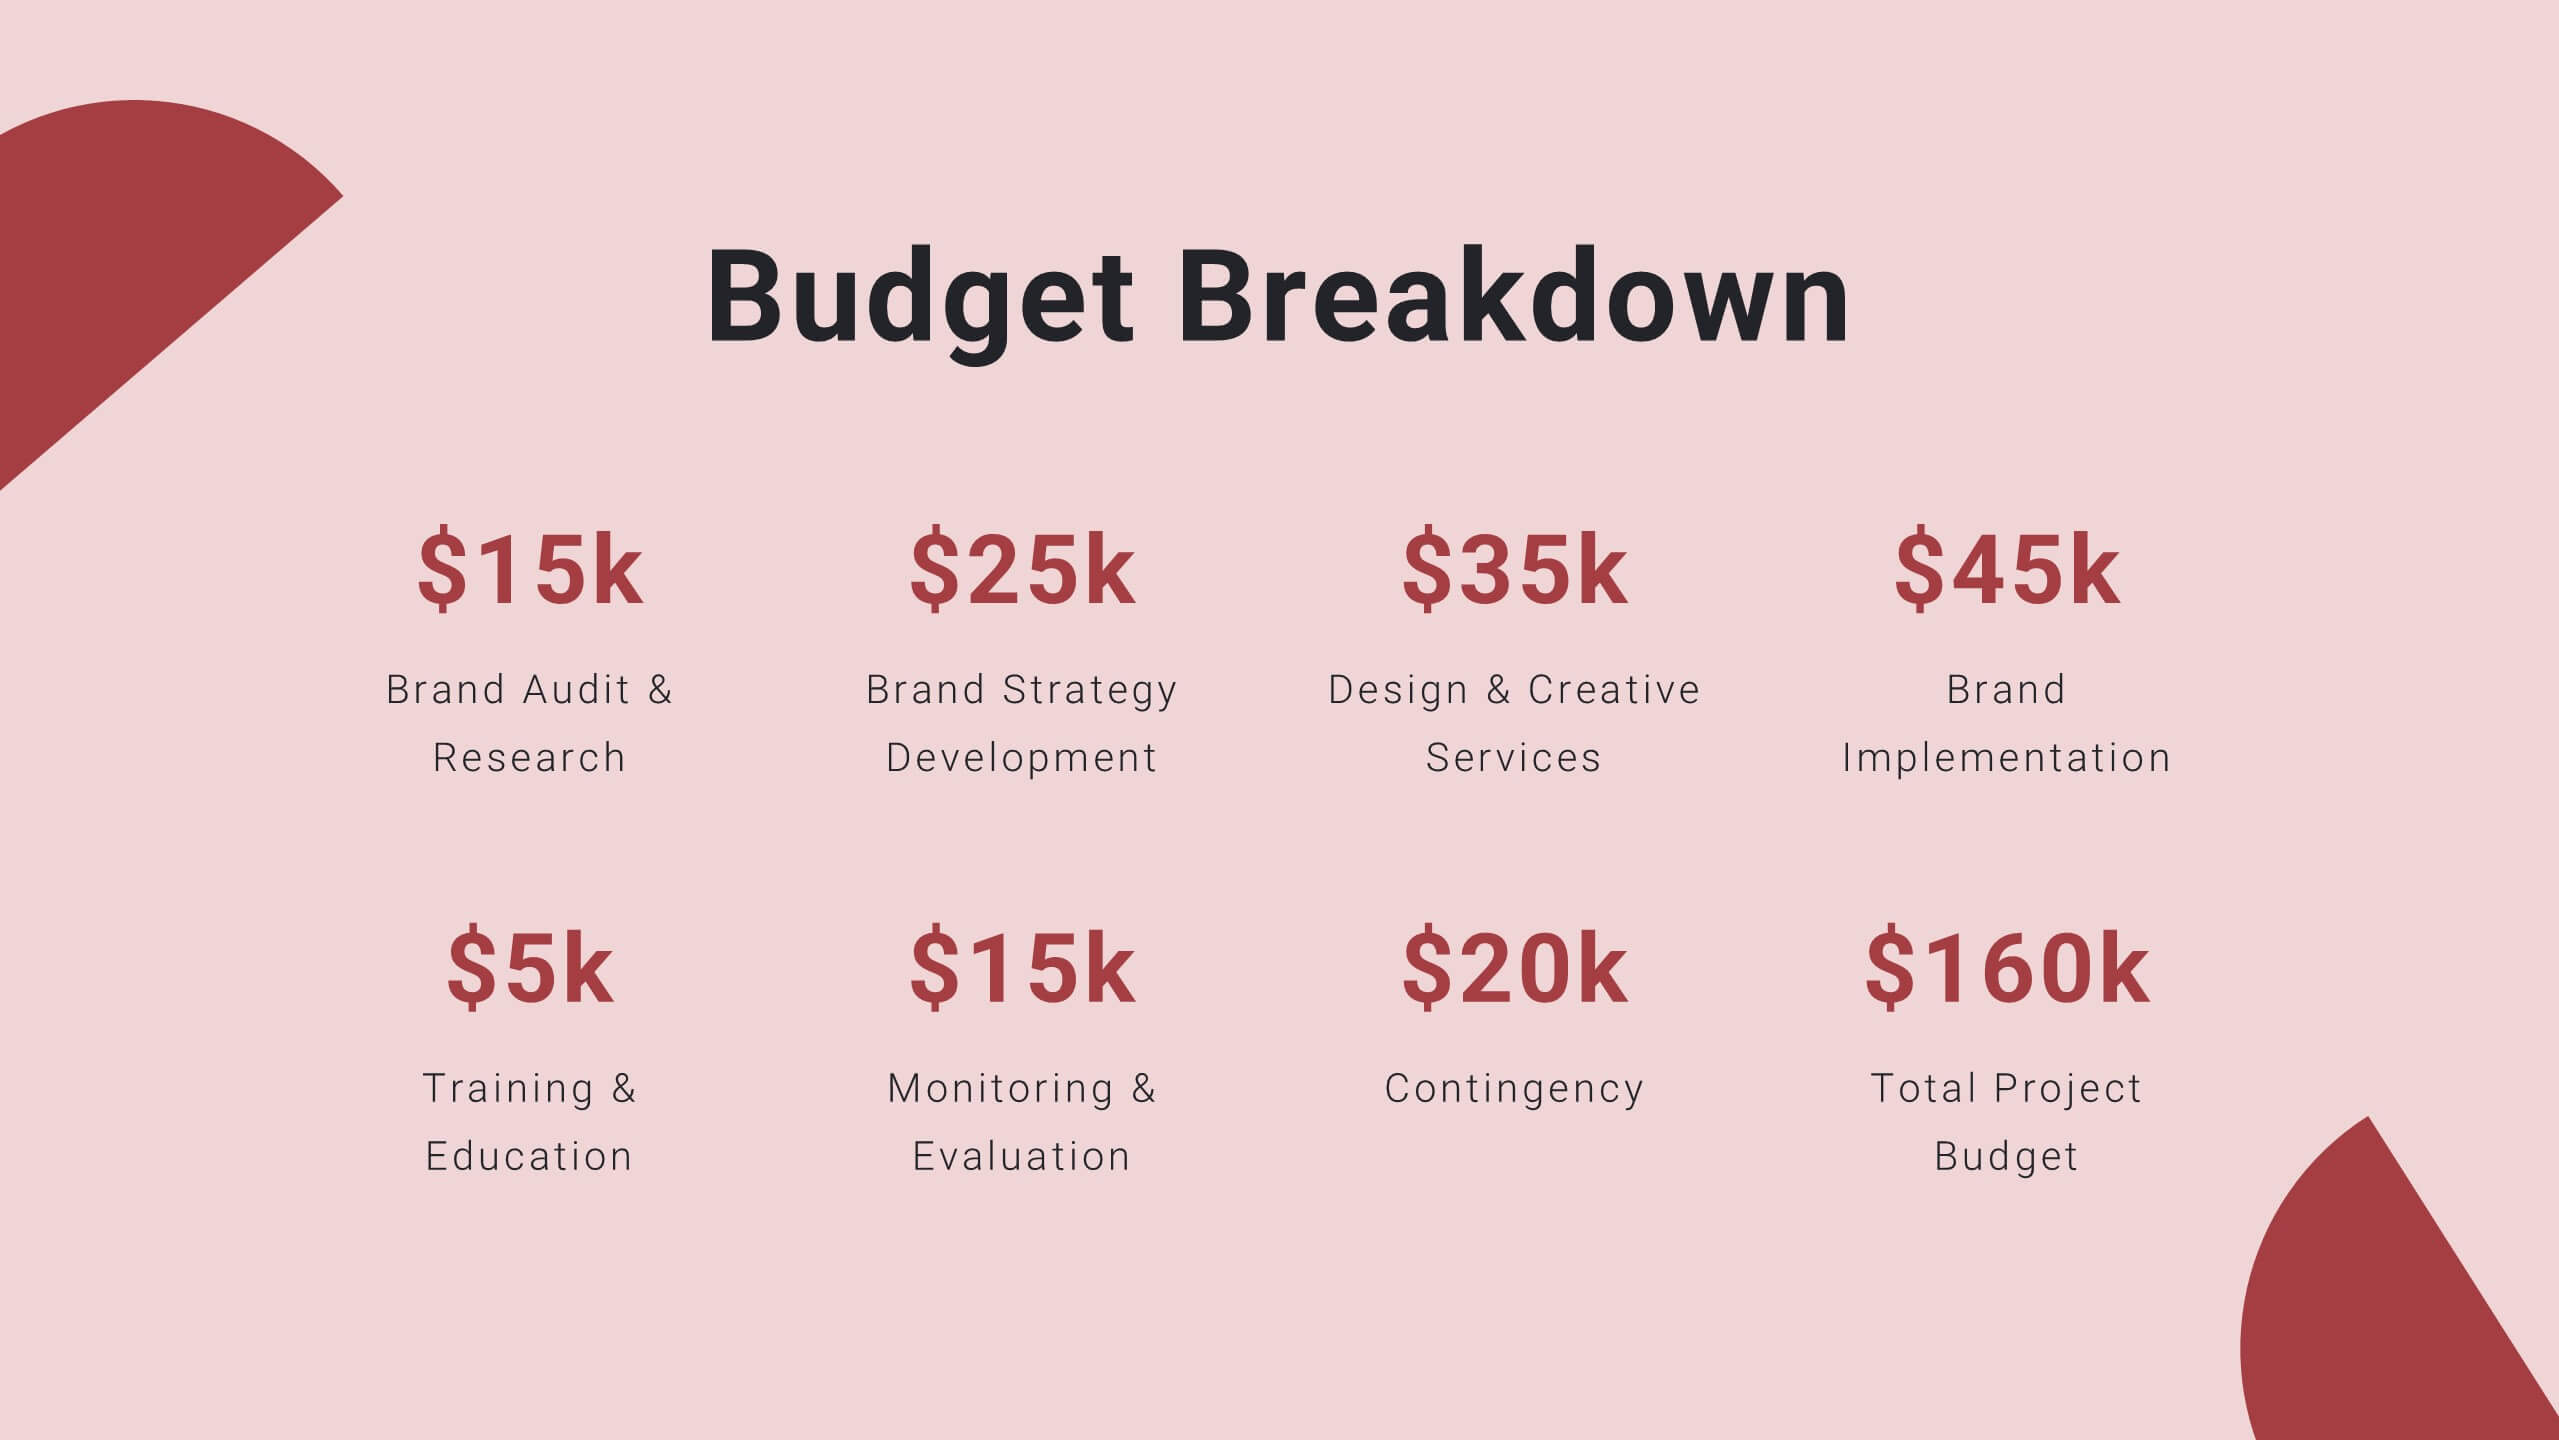
Twilight Project Milestones Report Presentation
Present your project milestones and plan with clarity using this sleek project proposal template! It includes sections for objectives, timelines, budget breakdowns, and risk management. Perfect for organizing and presenting complex project plans, it’s fully customizable and compatible with PowerPoint, Keynote, and Google Slides, ensuring a professional presentation every time.


6 diapositivas
Digital Marketing Consultancy Infographics
Our Digital Marketing Consultancy infographic is an essential visual tool for Powerpoint, Keynote, and Google Slides presentations, tailor-made for digital marketing consultants, strategists, and educators. This infographic is designed to visually articulate the impact and results of digital marketing strategies and campaigns. The Digital Marketing Consultancy infographic presents key marketing metrics in an easily digestible format, from social media engagement rates to website traffic and conversion statistics. It's perfect for showcasing the success of digital marketing efforts and for explaining the return on investment (ROI) to stakeholders. The visual design is crafted to be both informative and attention-grabbing, ensuring your audience fully grasps the significance of the data presented. By using this infographic in your presentations, you can effectively communicate complex digital marketing concepts and analytics to your audience. Whether you’re reporting to clients, training a team, or teaching students, this infographic will enhance your ability to convey essential marketing insights in a clear and engaging manner. Incorporate it into your presentation materials to highlight the benefits and effectiveness of strategic digital marketing initiatives.


7 diapositivas
Project Status Summary Infographic
A Project Status Summary is an overview or report that provides key information about the progress, performance, and current state of a project. This infographic template is a visual tool designed to provide a quick and comprehensive overview of your project's progress, empowering you to track milestones, anticipate roadblocks, and ensure project success. This template is ideal for project management and communication, allowing stakeholders to quickly grasp the project's status without delving into detailed project documents. The goal of this Project Status is to present a snapshot of your project's progress in an easily understandable format.


5 diapositivas
Live Sports Infographics
Immerse in the dynamic realm of athletics with our live sports infographics. Crafted in a medley of energetic blue, spirited yellow, and various vivid hues, this template radiates the inherent in the world of sports. Its creative and vertical layout, optimized for impact, is perfect for sports journalists. Compatible with Powerpoint, Keynote, and Google Slides. The compelling graphics, icons, and dedicated image placeholders are specifically tailored to encapsulate the pulse-pounding moments and diverse statistics of live sports events. This visually striking, data-centric tool is indispensable for those seeking to convey complex sports information.


6 diapositivas
Go-to-Market Launch Plan Presentation
Launch with confidence using this Go-to-Market Launch Plan Presentation. This clean, step-by-step visual framework highlights each phase of your GTM strategy—from market research to execution metrics. Ideal for startups, product managers, and marketing teams. Fully customizable in PowerPoint, Keynote, and Google Slides.


5 diapositivas
3-Level Concentric Diagram Presentation
Bring clarity and structure to your ideas with a clean, layered diagram design that simplifies complex concepts. Perfect for showcasing stages, hierarchies, or interconnected systems, it keeps your audience engaged with visual balance and flow. Fully compatible with PowerPoint, Keynote, and Google Slides for effortless customization and presentation flexibility.


21 diapositivas
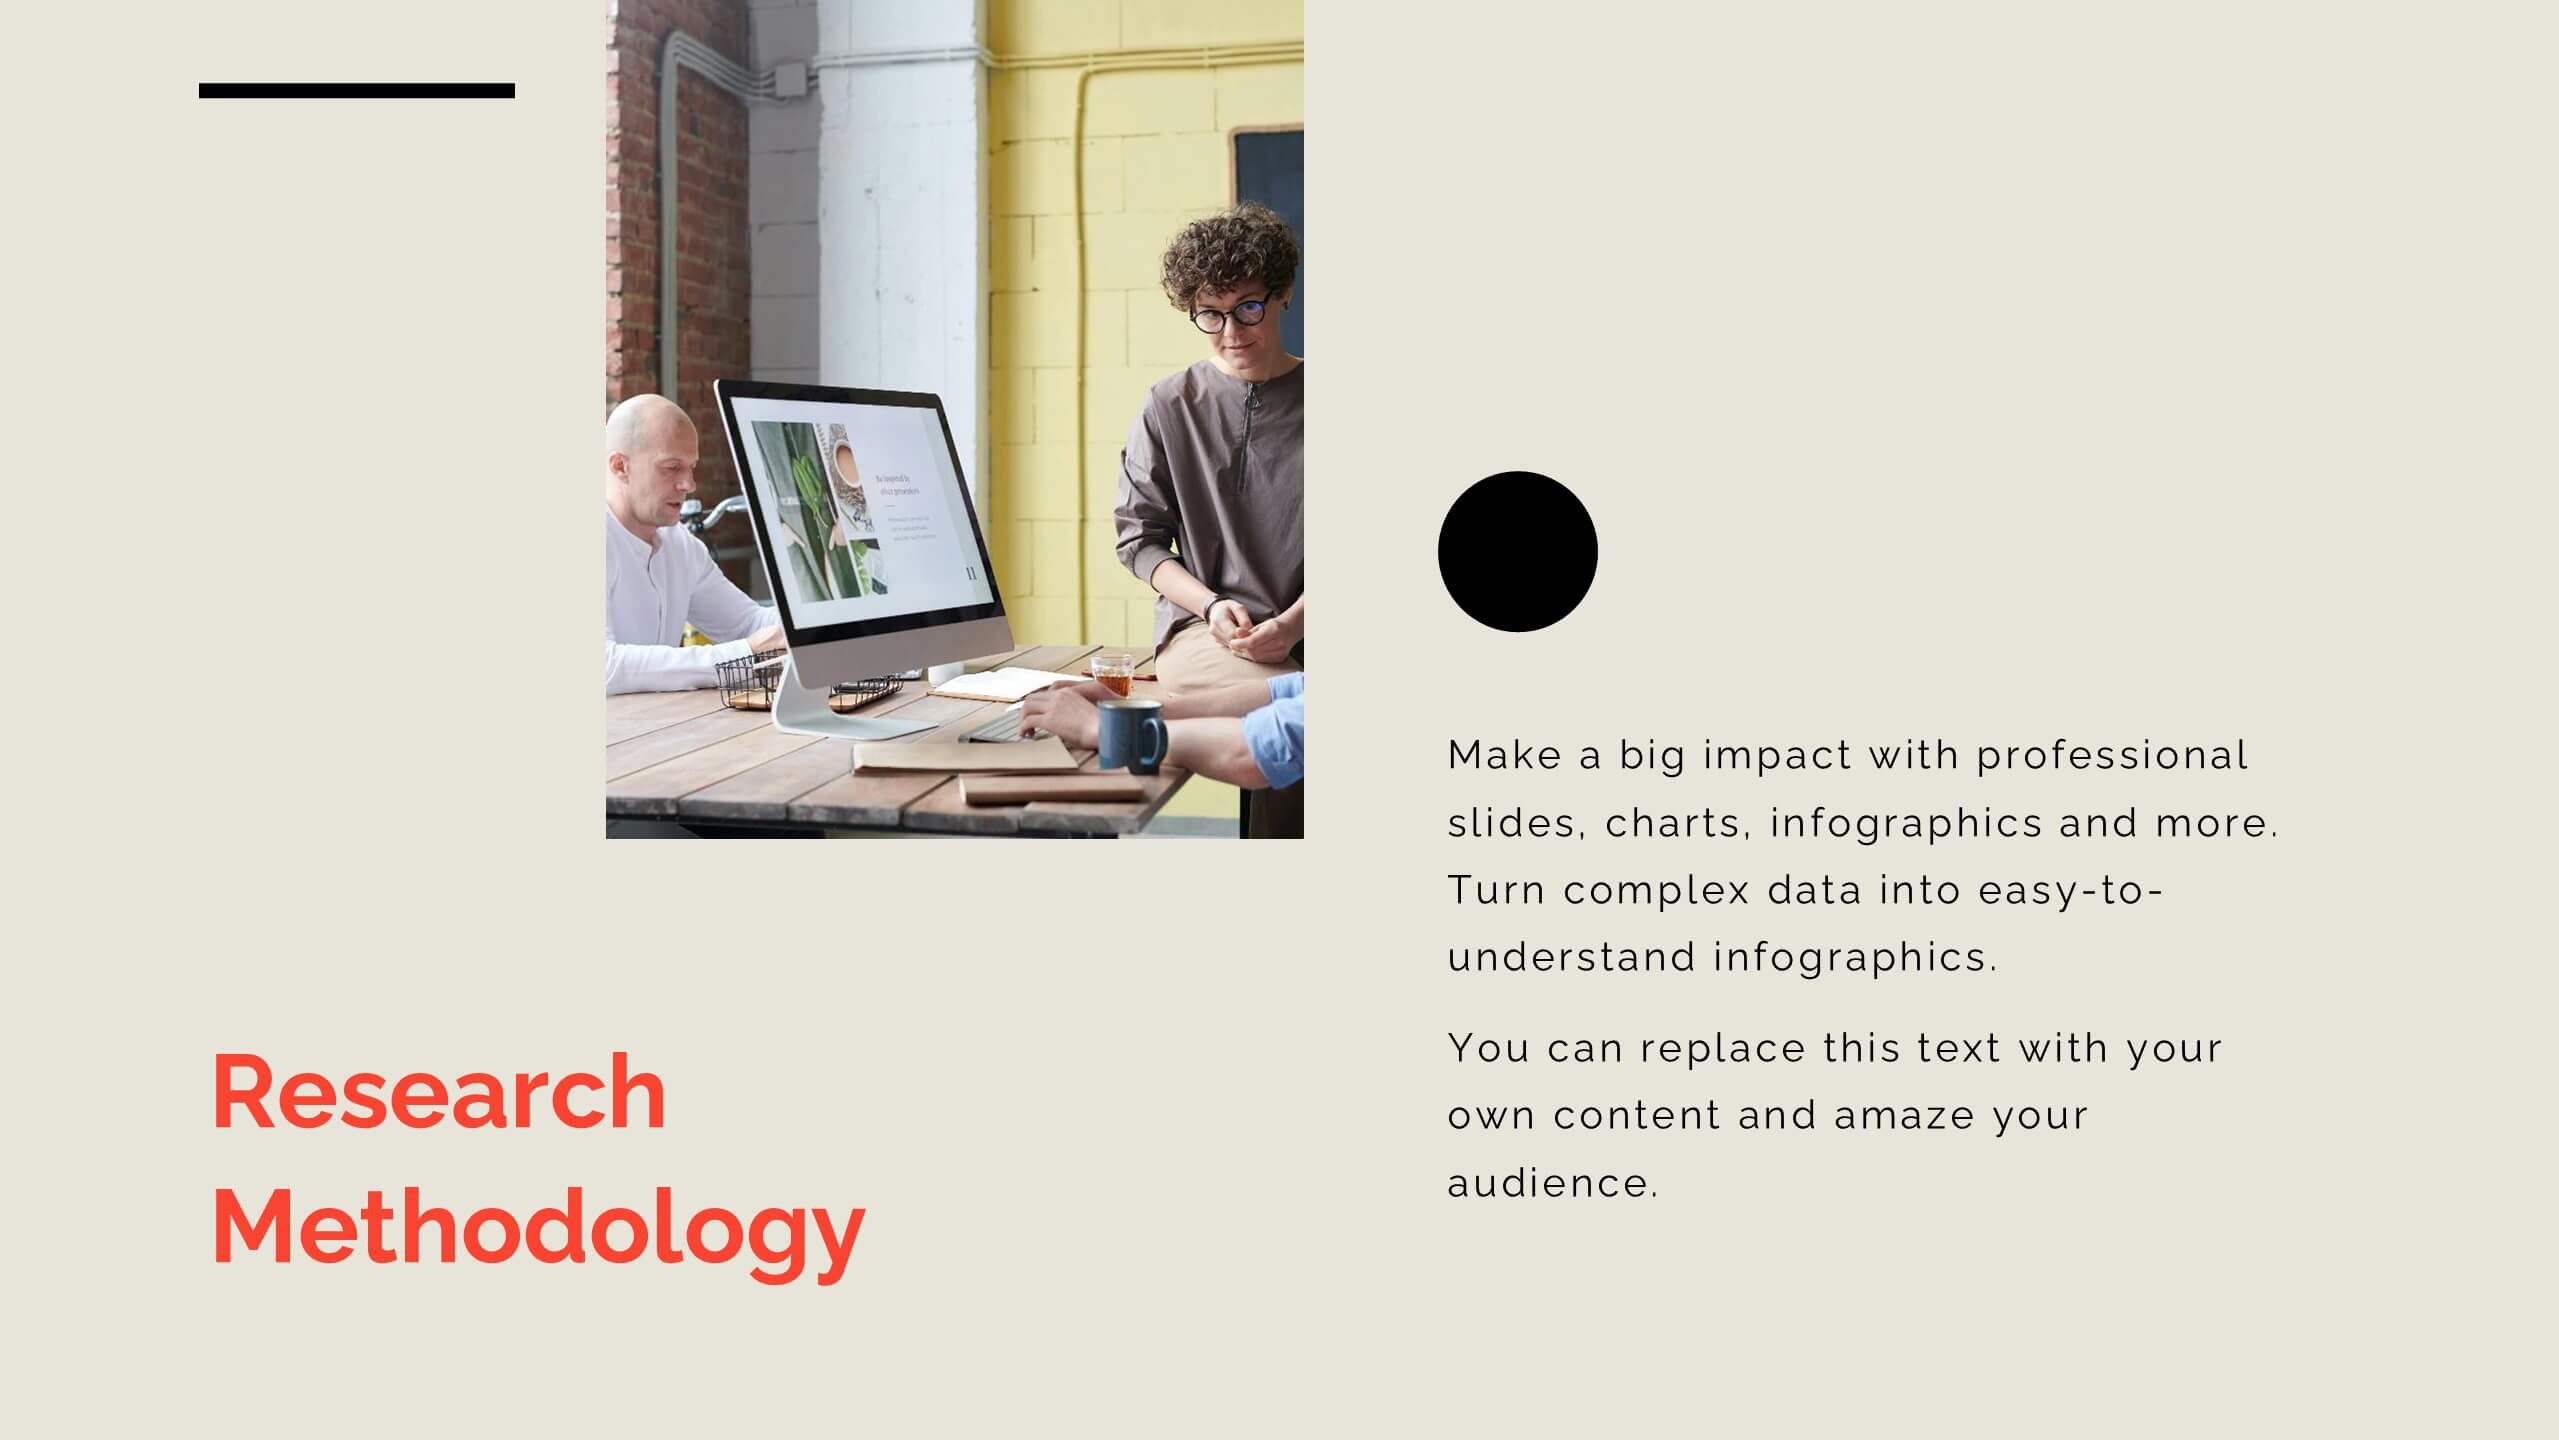
Aetherial UX Research Report Presentation
A professional and modern template for UX research presentations. Highlight key elements such as user personas, journey mapping, wireframes, and testing processes. Includes slides for accessibility considerations, design systems, and feedback iteration. Fully customizable and compatible with PowerPoint, Keynote, and Google Slides to deliver impactful insights and research findings.


6 diapositivas
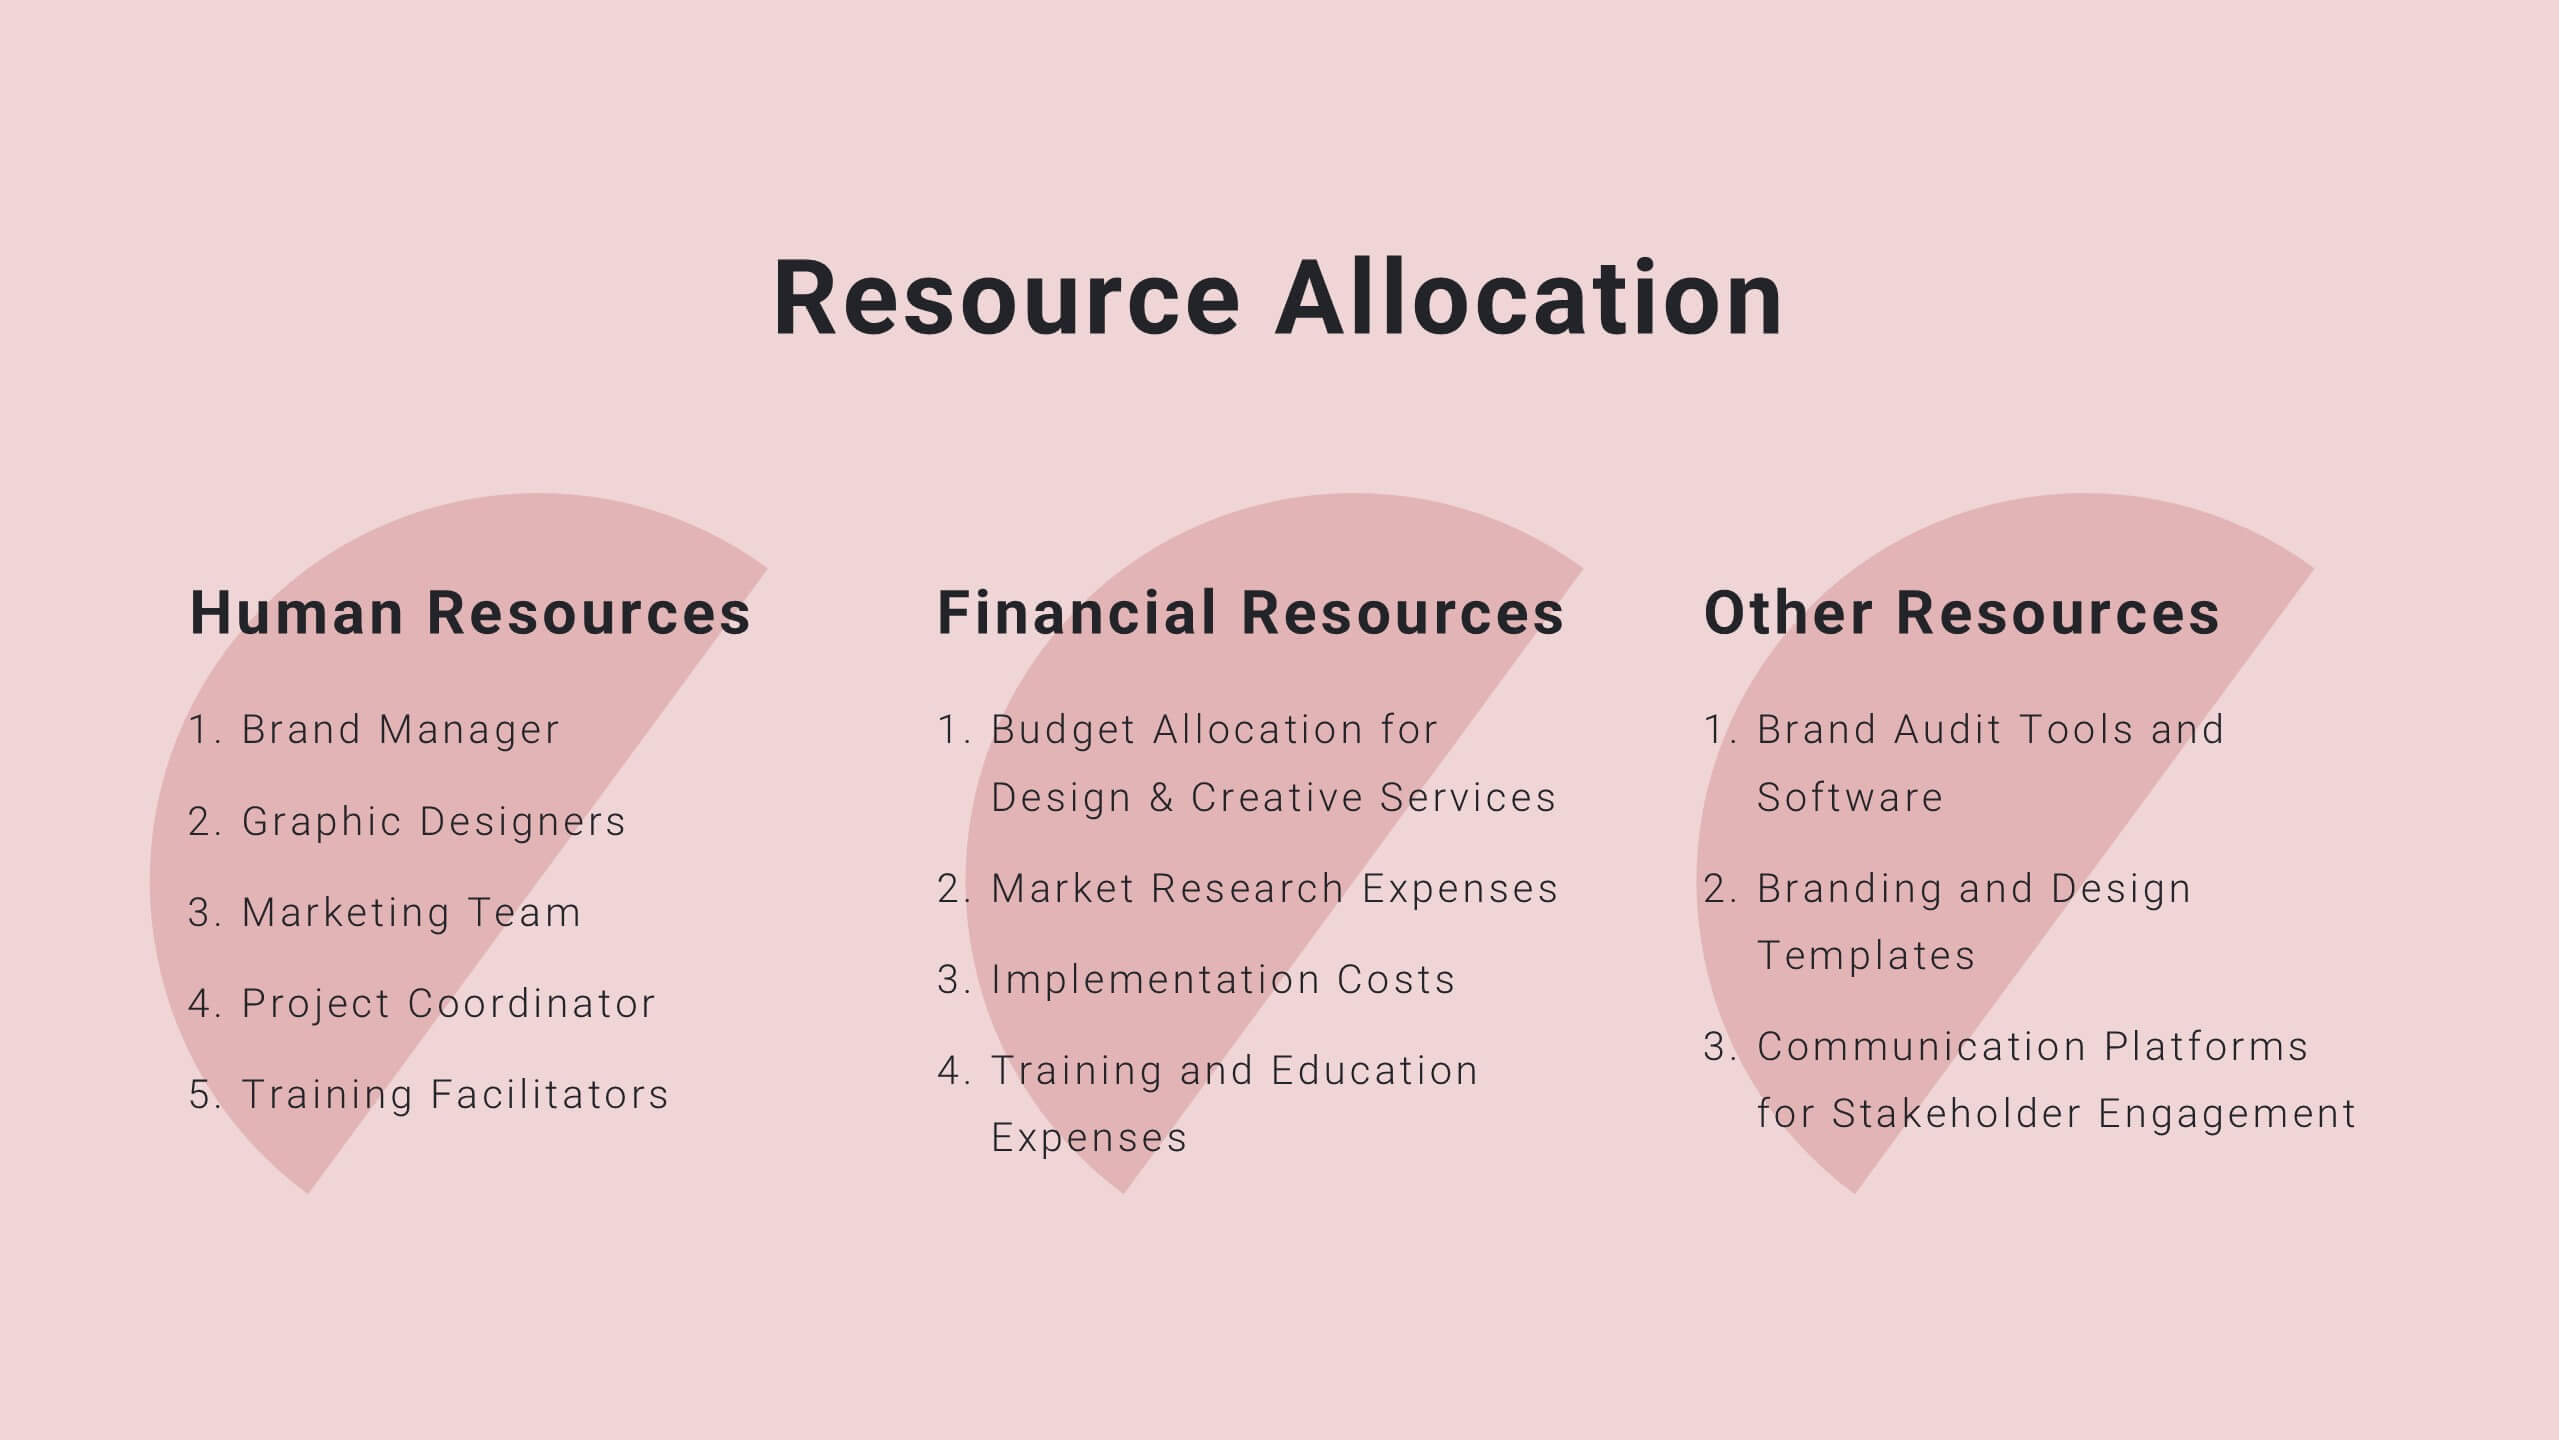
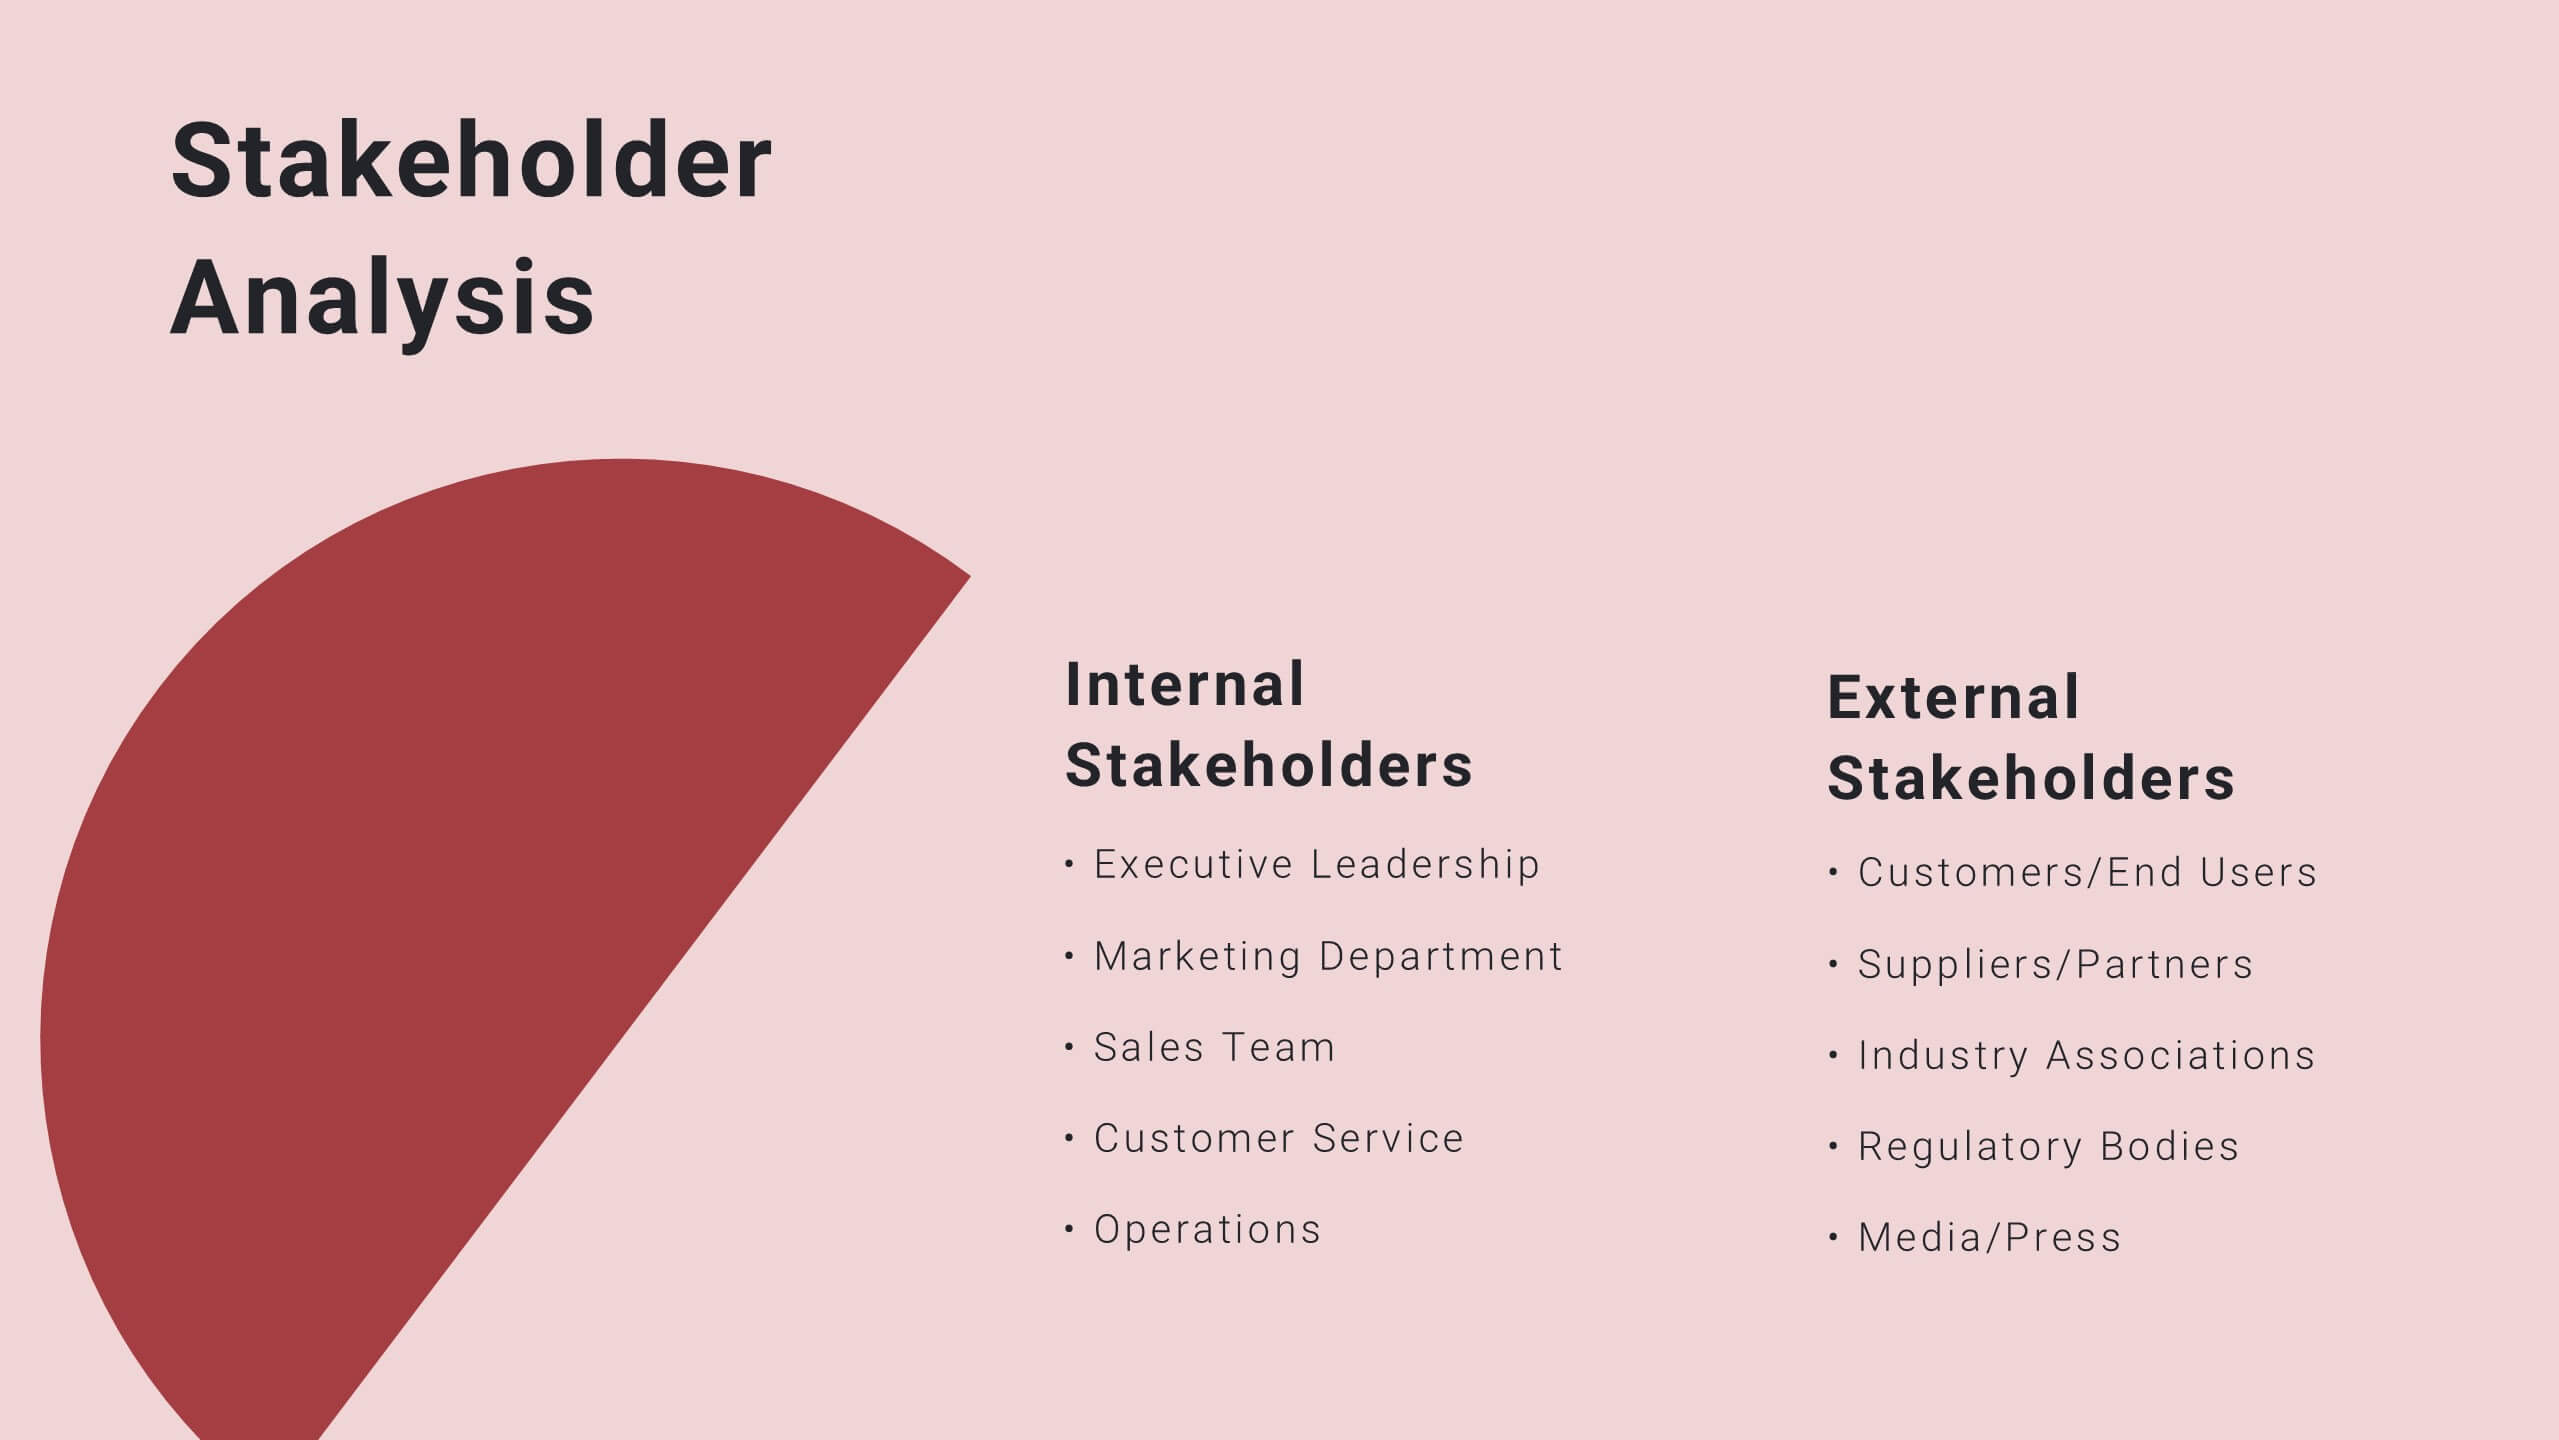
Resource Allocation and PM Strategy Deck Presentation
Break down project resources and team strategies using this dynamic visual dashboard. Track allocation, effort levels, or progress across roles in a clean, easy-to-follow layout. Fully editable in PowerPoint, Keynote, and Google Slides, this template helps project managers communicate priorities and responsibilities with clarity and impact.


26 diapositivas
Kohen Presentation Template
Kohen is a minimal coffee shop template that features slide designs you can use together, making it perfect for sharing your business and services. It is easy to use, resulting in convenient high quality presentations. This template design can be used to create more elaborate presentations about food and restaurants. It is complete with charts, images, and text boxes for endless presentation possibilities. This template will help make your message more compelling and informative. The presentation includes a variety of tools and resources, to highlight key points and ideas with minimal text.


8 diapositivas
Cognitive Psychology and Decision Making
Unlock the logic behind human choices with this eye-catching presentation template that puts cognitive puzzles into perspective—literally. Dive into how thought patterns, mental shortcuts, and biases influence decision making, all illustrated through clean visuals and digestible layouts. Easily customizable for PowerPoint, Keynote, and Google Slides.


7 diapositivas
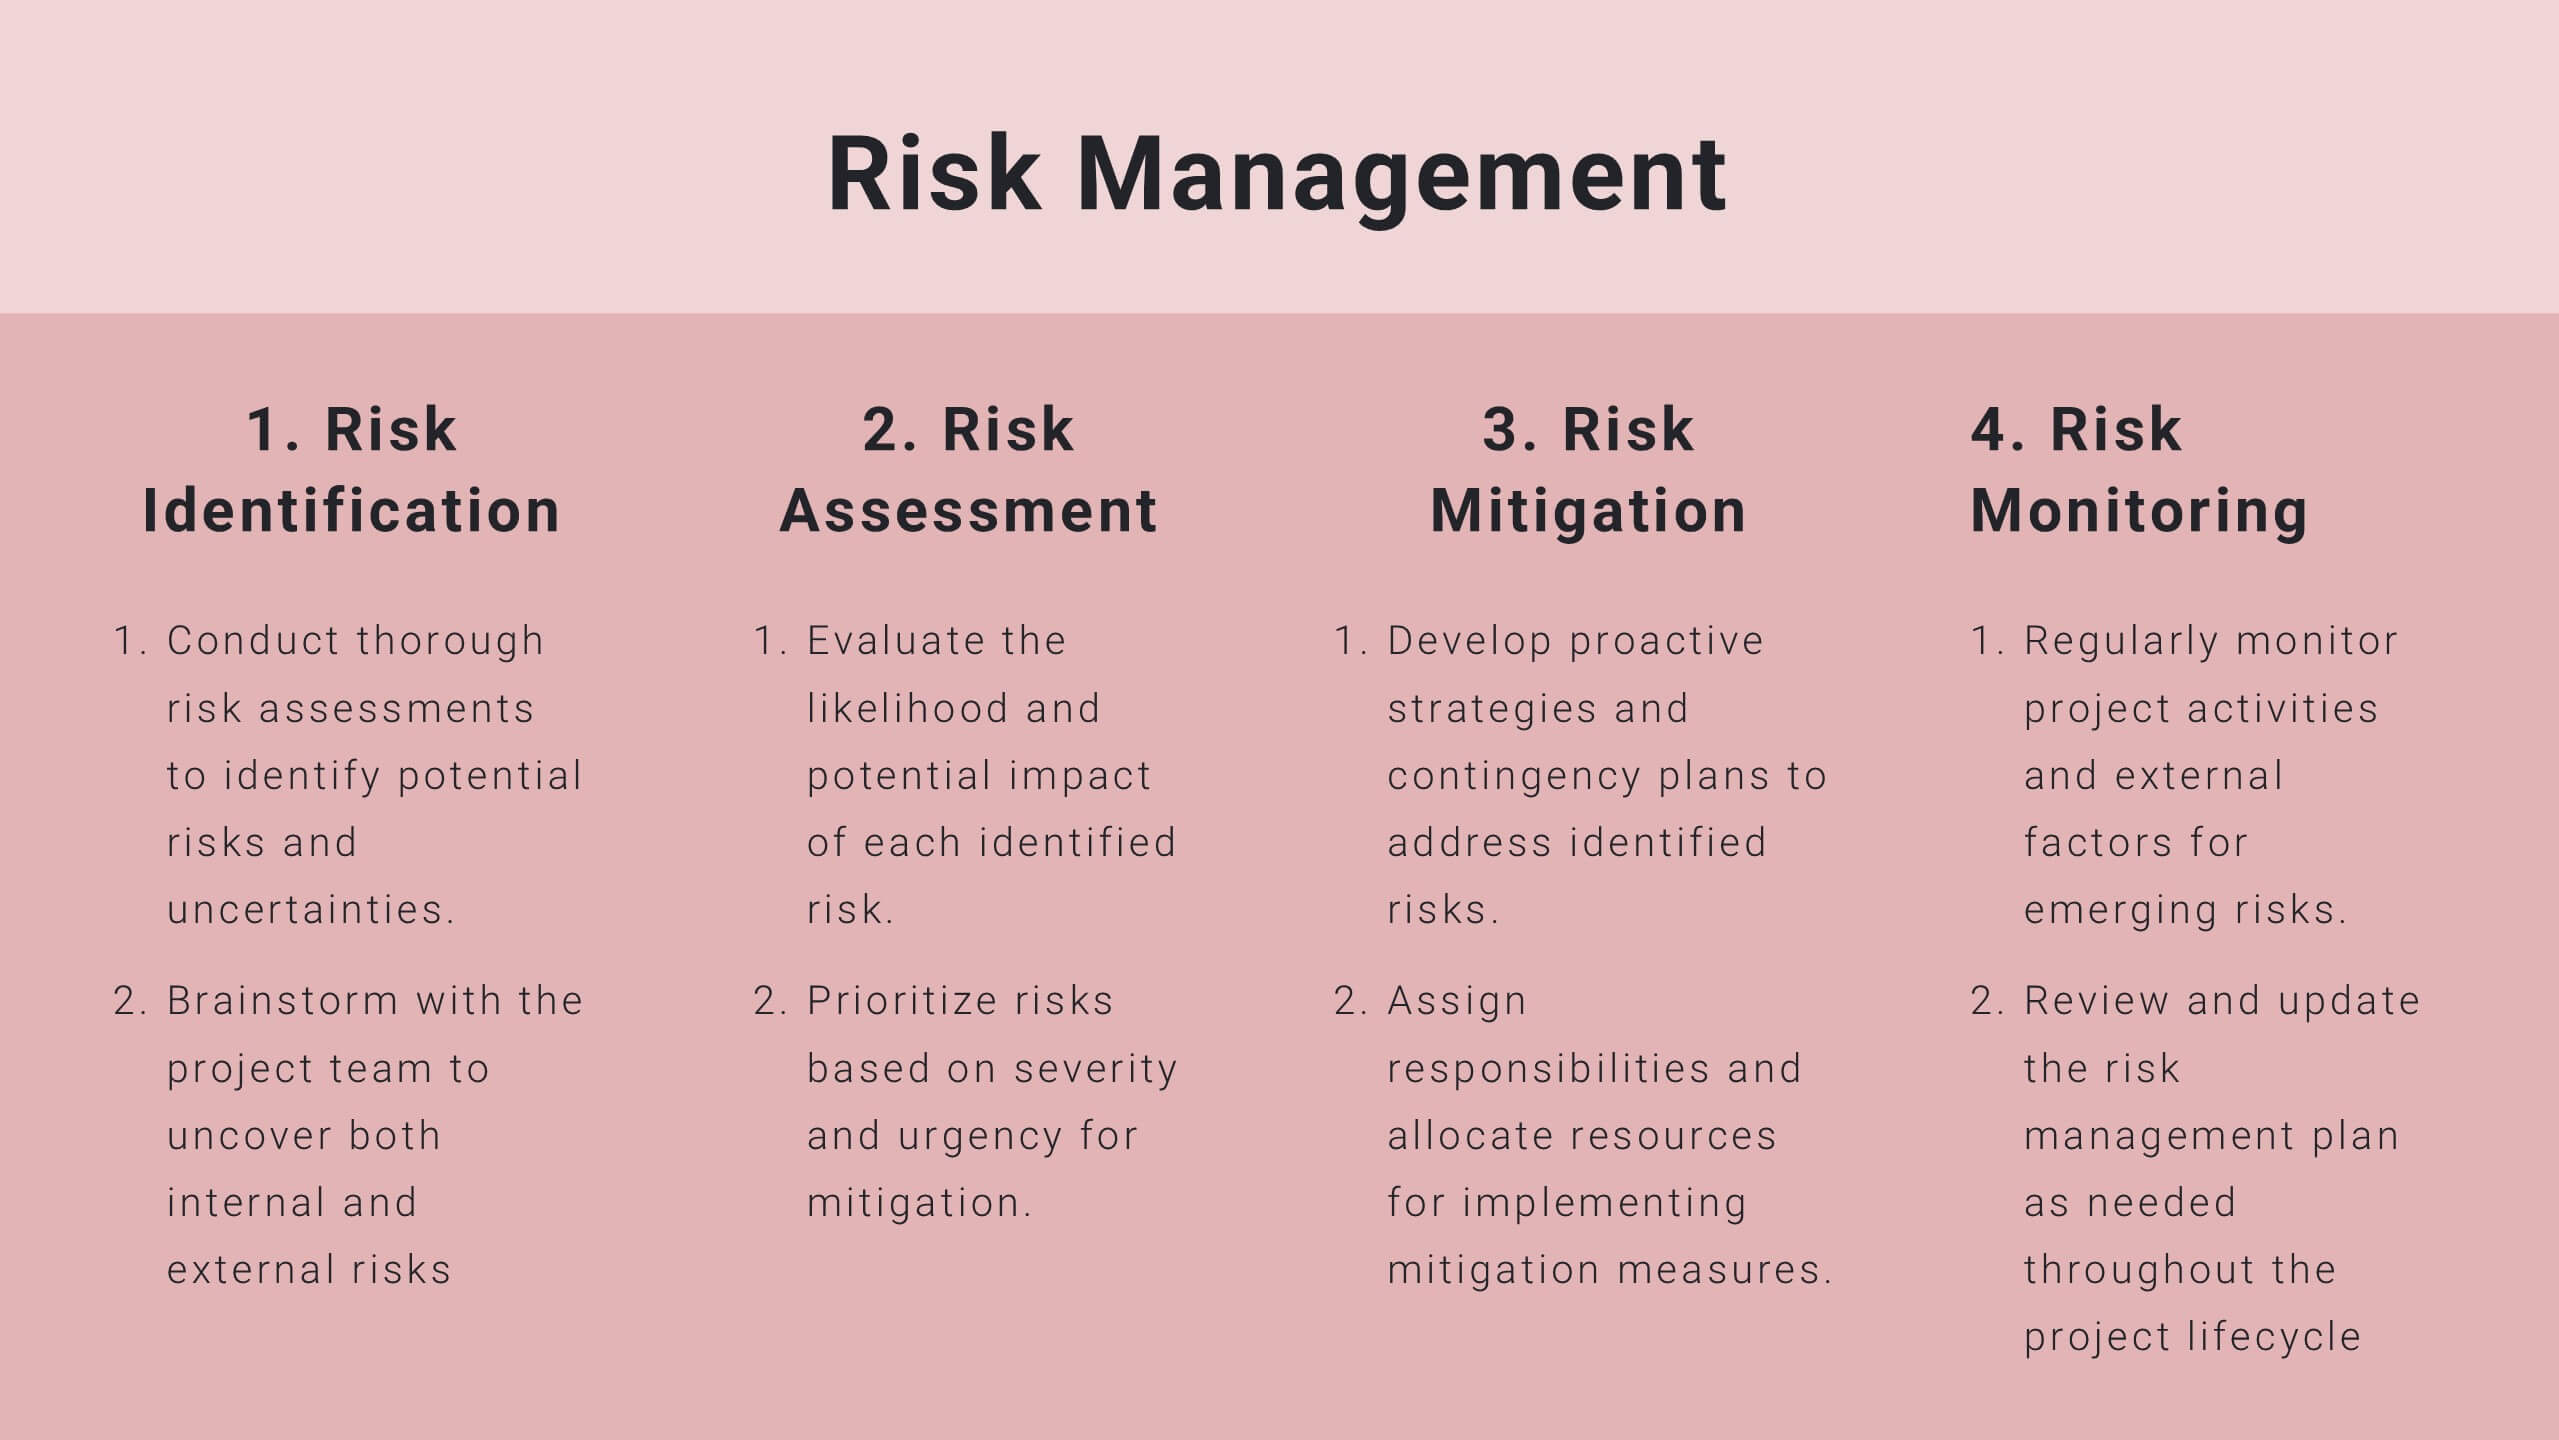
Risk Management Processes Infographic
A Risk Management infographic is a visual representation of the process of identifying, assessing, and mitigating risks in a particular context or organization. This template can be used to convey important information about potential risks and how they can be managed to minimize negative consequences and maximize positive outcomes. You can use this infographic for various purposes, such as to inform stakeholders, to guide decision-making, or to promote risk awareness and best practices. Compatible with Powerpoint, Keynote and Google Slides, this can be designed in different styles and formats.


6 diapositivas
Asia Map Population Infographic
Explore the demographic dynamics of Asia with our collection of infographic slides, designed to illustrate the population statistics across the continent. These templates are an essential tool for educators, demographers, and business analysts, providing detailed visualizations of population distribution, density, and growth trends. Each infographic combines the map of Asia with engaging graphical elements such as bar graphs, pie charts, and statistical callouts that emphasize key data points like total population, urban versus rural distribution, and demographic forecasts. The color-coding and spatial arrangements on the map effectively highlight variations and trends across different countries and regions, making complex data easy to understand and visually compelling. Fully customizable, these templates allow you to adjust the data presentation to suit specific needs or focuses, such as comparing population growth rates or highlighting demographic challenges. Whether used in presentations, reports, or educational materials, these slides offer a comprehensive and accessible way to communicate the demographic landscape of Asia.


5 diapositivas
Financial Growth and Spending Overview Presentation
Visualize financial progress with this clean, step-based diagram. Each stage highlights growth or spending insights using stacked icons and upward arrows for easy interpretation. Perfect for reports, planning, or forecasts. Fully editable in Canva, PowerPoint, and Google Slides, it brings structure and clarity to your financial storytelling.


20 diapositivas
Axisflare Artist Portfolio Presentation
Showcase your creative journey with this vibrant artist portfolio template, featuring sections for project highlights, philosophy, style, and client testimonials. Ideal for presenting your work and artistic approach, this template is compatible with PowerPoint, Keynote, and Google Slides for seamless presentation across various platforms.


7 diapositivas
Vision Infographic
Elevate your presentations with our range of Slide Templates, tailored to showcase long-term objectives and strategies. These designs vary from simple and clean to bold and engaging, ensuring that every slide effectively communicates your forward-looking plans. Each template is crafted for easy customization to suit your brand's style, including areas for essential details, data representation, and motivational elements. They are perfect for aligning your team, engaging stakeholders, and promoting strategic discussions. Ideal for business presentations, team meetings, and motivational sessions, these templates offer a professional way to present your future goals and engage your audience effectively.


7 diapositivas
Digital Marketing Infographics Presentation Template
Digital marketing is essential for your business and brand awareness. From website design to social media advertising, learn about all the ways digital marketing can help grow your company with this template. Digital marketing can be a powerful and effective way to promote your business.