


Características


¿Tienes alguna pregunta?
Recomendar


5 diapositivas
Supply Chain Management Infographics
Navigate the intricacies of logistics with our supply chain management infographics. This template, designed in a spectrum of strategic blues, combines a vertical, informative, and creative style, making complex data accessible. Is ideal for business analysts, and students who seek to visually convey the nuances of supply chain. The design incorporates detailed graphics and descriptive icons, all curated to facilitate a clearer understanding of supply chain. This infographic is the key to unlocking streamlined communication and enhanced comprehension of multifaceted logistical operations within corporate presentations, academic materials, or professional seminars.


6 diapositivas
5-Stage Circular Cycle Presentation
Energize your workflow with a clean, circular layout that turns five interconnected steps into a clear, engaging story. This presentation helps you explain any repeating process or continuous cycle with simplicity and flow, making complex ideas easier to follow. Compatible with PowerPoint, Keynote, and Google Slides.


4 diapositivas
Key Pillar Infographic Slide Presentation
Make your ideas stand tall with this modern pillar-themed infographic layout. Perfect for illustrating strategies, business foundations, or organizational principles, it transforms complex data into visually clear, structured visuals. Fully editable and compatible with PowerPoint, Keynote, and Google Slides for professional and easy-to-customize presentations.


5 diapositivas
Regional Sales Heatmap Presentation
Showcase performance by region with this Regional Sales Heatmap Presentation. This template highlights U.S. state-by-state sales data using gradient color coding and a clear legend system. Easily customizable for quarterly reports, territory analysis, or sales strategy reviews. Compatible with PowerPoint, Keynote, and Google Slides.


15 diapositivas
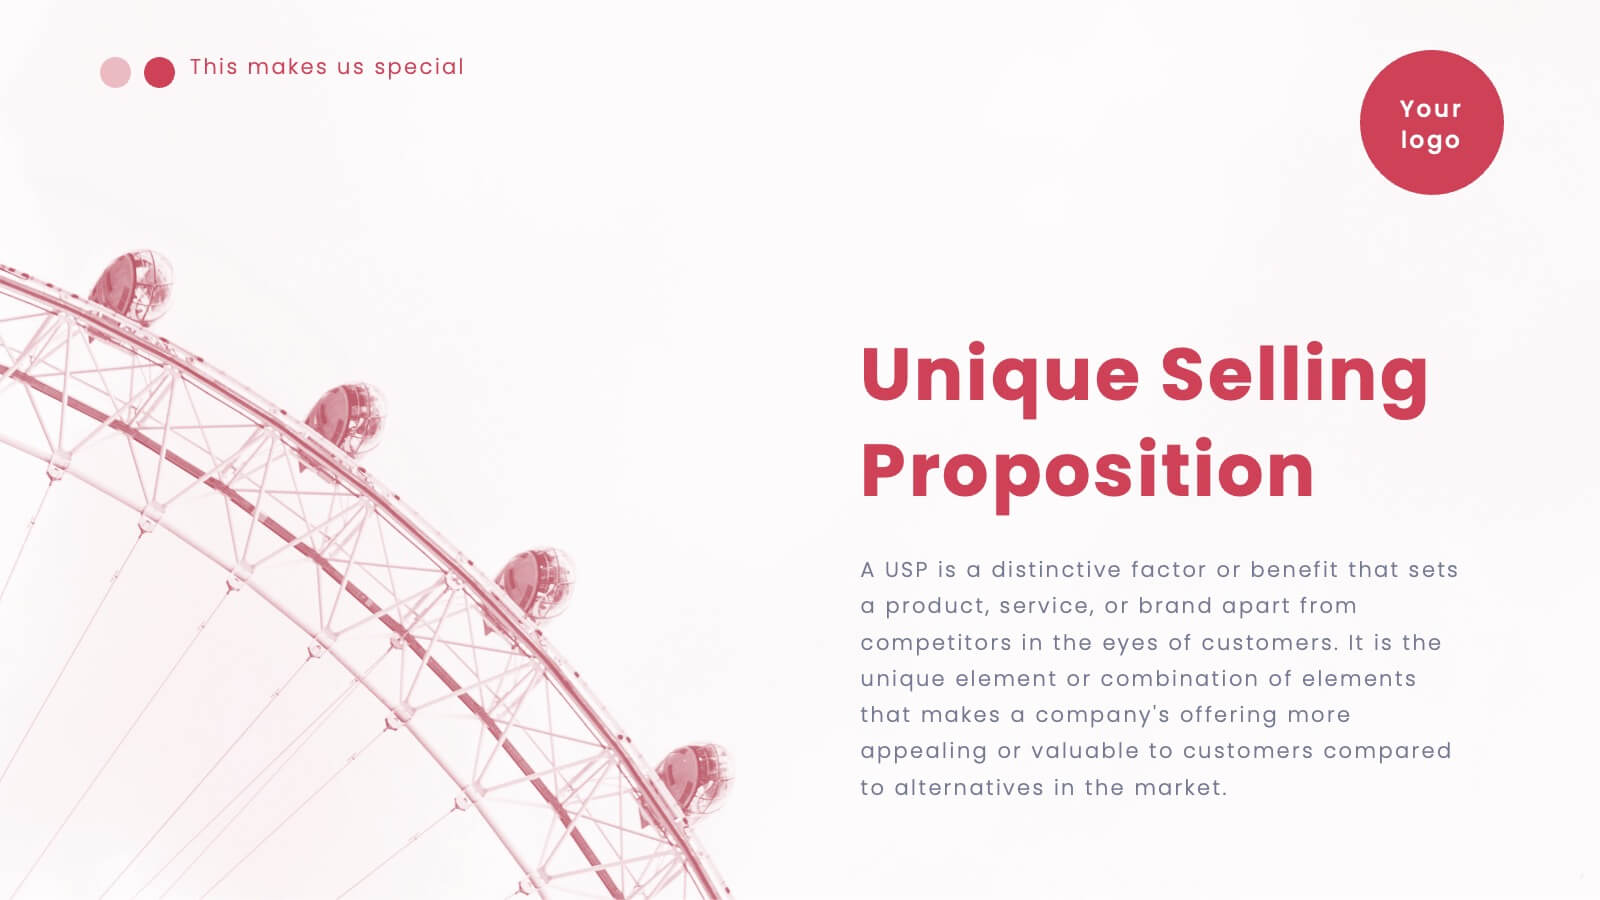
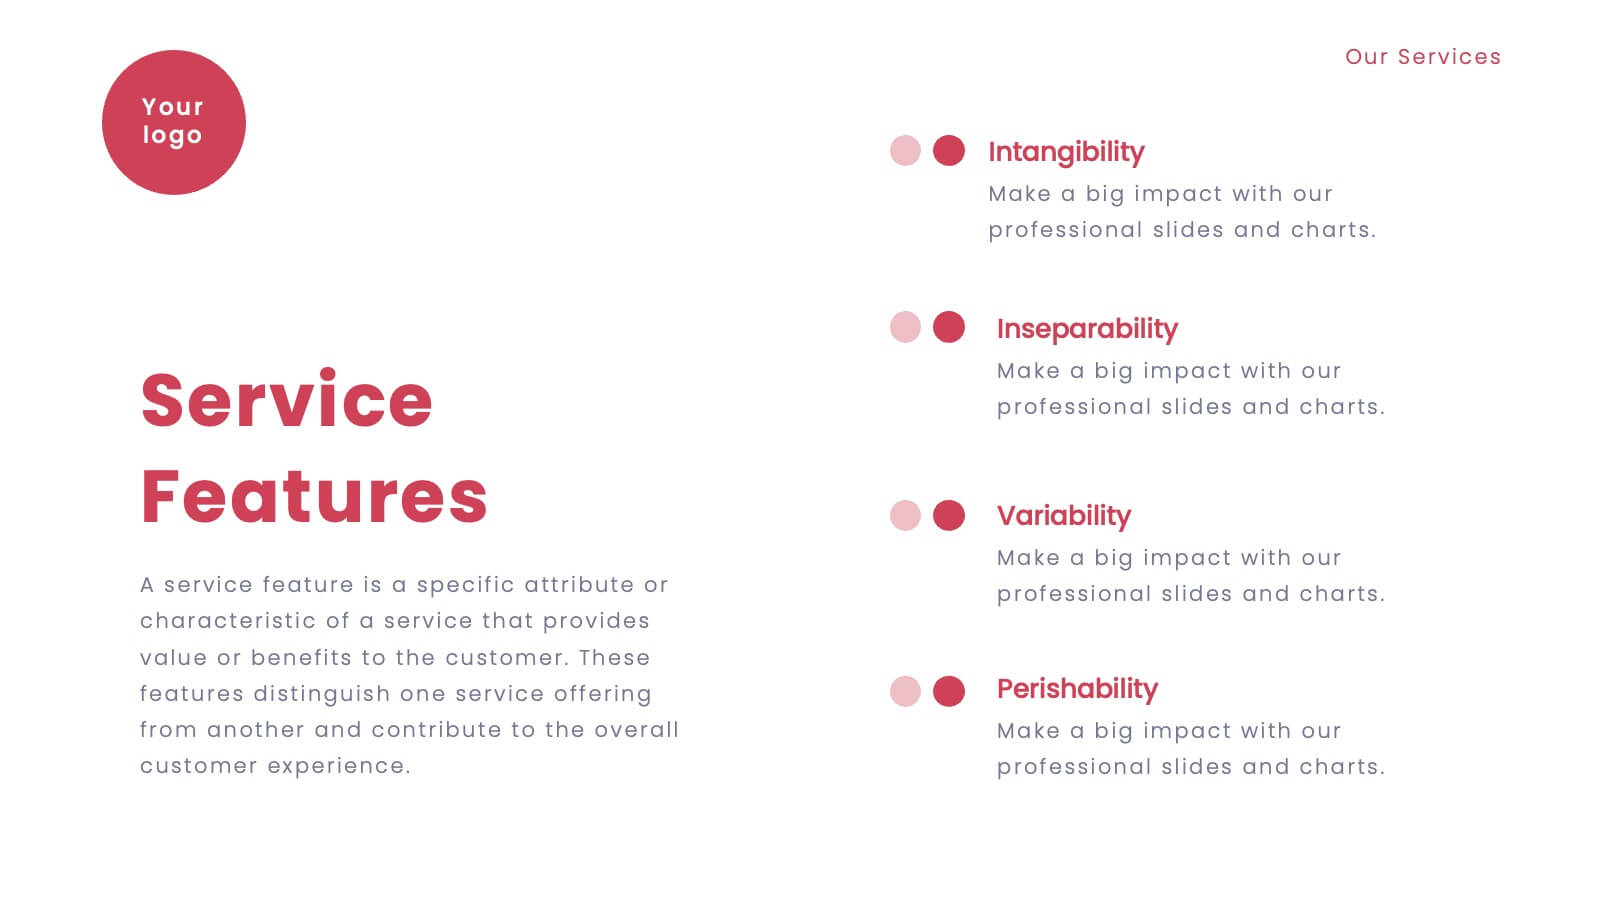
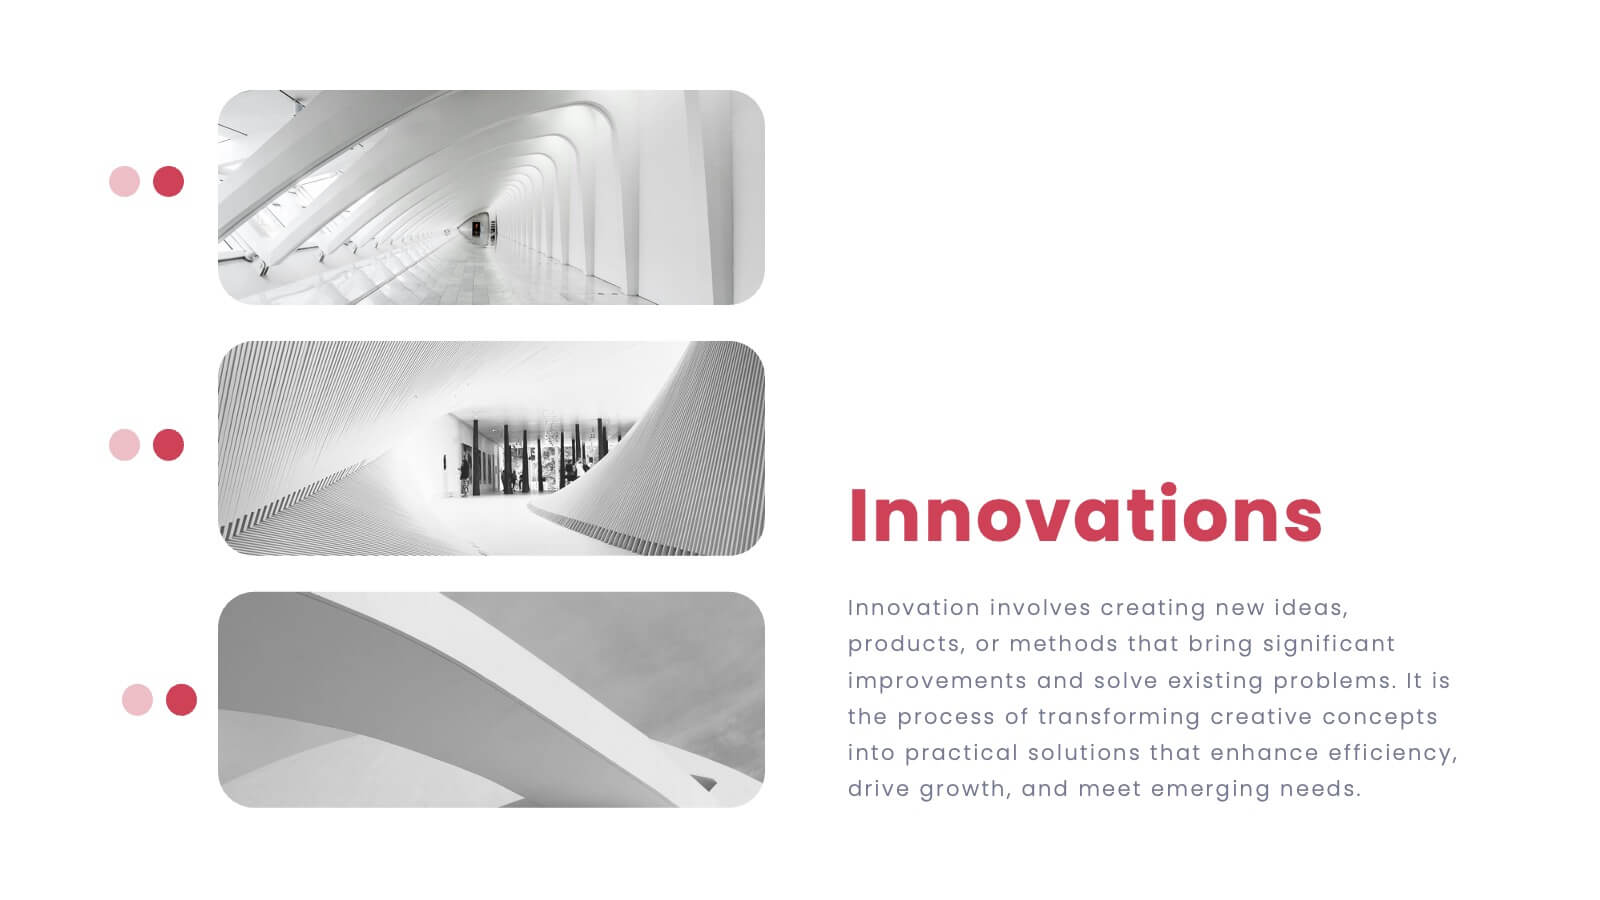
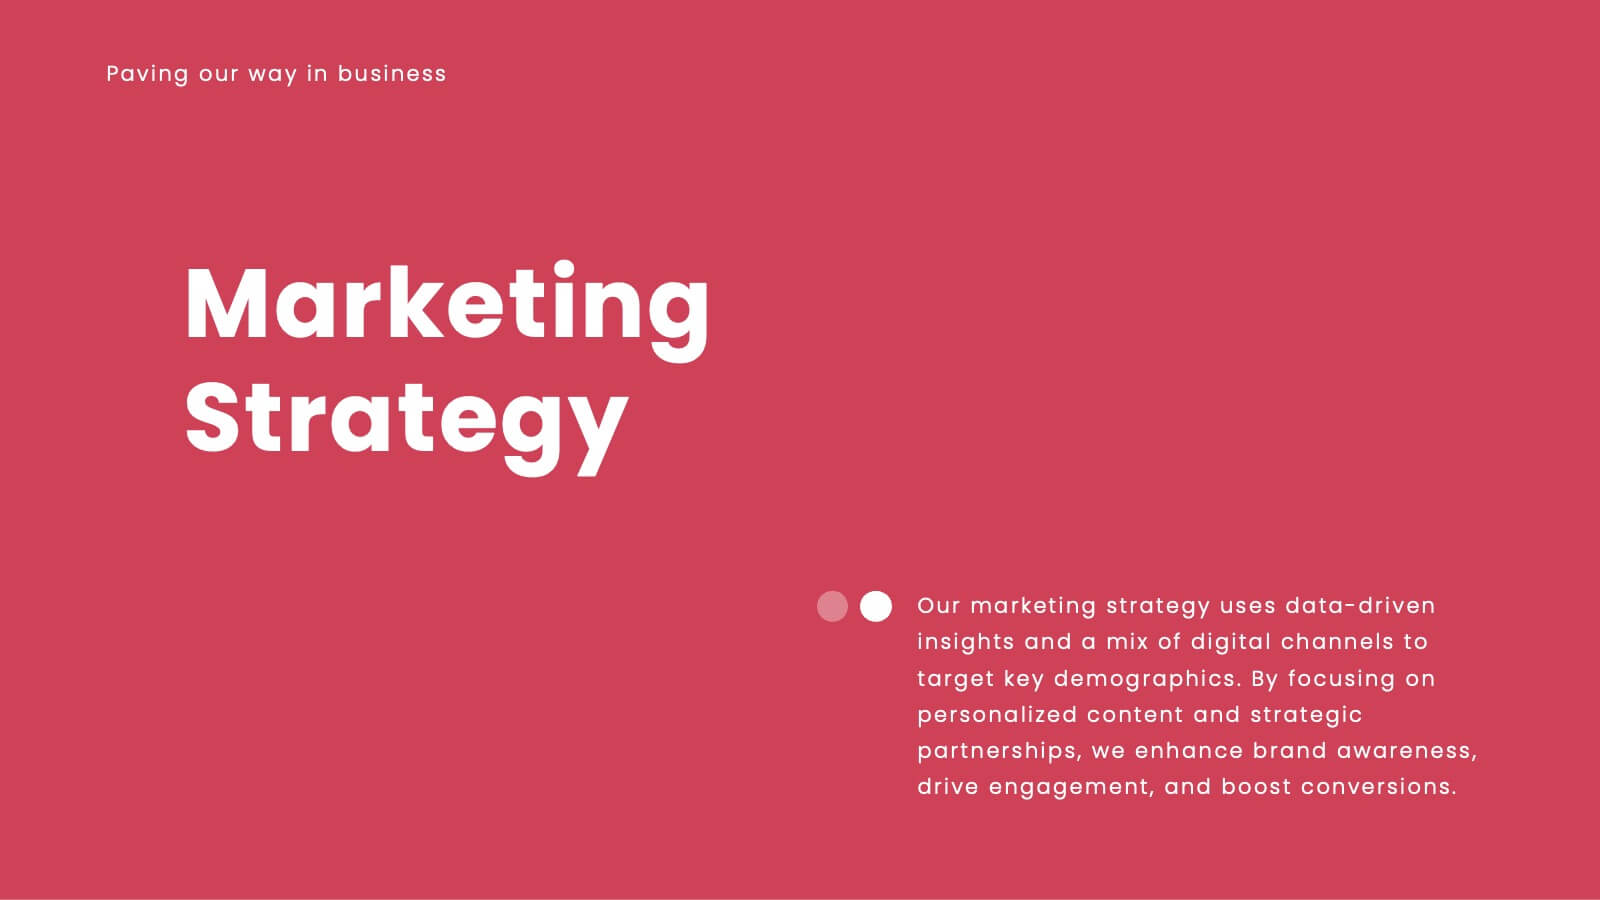
Business Proposal Infographic
A business proposal is a formal document that outlines a specific business endeavor, project, or venture, and presents a persuasive argument for why the proposed approach or solution is viable and advantageous. This infographic template is a tool for the business world to communicate business ideas, pitch a product or service, secure funding or partnerships, or enter into a business agreement. Fully customizable and compatible with Powerpoint, Keynote, and Google Slides. Showcase your unique value proposition and unveil how it fuels your journey to success. Energize your business propositions and set the stage for success!


23 diapositivas
Stormrider Business Plan Presentation
This Business Presentation Template is designed to help you deliver structured and professional content for conferences, meetings, and corporate events. Featuring key sections such as objectives, speaker introductions, panel discussions, and networking breaks, it ensures a smooth and engaging experience. Fully customizable and compatible with PowerPoint, Keynote, and Google Slides.


21 diapositivas
Sable Design Portfolio Presentation
Elevate your creative portfolio with the Sable Design Portfolio Presentation template! This stylish and professional template is perfect for showcasing your design projects, whether you’re a graphic designer, UI/UX expert, or creative professional. Start with a captivating introduction, and lead your audience through a journey of your design process, from concept development to final execution. Highlight your unique approach with dedicated slides for your color palette, typography choices, and moodboards. The template also includes sections for prototyping, feedback, and iterations, ensuring your design evolution is clearly communicated. The clean and modern layout not only keeps your presentation visually appealing but also makes your work the star of the show. Customizable and easy to use, this template is compatible with PowerPoint, Keynote, and Google Slides, allowing you to impress your clients, employers, or peers with a polished and cohesive presentation of your best work.
8 diapositivas
OKR Strategy Tracker Presentation
Bring your goals to life with a dynamic, structured layout that tracks objectives, measures results, and keeps teams aligned from start to finish. Ideal for strategic planning, quarterly reviews, or business updates, this presentation makes performance tracking effortless. Compatible with PowerPoint, Keynote, and Google Slides for full customization.


4 diapositivas
Strategic Gap Planning Template Presentation
Visually map the journey from current state to strategic goals with this puzzle-themed gap analysis template. Ideal for identifying key disconnects, setting priorities, and aligning teams. Fully editable and designed for clarity, this presentation works in PowerPoint, Keynote, and Google Slides—perfect for planning sessions, roadmaps, and executive briefings.


5 diapositivas
Data-Driven Statistics Slide Presentation
Turn your numbers into a story that’s clear, bold, and easy to follow. This modern layout is perfect for presenting metrics, comparisons, or performance insights with precision and style. Customize colors, data, and text effortlessly—compatible with PowerPoint, Keynote, and Google Slides for seamless editing and presentation flexibility.

22 diapositivas
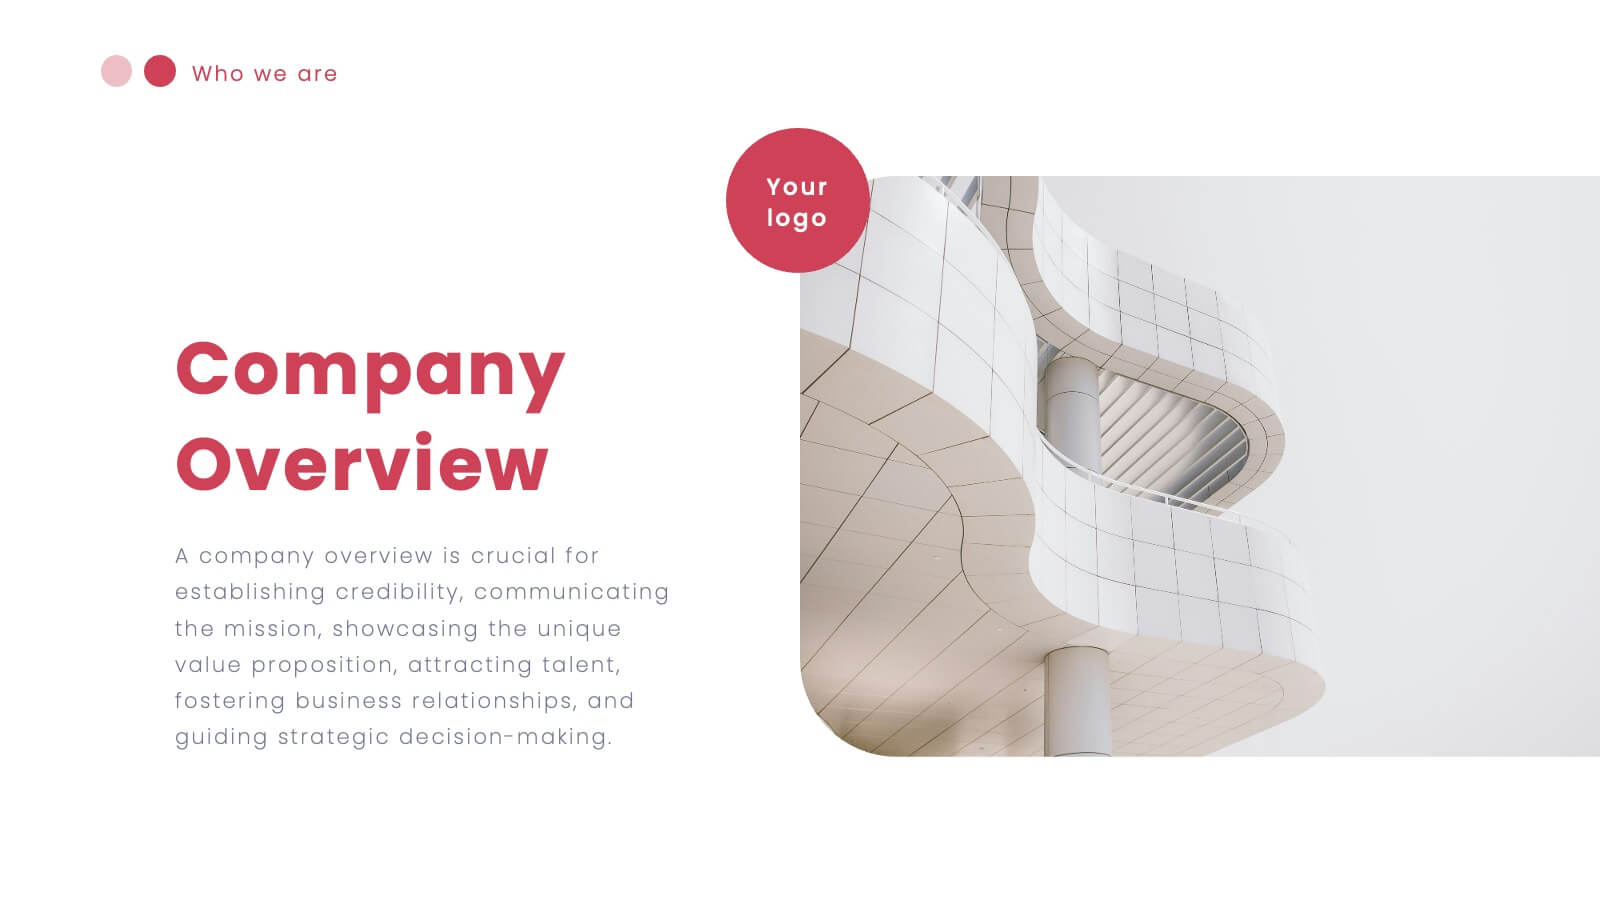
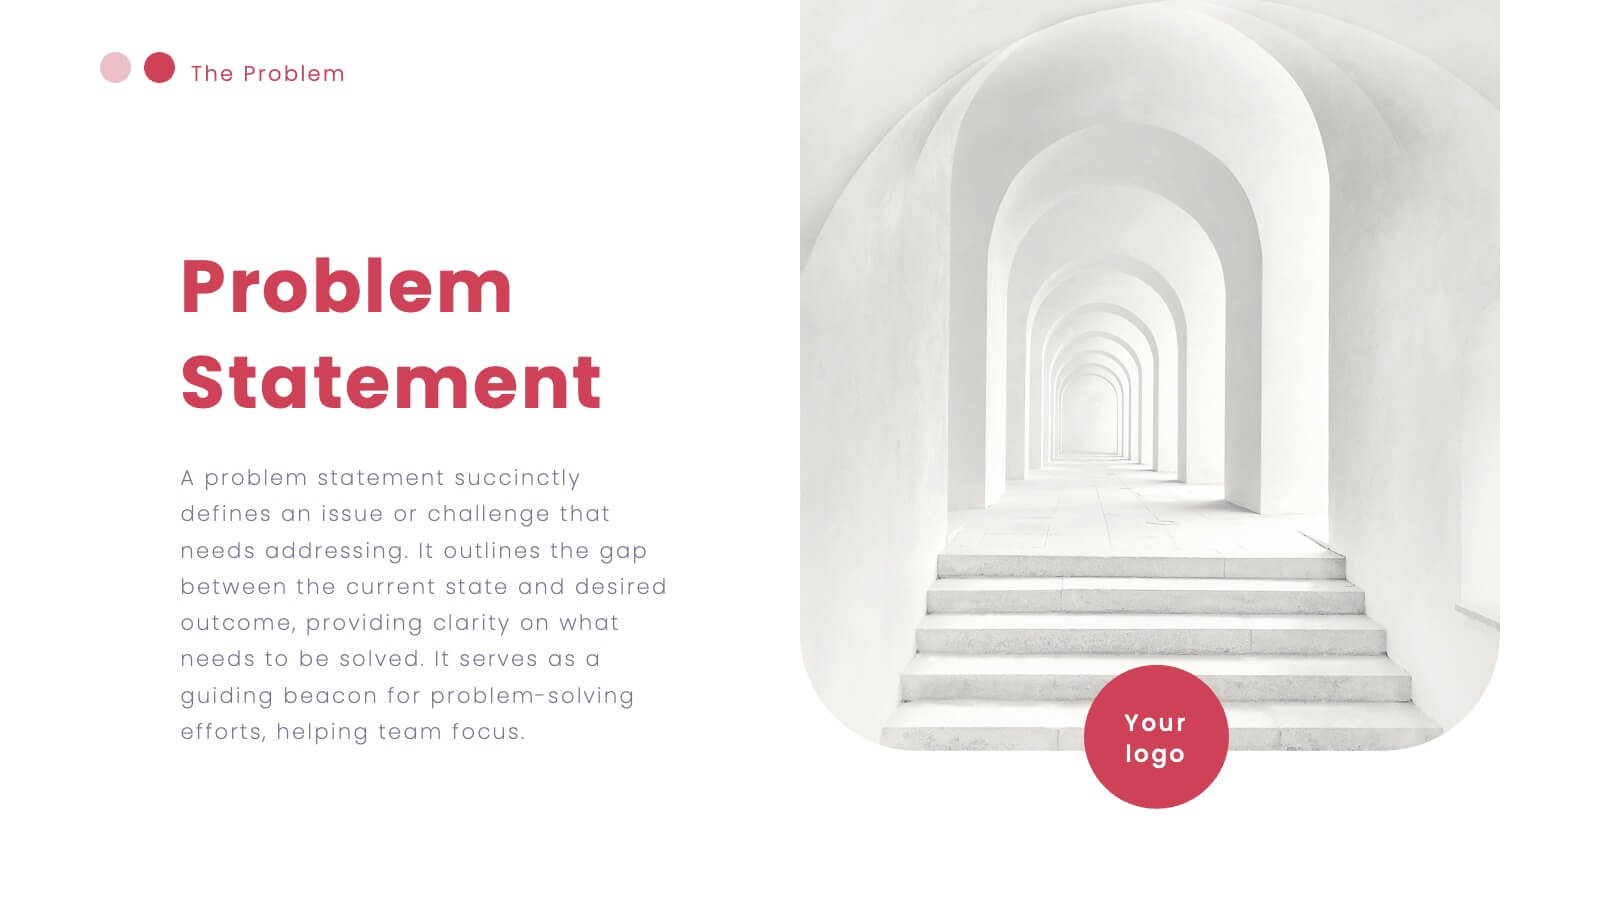
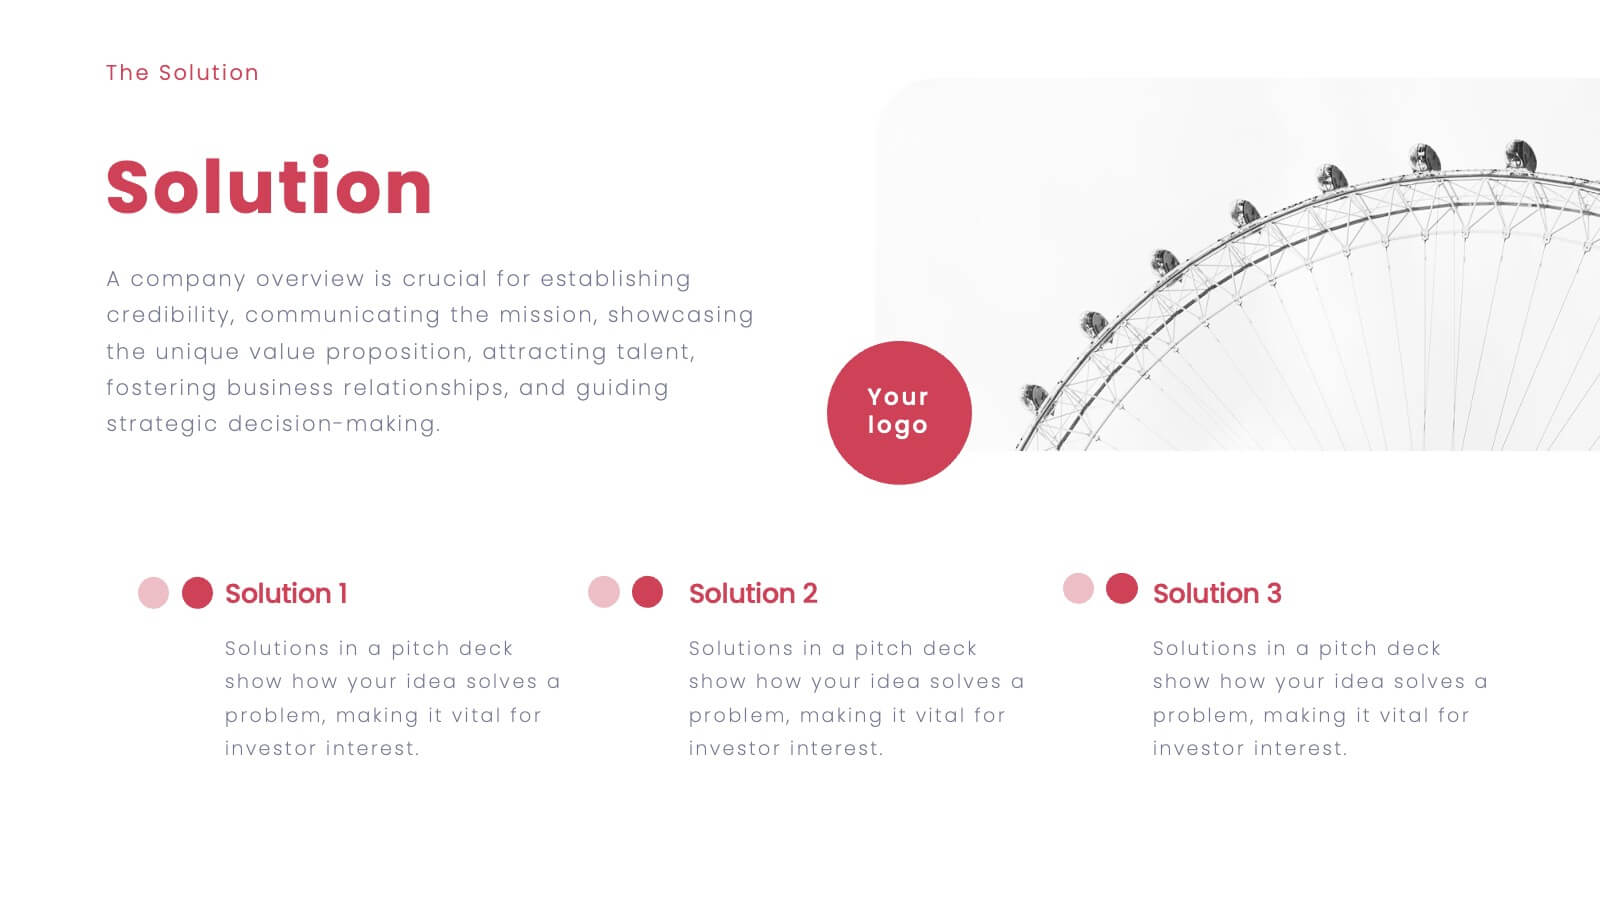
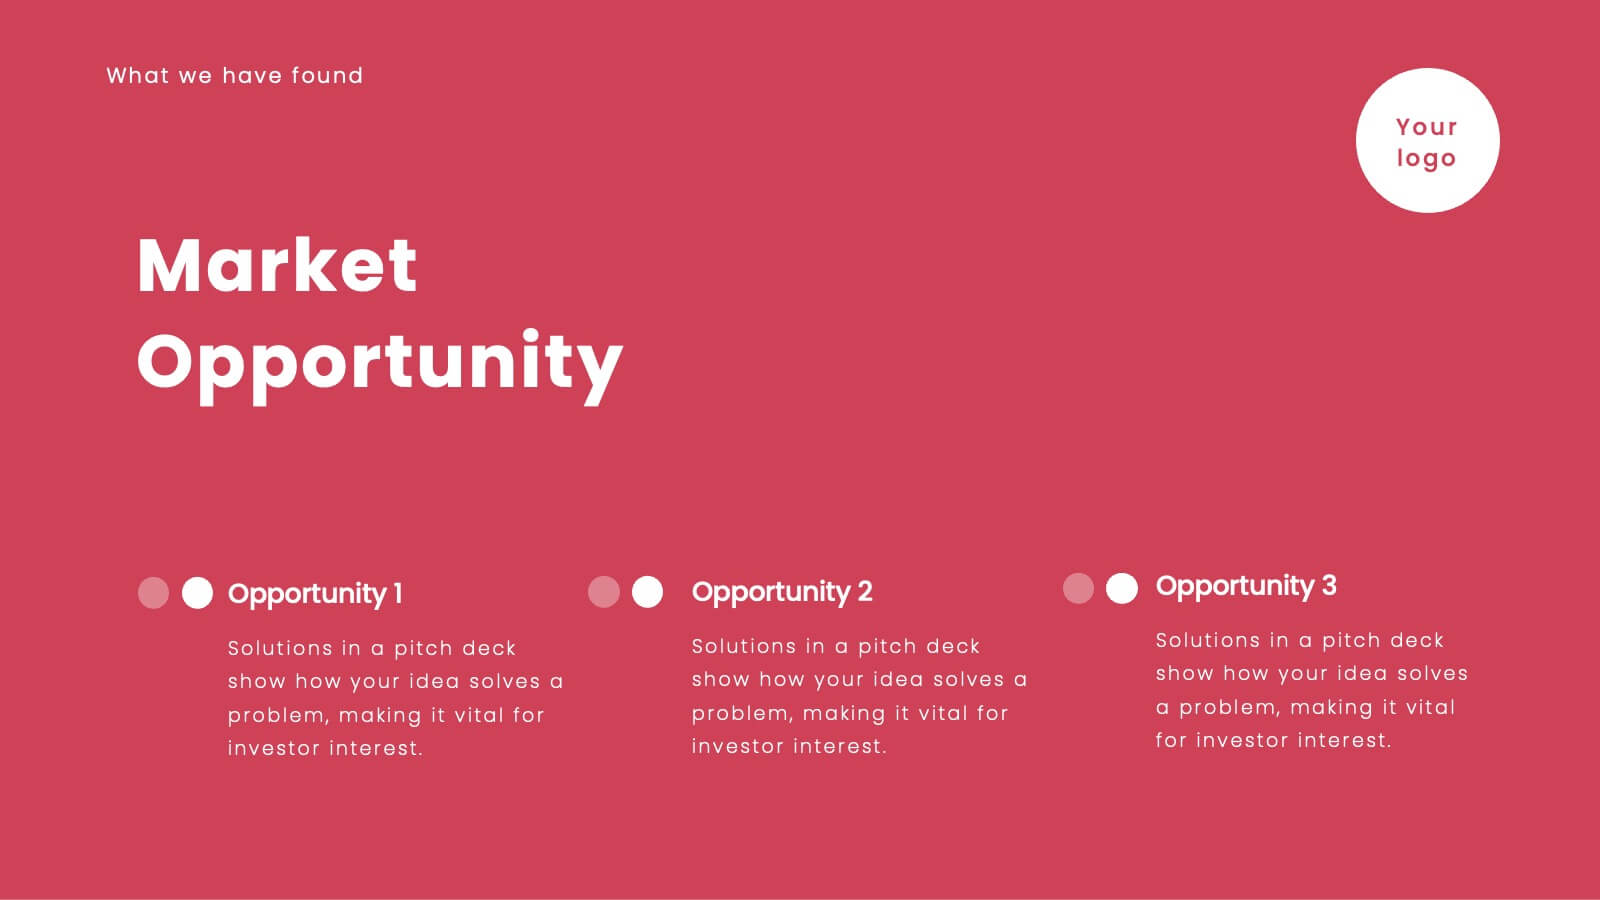
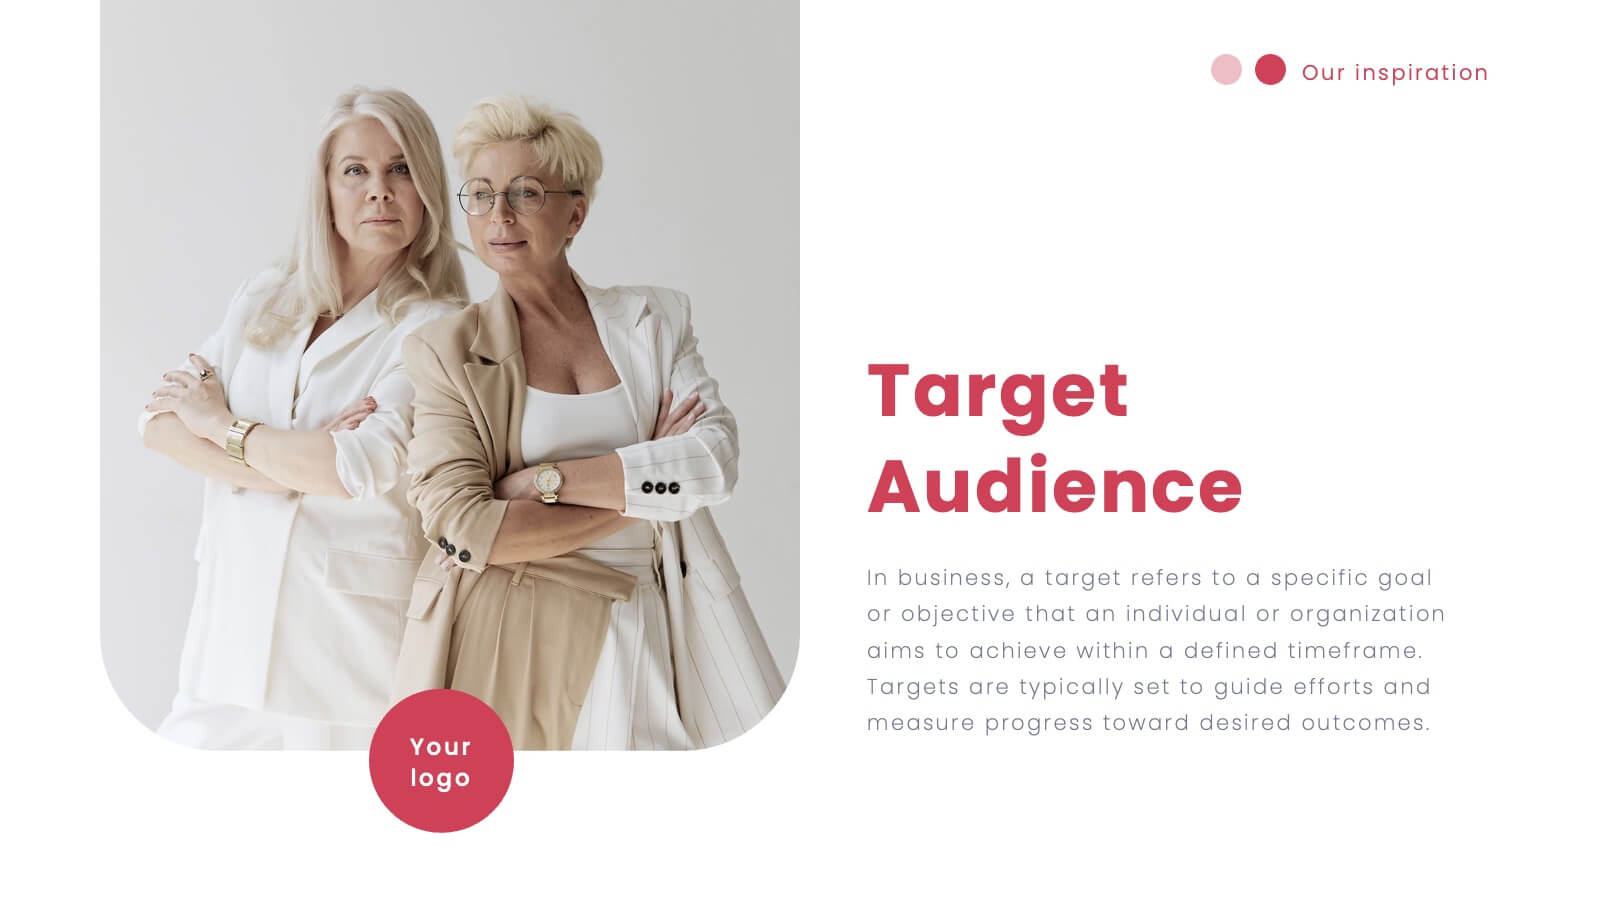
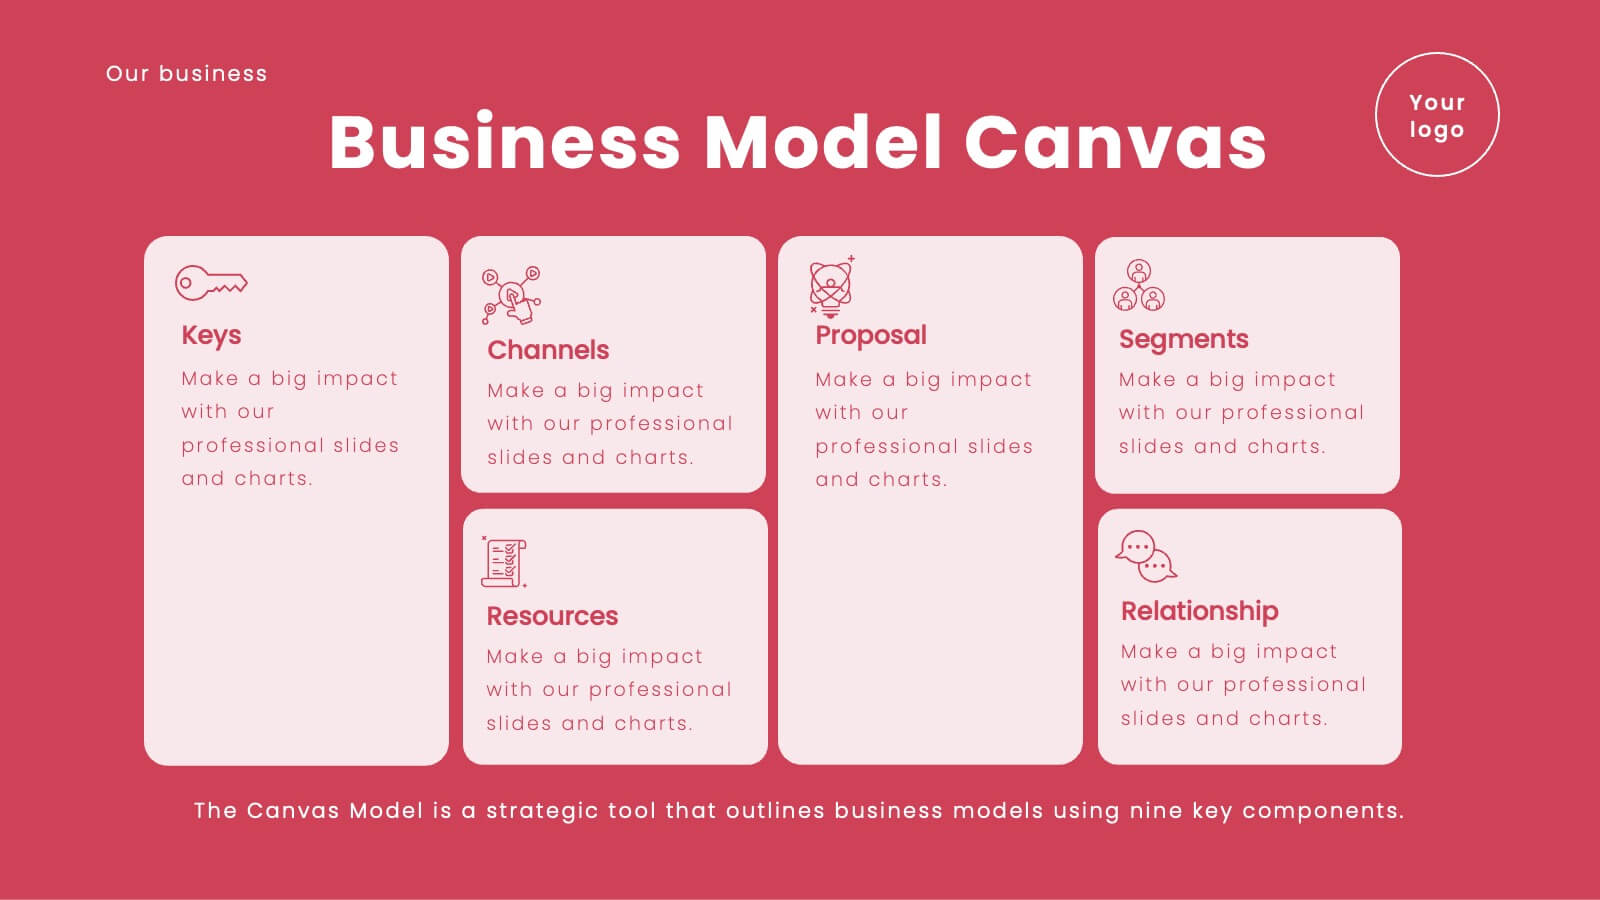
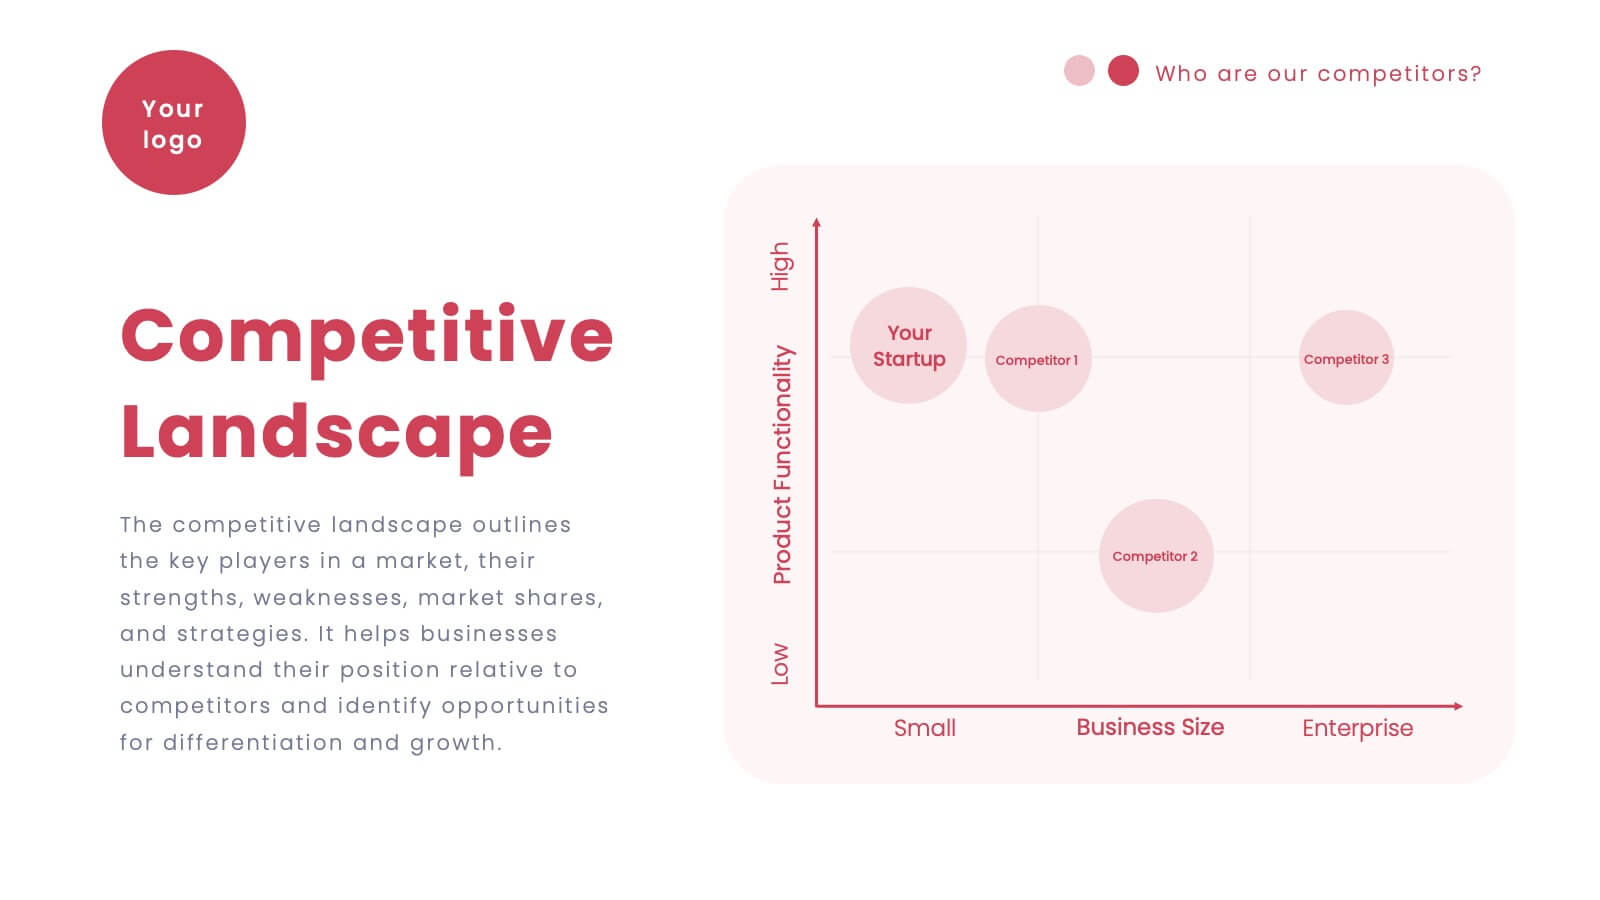
Vortex Startup Pitch Deck Presentation
Launch your ideas into action with this vibrant red pitch deck template, designed to captivate and inform potential investors. It covers everything from company overview to financials and market strategy, ensuring your vision is communicated effectively. Compatible with PowerPoint, Google Slides, and Keynote, this template is perfect for startups seeking to impress and engage.


4 diapositivas
Strategic Business Model Outline Presentation
Present a clear visual of your business model with this Strategic Business Model Outline. Designed to break down key components across four categories, this slide is perfect for strategy meetings, business overviews, or investor decks. Fully editable in PowerPoint, Keynote, and Google Slides for seamless customization and professional presentations.


5 diapositivas
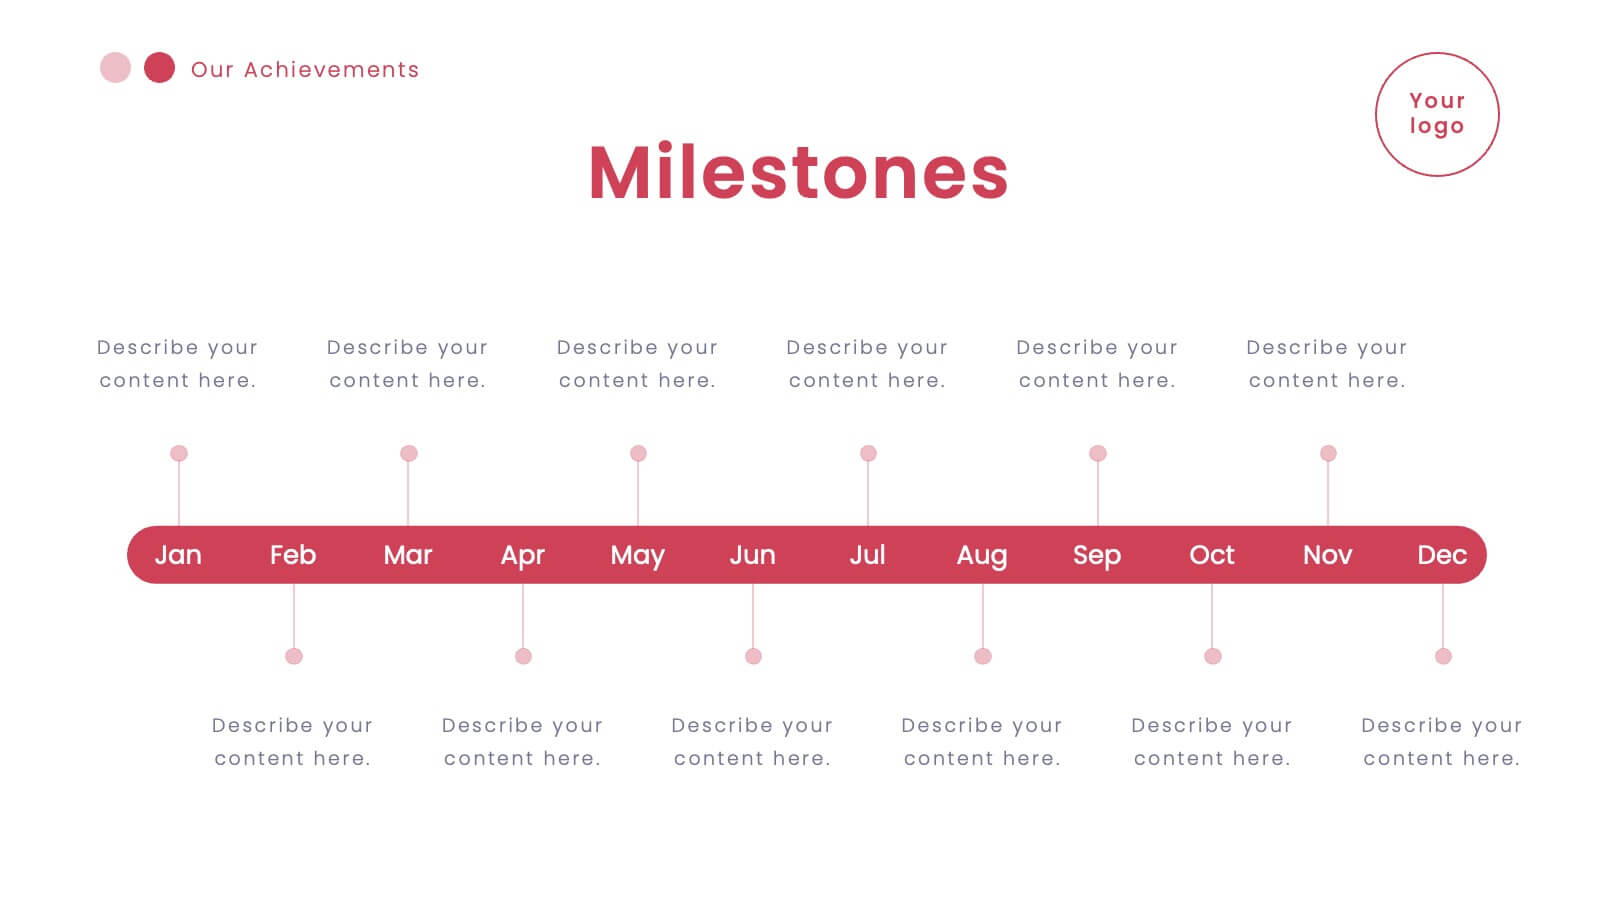
Project Management Framework
Guide your team through every project phase with this step-by-step framework presentation. Designed with a five-stage visual flow, this layout helps clearly communicate key milestones, tasks, and deliverables. Each stage is color-coded for easy tracking and includes editable text and icons. Perfect for planning, strategy, and agile workflows. Fully compatible with PowerPoint, Keynote, and Google Slides.


6 diapositivas
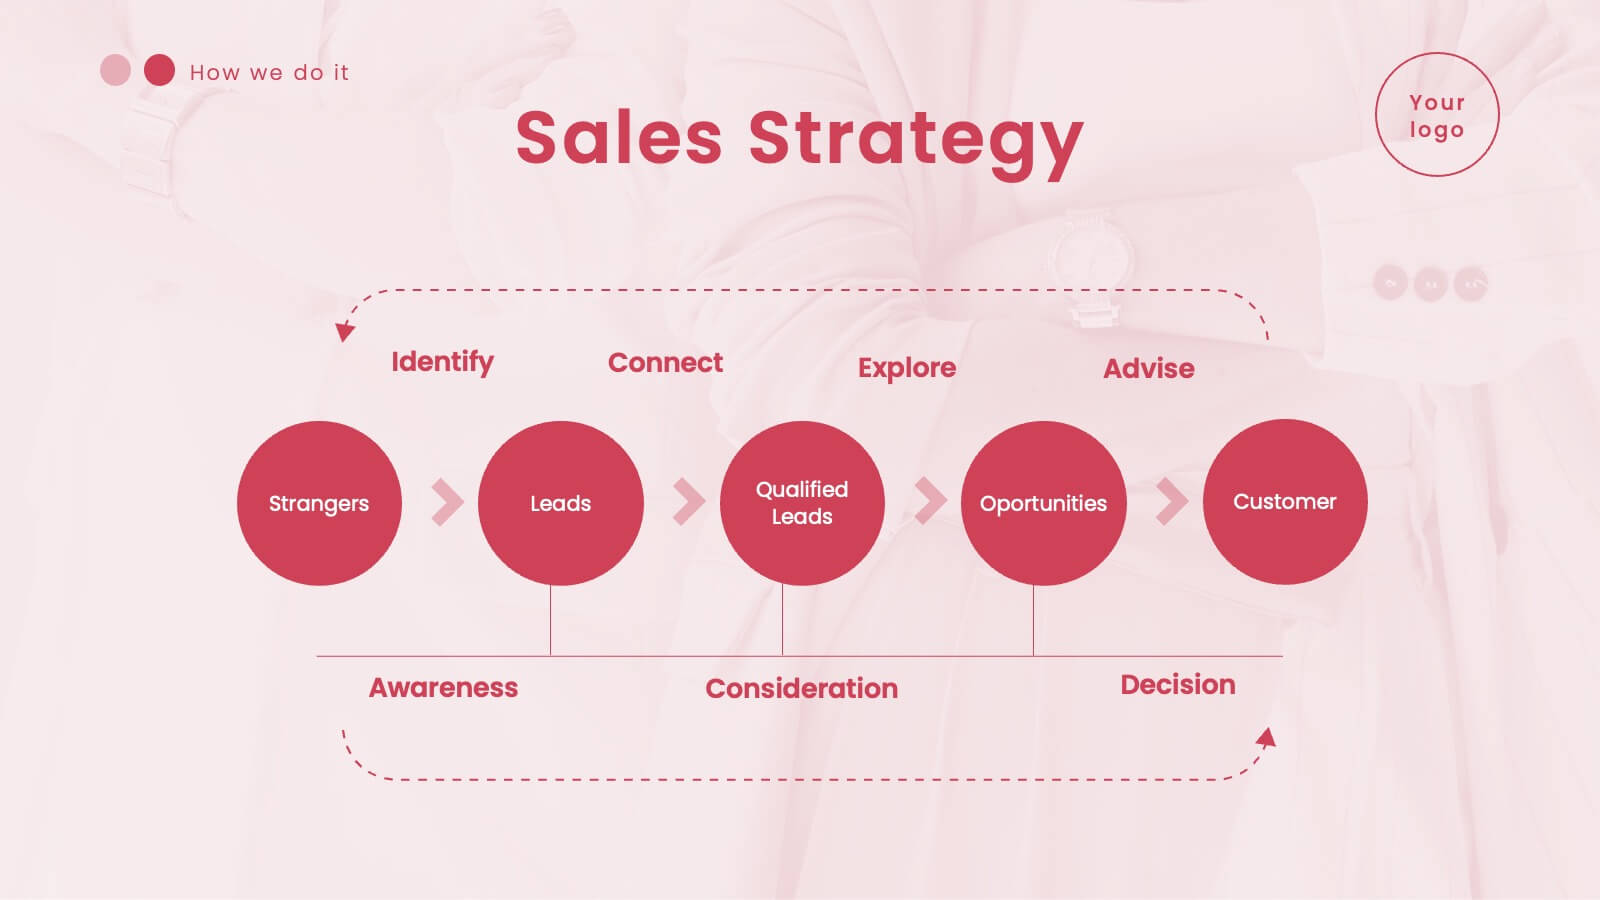
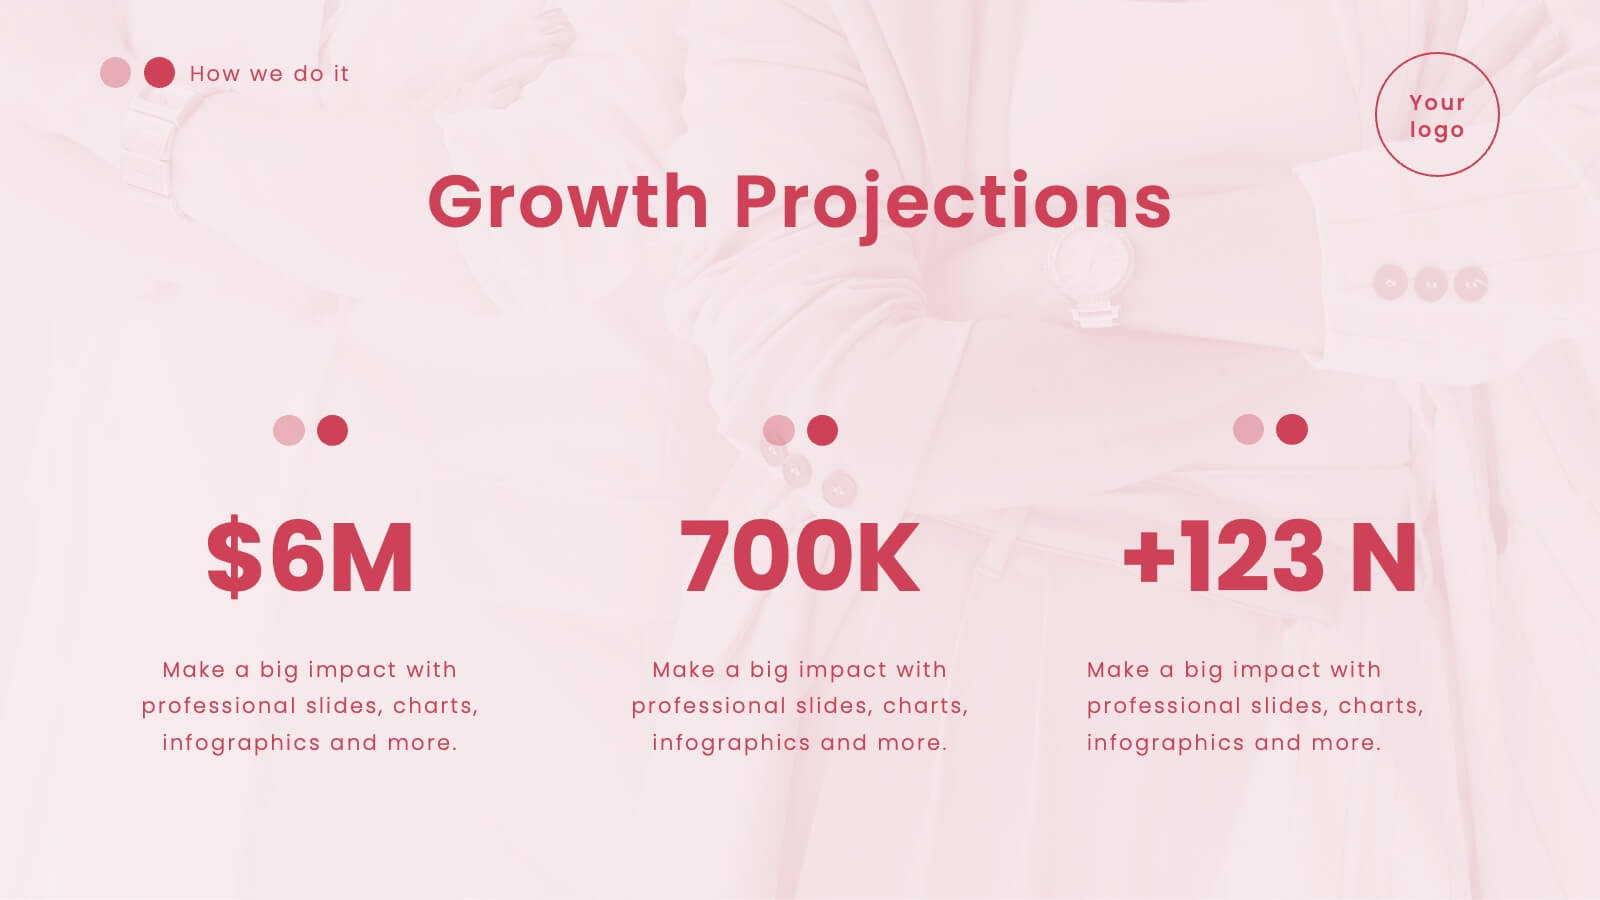
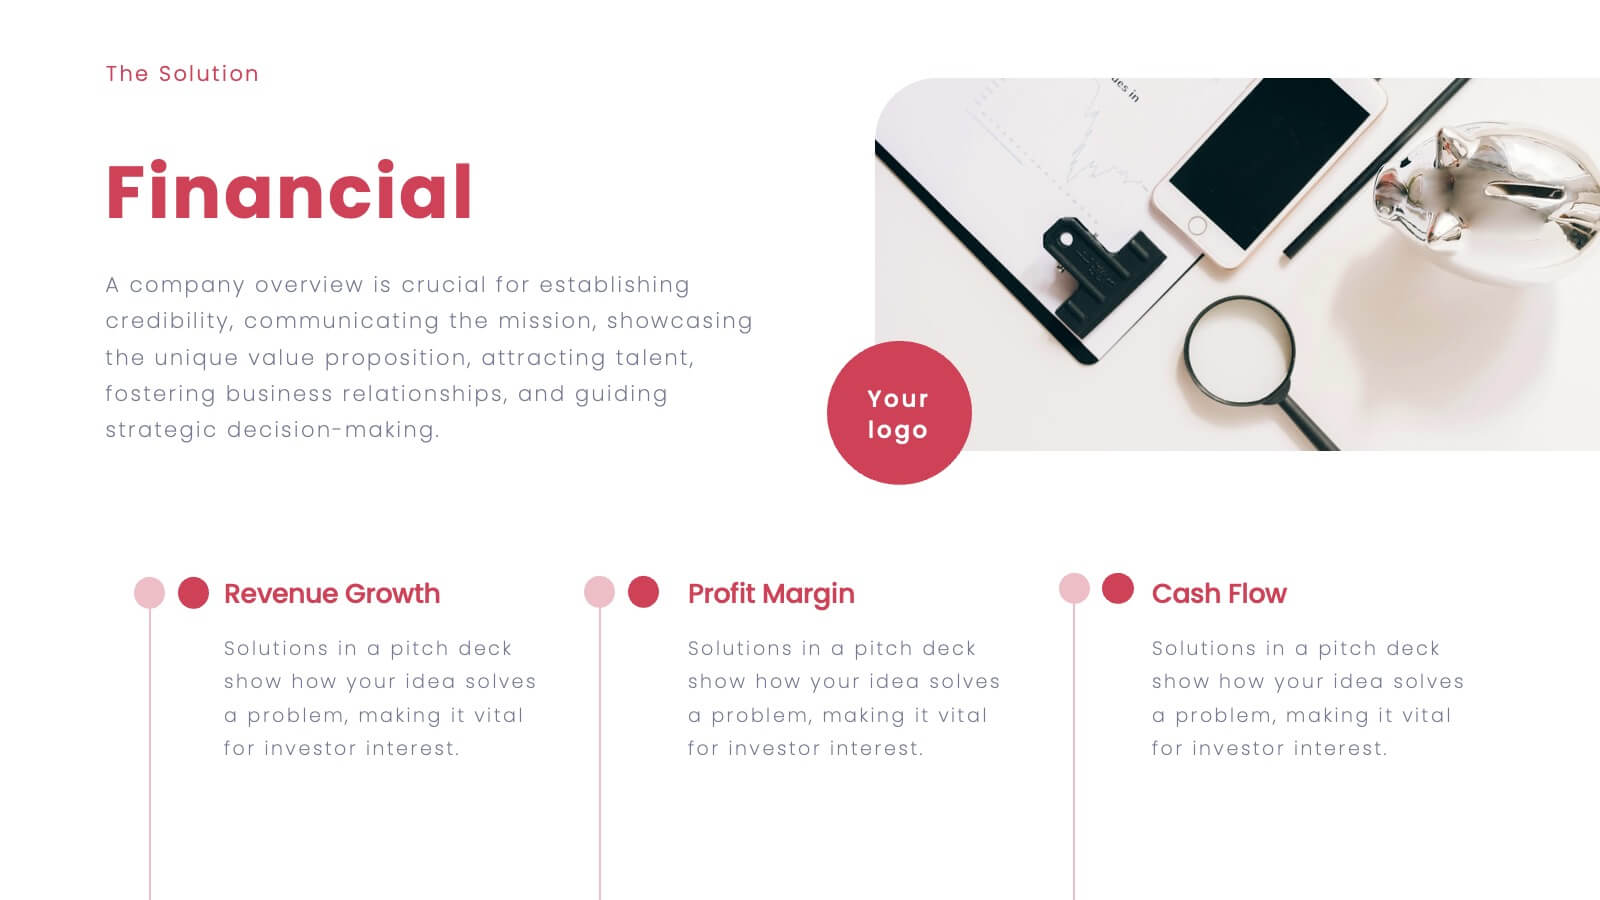
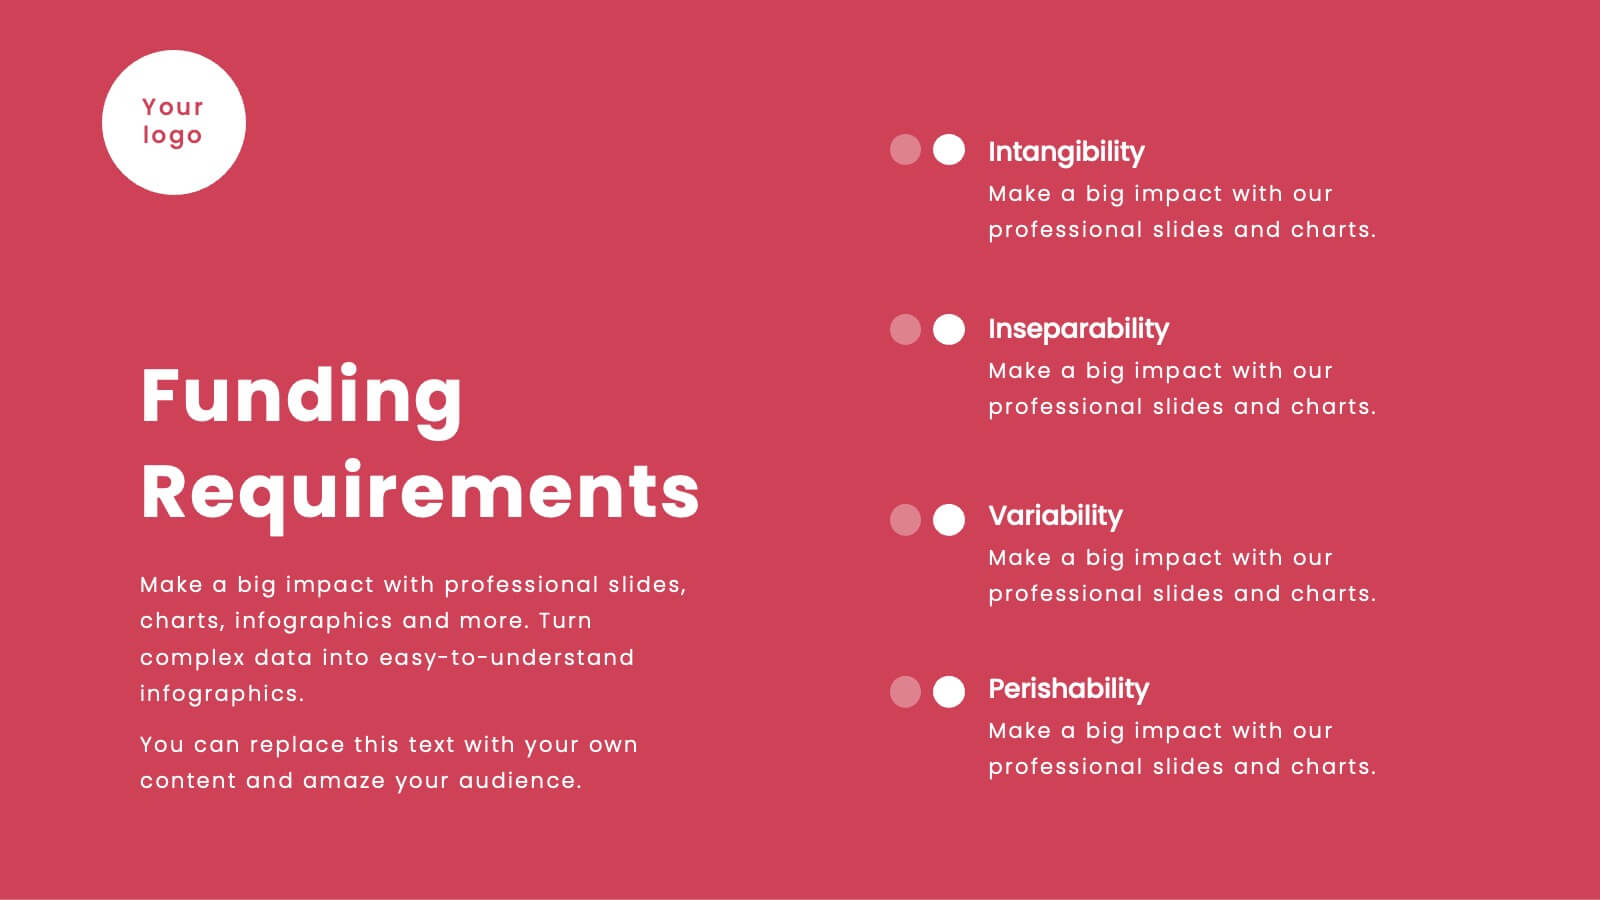
Business Funding Pitch Deck Presentation
Secure funding with confidence using this Business Funding Pitch Deck template. Designed to communicate your business model, growth potential, and financial strategy, it helps you make a strong case to investors. Engage your audience with a clear, structured layout. Fully compatible with PowerPoint, Keynote, and Google Slides for effortless customization.


6 diapositivas
Puzzle Project Infographic
A puzzle infographic is a visual representation that combines the elements of a puzzle with informational content. This infographic template uses puzzle pieces or puzzle-related design elements to convey different sections or components of information. Each puzzle piece represents a specific section or element of the information being presented. The puzzle pieces act as sequential elements, guiding your viewer through the information in a logical and engaging manner. This infographic is visually appealing and use colors, illustrations, icons, and other design elements to enhance the overall presentation.


6 diapositivas
Vision Statement Infographic
Define and share your organization's aspirations with our Vision Statement Infographic Template. Designed for impact and clarity, this template offers a modern, sleek way to communicate your company's vision to team members, stakeholders, and the public. With its clean lines and focused layout, it provides the perfect backdrop to highlight your strategic intentions. This template features a series of customizable slides, each structured to help you articulate different elements of your vision statement. Utilize engaging icons, bold color blocks, and concise text to make your message resonate. It’s ideal for integrating into annual reports, company presentations, or onboarding materials, ensuring that your vision is not only shared but also inspires. Tailor each slide to suit your corporate identity, adjusting colors and fonts for consistency with your brand aesthetics. This tool is essential for leaders looking to instill a sense of purpose and direction throughout their organization.


7 diapositivas
Chart Comparison Infographic Presentation
Chart Comparison is the process of comparing different charts or graphs to identify similarities. It involves analyzing multiple sets of data by visually presenting them in charts. Use this template to show the comparison of various charts and how things look when they are compared. This template will help you create a professional Infographic presentation that highlights the key differences between data sets. Each chart can have it's own color, so you can use any color you want. You can also add text in the chart with your own content, and edit in Powerpoint, Keynote, or Google Slides.