


Características


¿Tienes alguna pregunta?
Recomendar


3 diapositivas
Project Completion Checklist Presentation
Keep projects on track with the Project Completion Checklist template. This structured layout helps you monitor tasks, update statuses, and document progress seamlessly. Featuring status indicators, date tracking, and notes sections, this template enhances productivity and organization. Fully customizable and compatible with PowerPoint, Keynote, and Google Slides for effortless use.

24 diapositivas
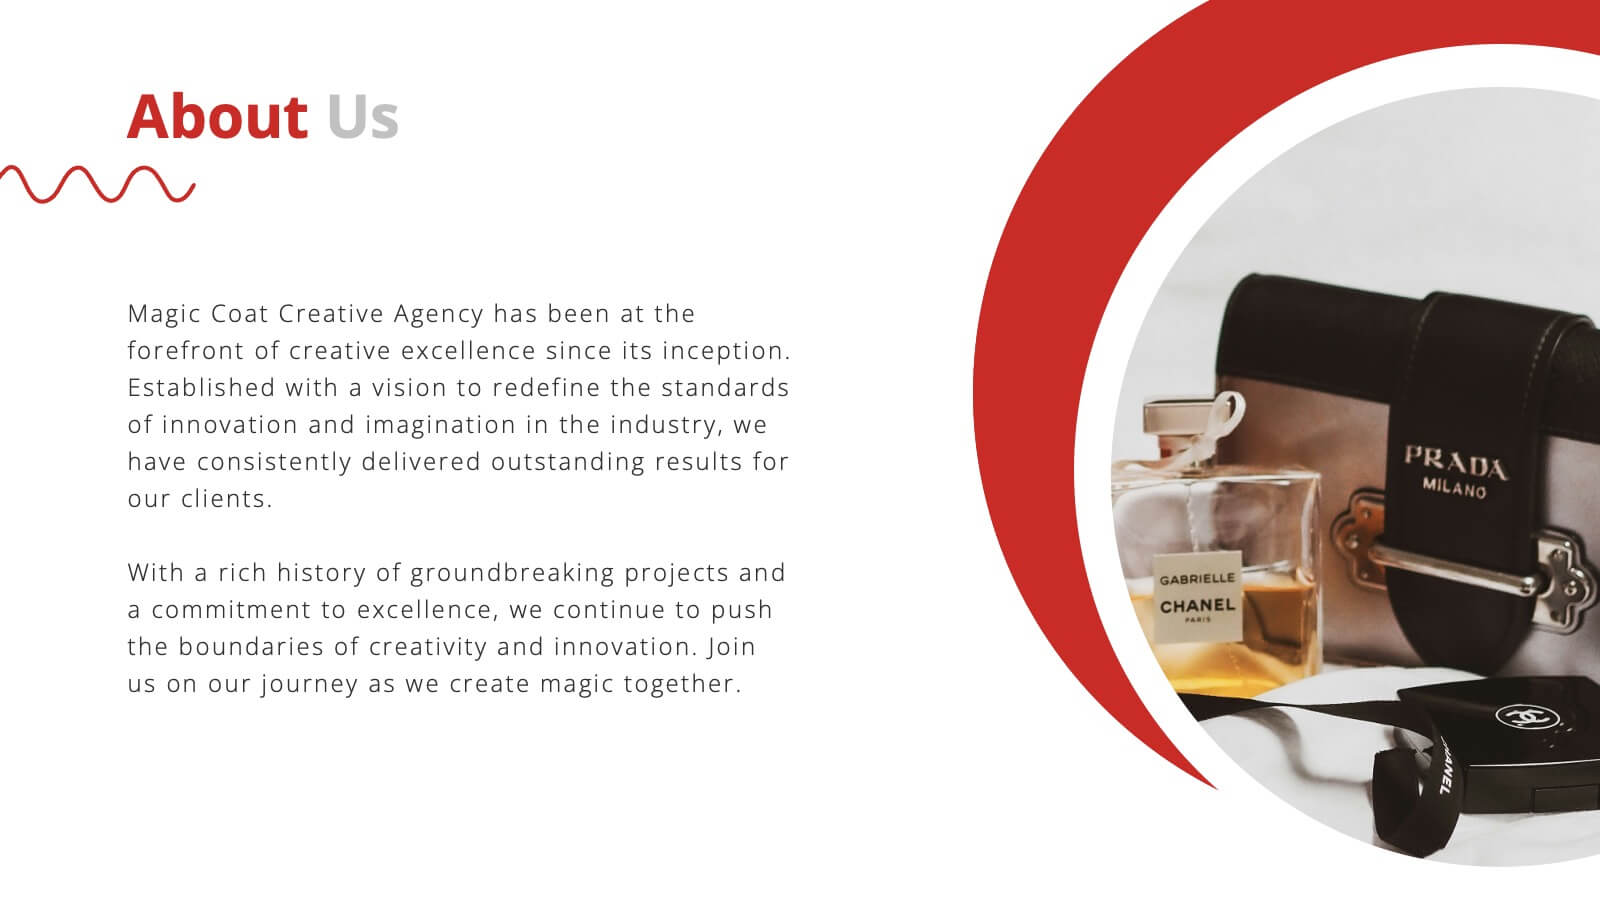
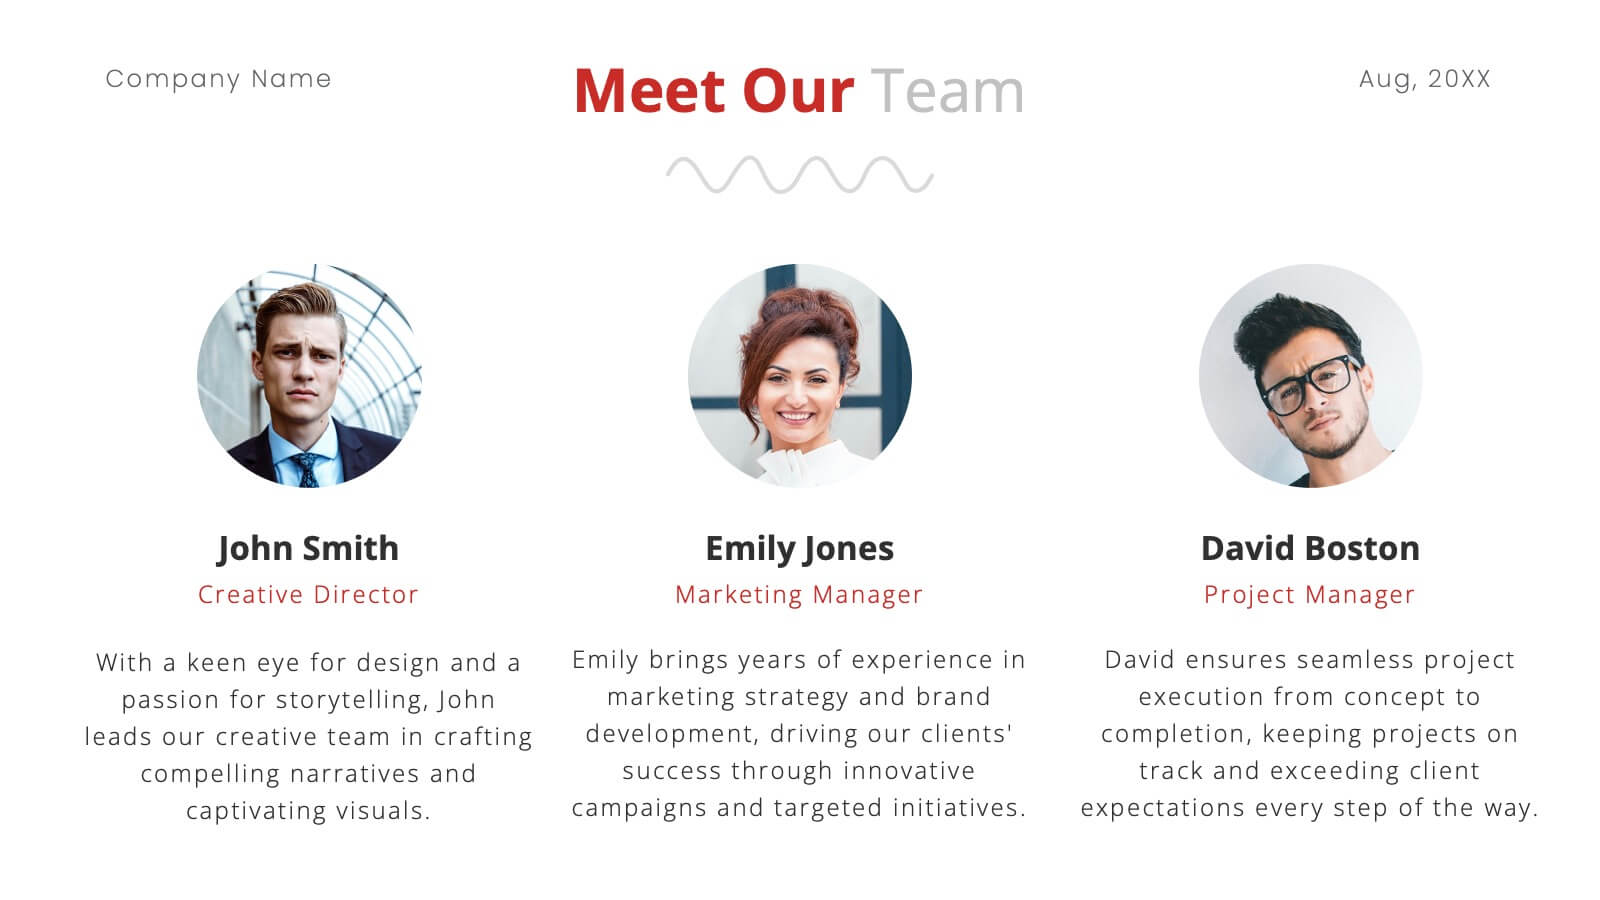
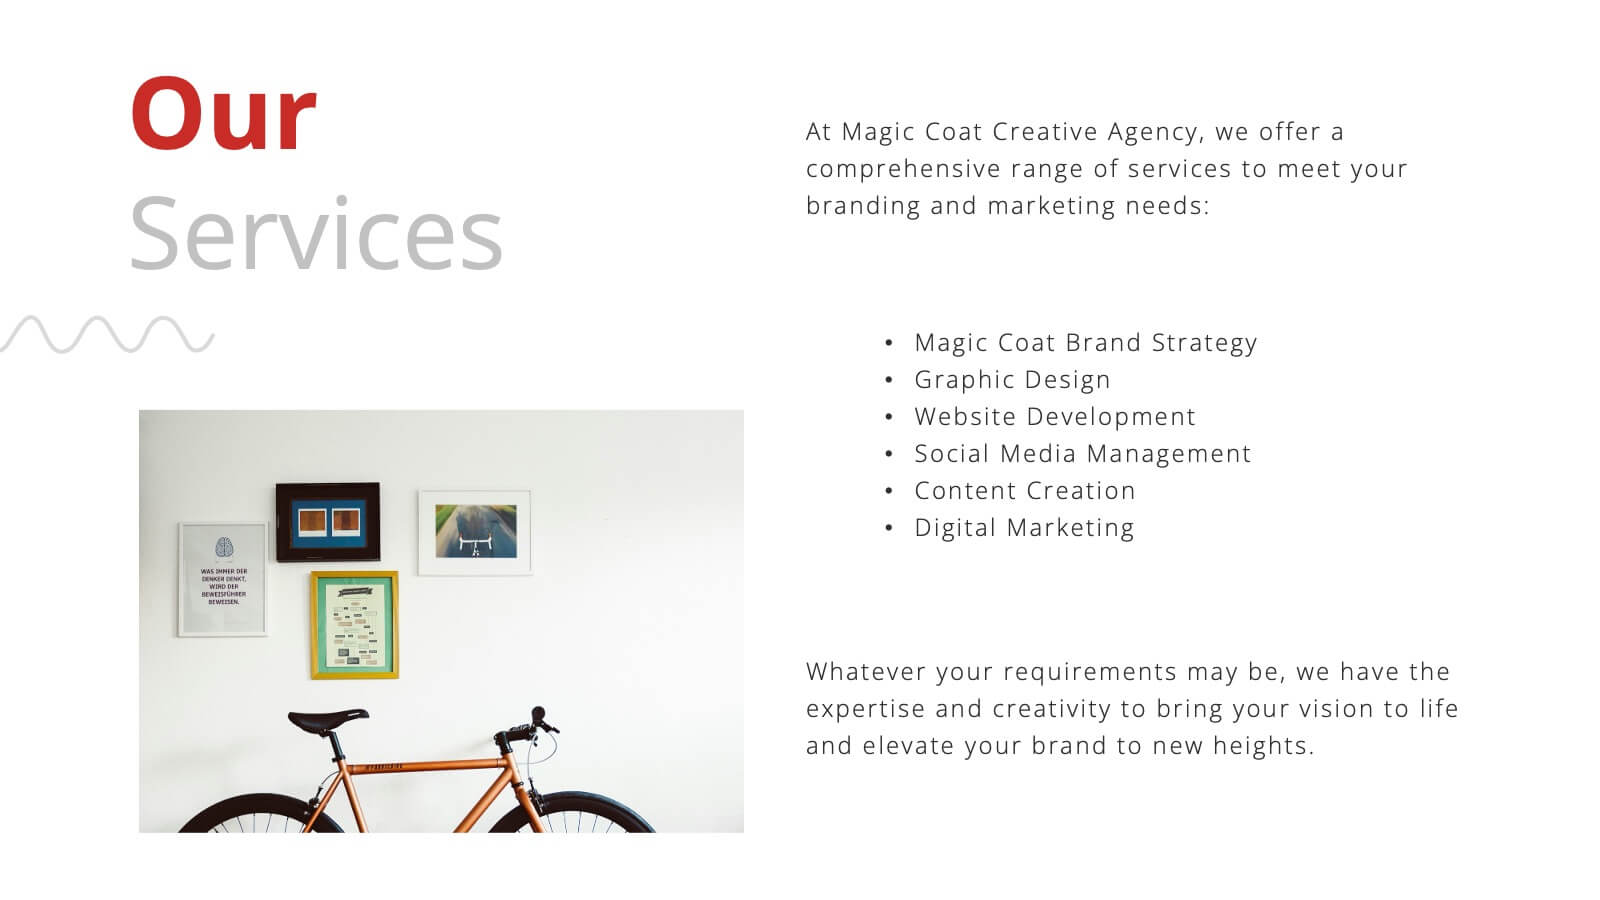
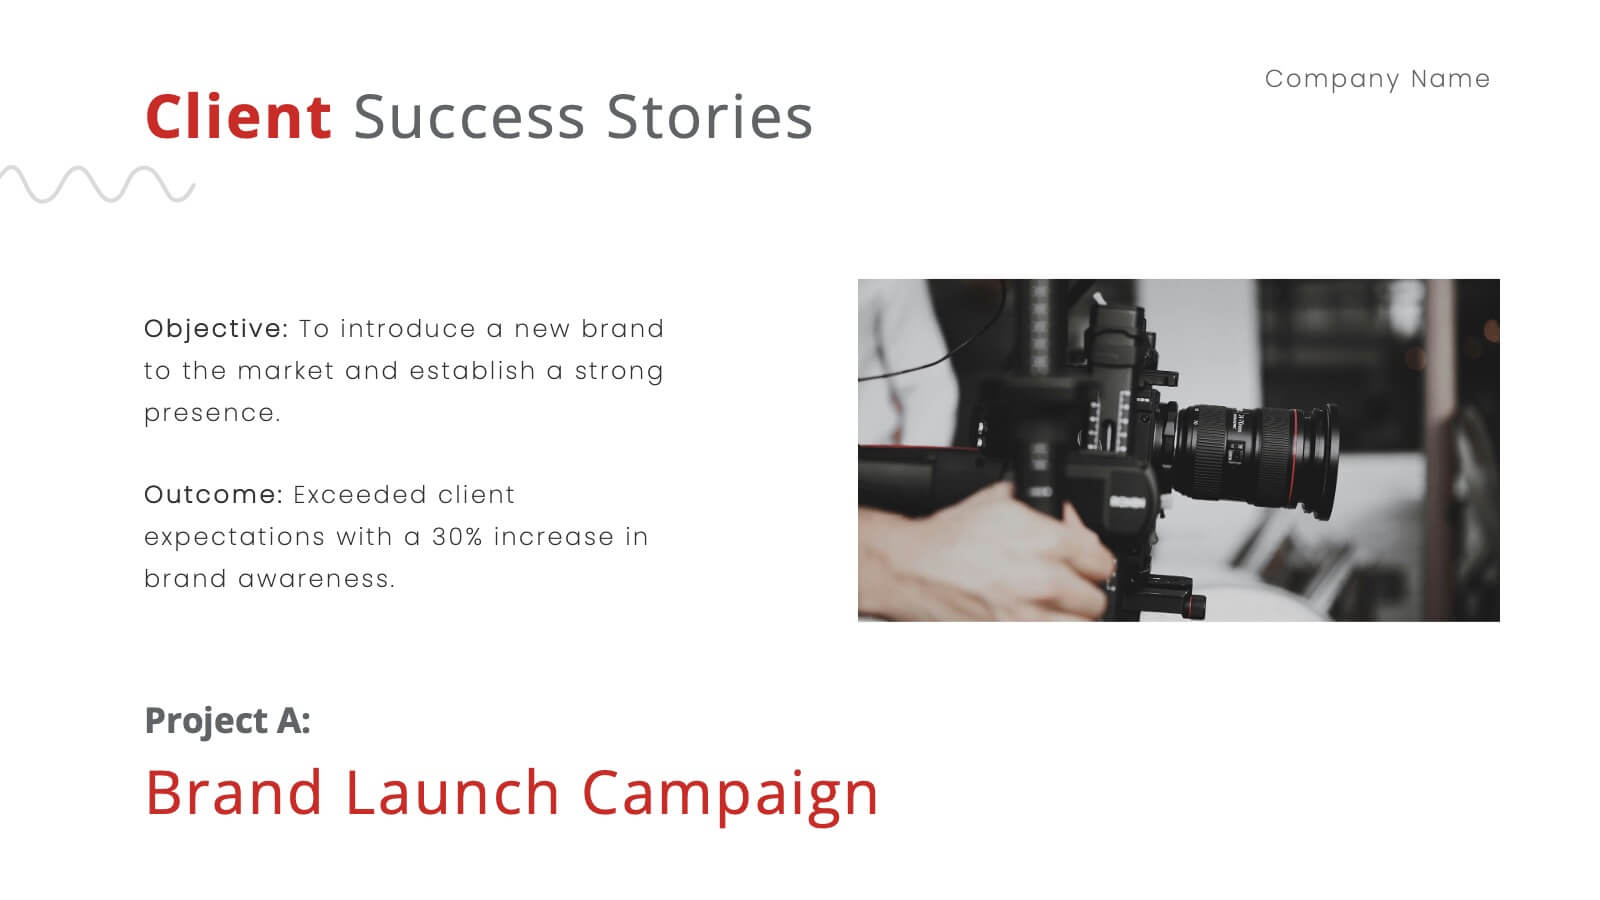
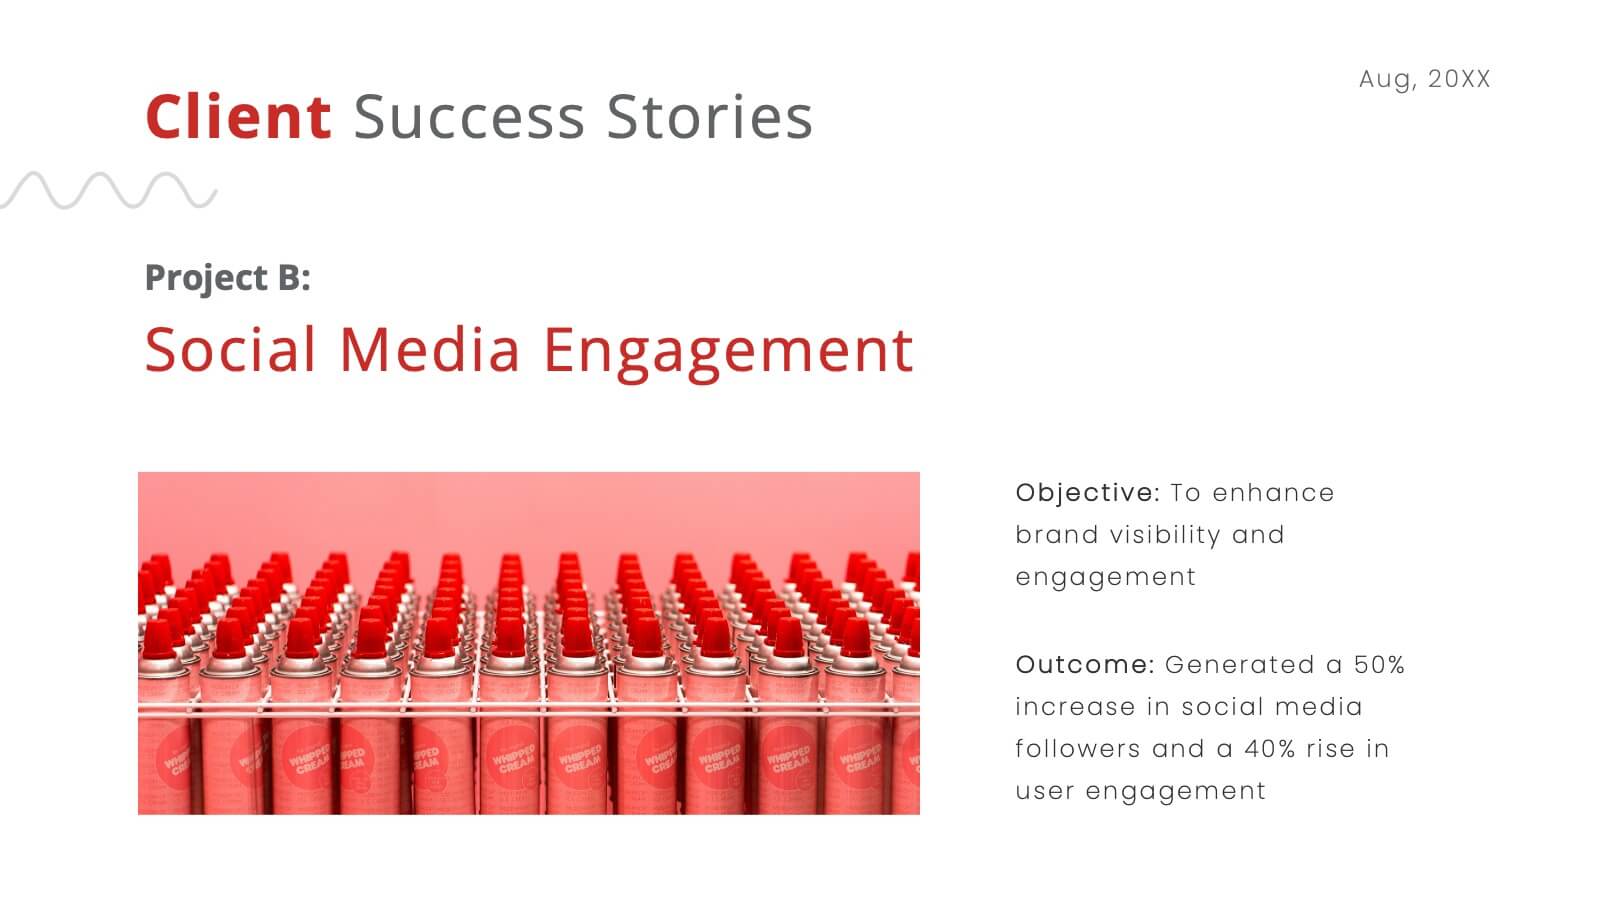
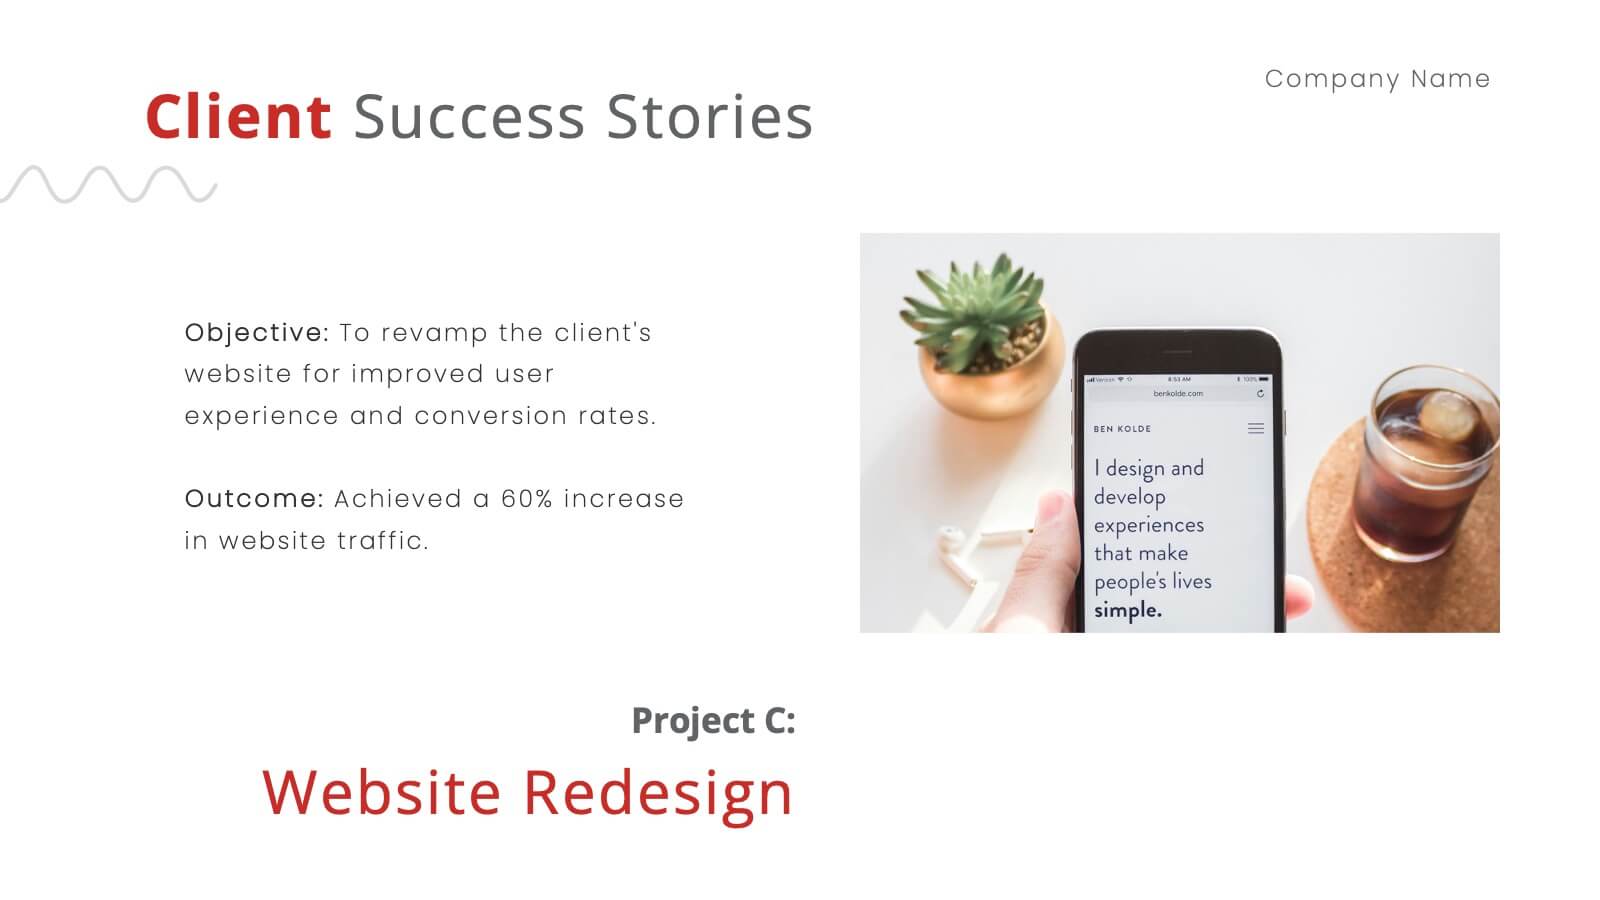
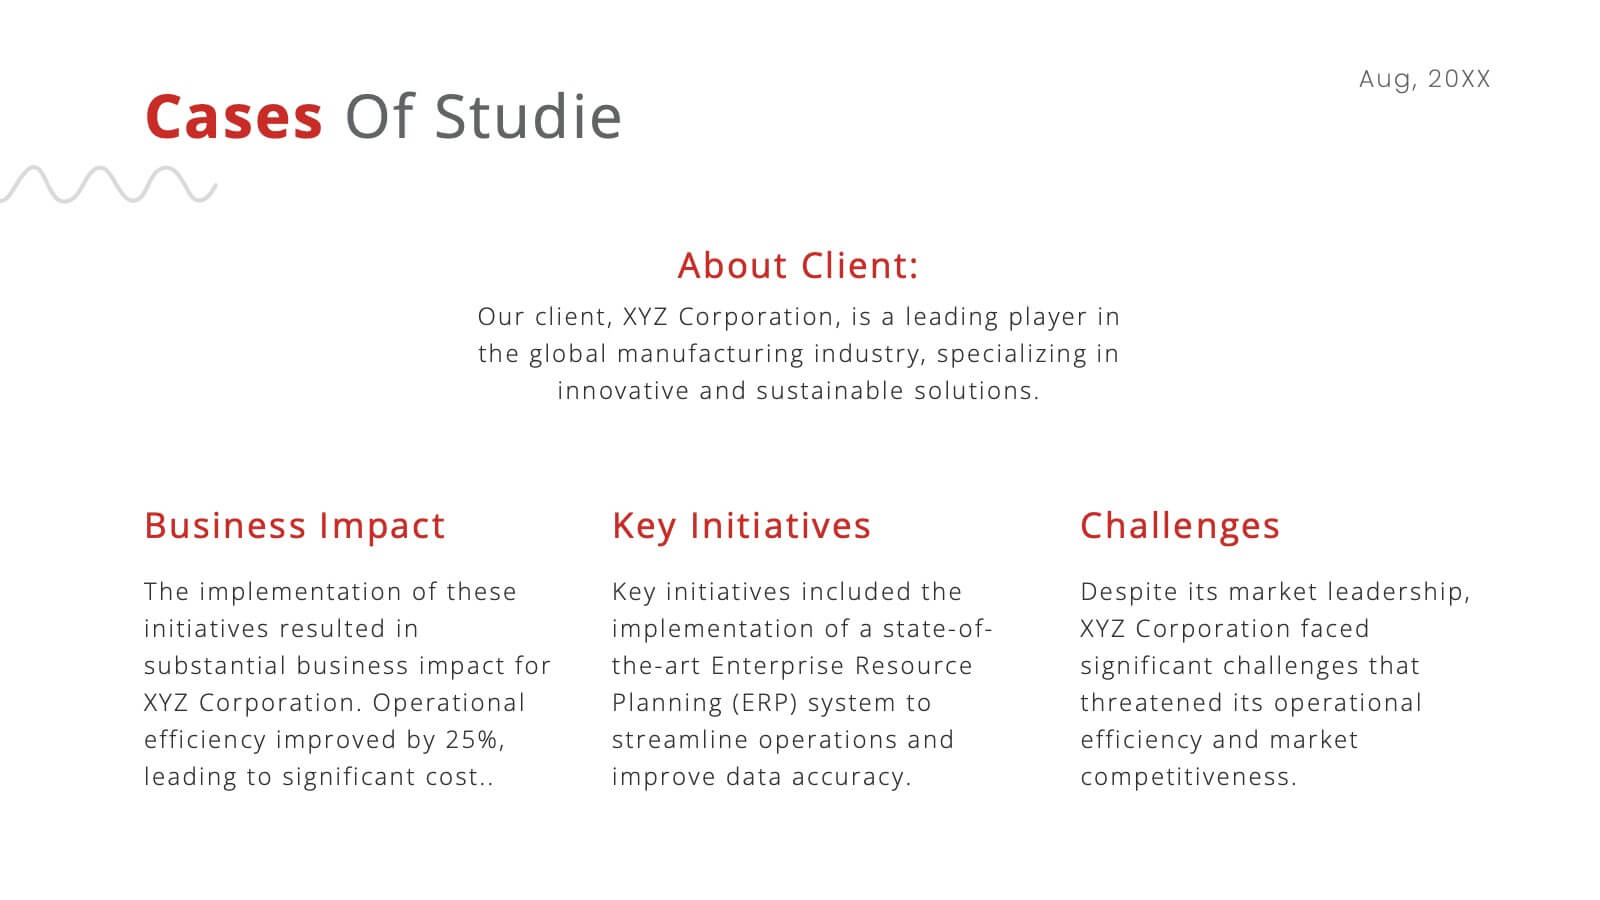
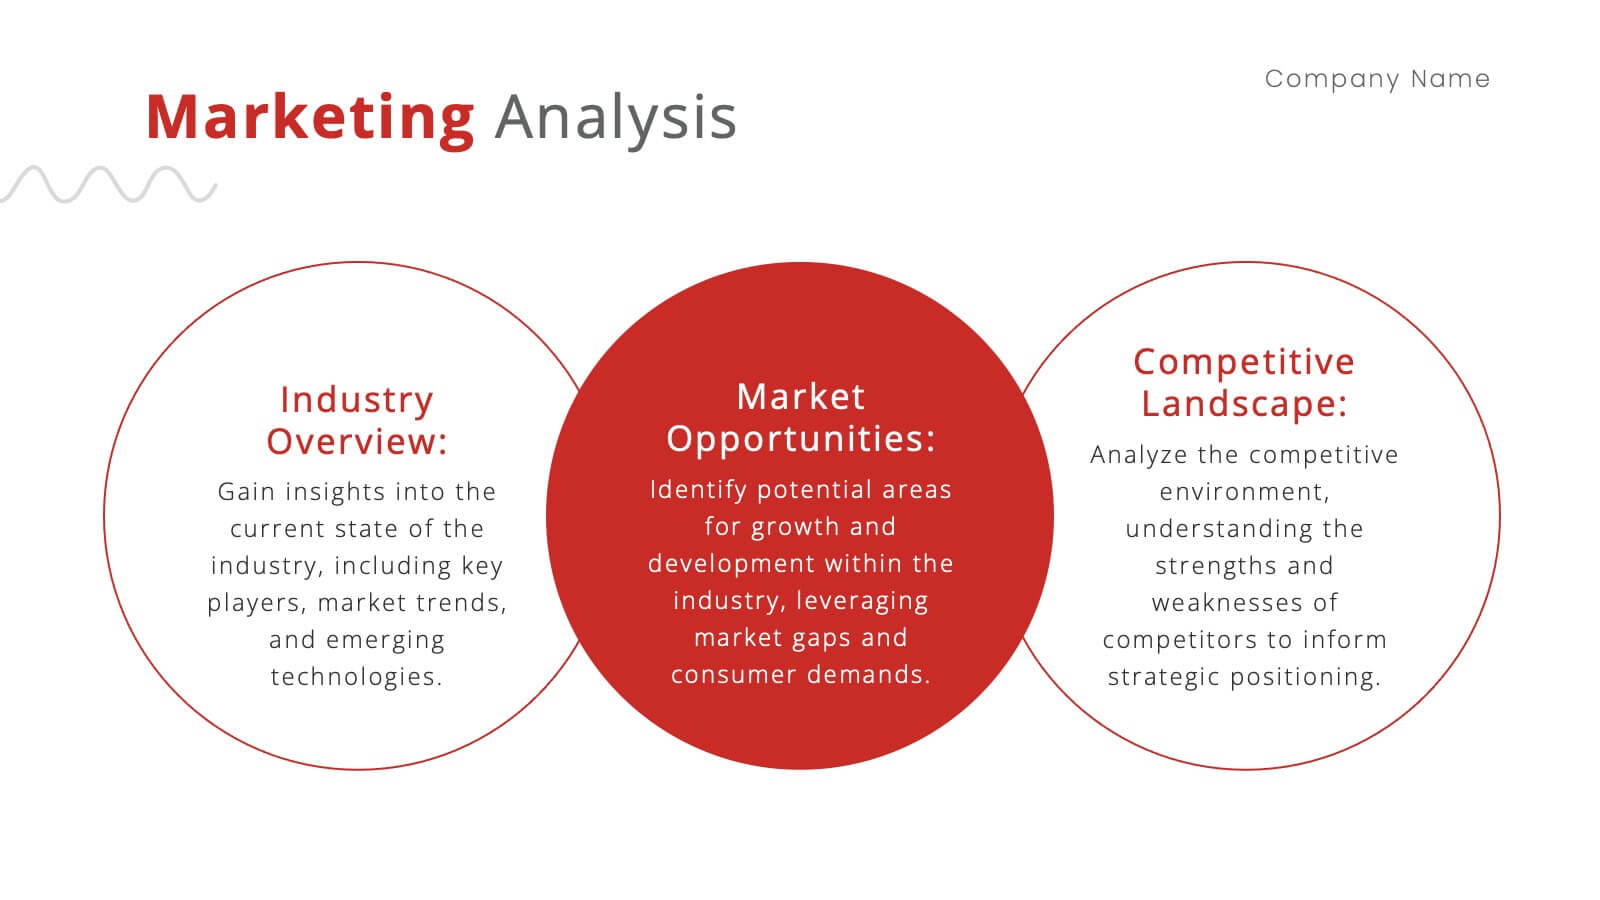
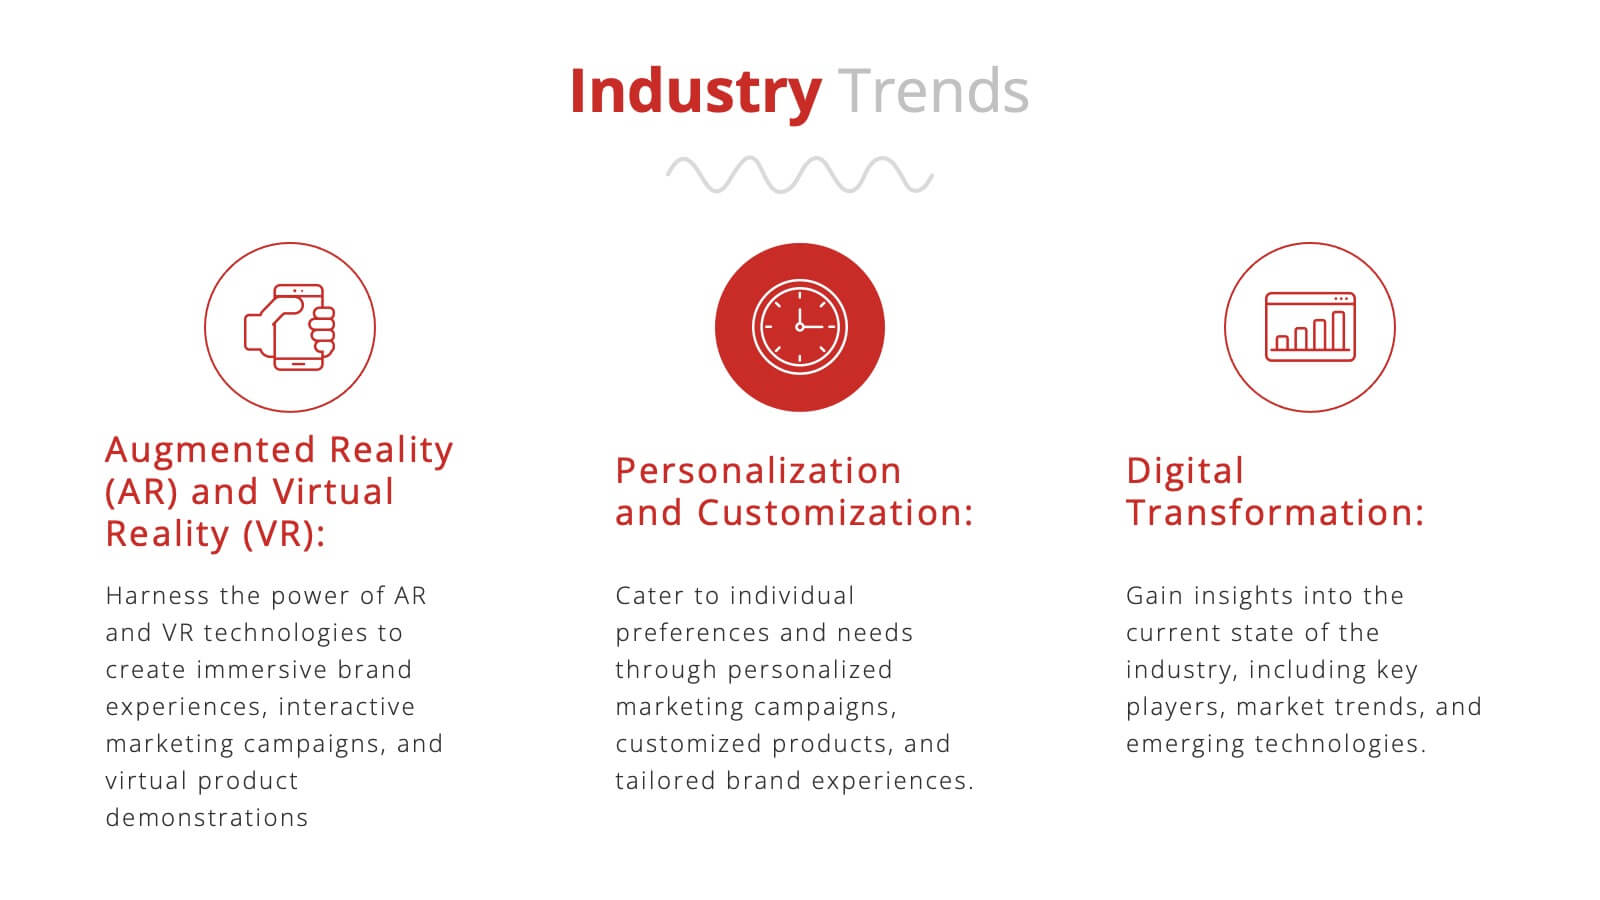
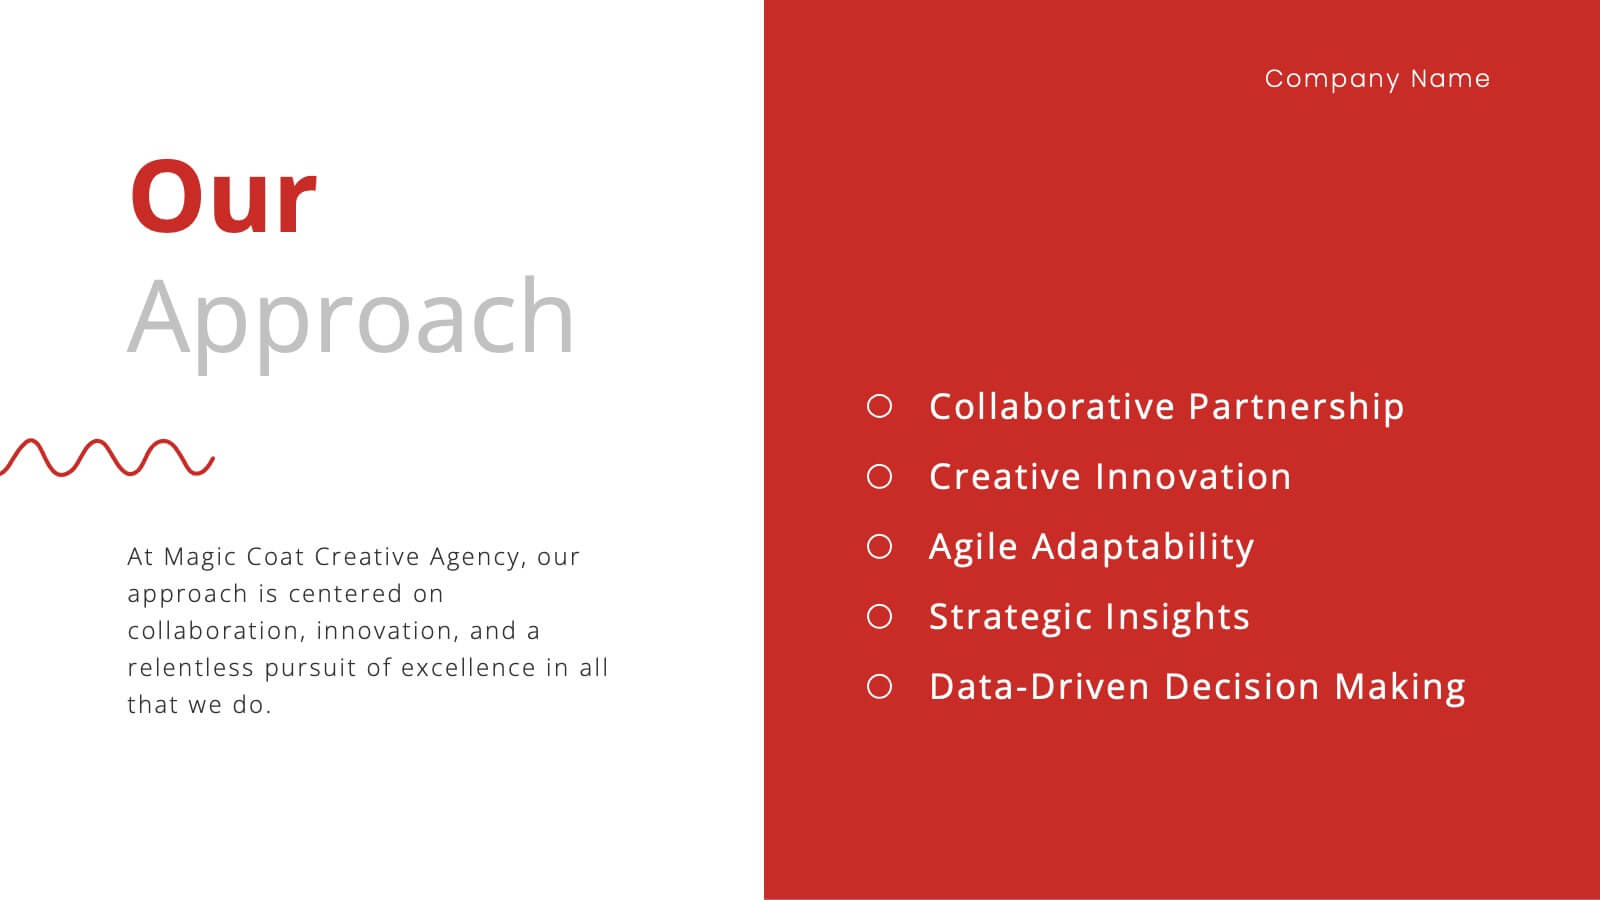
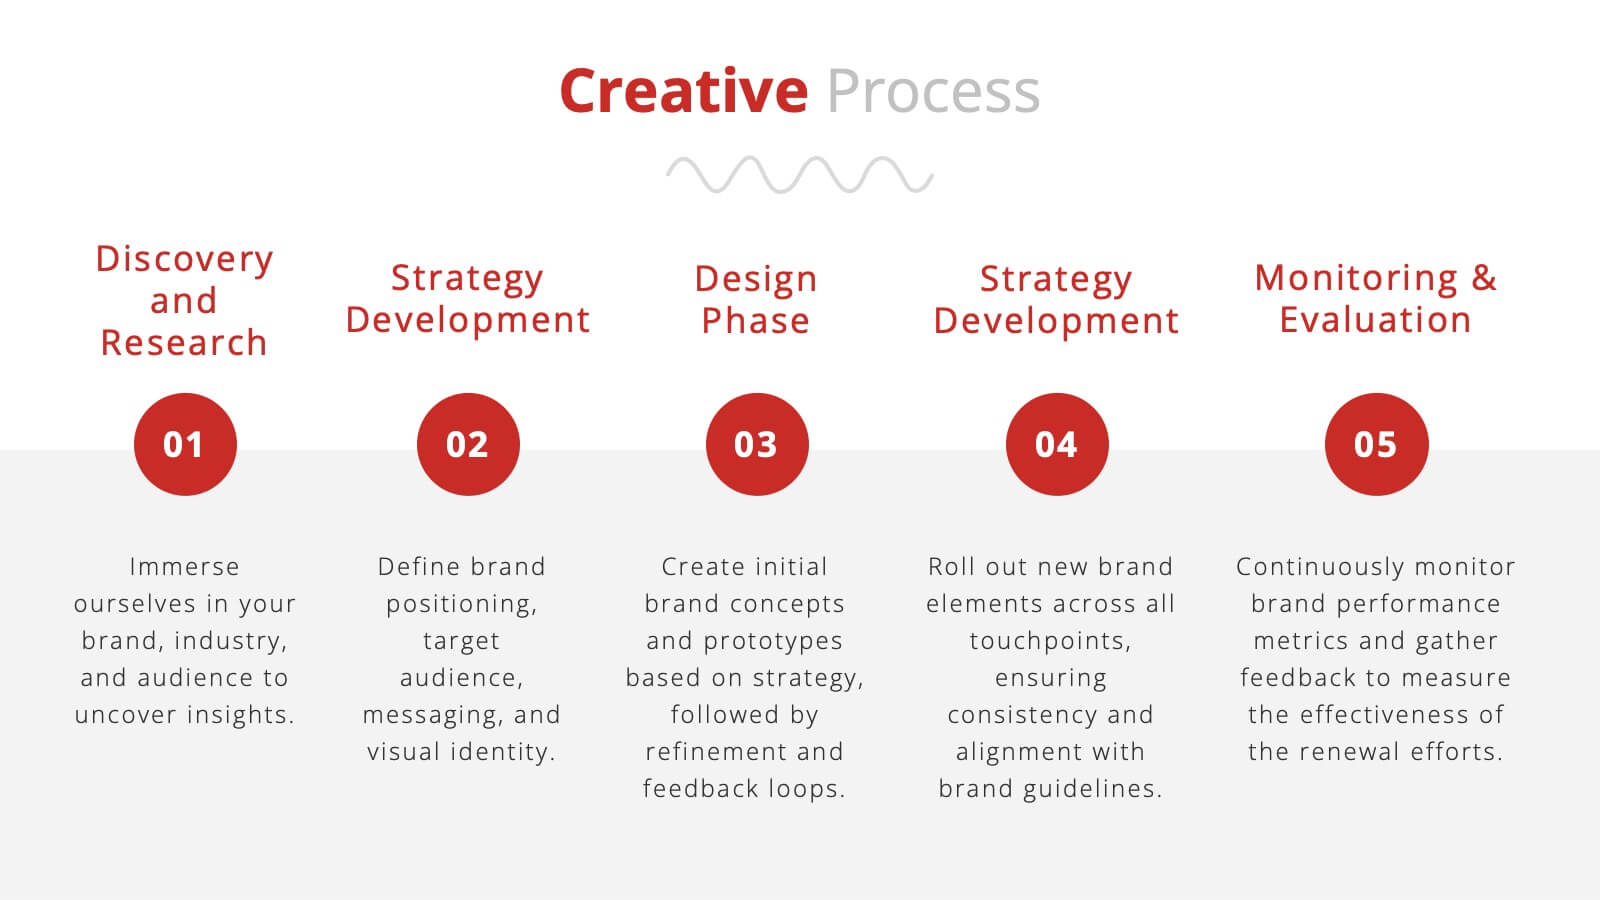
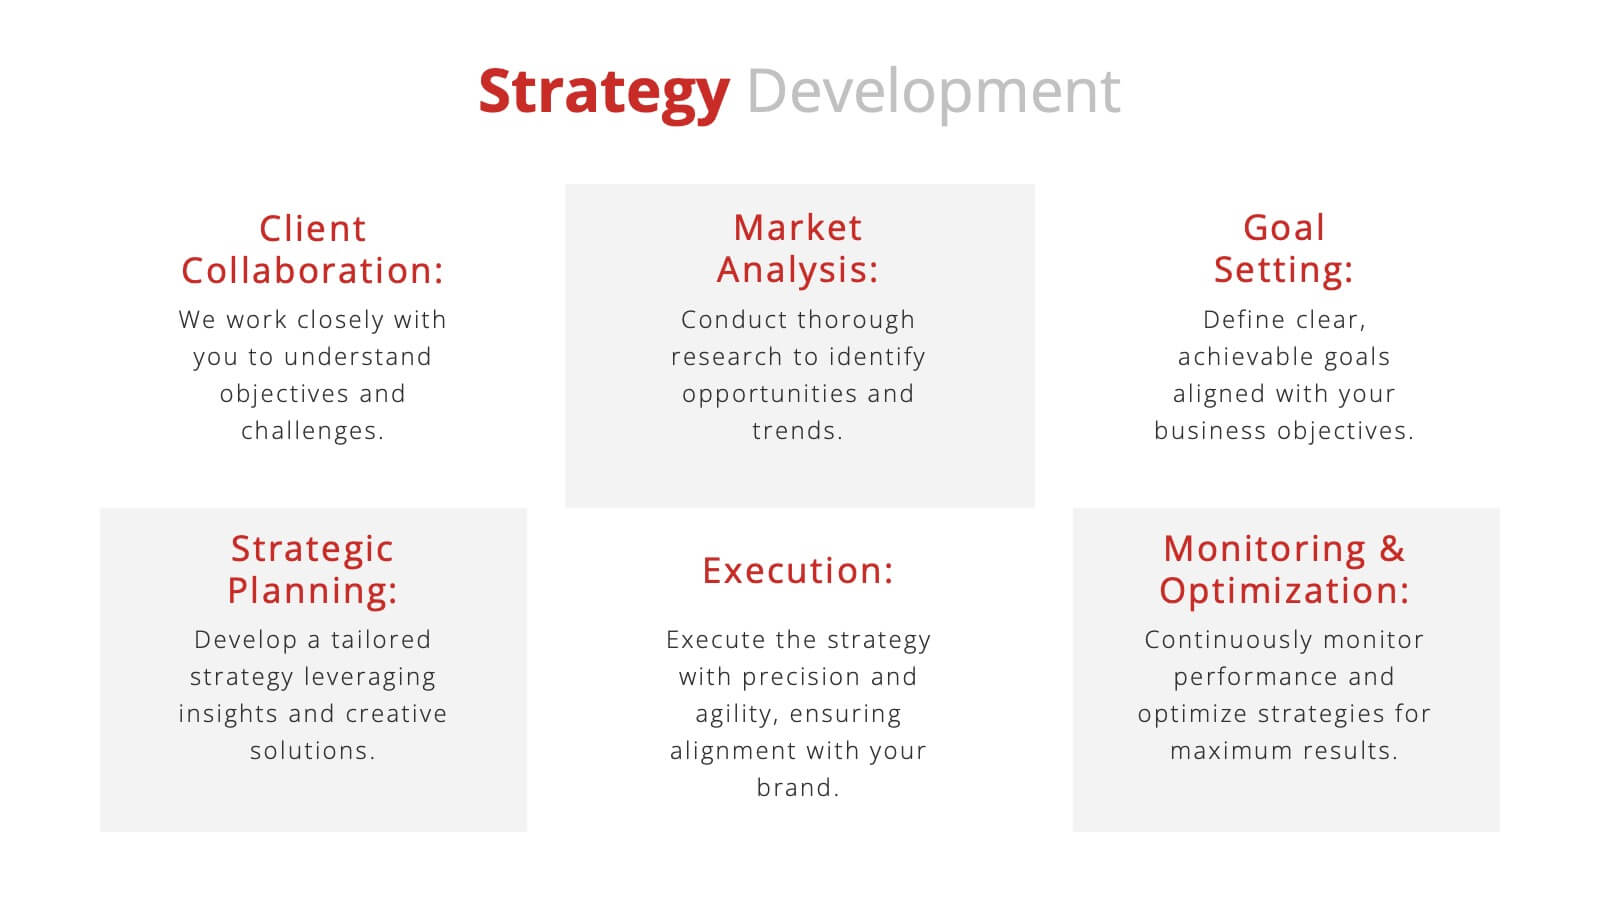
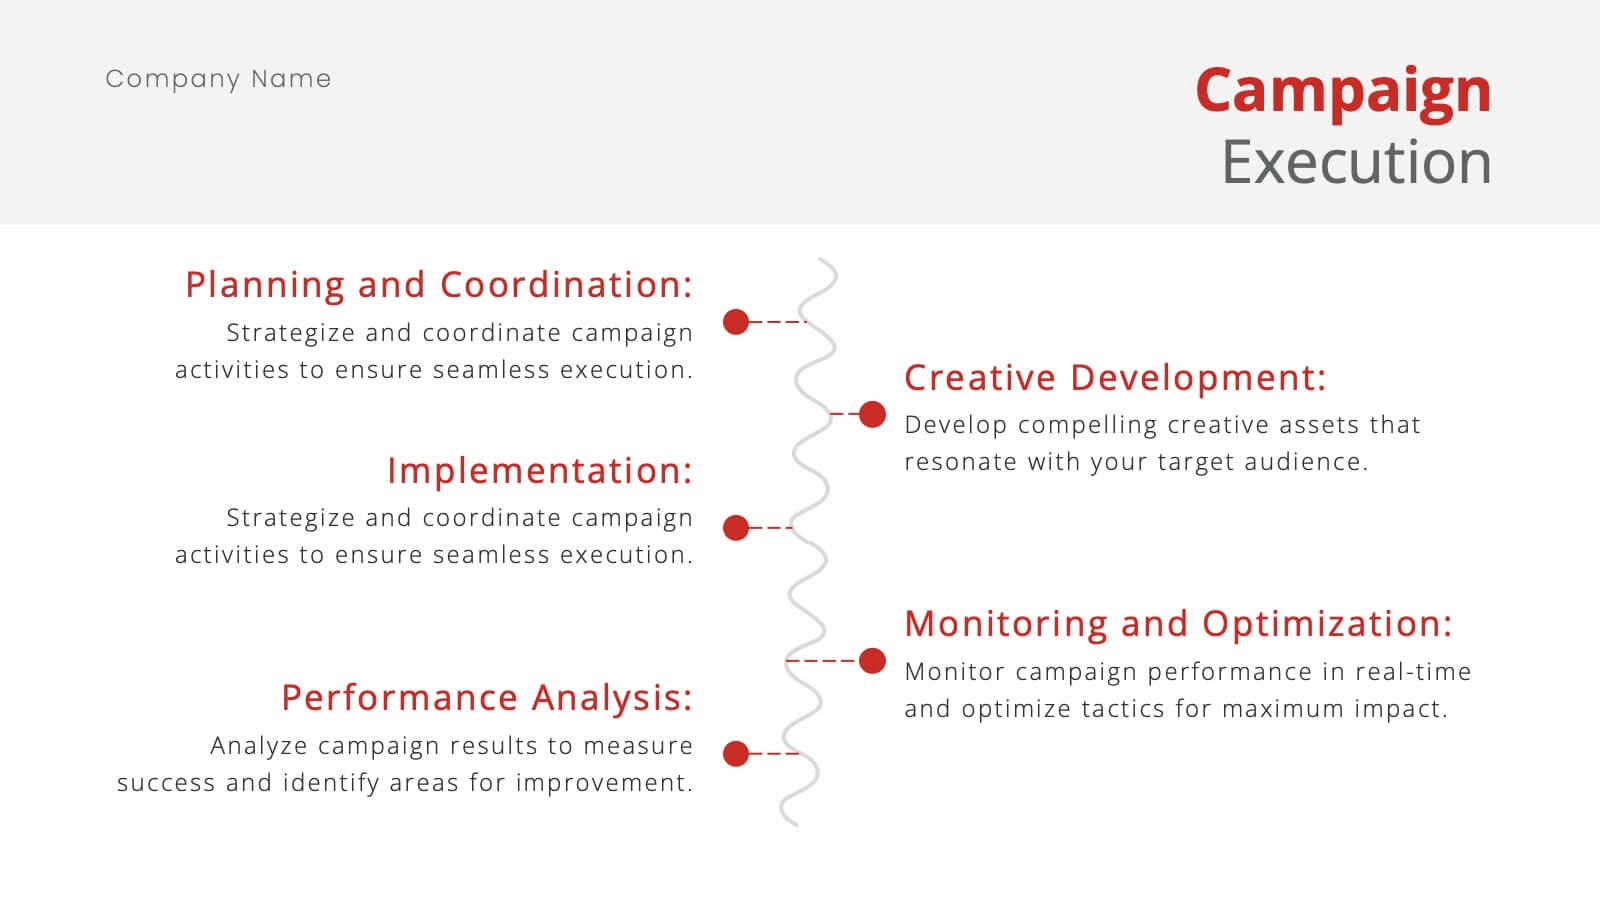
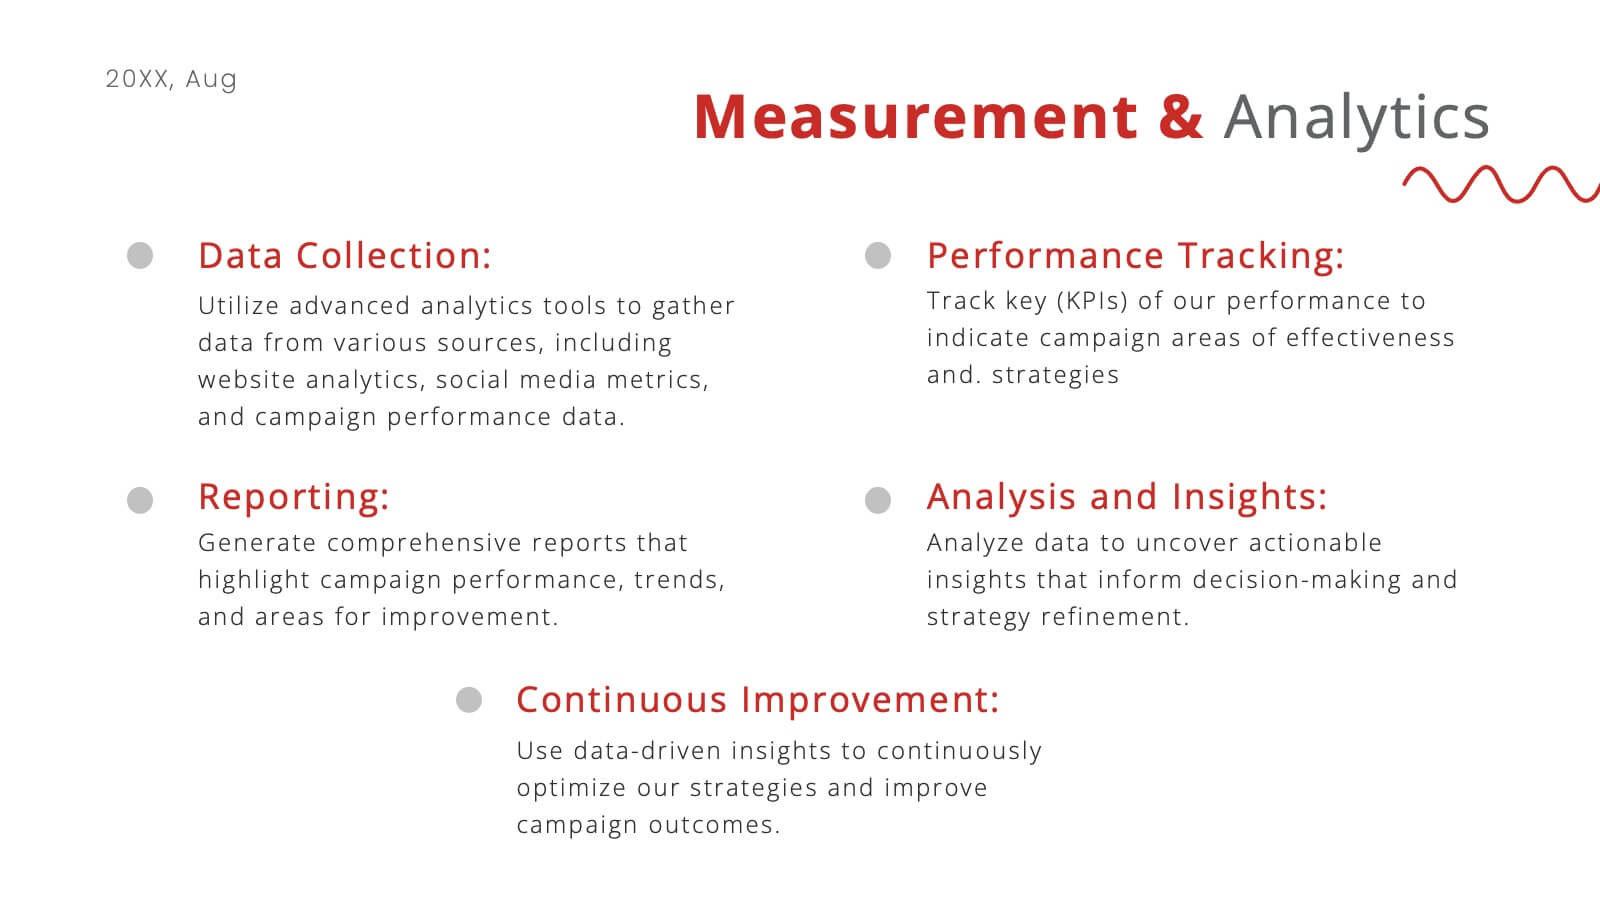
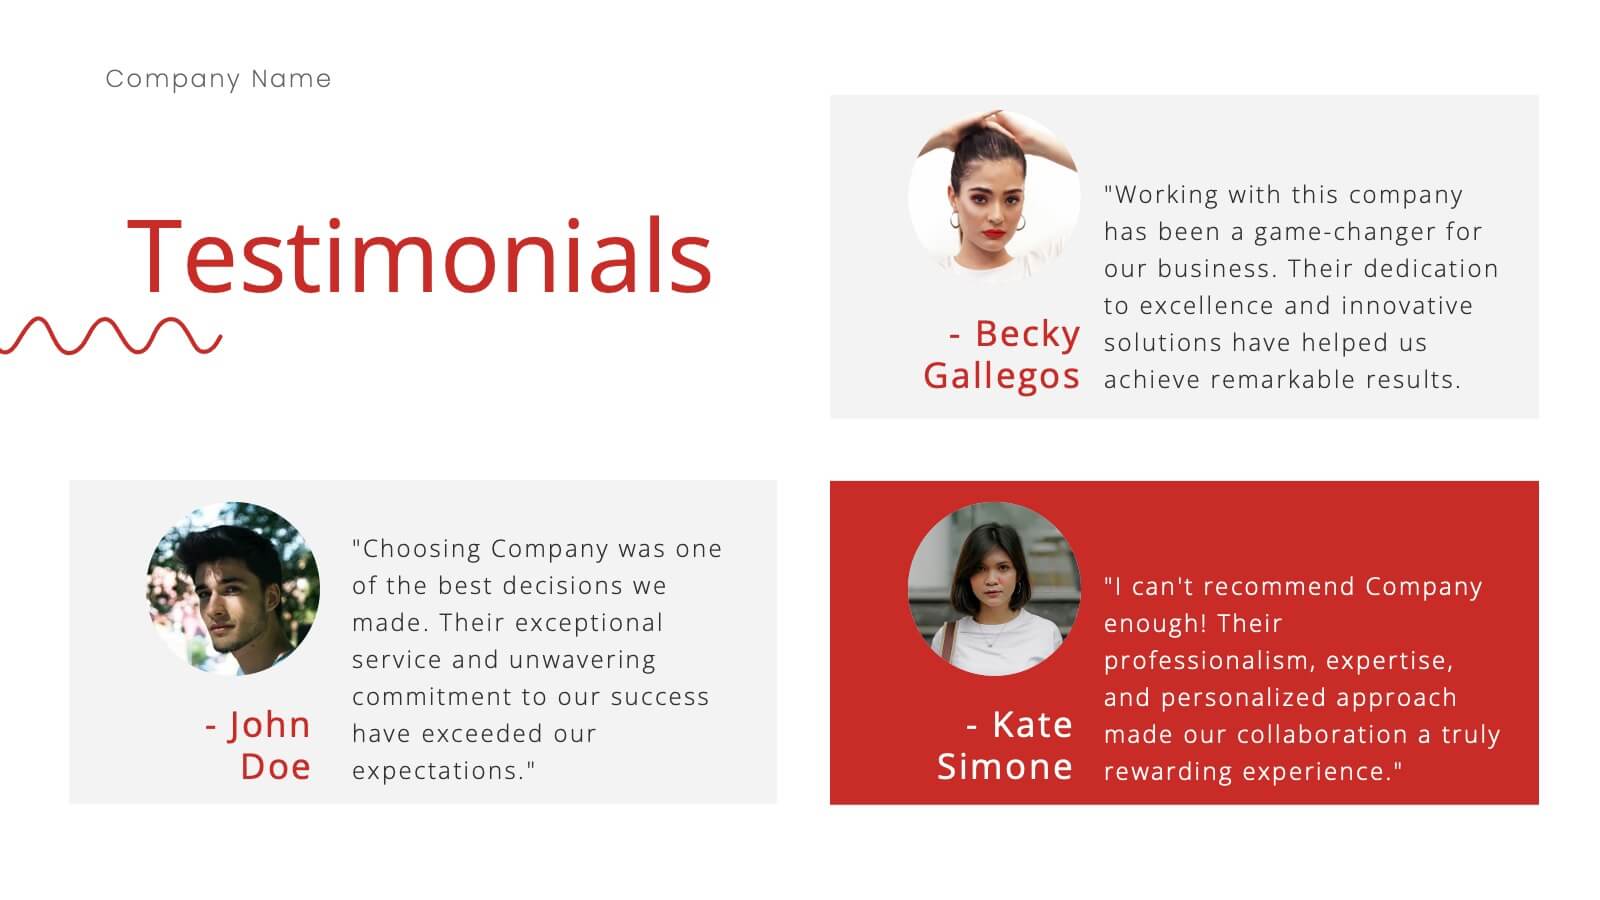
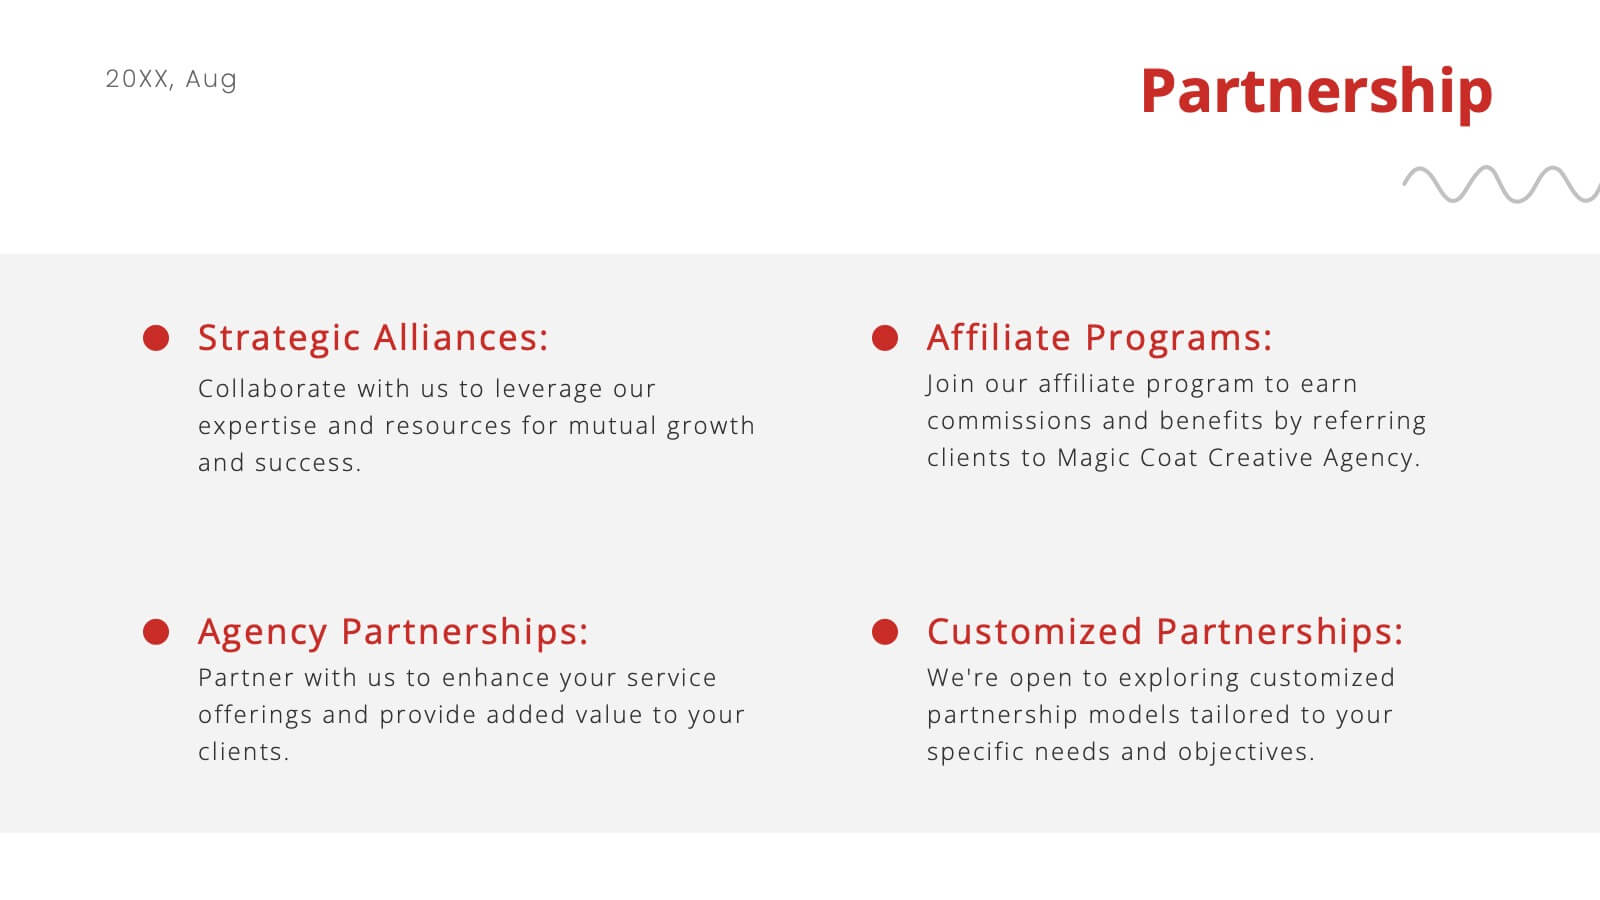
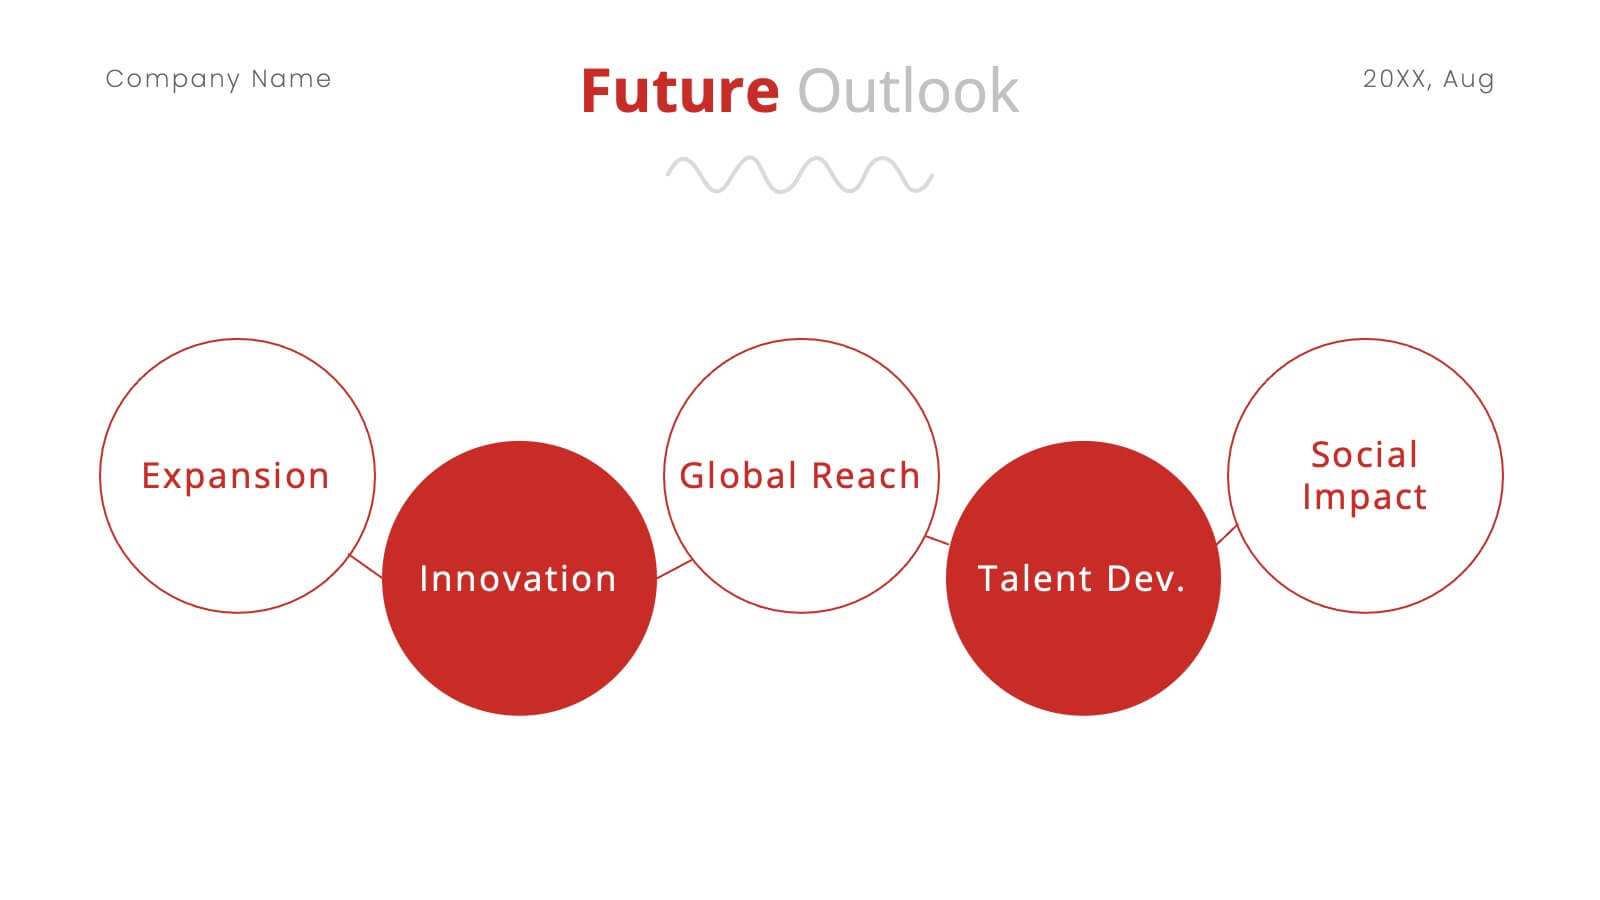
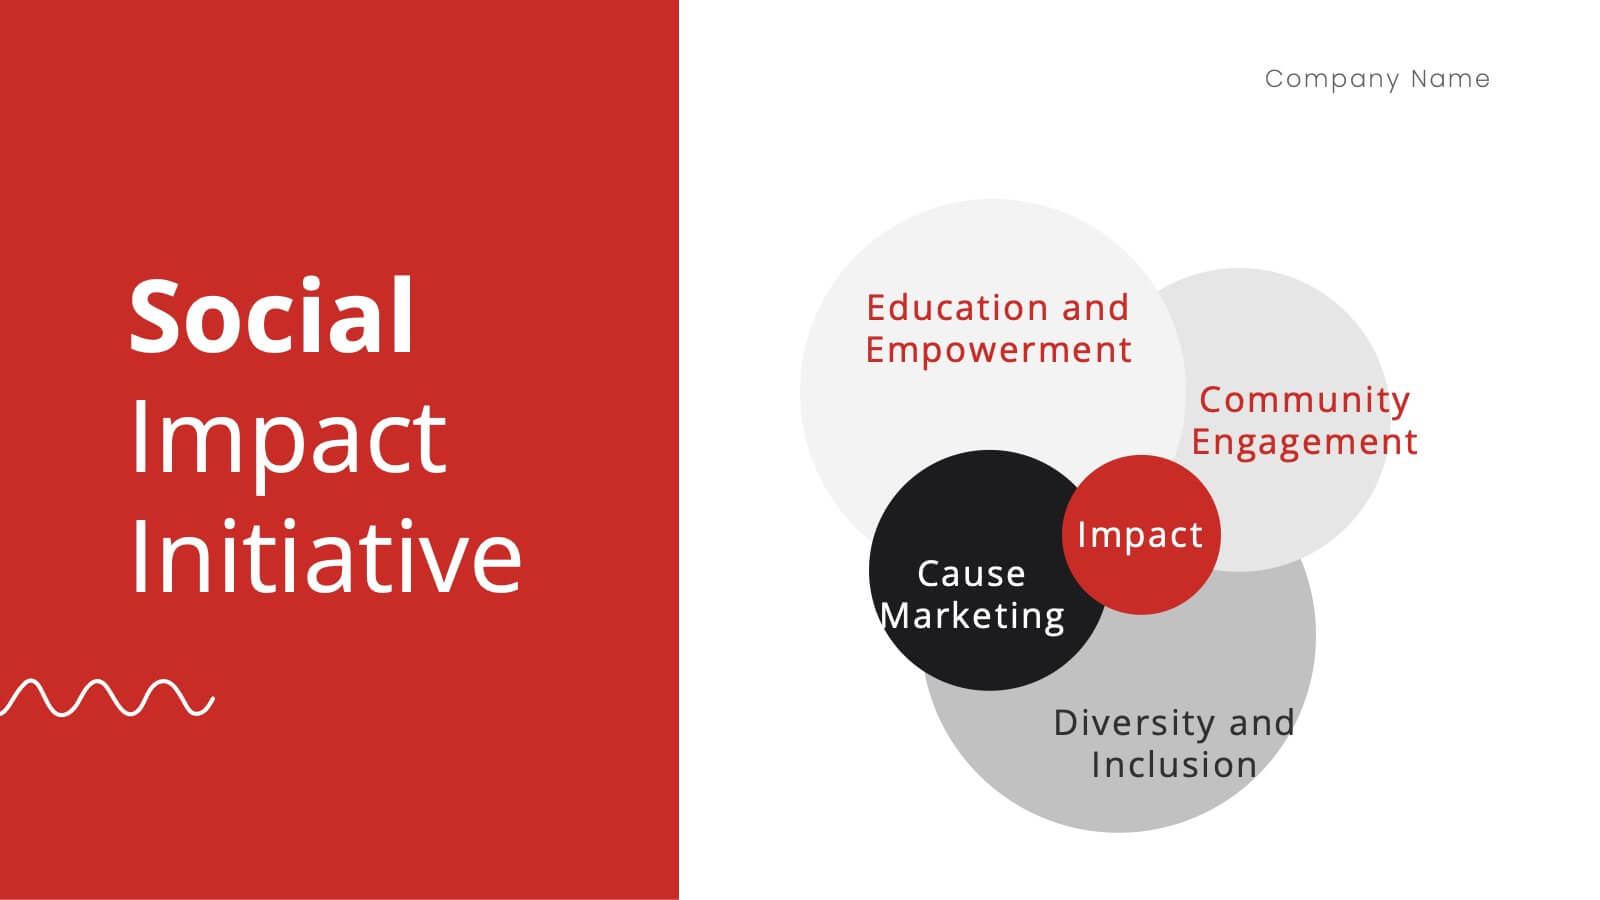
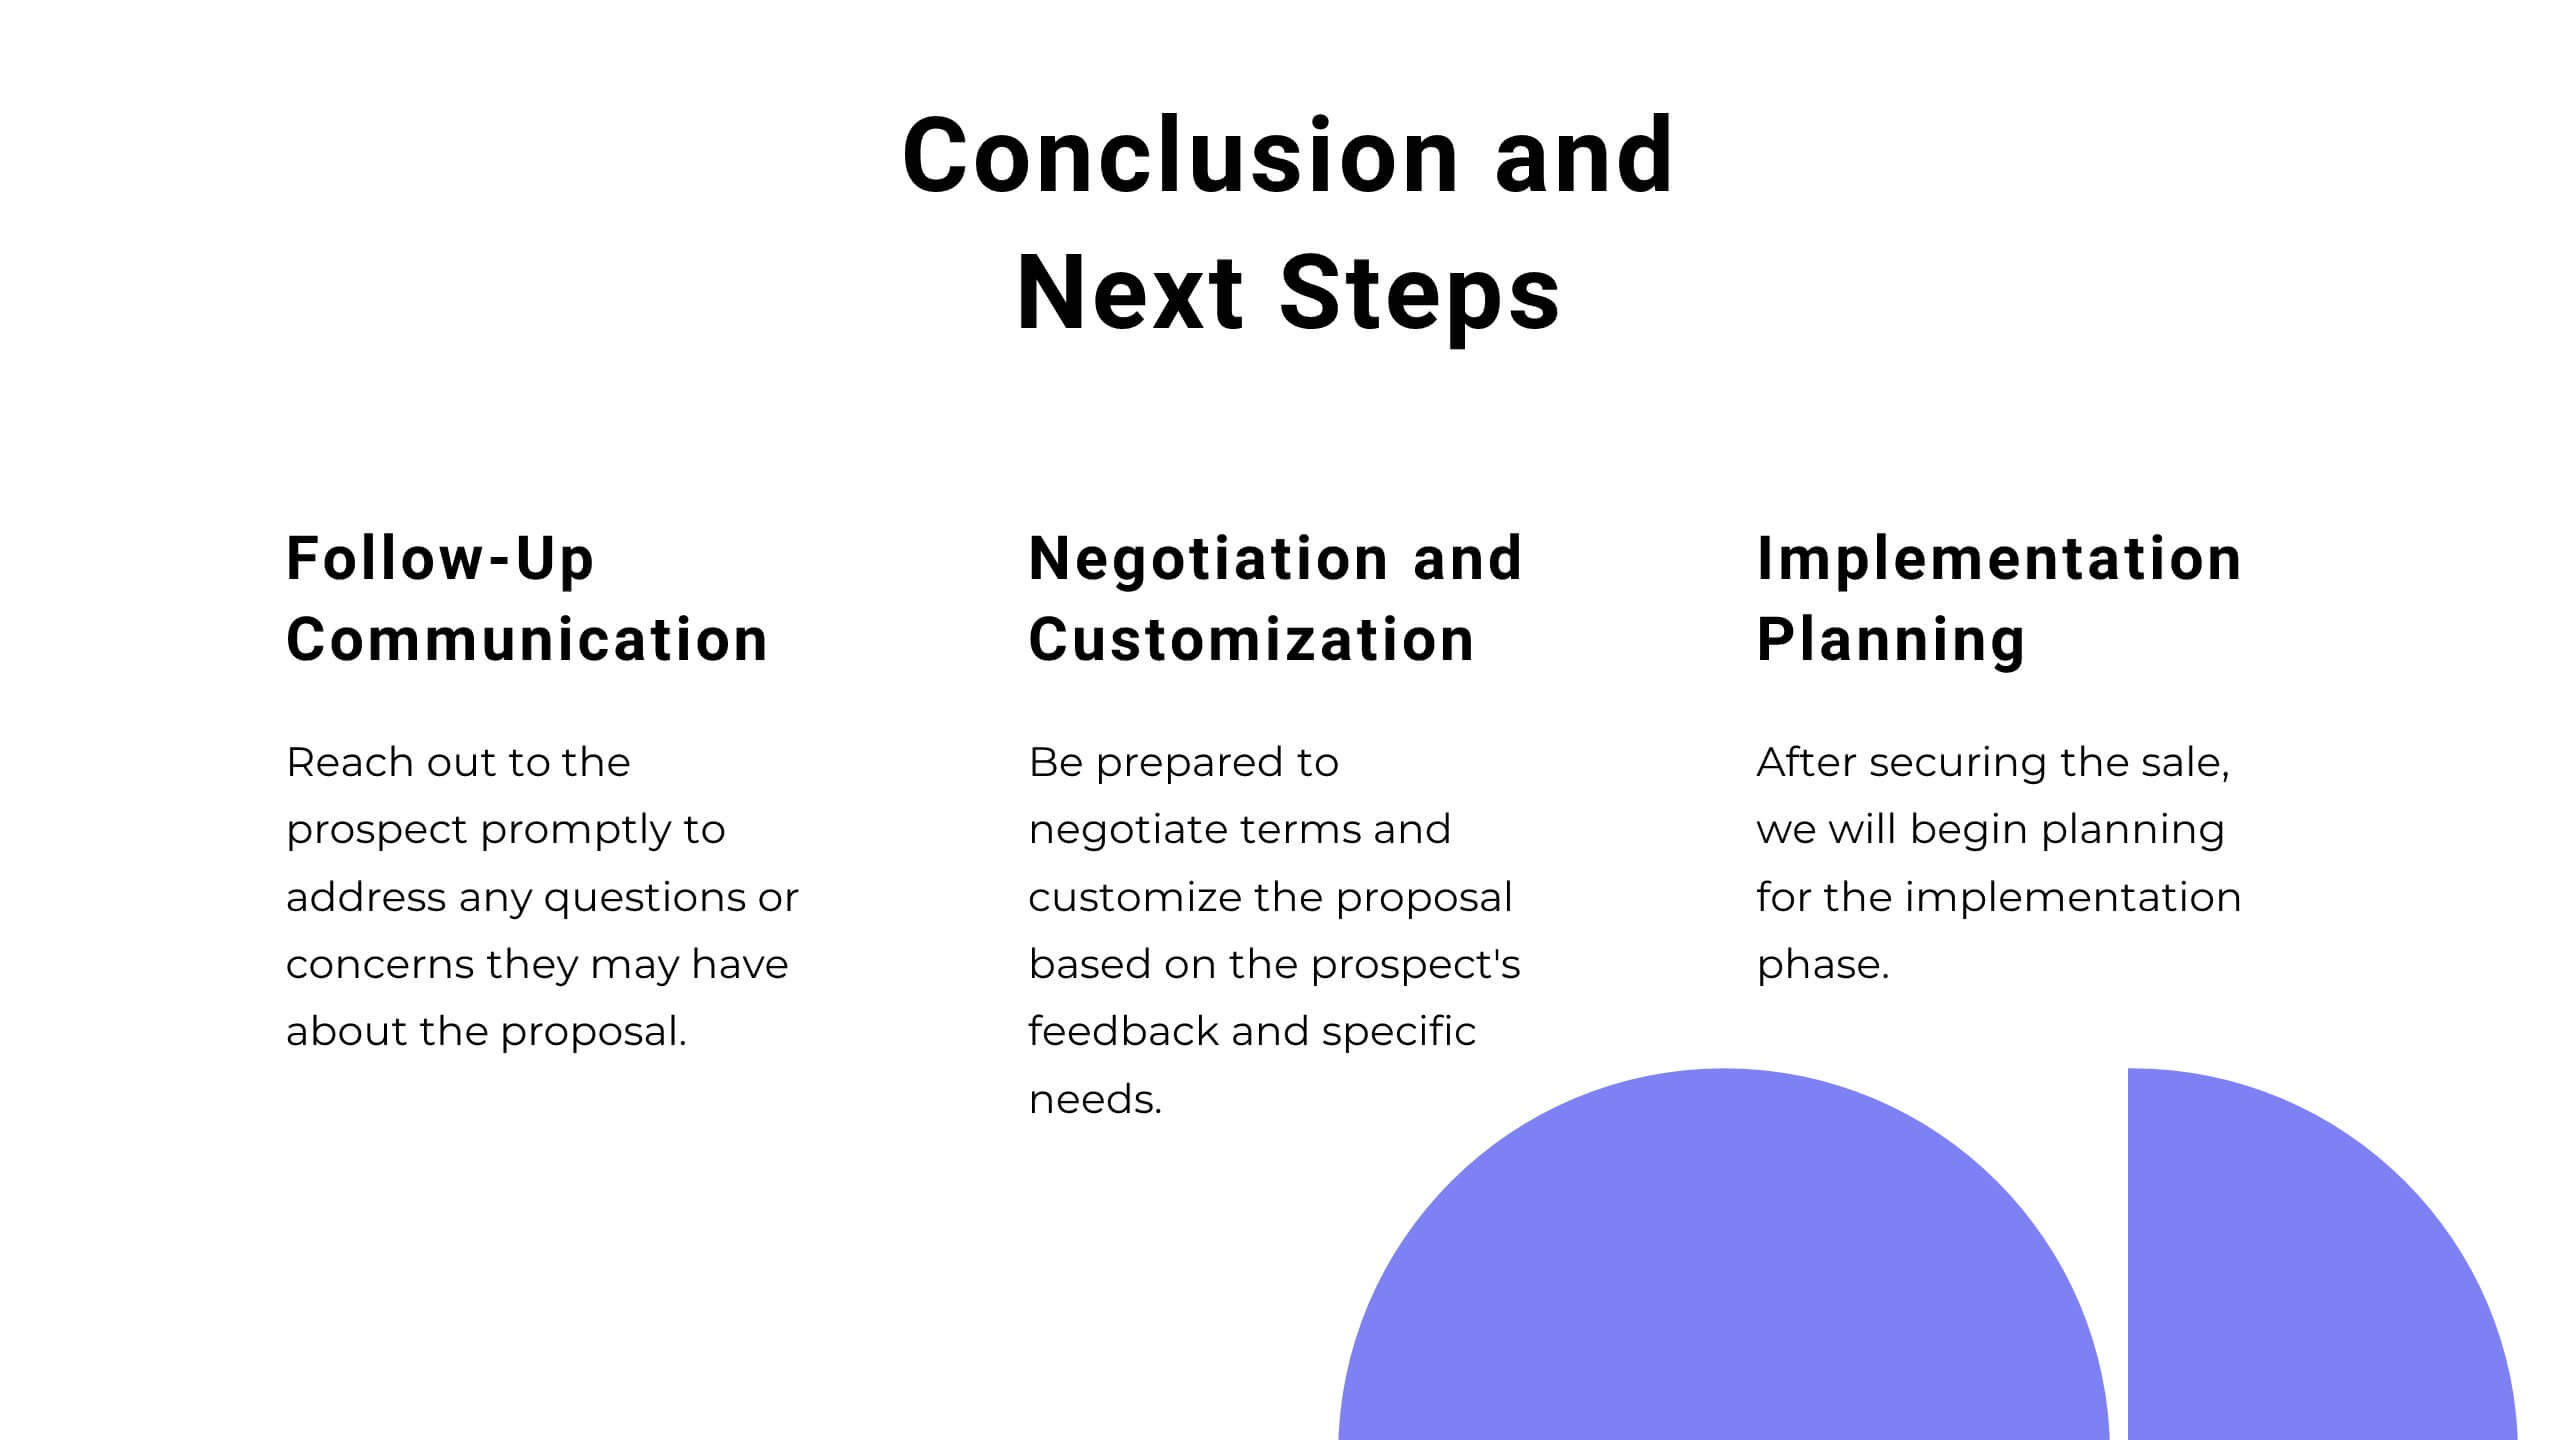
Nickel Advertising Agency Proposal Presentation
Take your advertising agency to the next level with this sleek and modern presentation template! Highlighting your services, team, success stories, and marketing strategies, it’s the perfect tool to showcase your agency’s strengths and capabilities. Fully customizable and compatible with PowerPoint, Keynote, and Google Slides, this template is ideal for impressing potential clients and partners.


7 diapositivas
Artificial Intelligence Uses Infographic
Artificial Intelligence (AI) is no longer just a concept of sci-fi narratives but an integral part of our daily lives. Our compelling infographic, set against a clean white backdrop with contrasting hues of blue, provides a captivating look into the myriad uses of AI. From healthcare innovations to smart home solutions, our visually engaging template breaks down complex AI applications into digestible information bites. Ideal for educators, tech enthusiasts, and businesses, it's a versatile tool designed for multiple presentation platforms, including PowerPoint, Keynote, and Google Slides.


7 diapositivas
Scrum Sprints Planning Presentation
Kick off your workflow with a dynamic visual that maps out every phase of your team’s process in a clean, structured layout. This presentation helps explain planning cycles, task sequencing, and collaborative decision-making in a clear, engaging format. Fully compatible with PowerPoint, Keynote, and Google Slides.

21 diapositivas
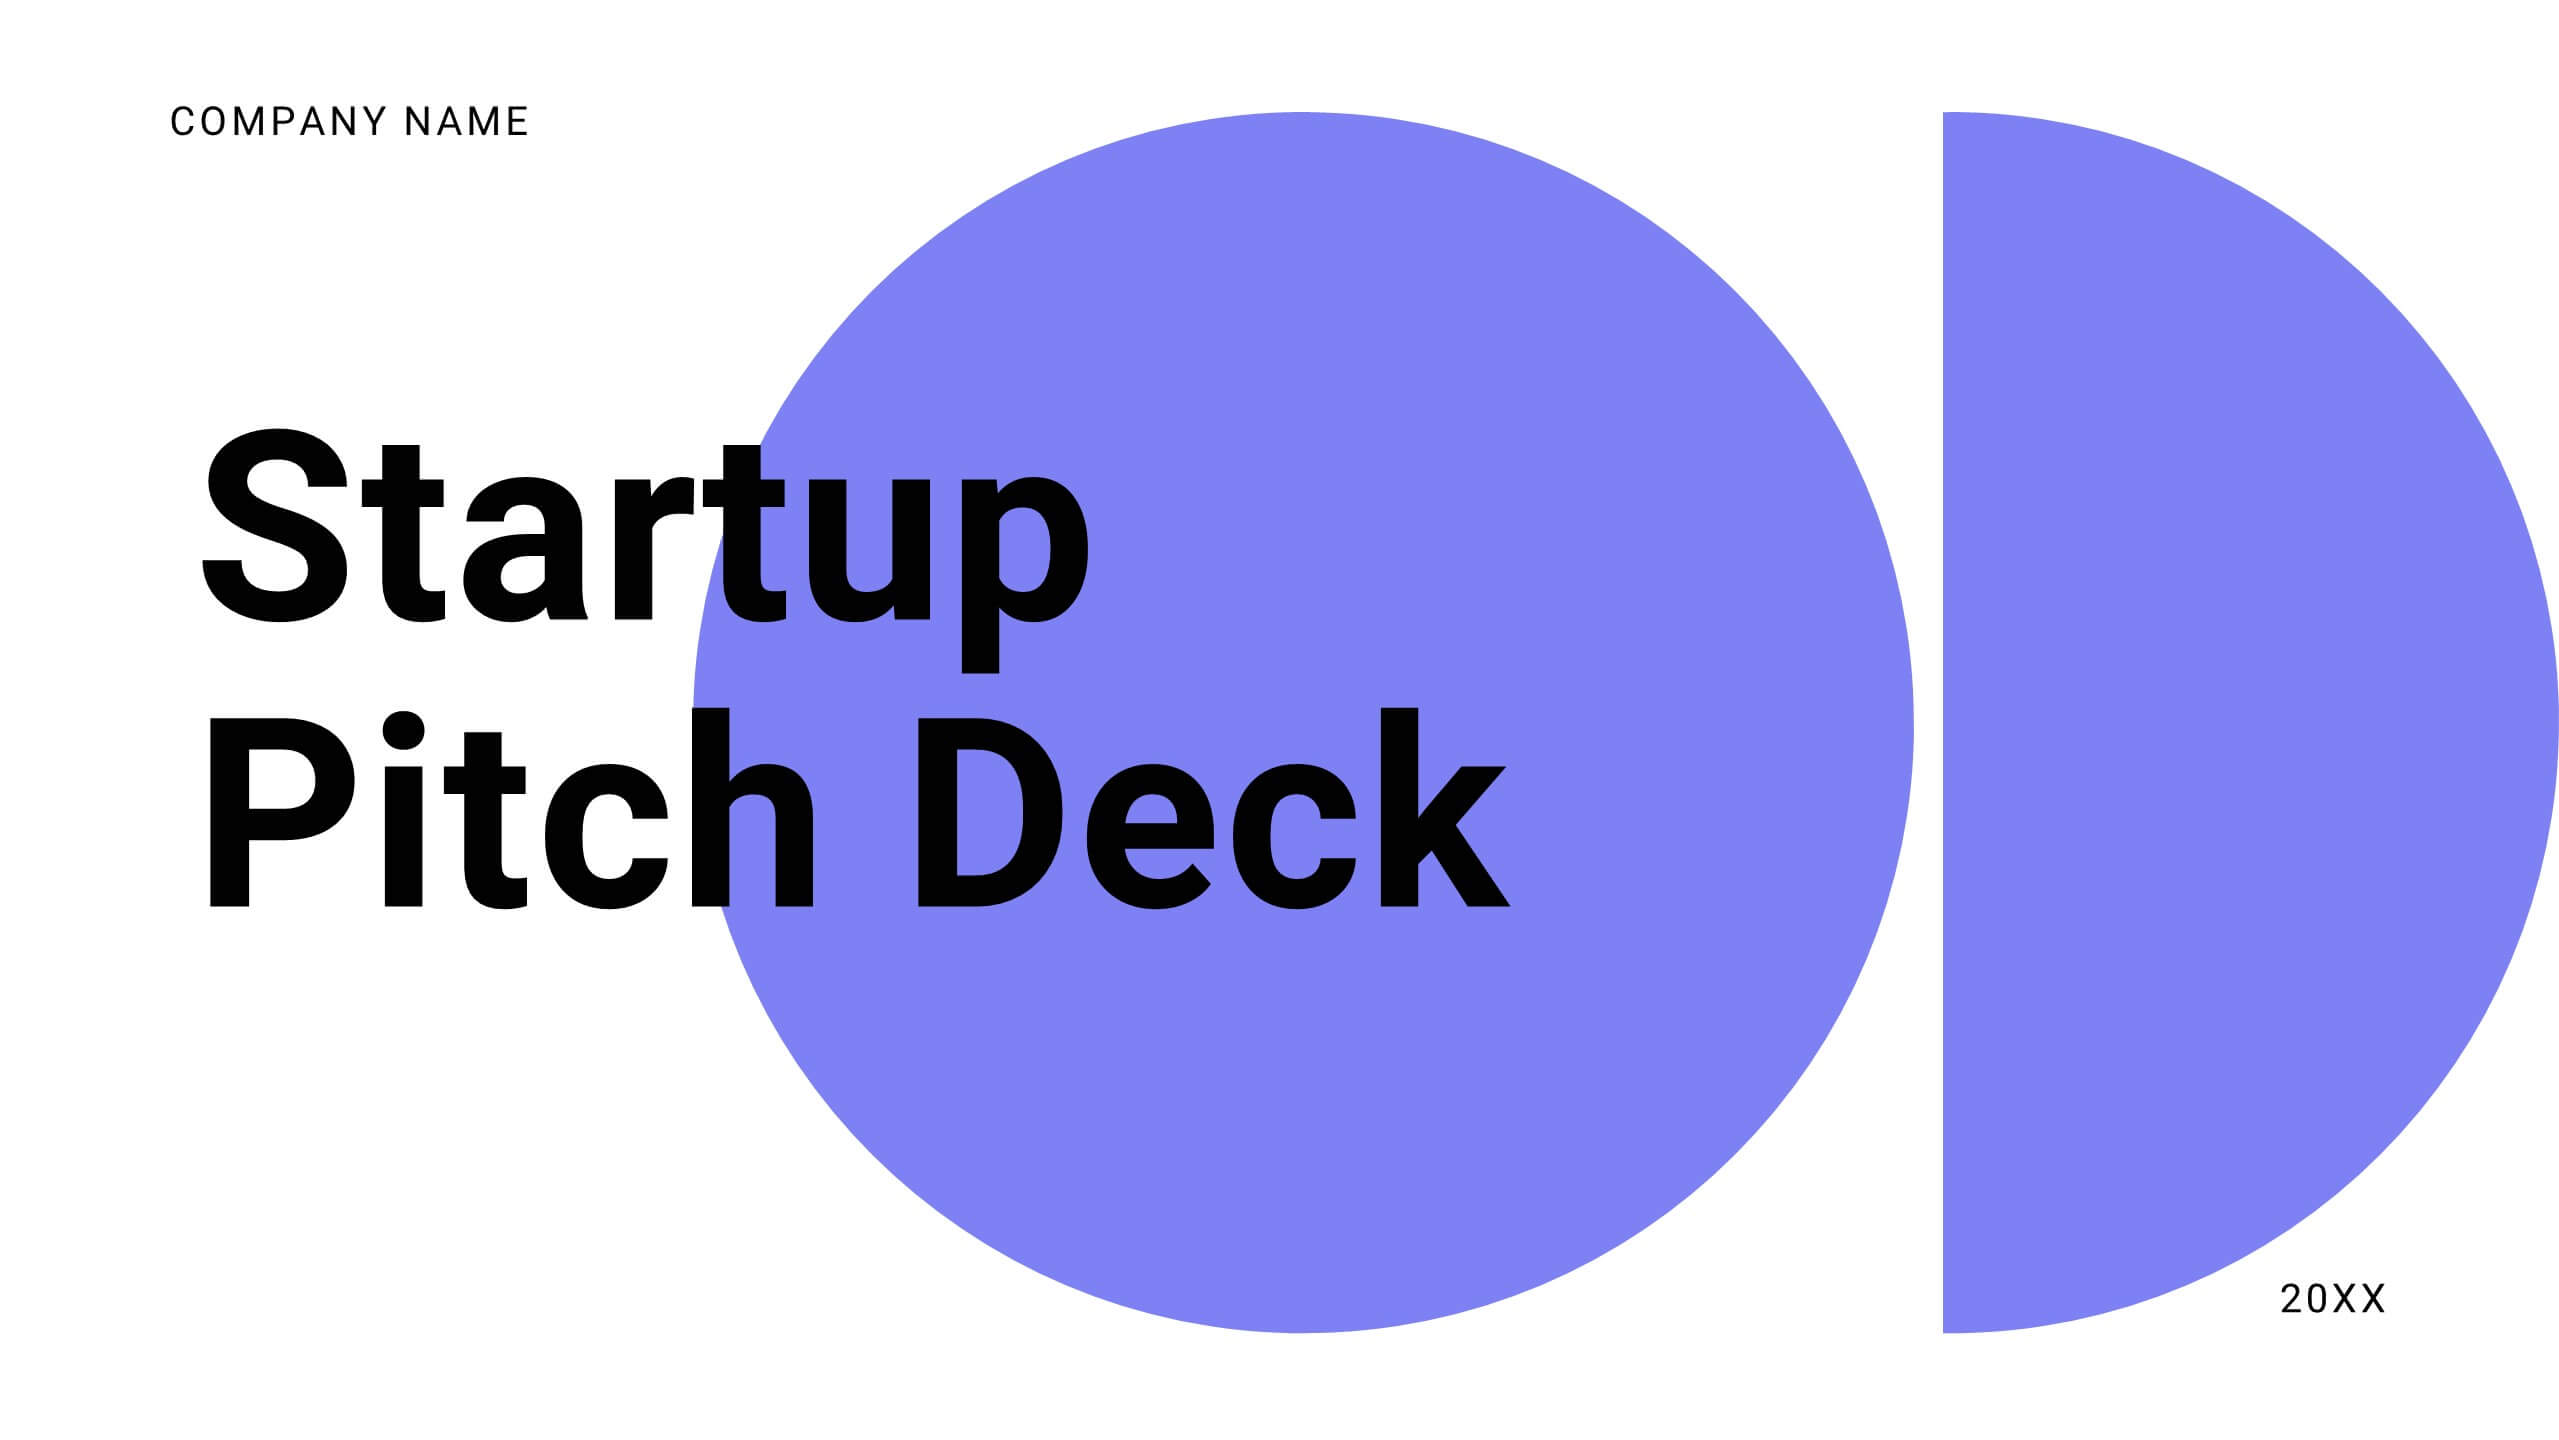
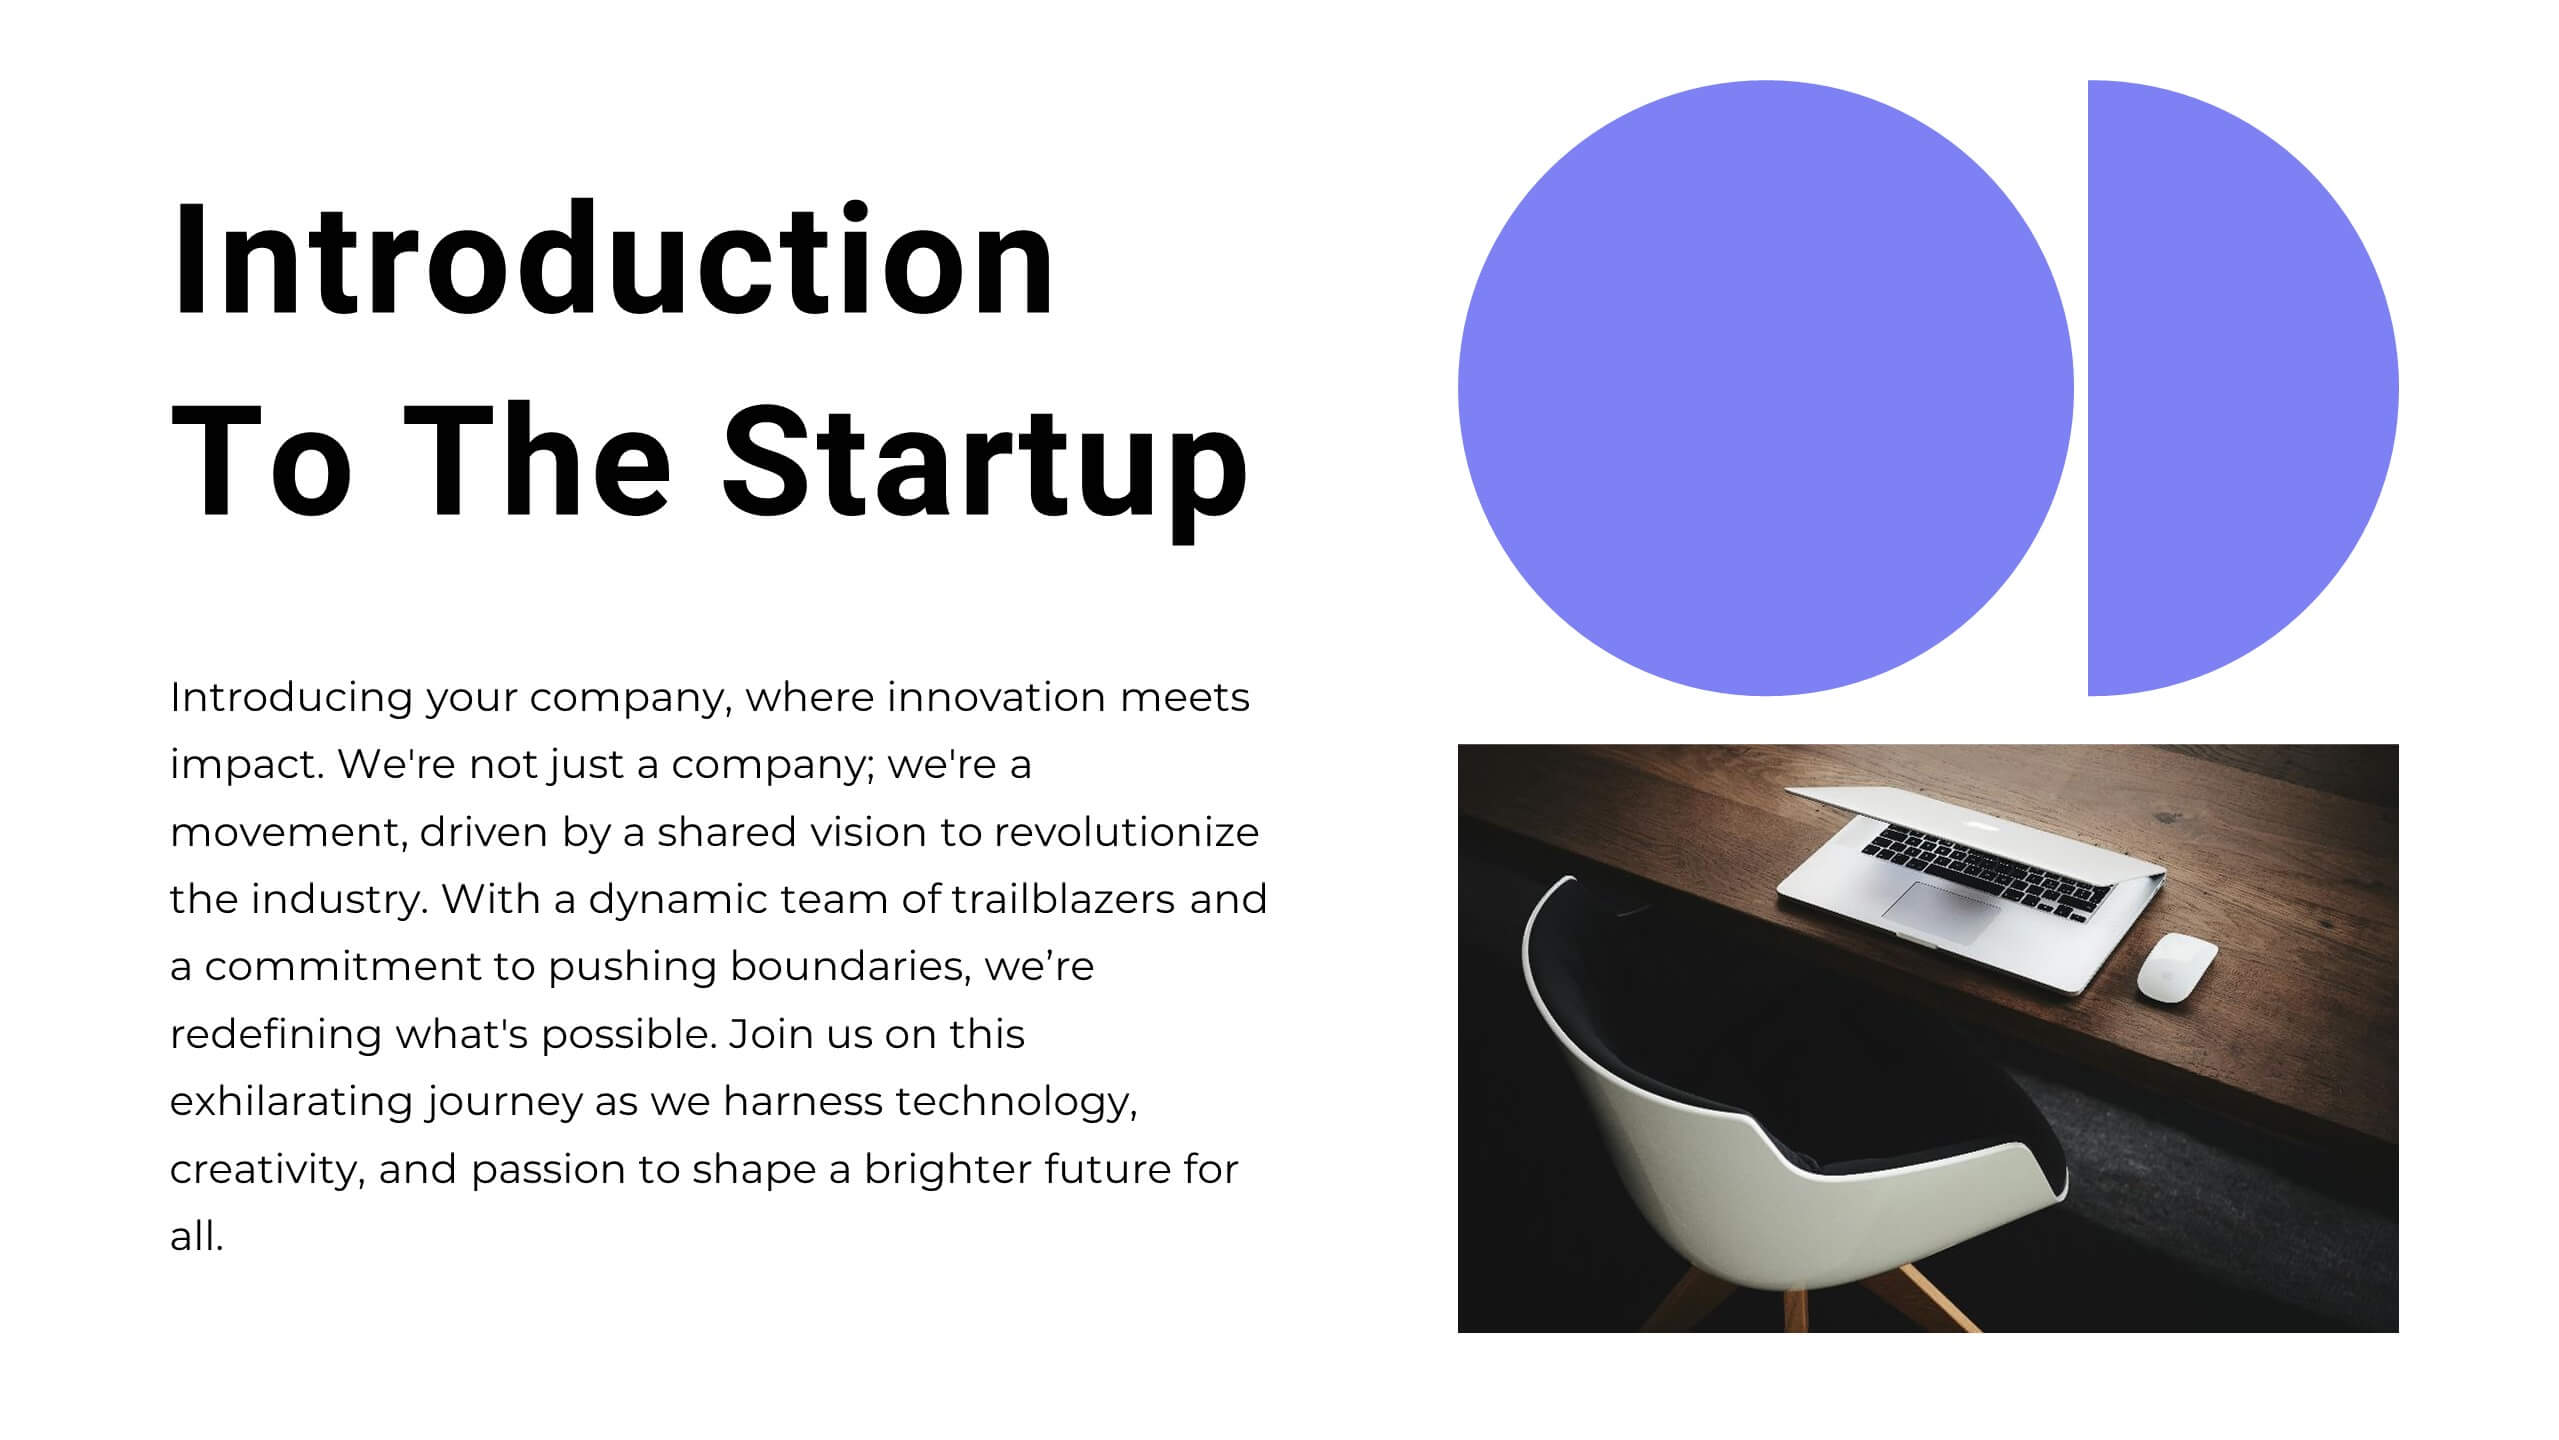
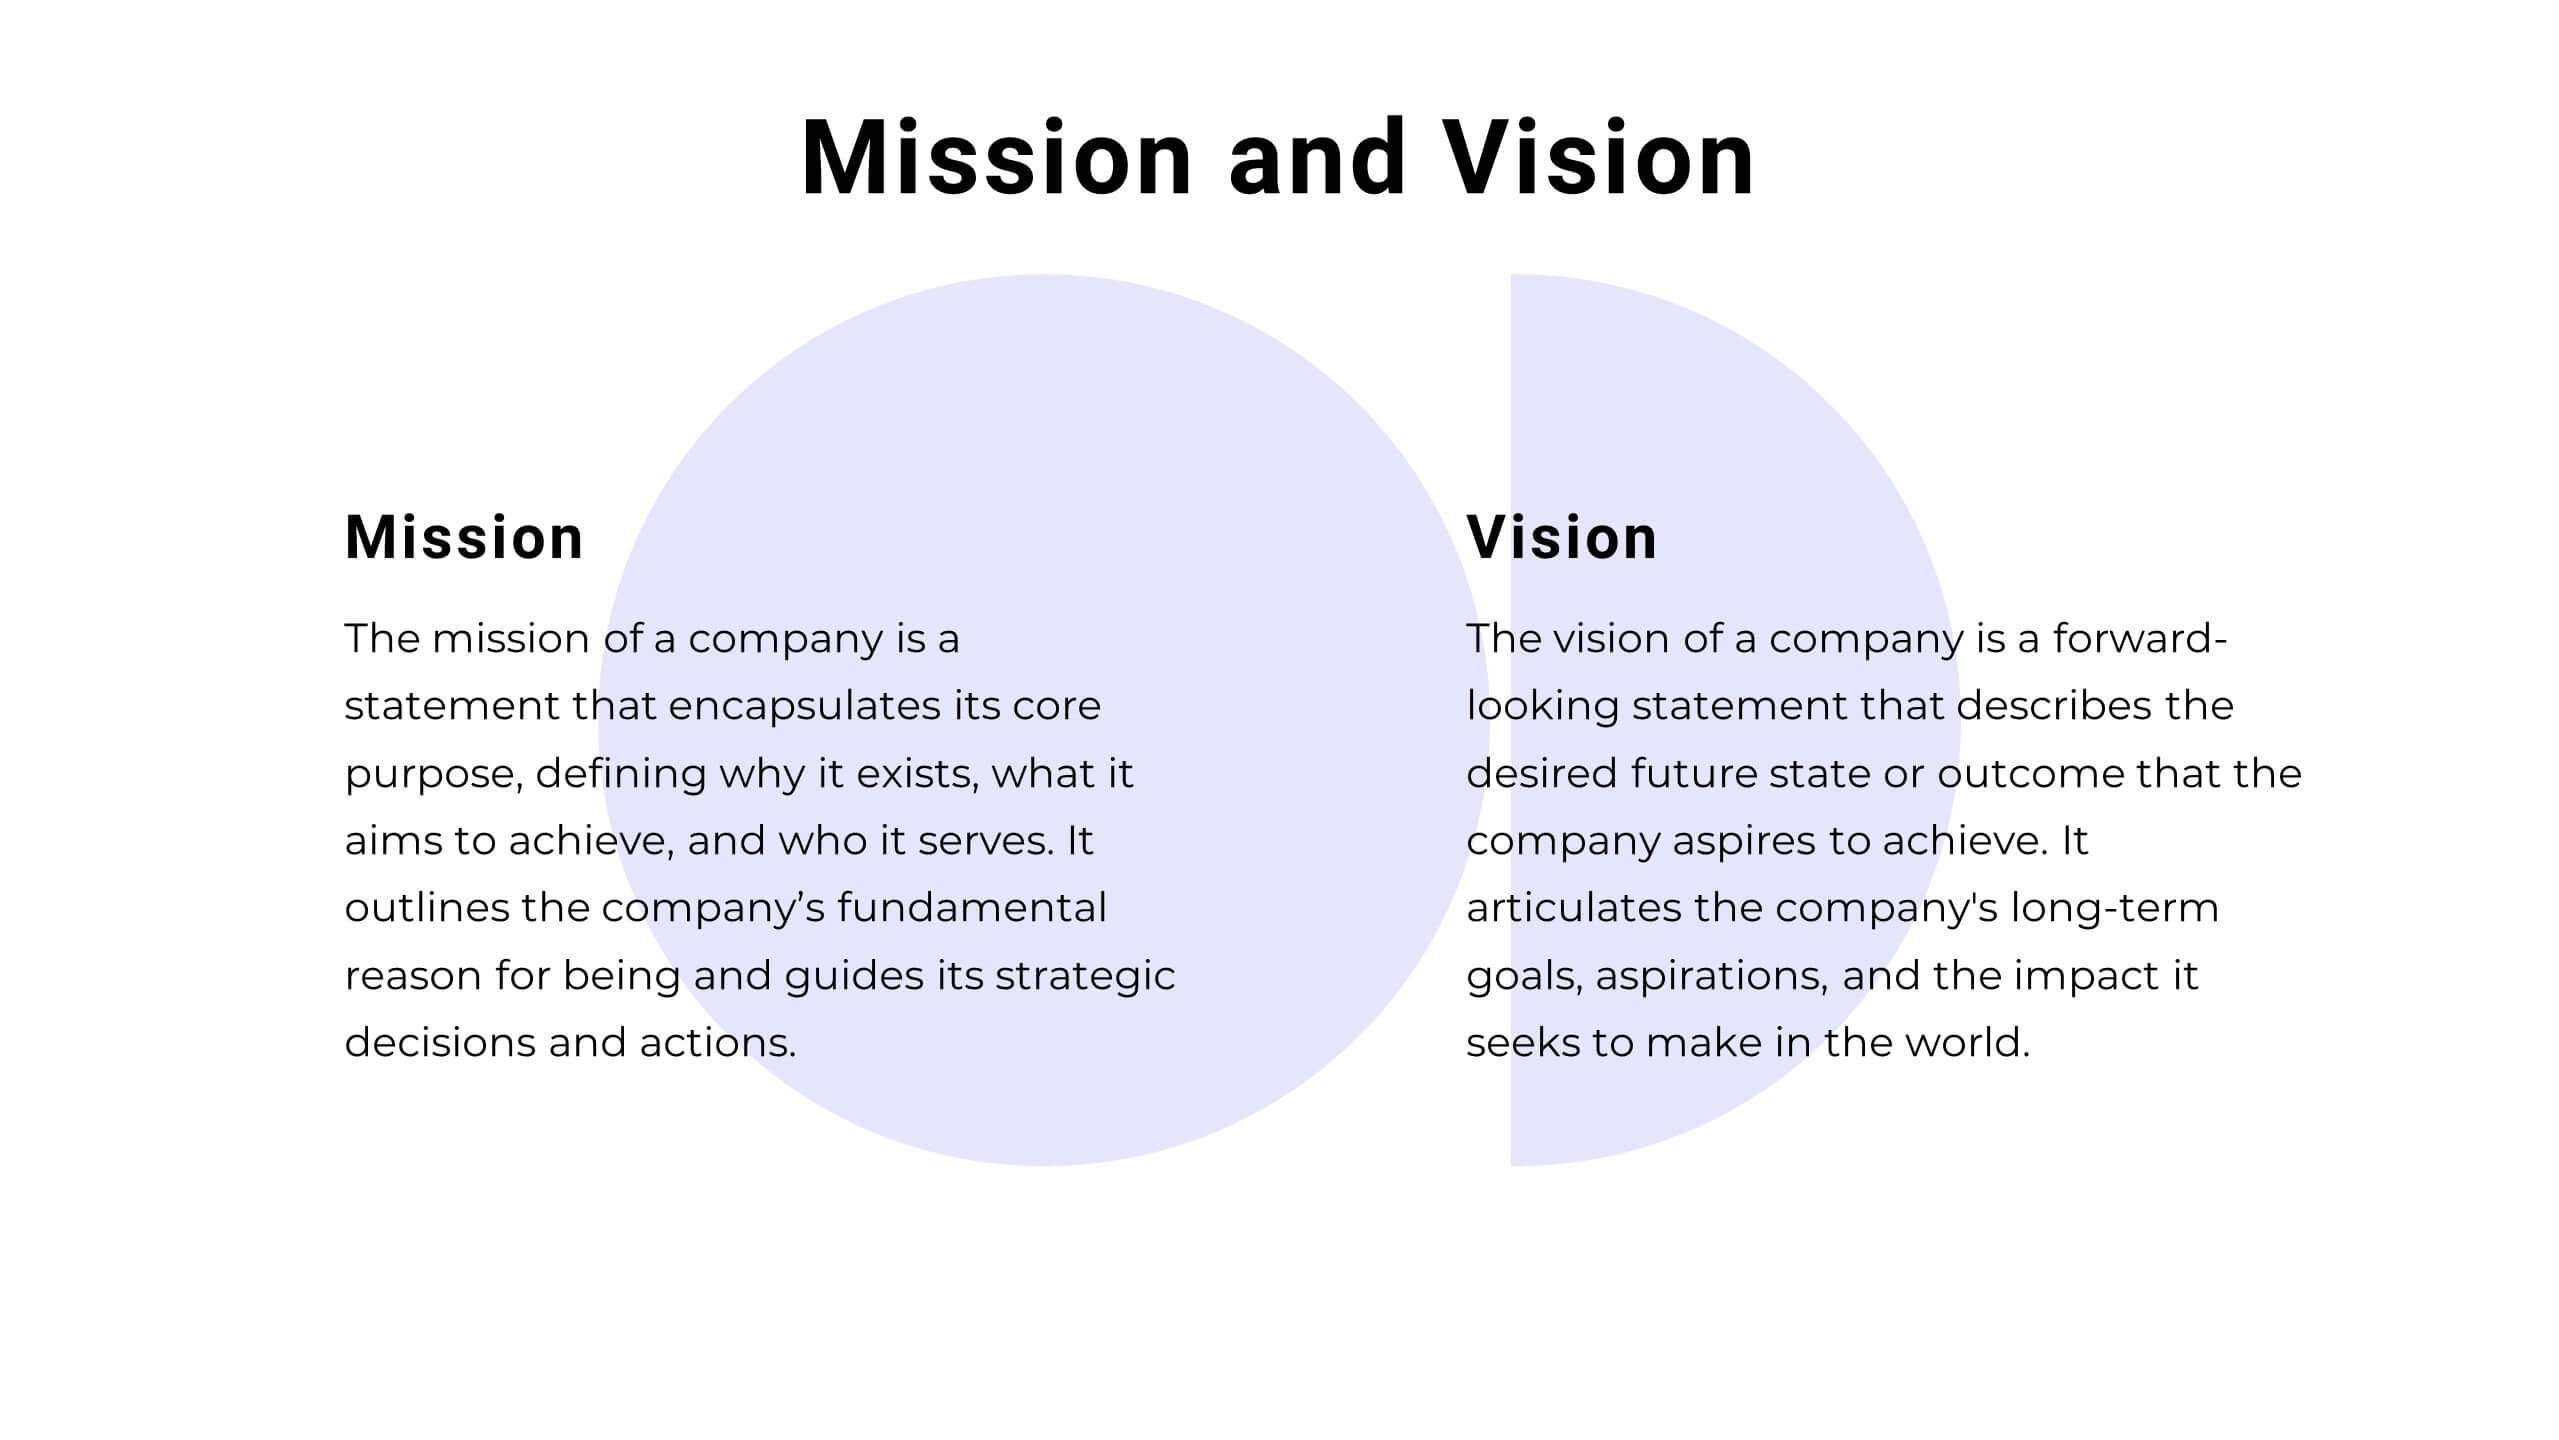
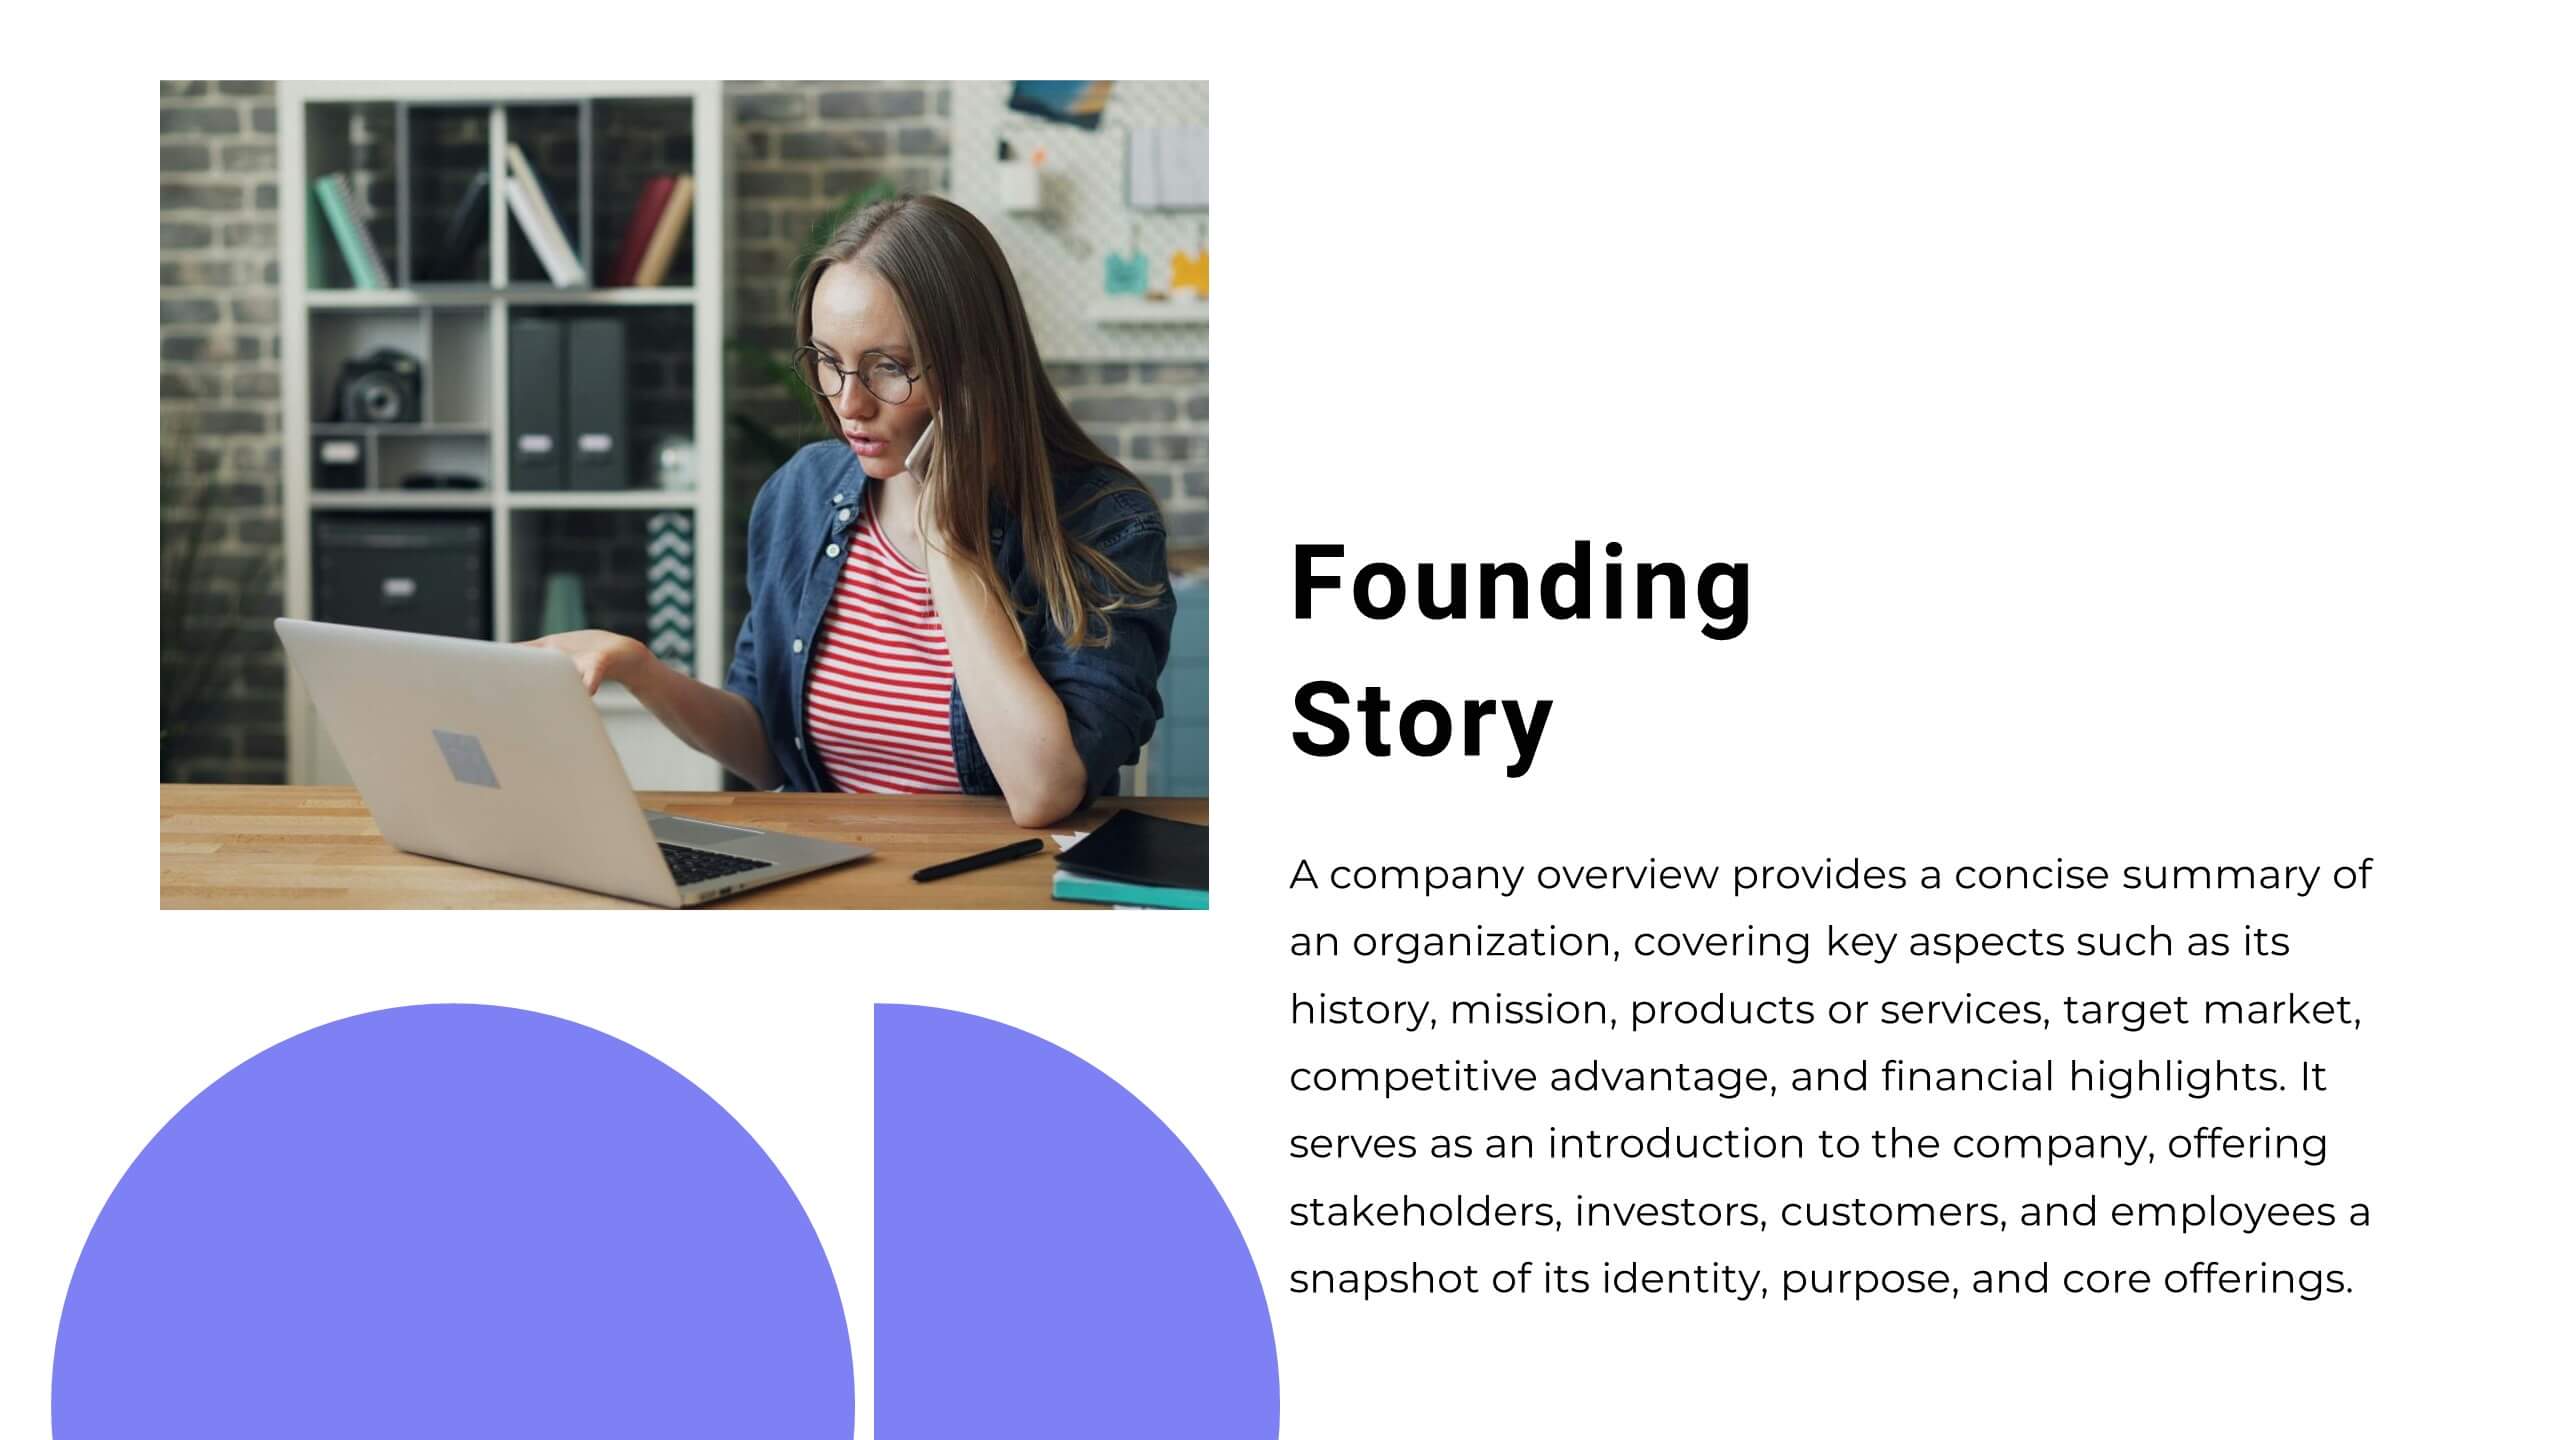
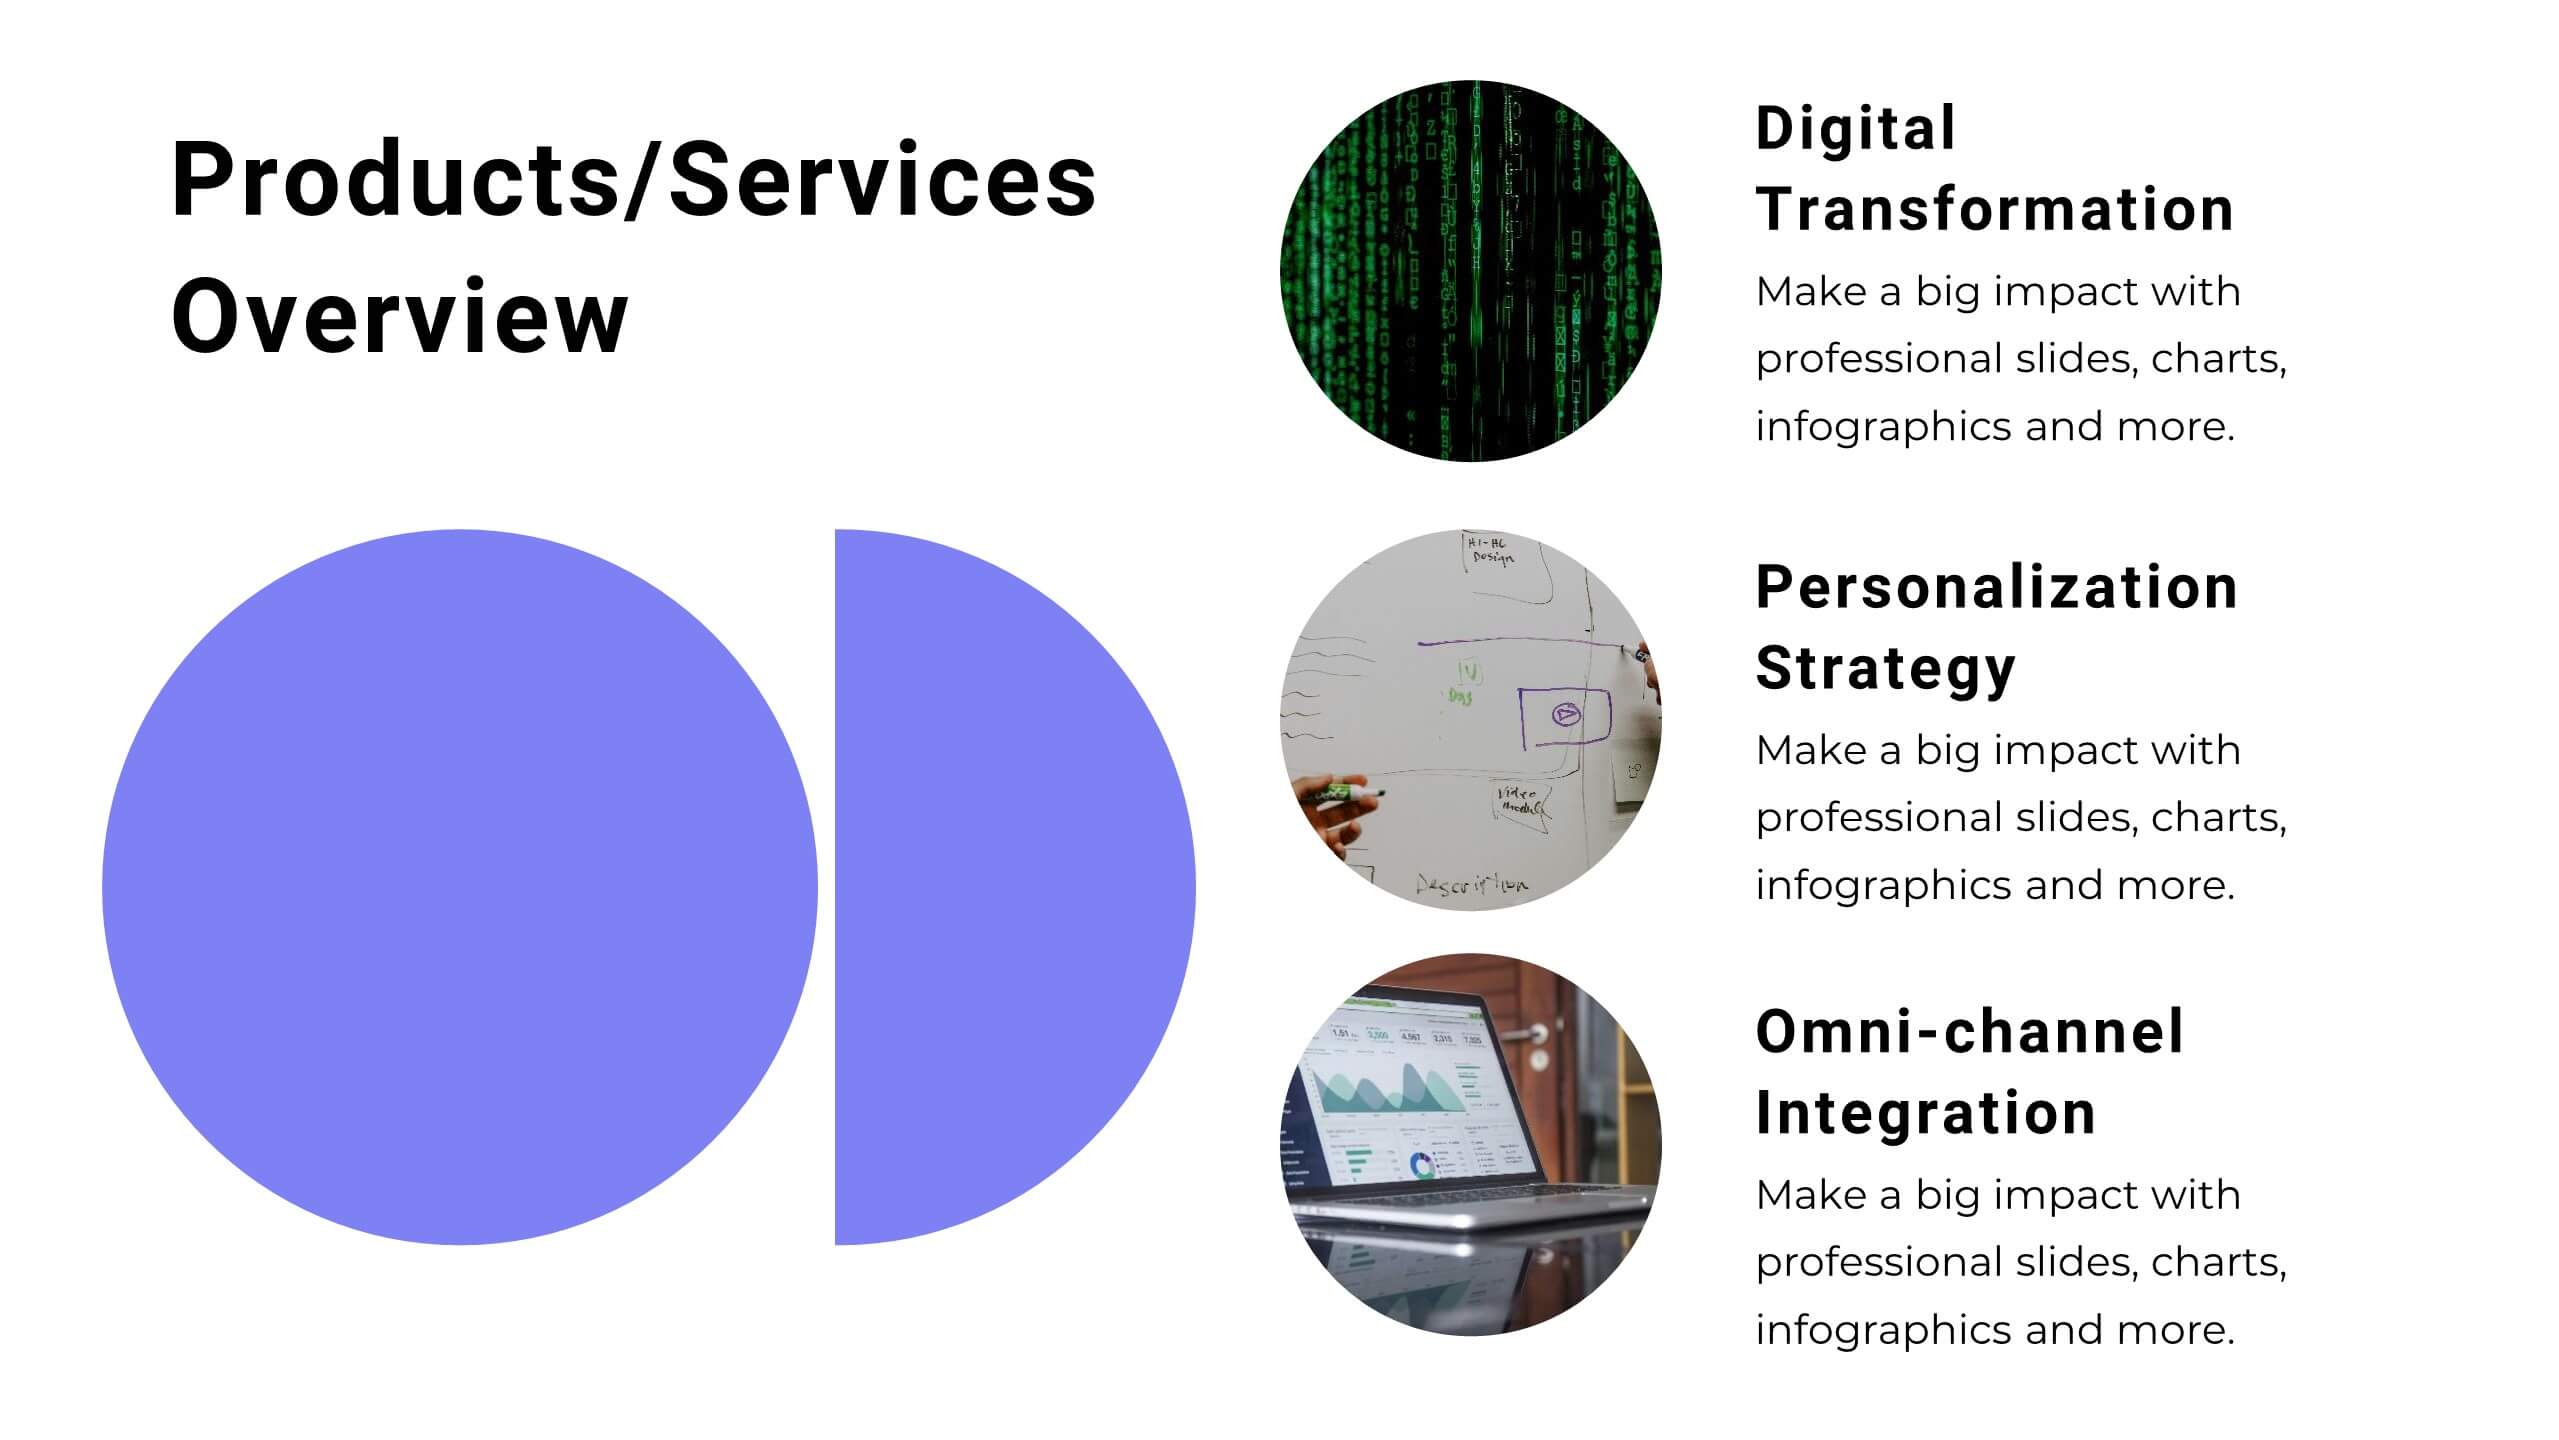
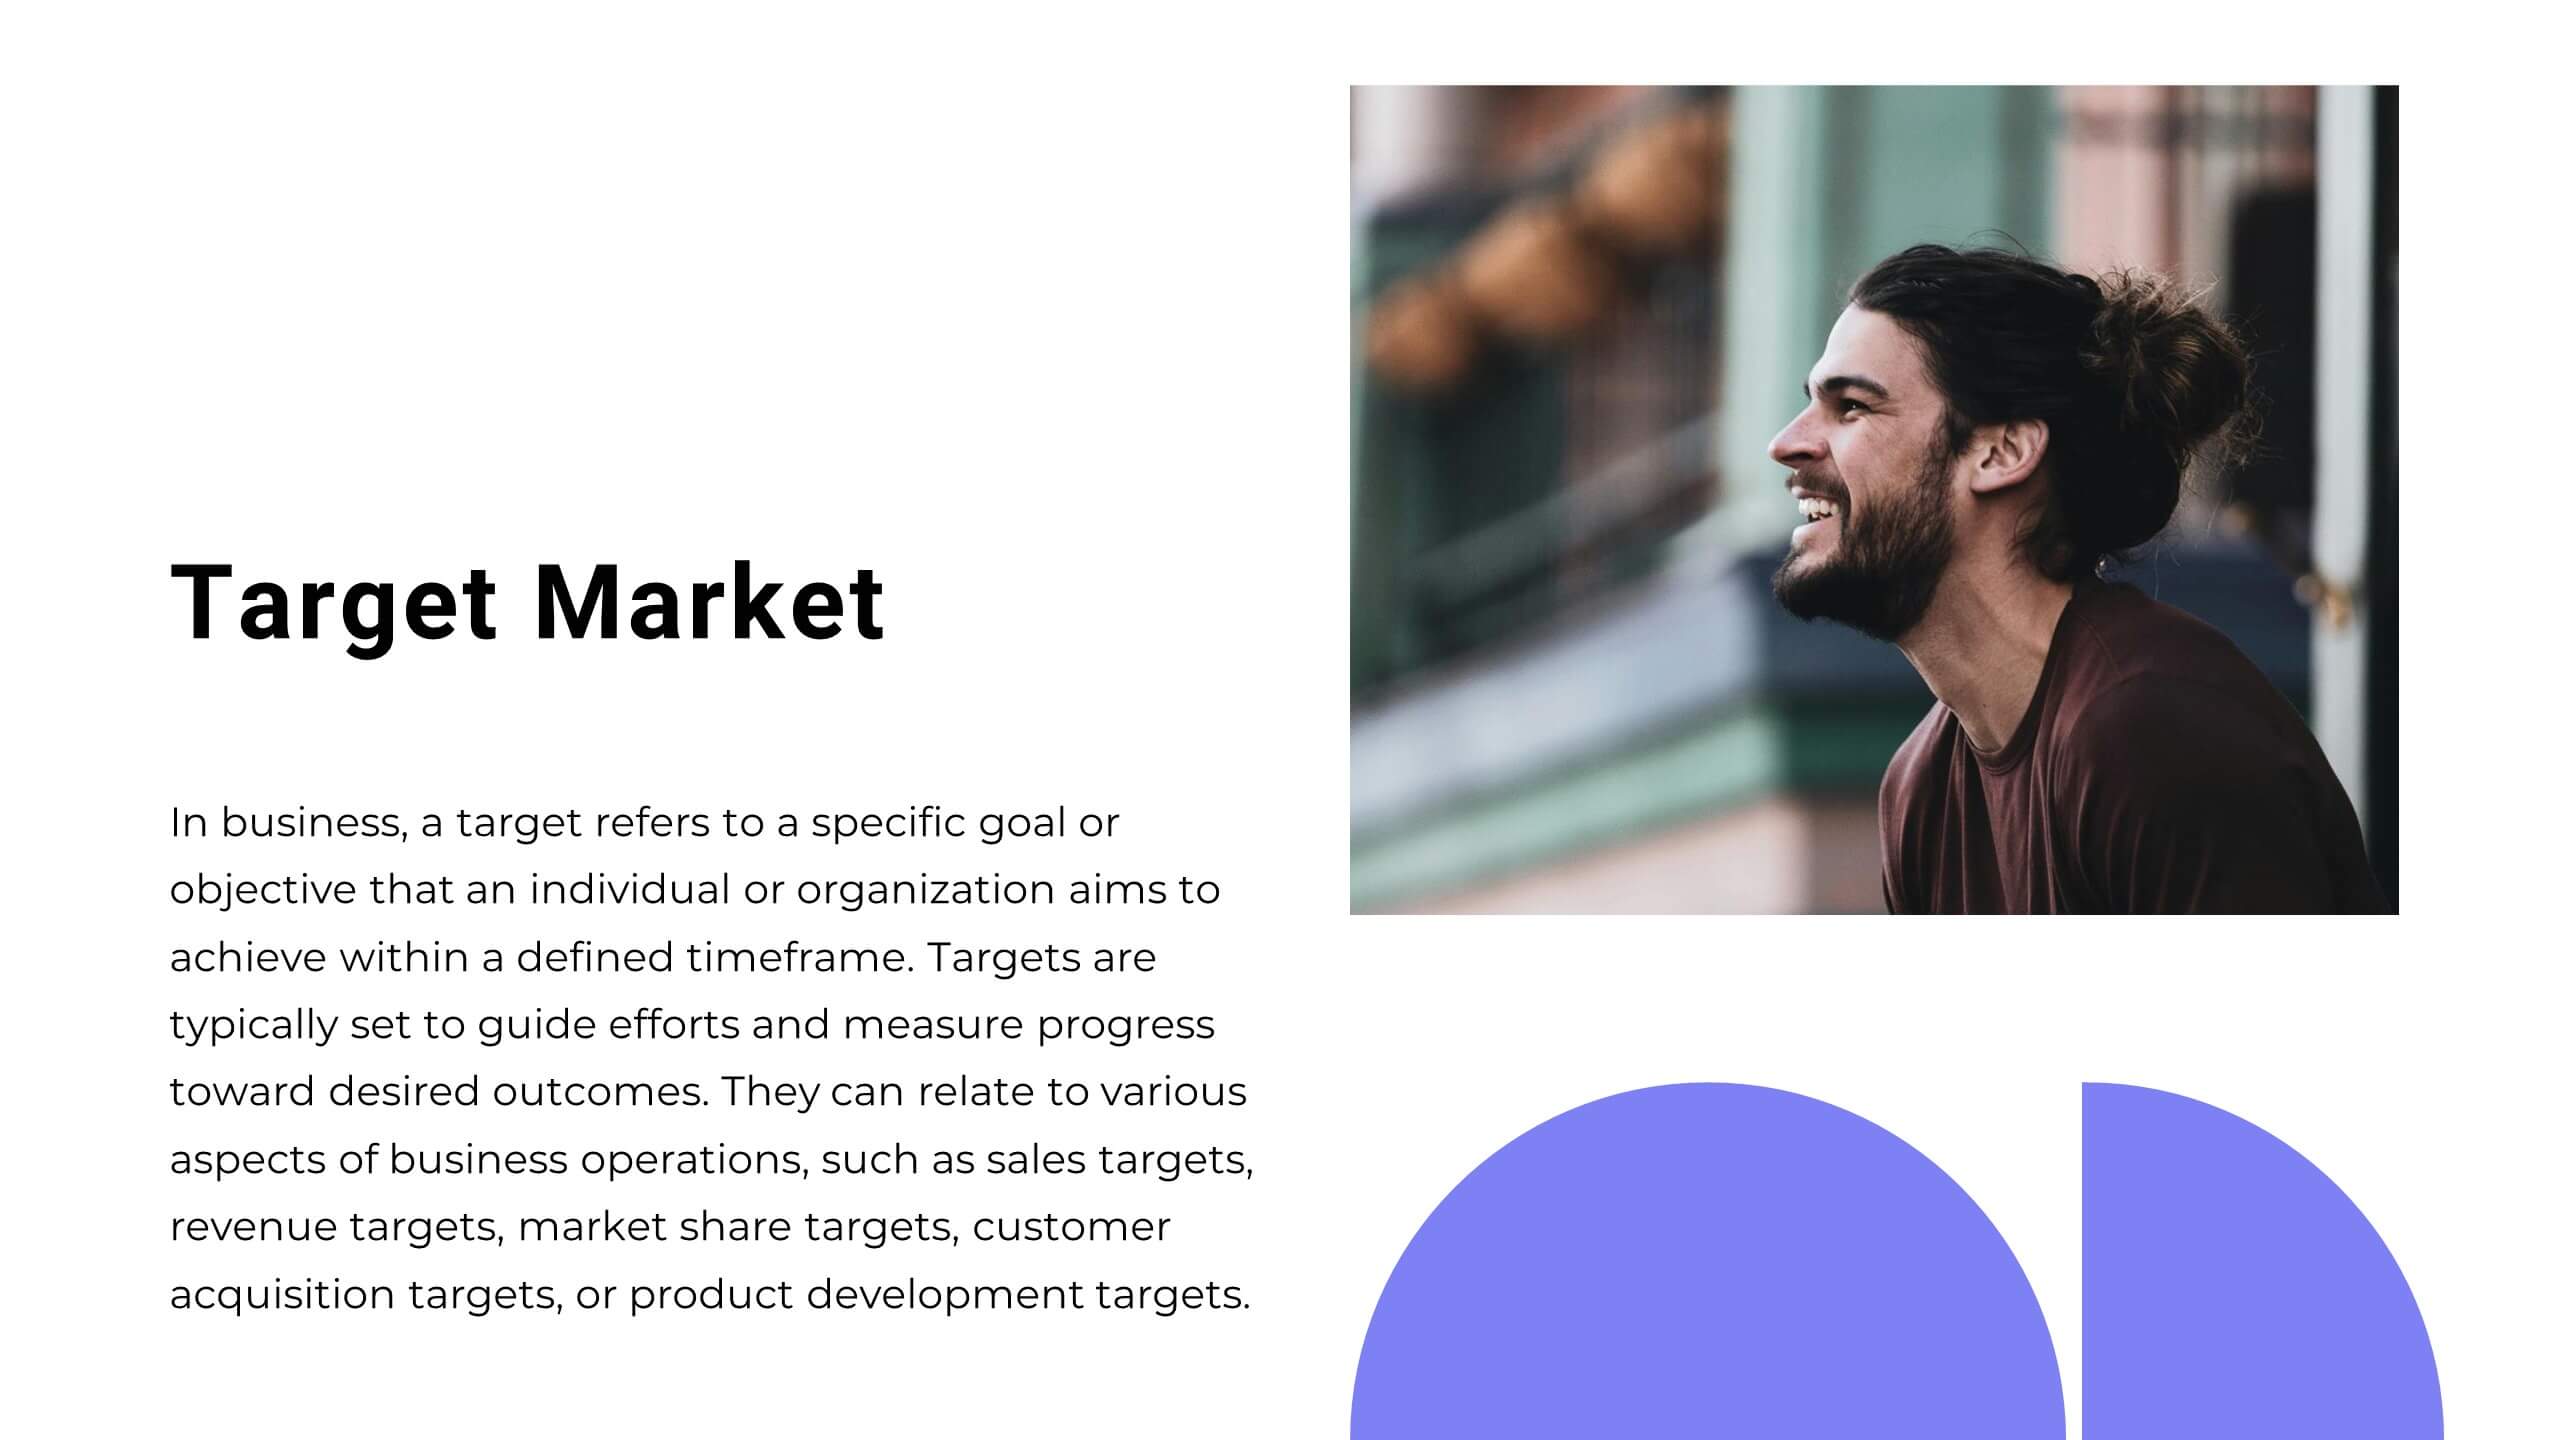
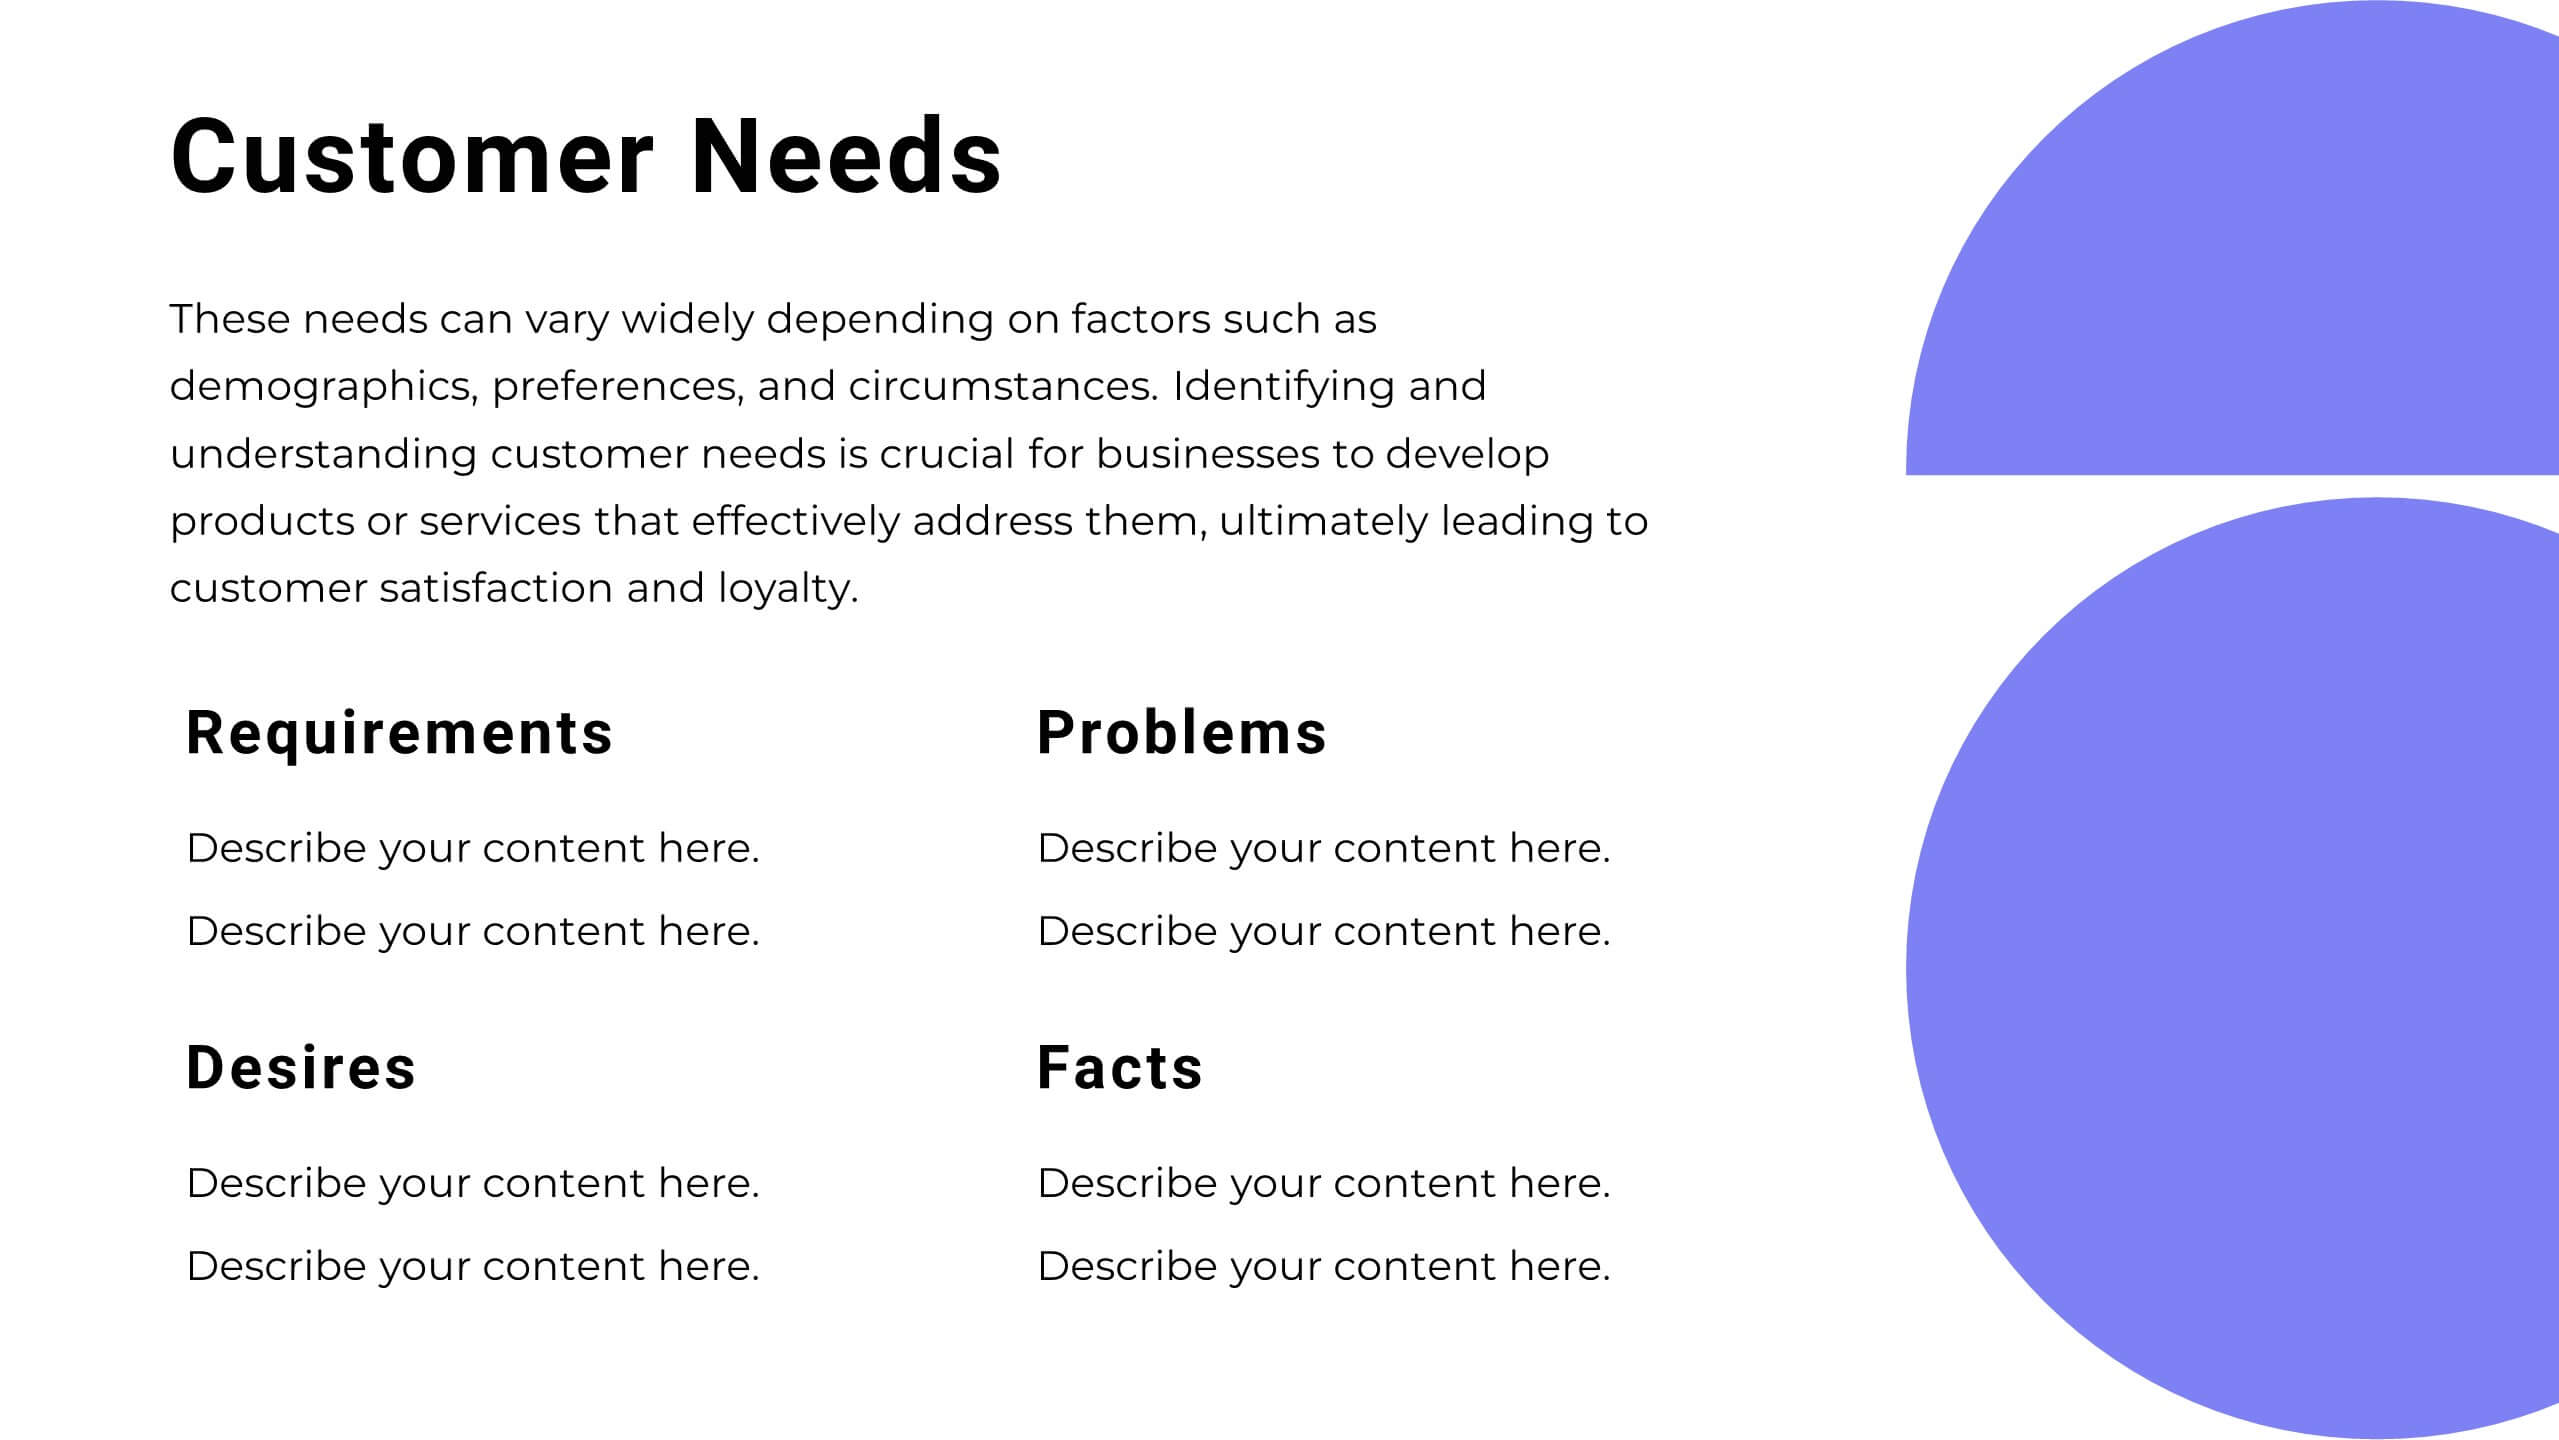
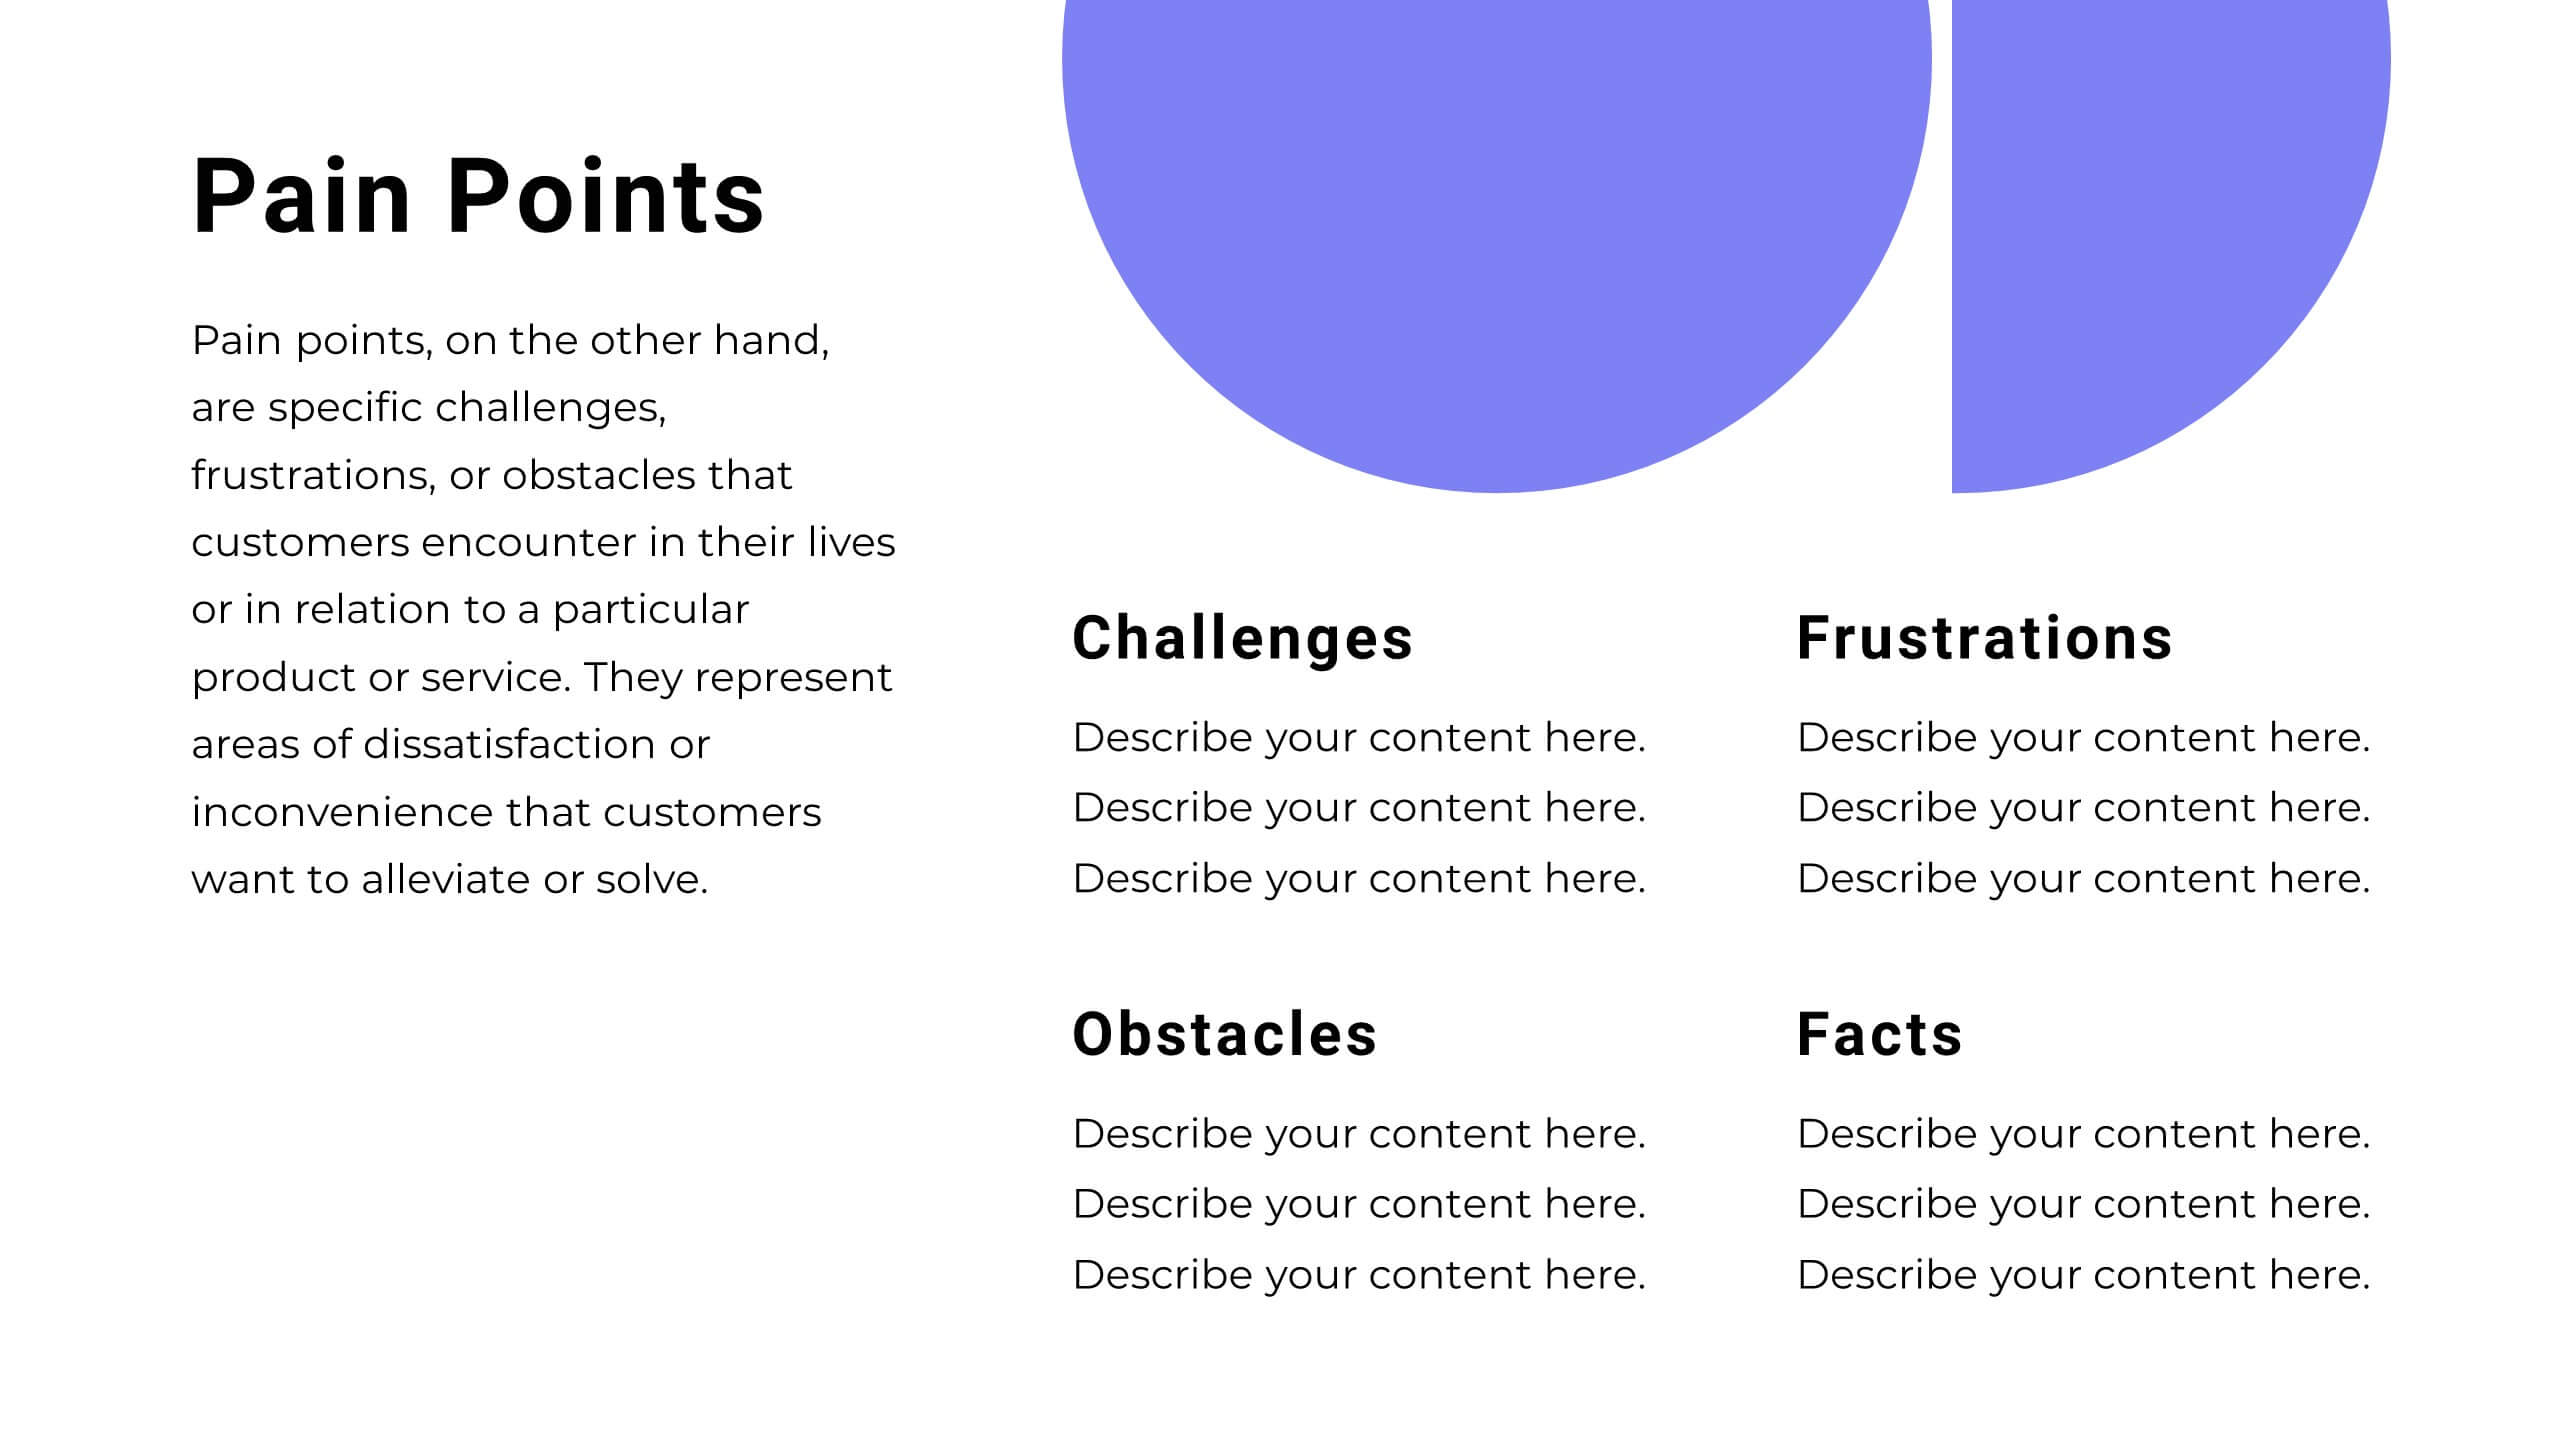
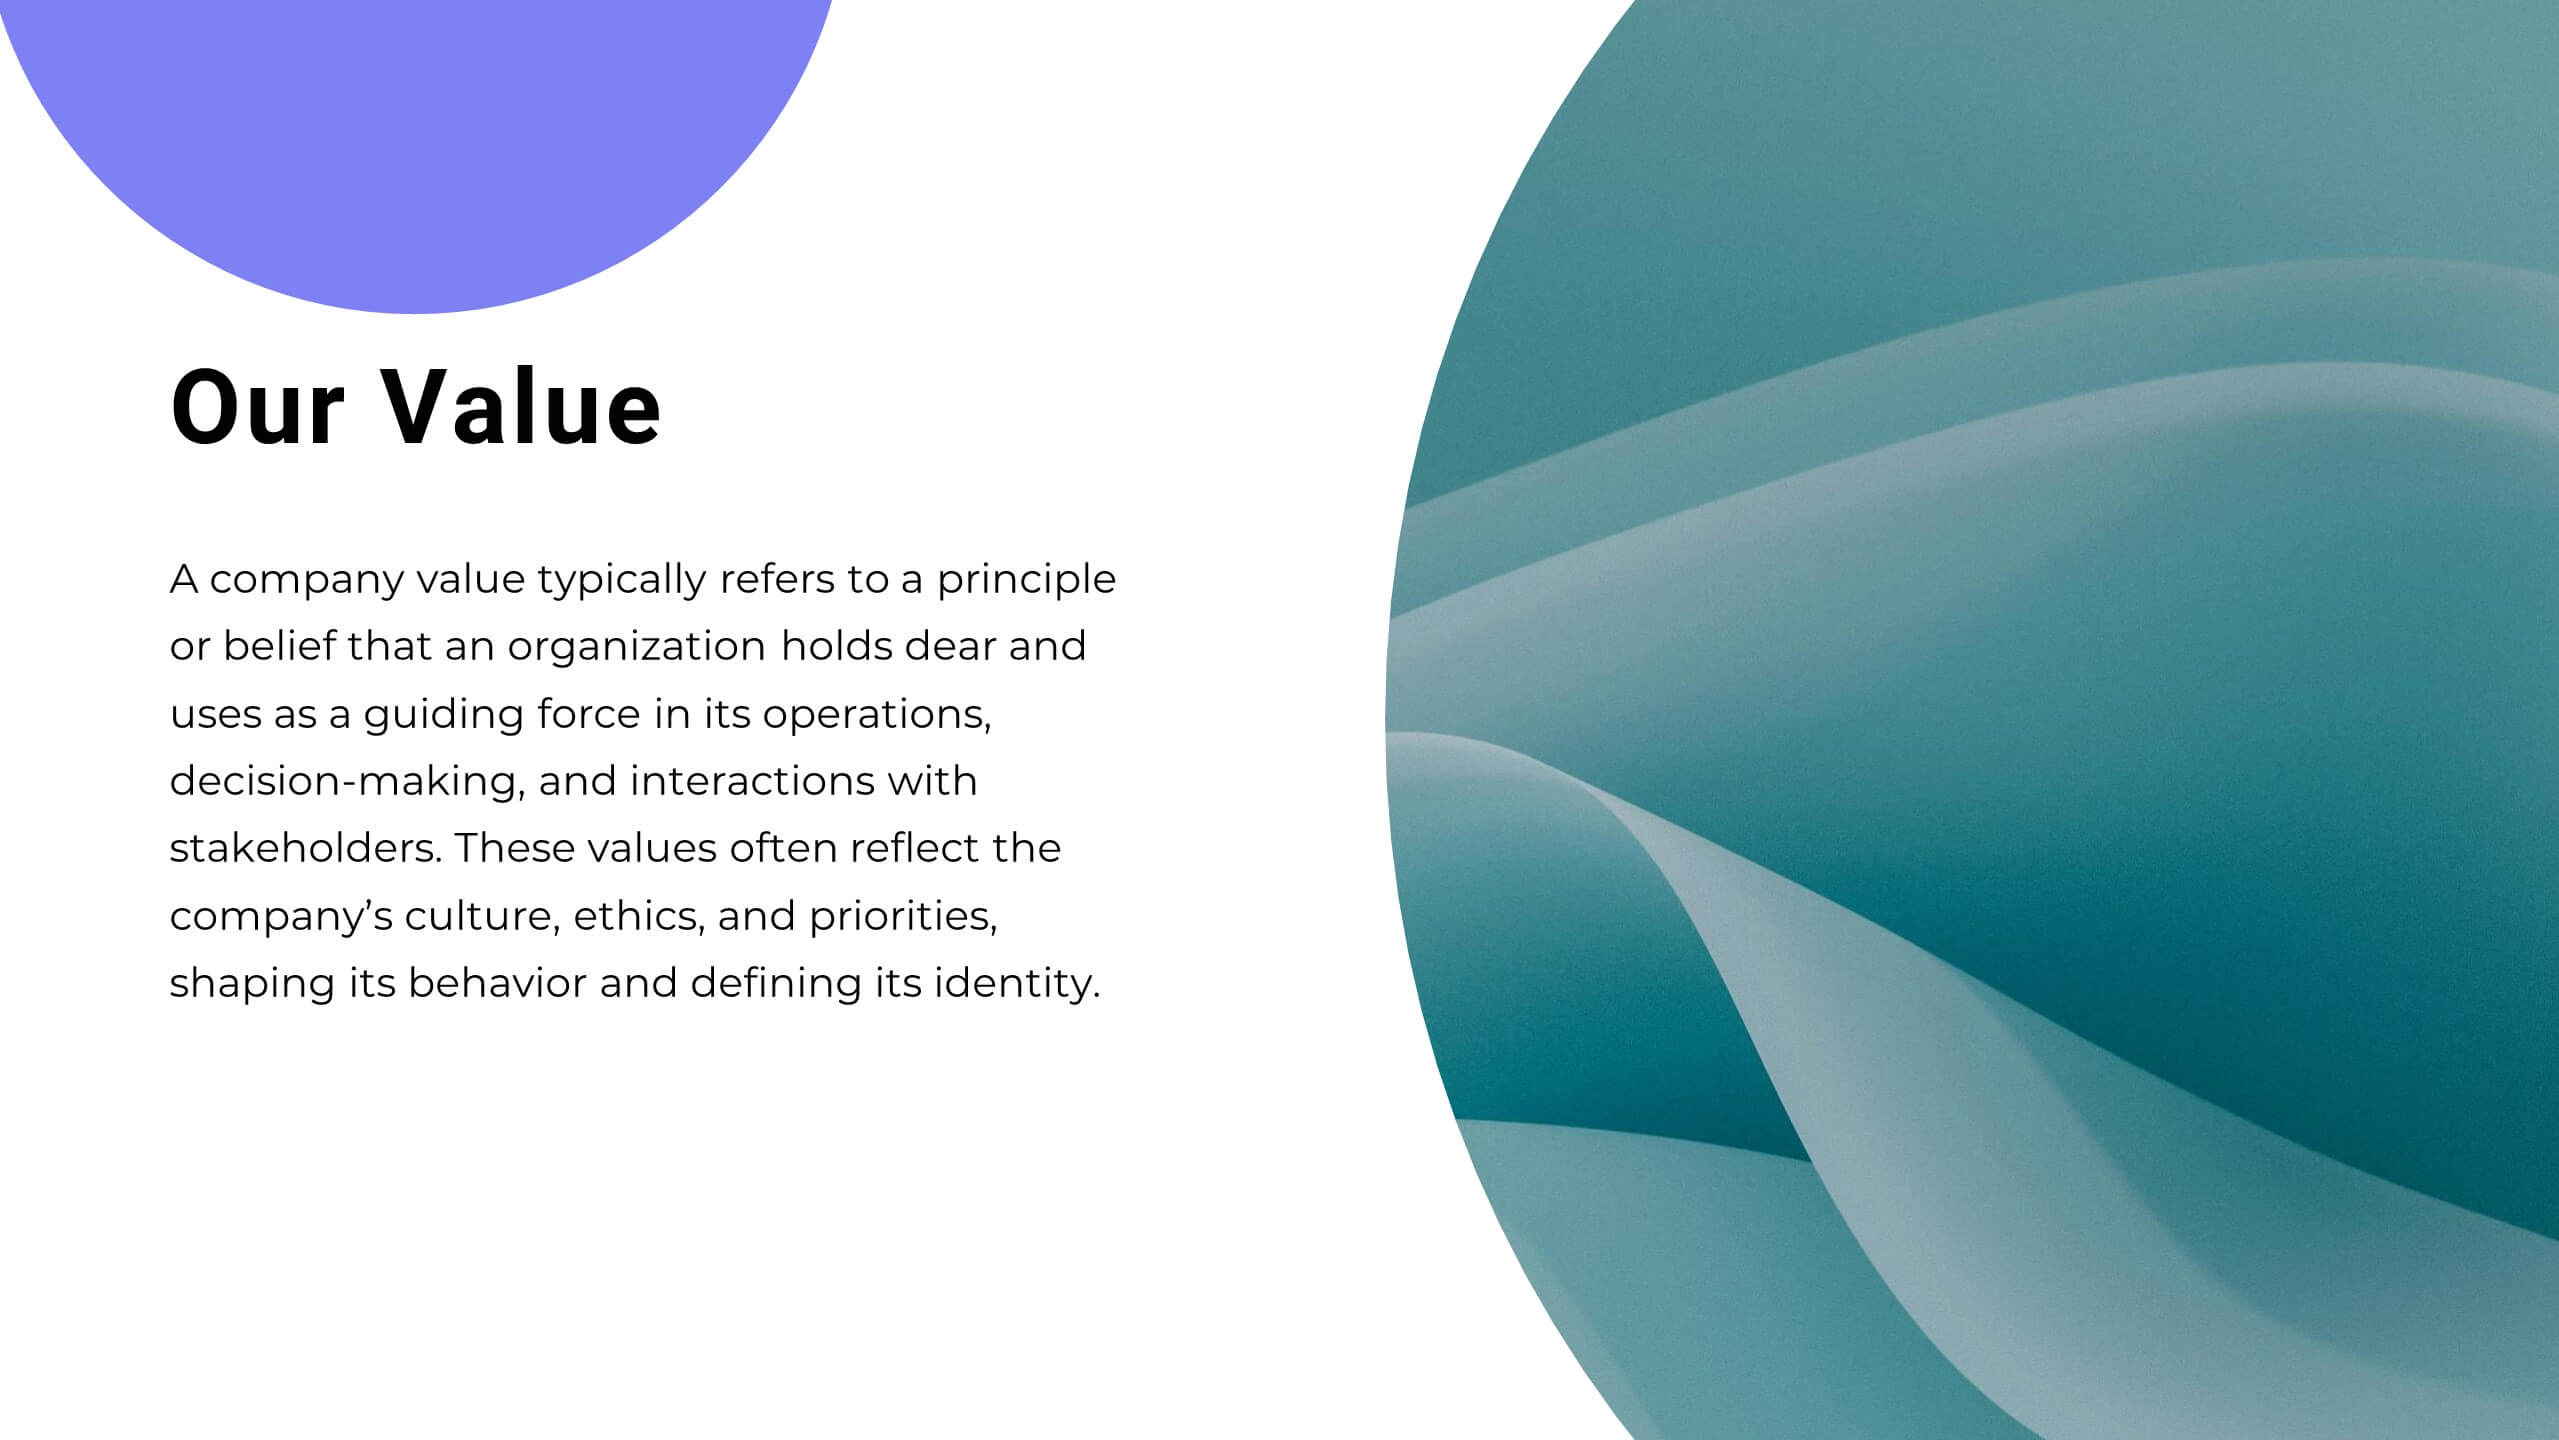
Vibrant Startup Pitch Deck Presentation
This dynamic and modern Startup Pitch Deck template is perfect for showcasing your startup's vision, strategy, and growth potential. Featuring a sleek design with bold visuals, this template guides you through key sections such as mission and vision, product/service overview, target market, and financial projections. It’s tailored to help you tell a compelling story that resonates with investors and stakeholders. The template is fully customizable in PowerPoint, Keynote, or Google Slides, ensuring you can adapt it to your specific needs and create a memorable presentation that leaves a lasting impression.


7 diapositivas
Vision Infographic
Elevate your presentations with our range of Slide Templates, tailored to showcase long-term objectives and strategies. These designs vary from simple and clean to bold and engaging, ensuring that every slide effectively communicates your forward-looking plans. Each template is crafted for easy customization to suit your brand's style, including areas for essential details, data representation, and motivational elements. They are perfect for aligning your team, engaging stakeholders, and promoting strategic discussions. Ideal for business presentations, team meetings, and motivational sessions, these templates offer a professional way to present your future goals and engage your audience effectively.


6 diapositivas
Modern 3D Infographic Presentation
Add a fresh, dimensional twist to your data storytelling with this clean and modern pyramid layout. Ideal for showcasing layered structures, hierarchical information, or process stages, it’s designed to make your visuals pop. Fully editable and compatible with PowerPoint, Keynote, and Google Slides for easy customization.


3 diapositivas
Business Revenue Break-Even Strategy Presentation
Understand profitability with the Business Revenue Break-Even Strategy template. This visual tool illustrates the break-even point, helping businesses analyze costs, revenue, and profitability. Ideal for financial planning, it simplifies complex data into an easy-to-read format. Fully customizable and compatible with PowerPoint, Keynote, and Google Slides for seamless presentations.


21 diapositivas
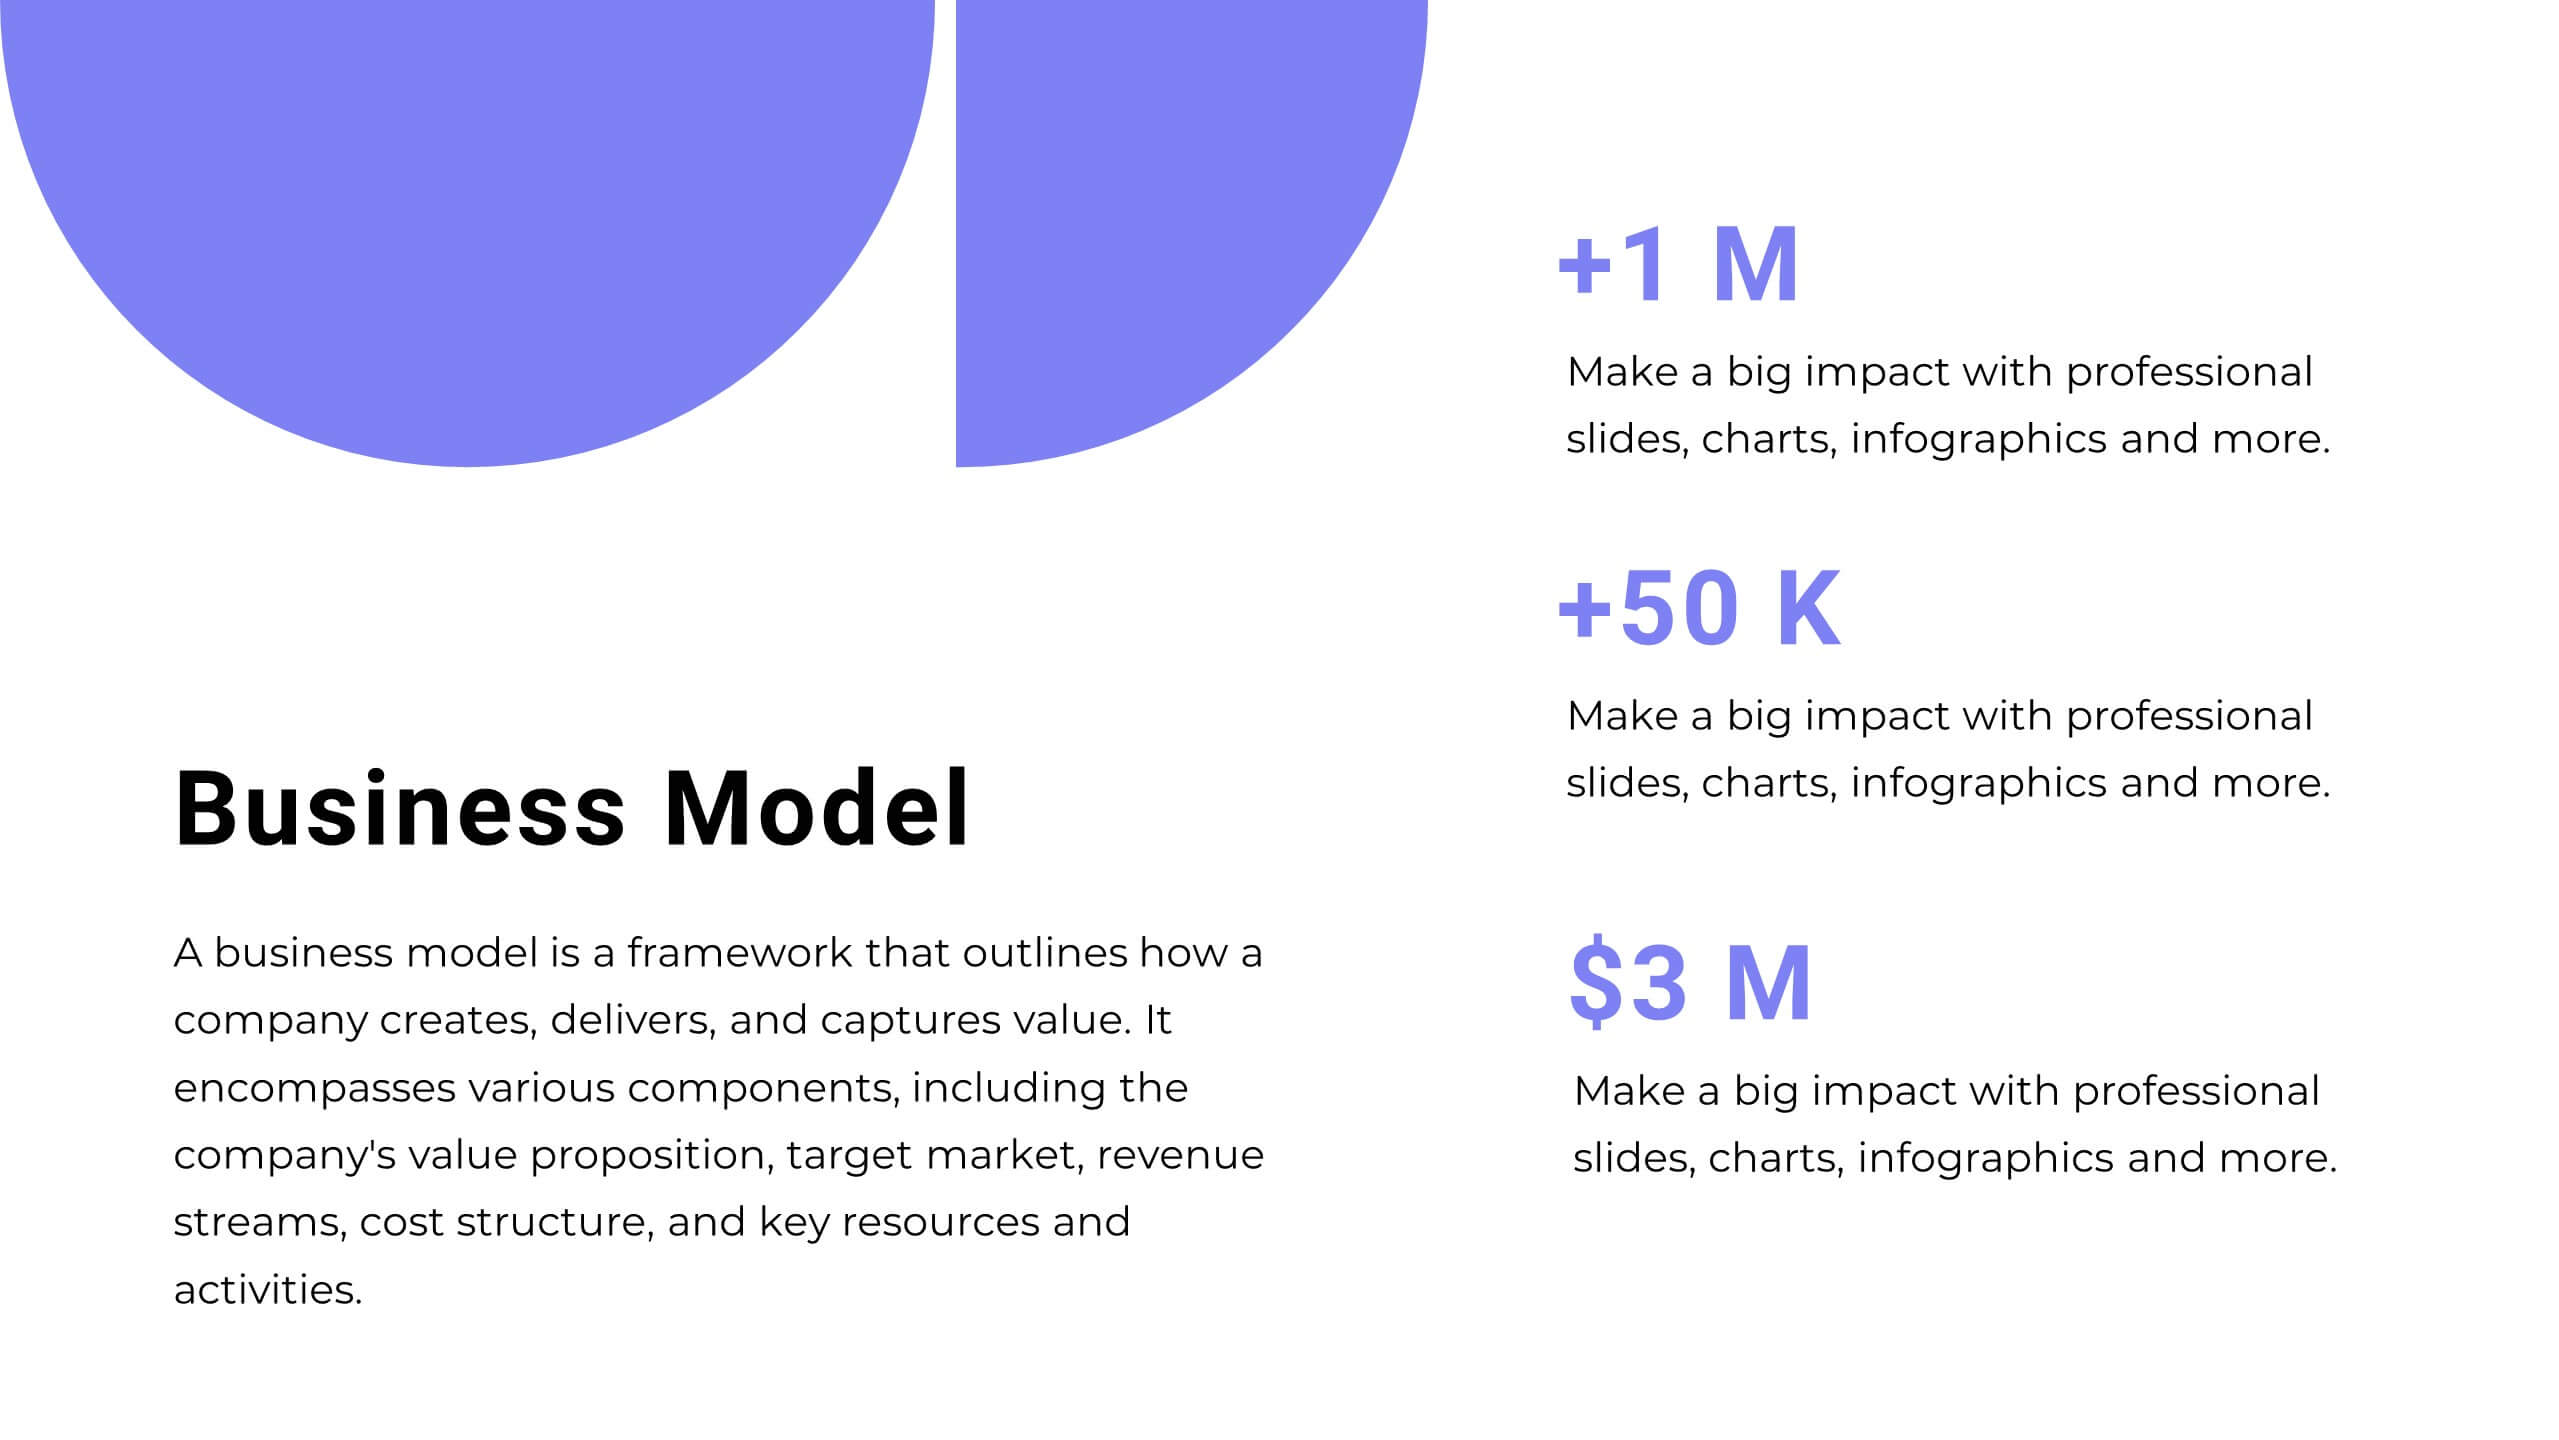
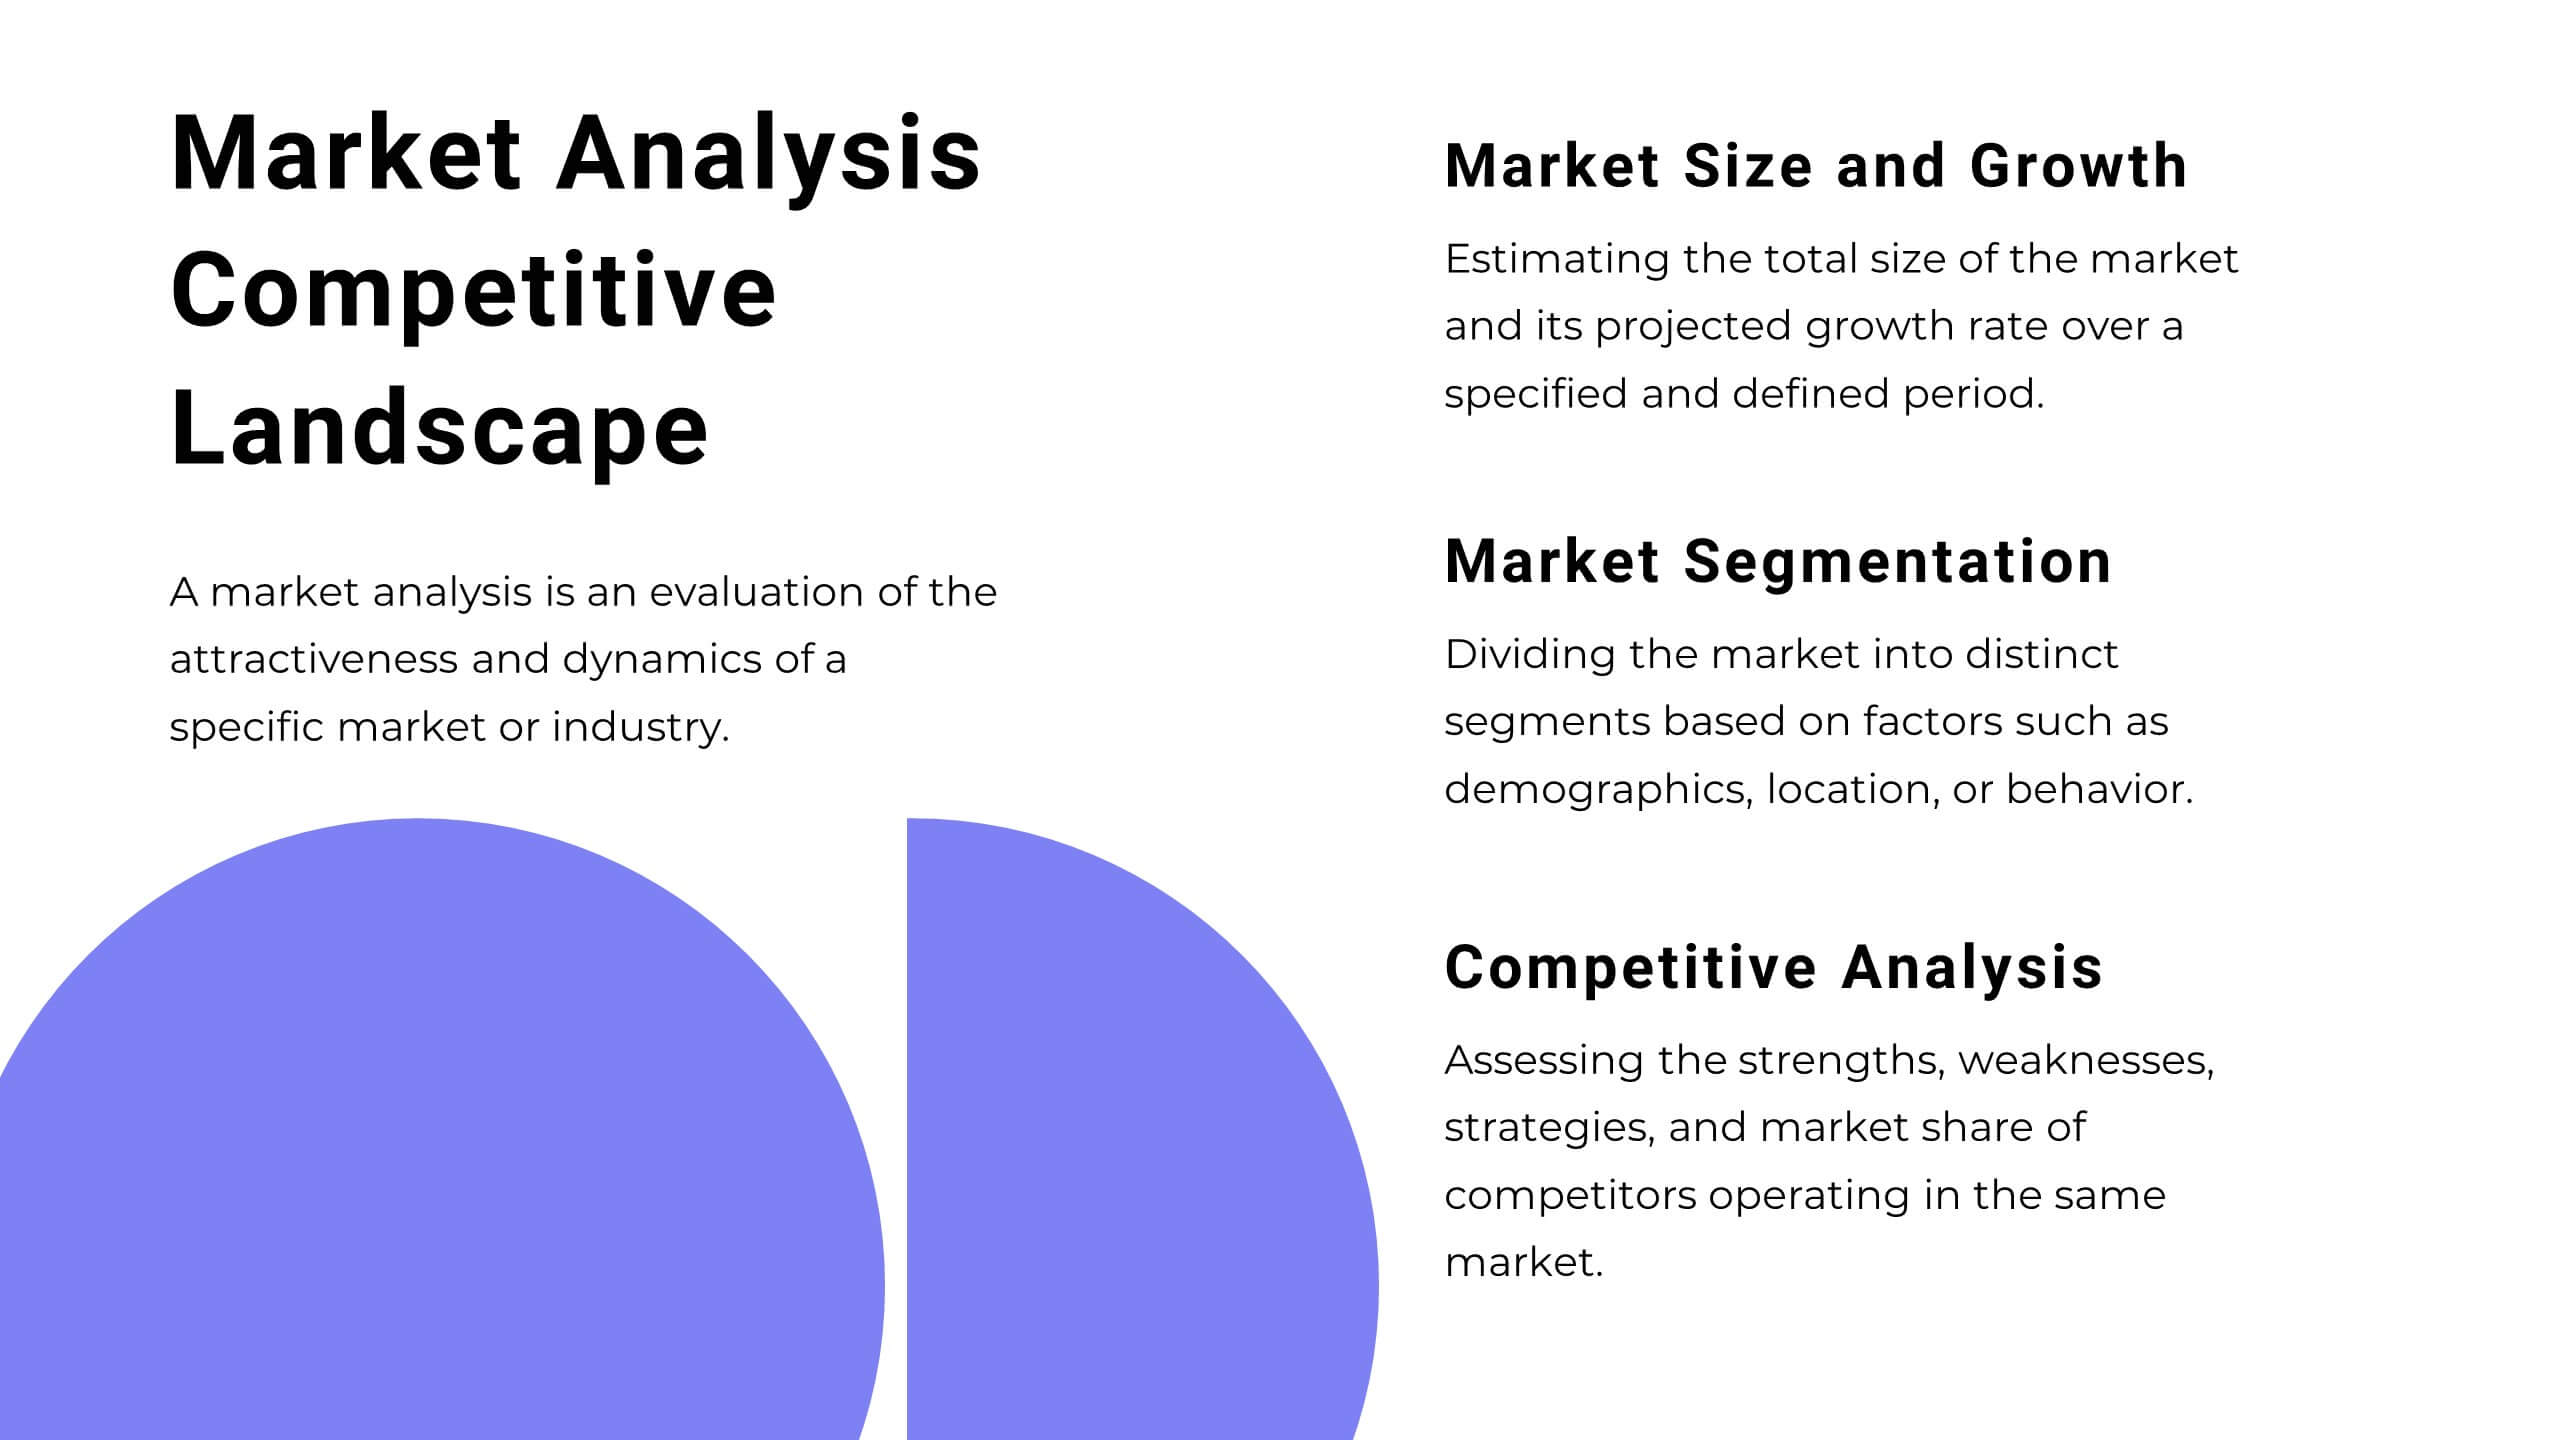
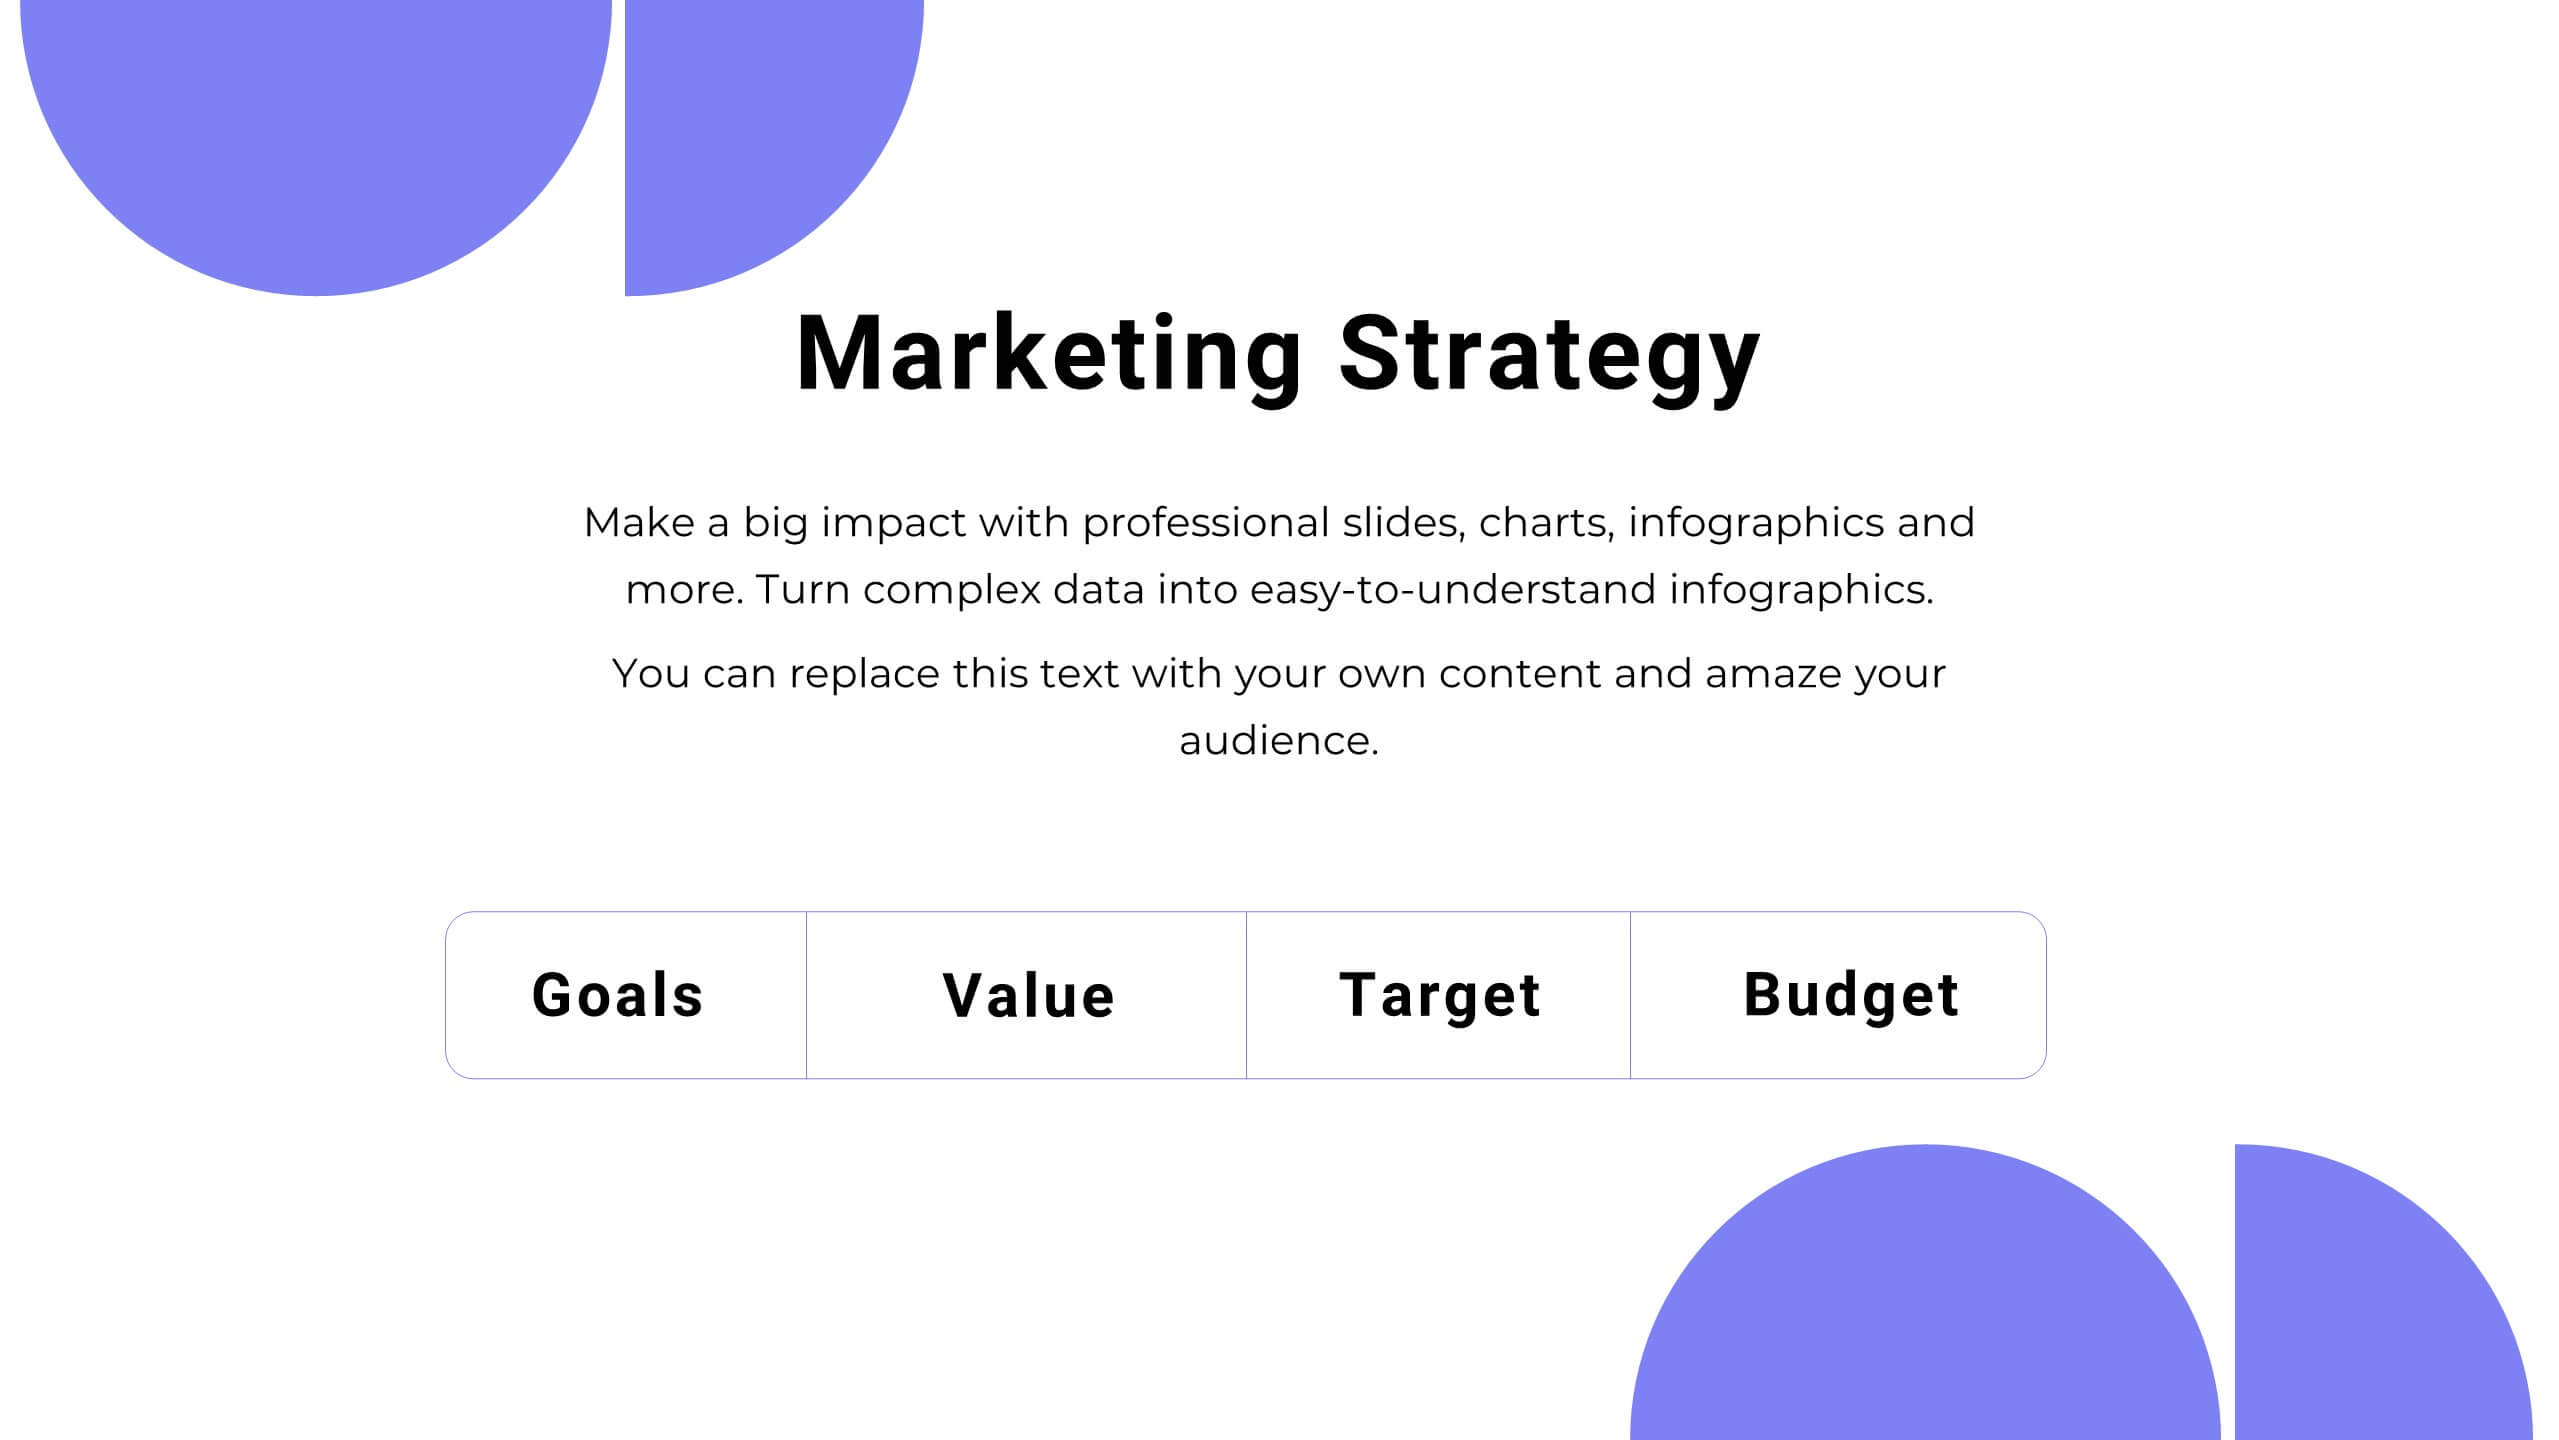
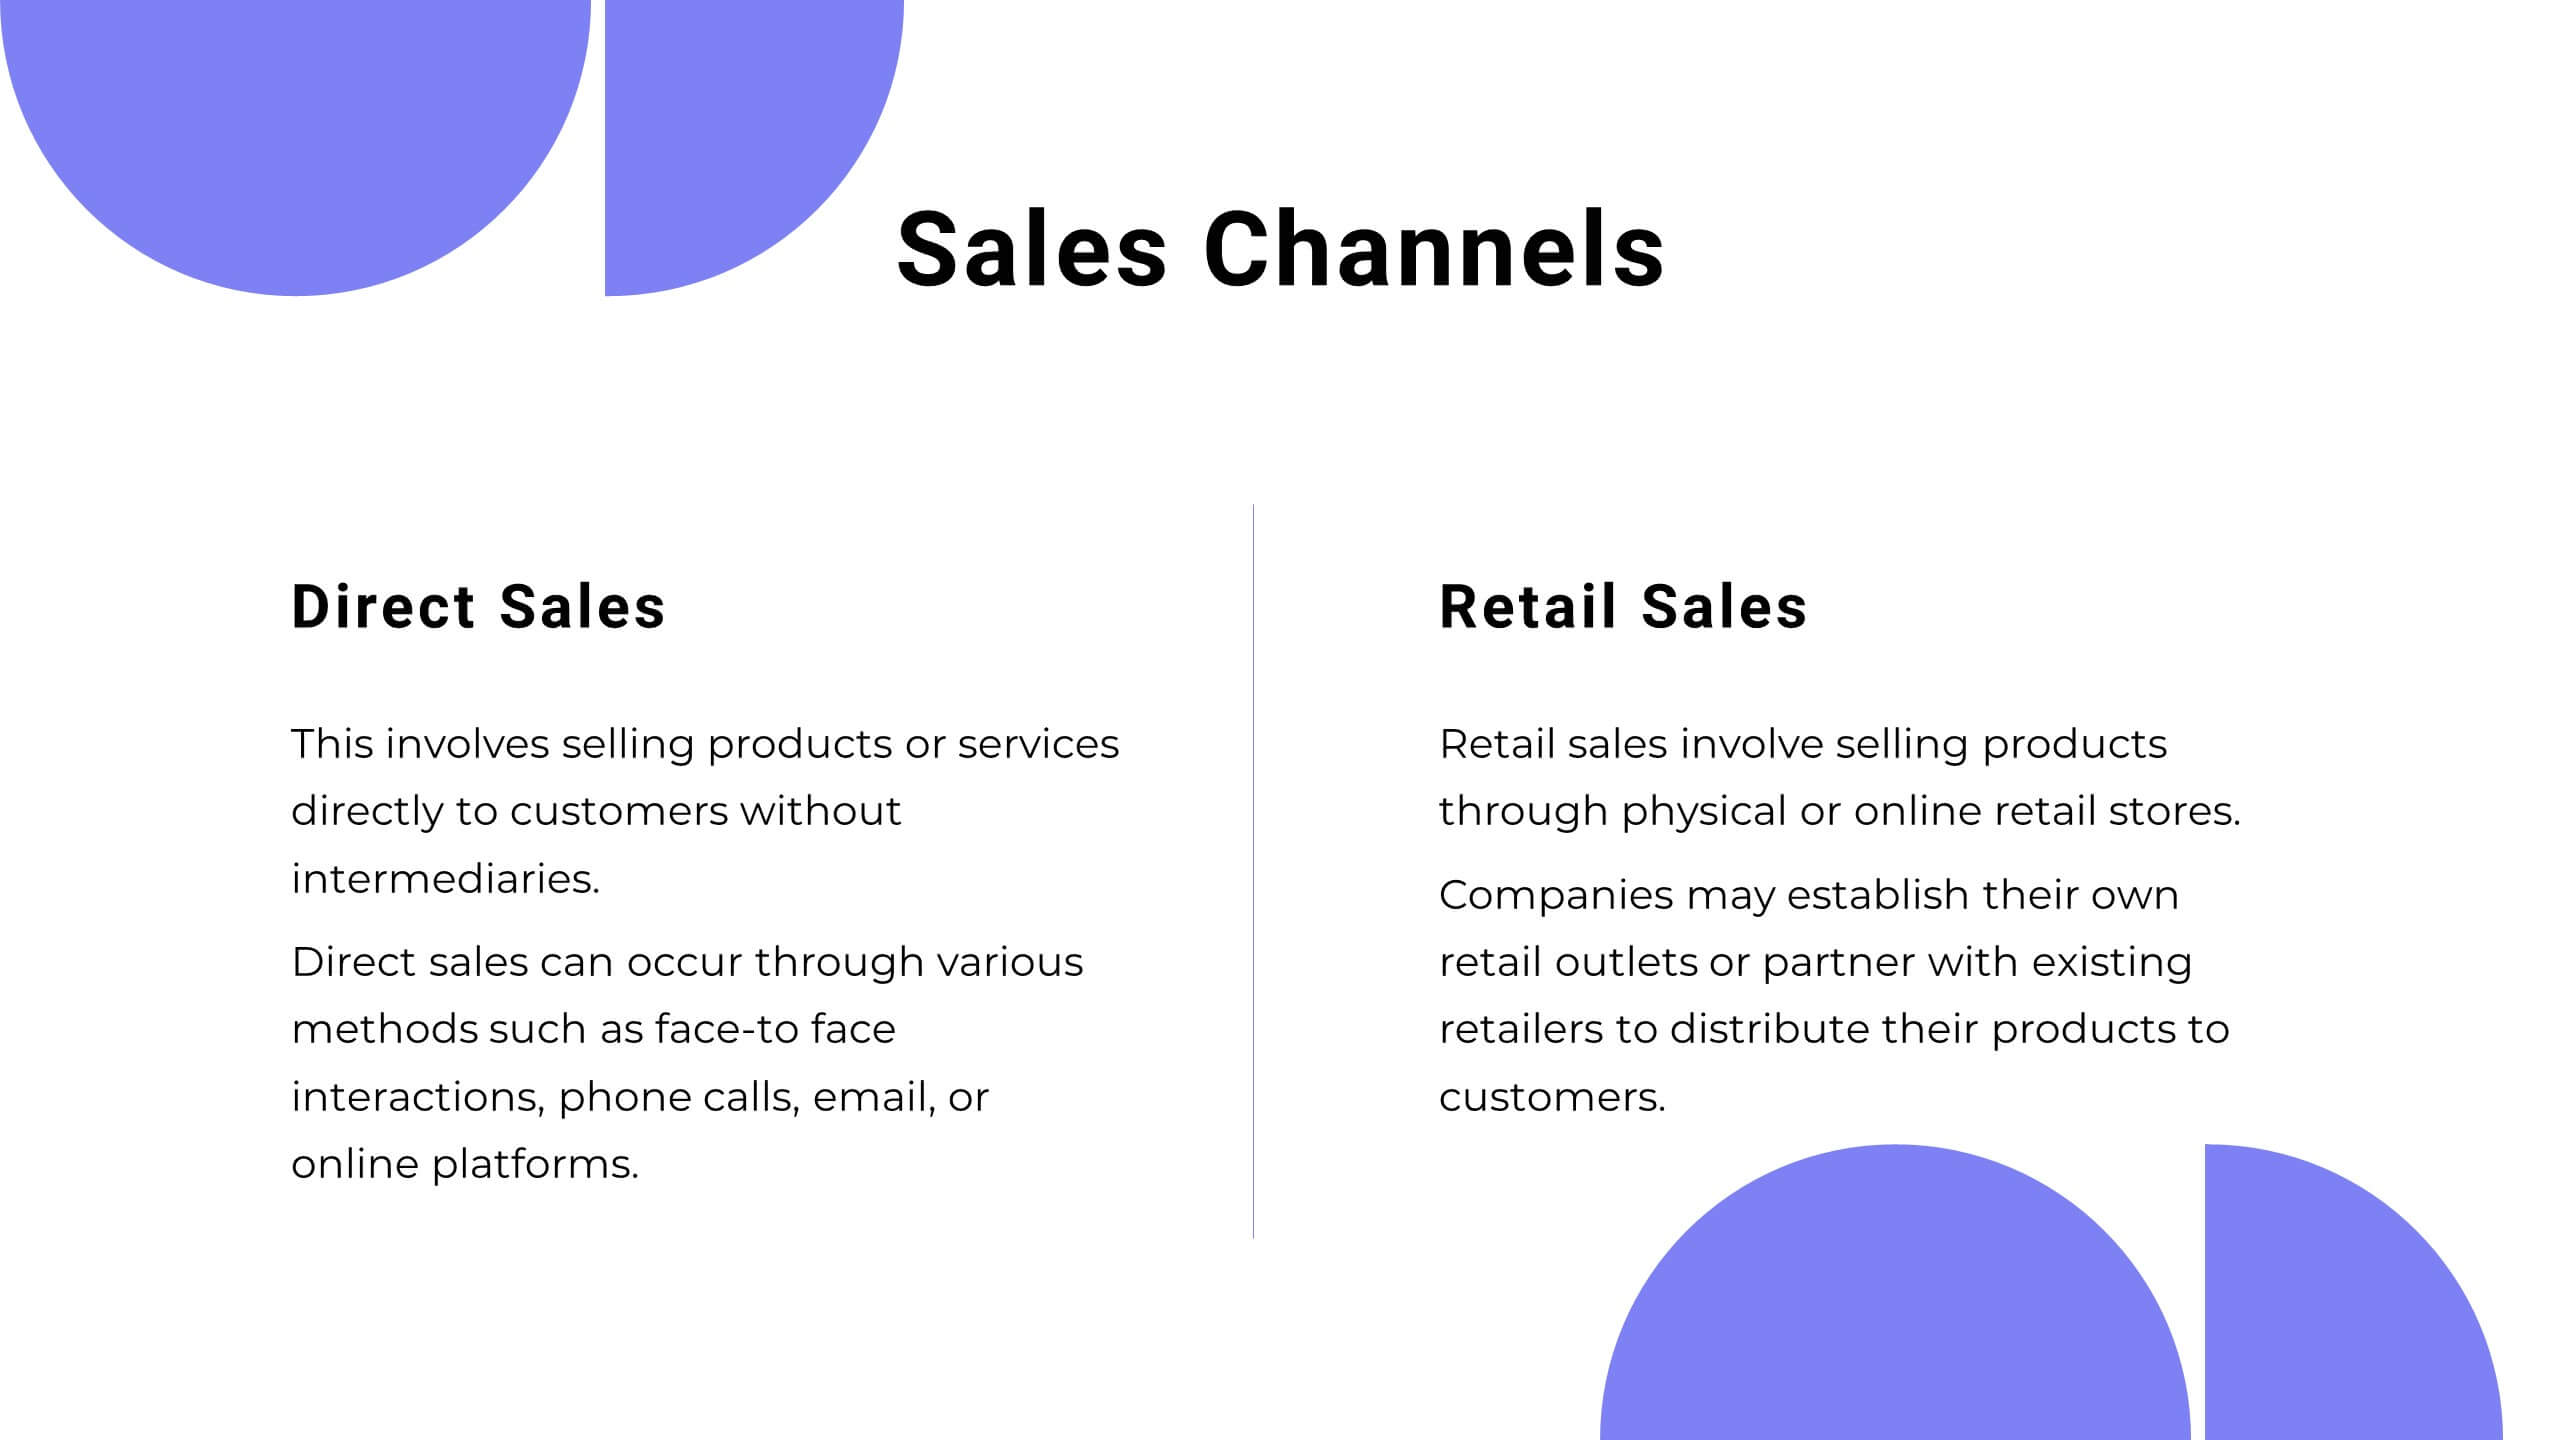
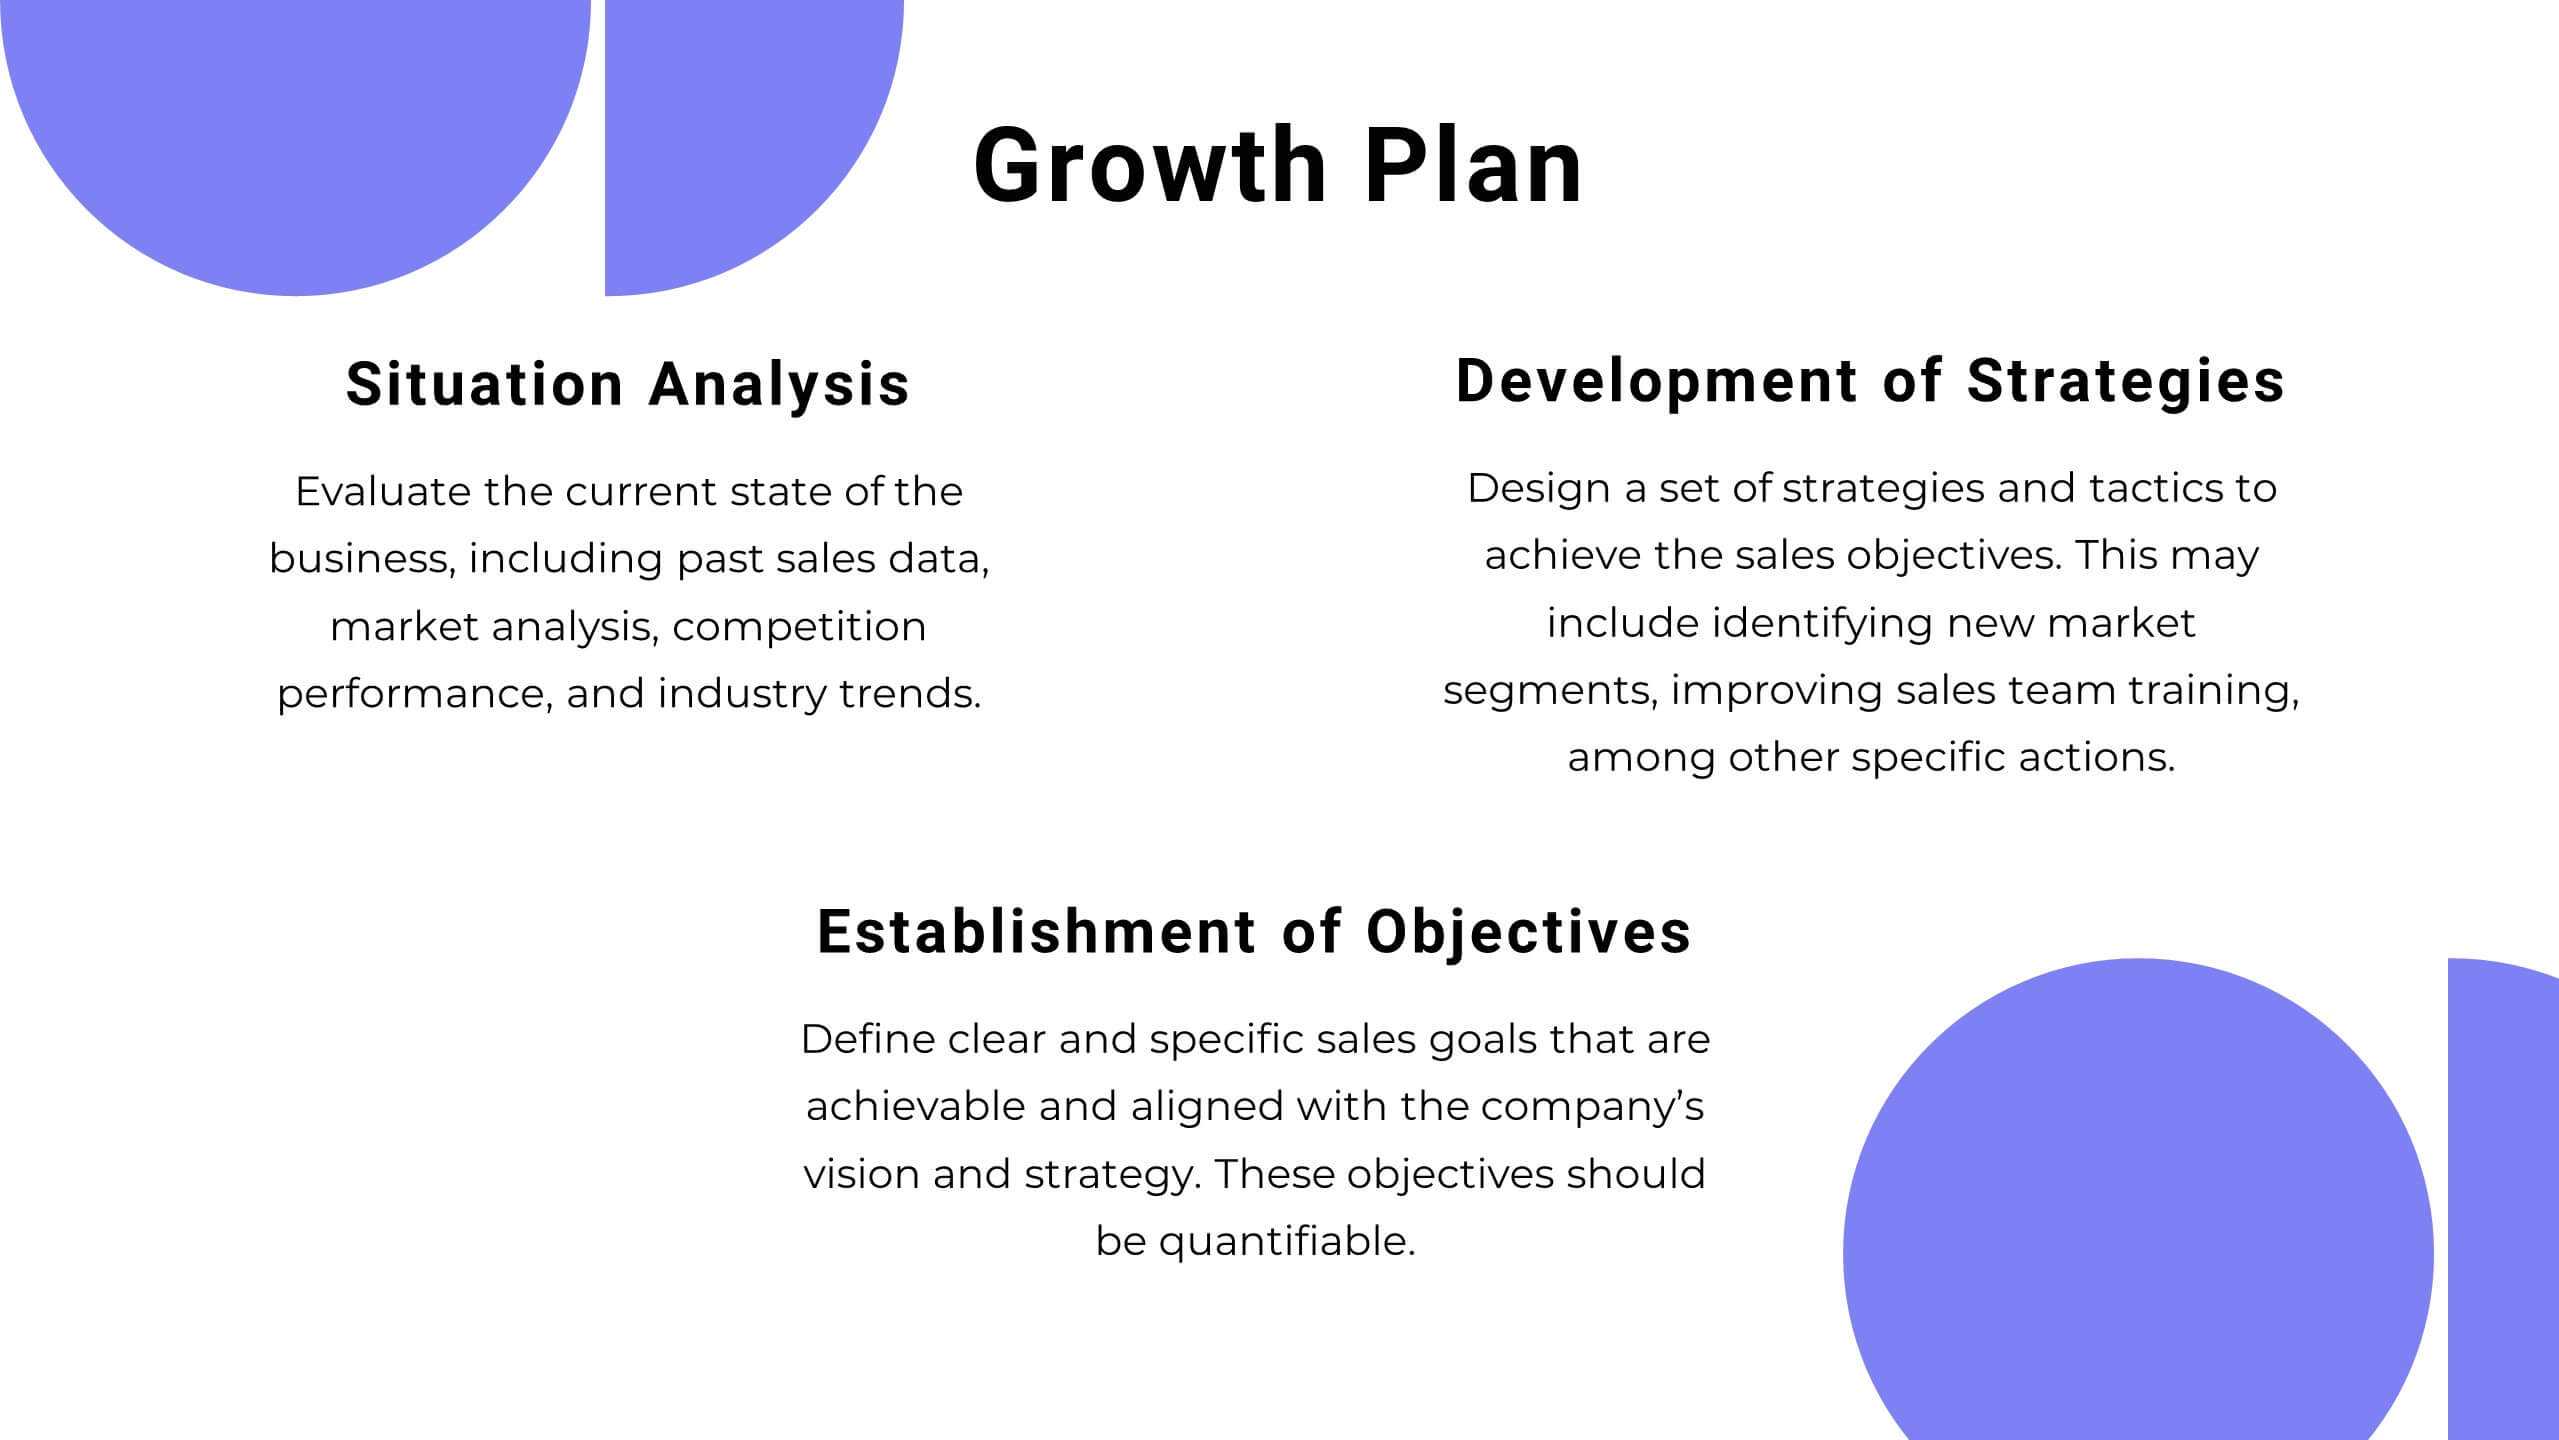
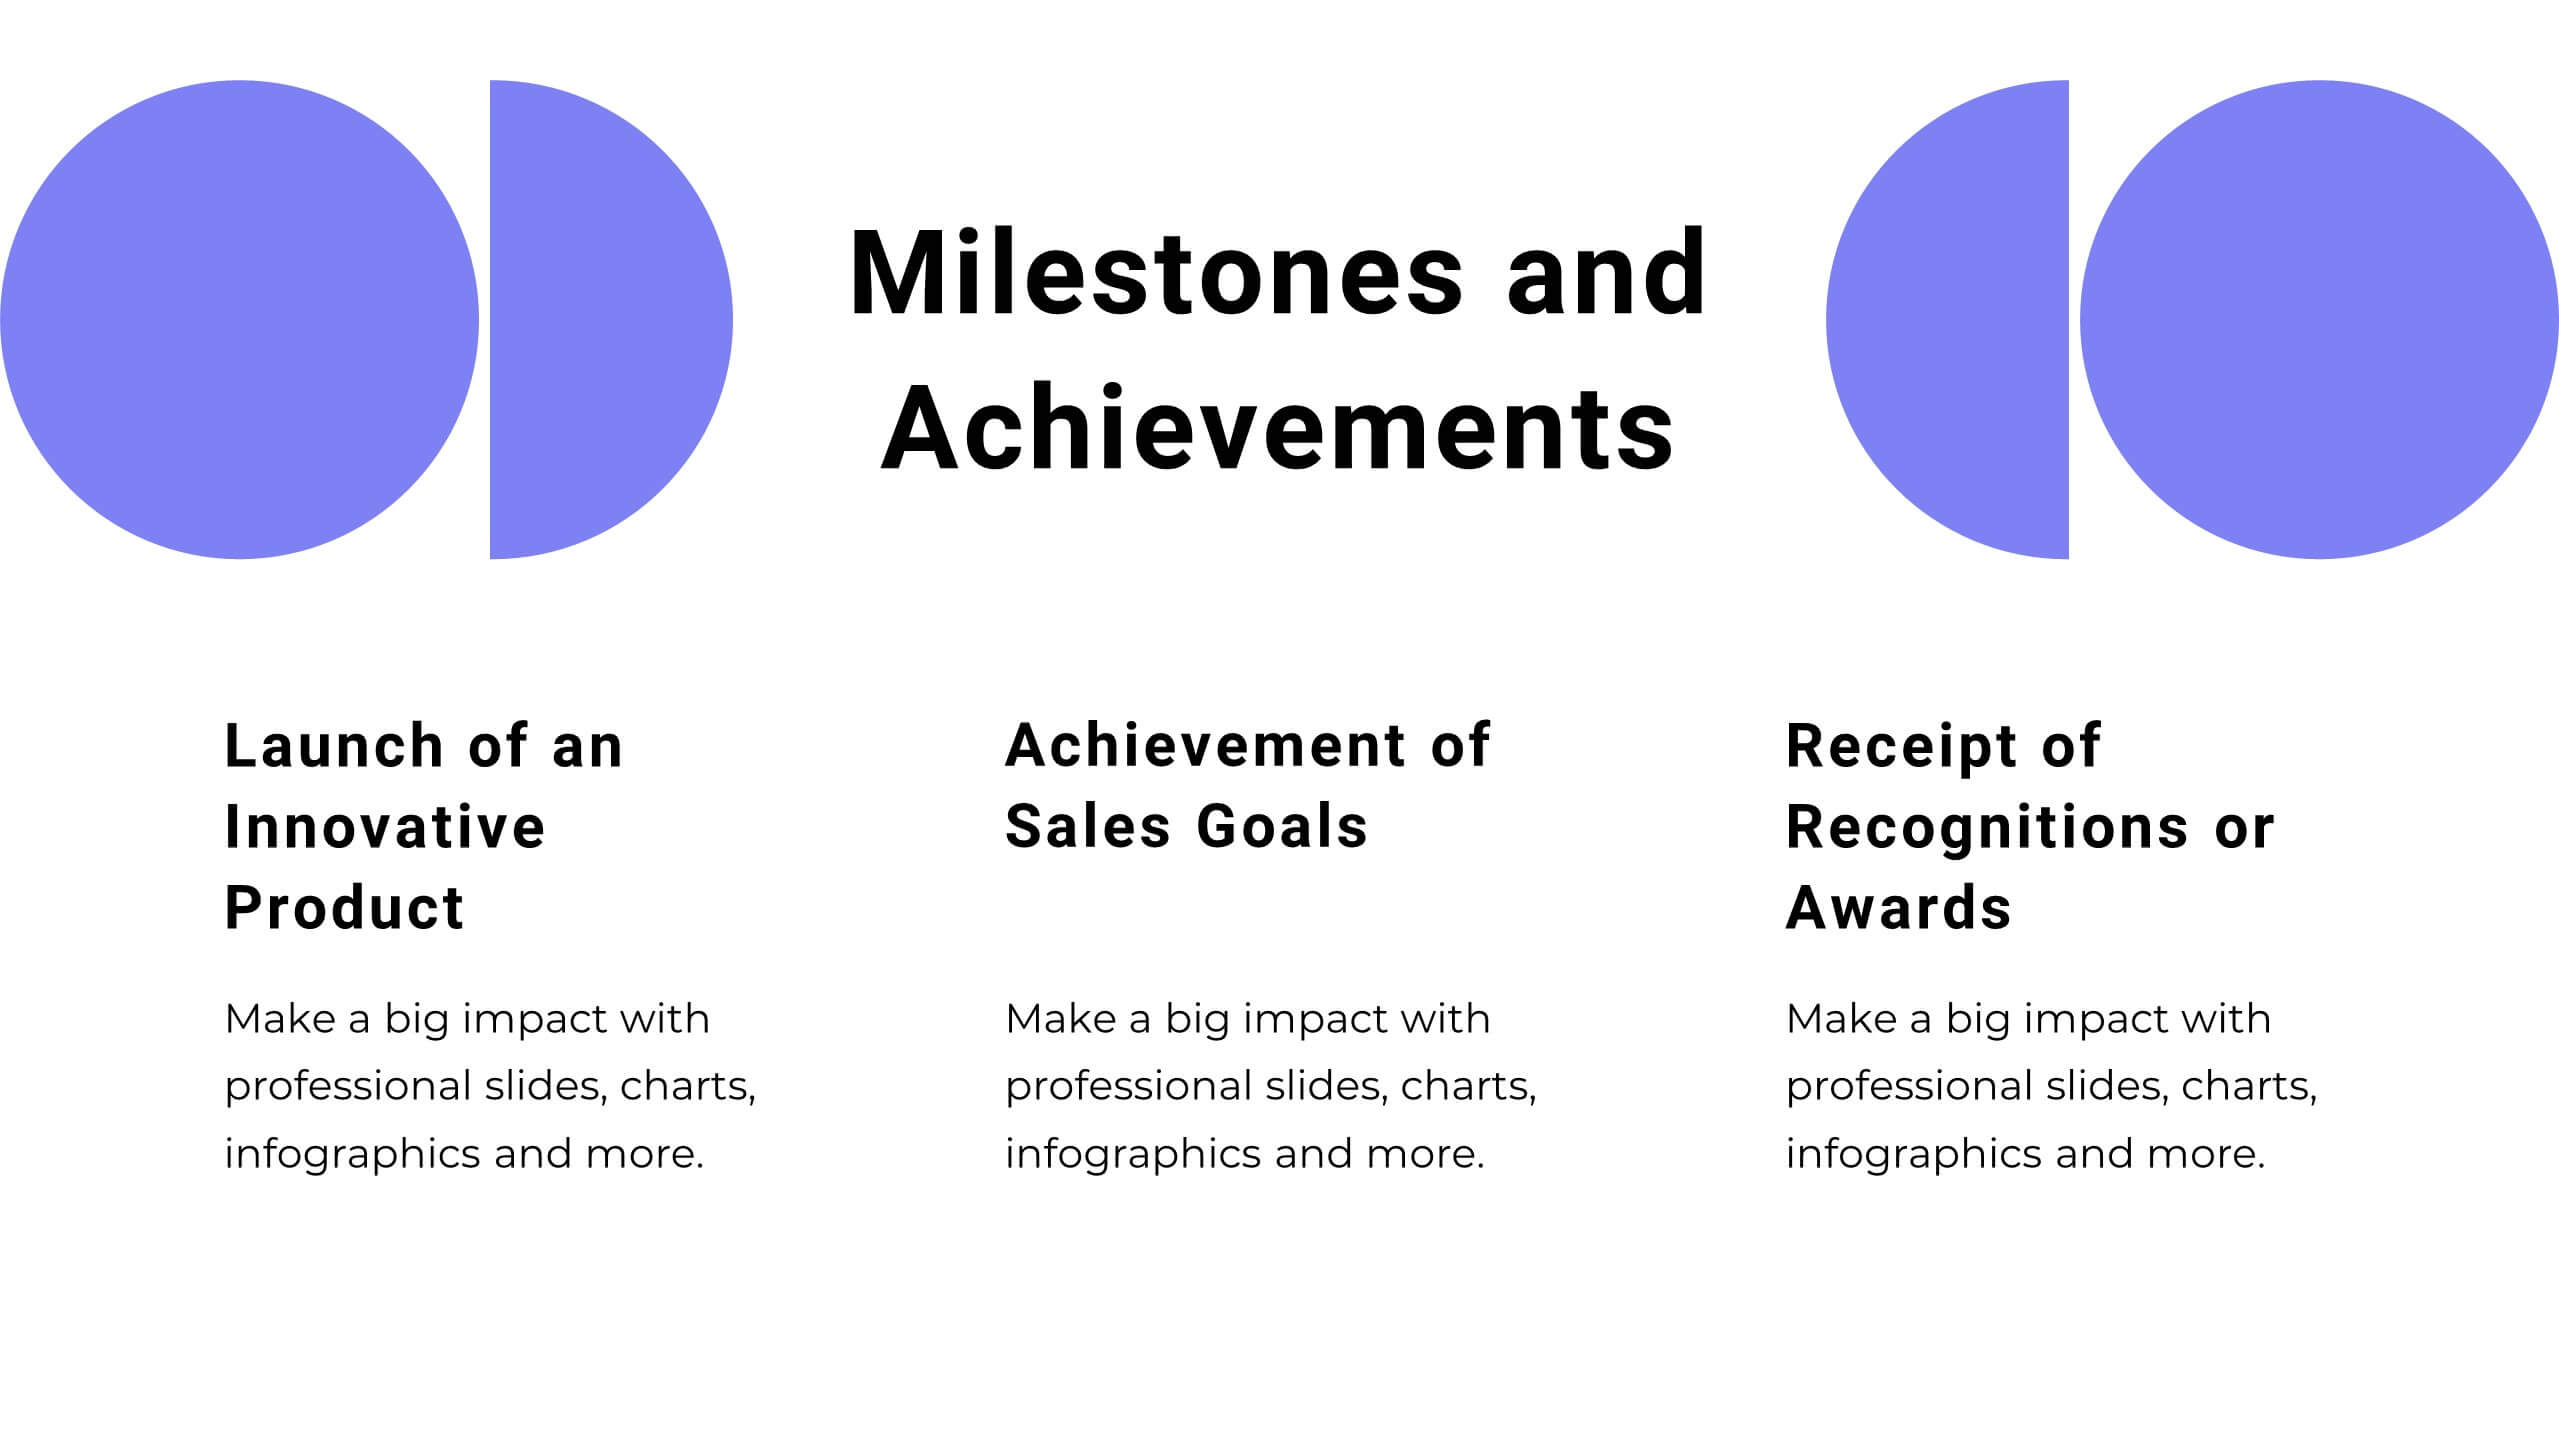
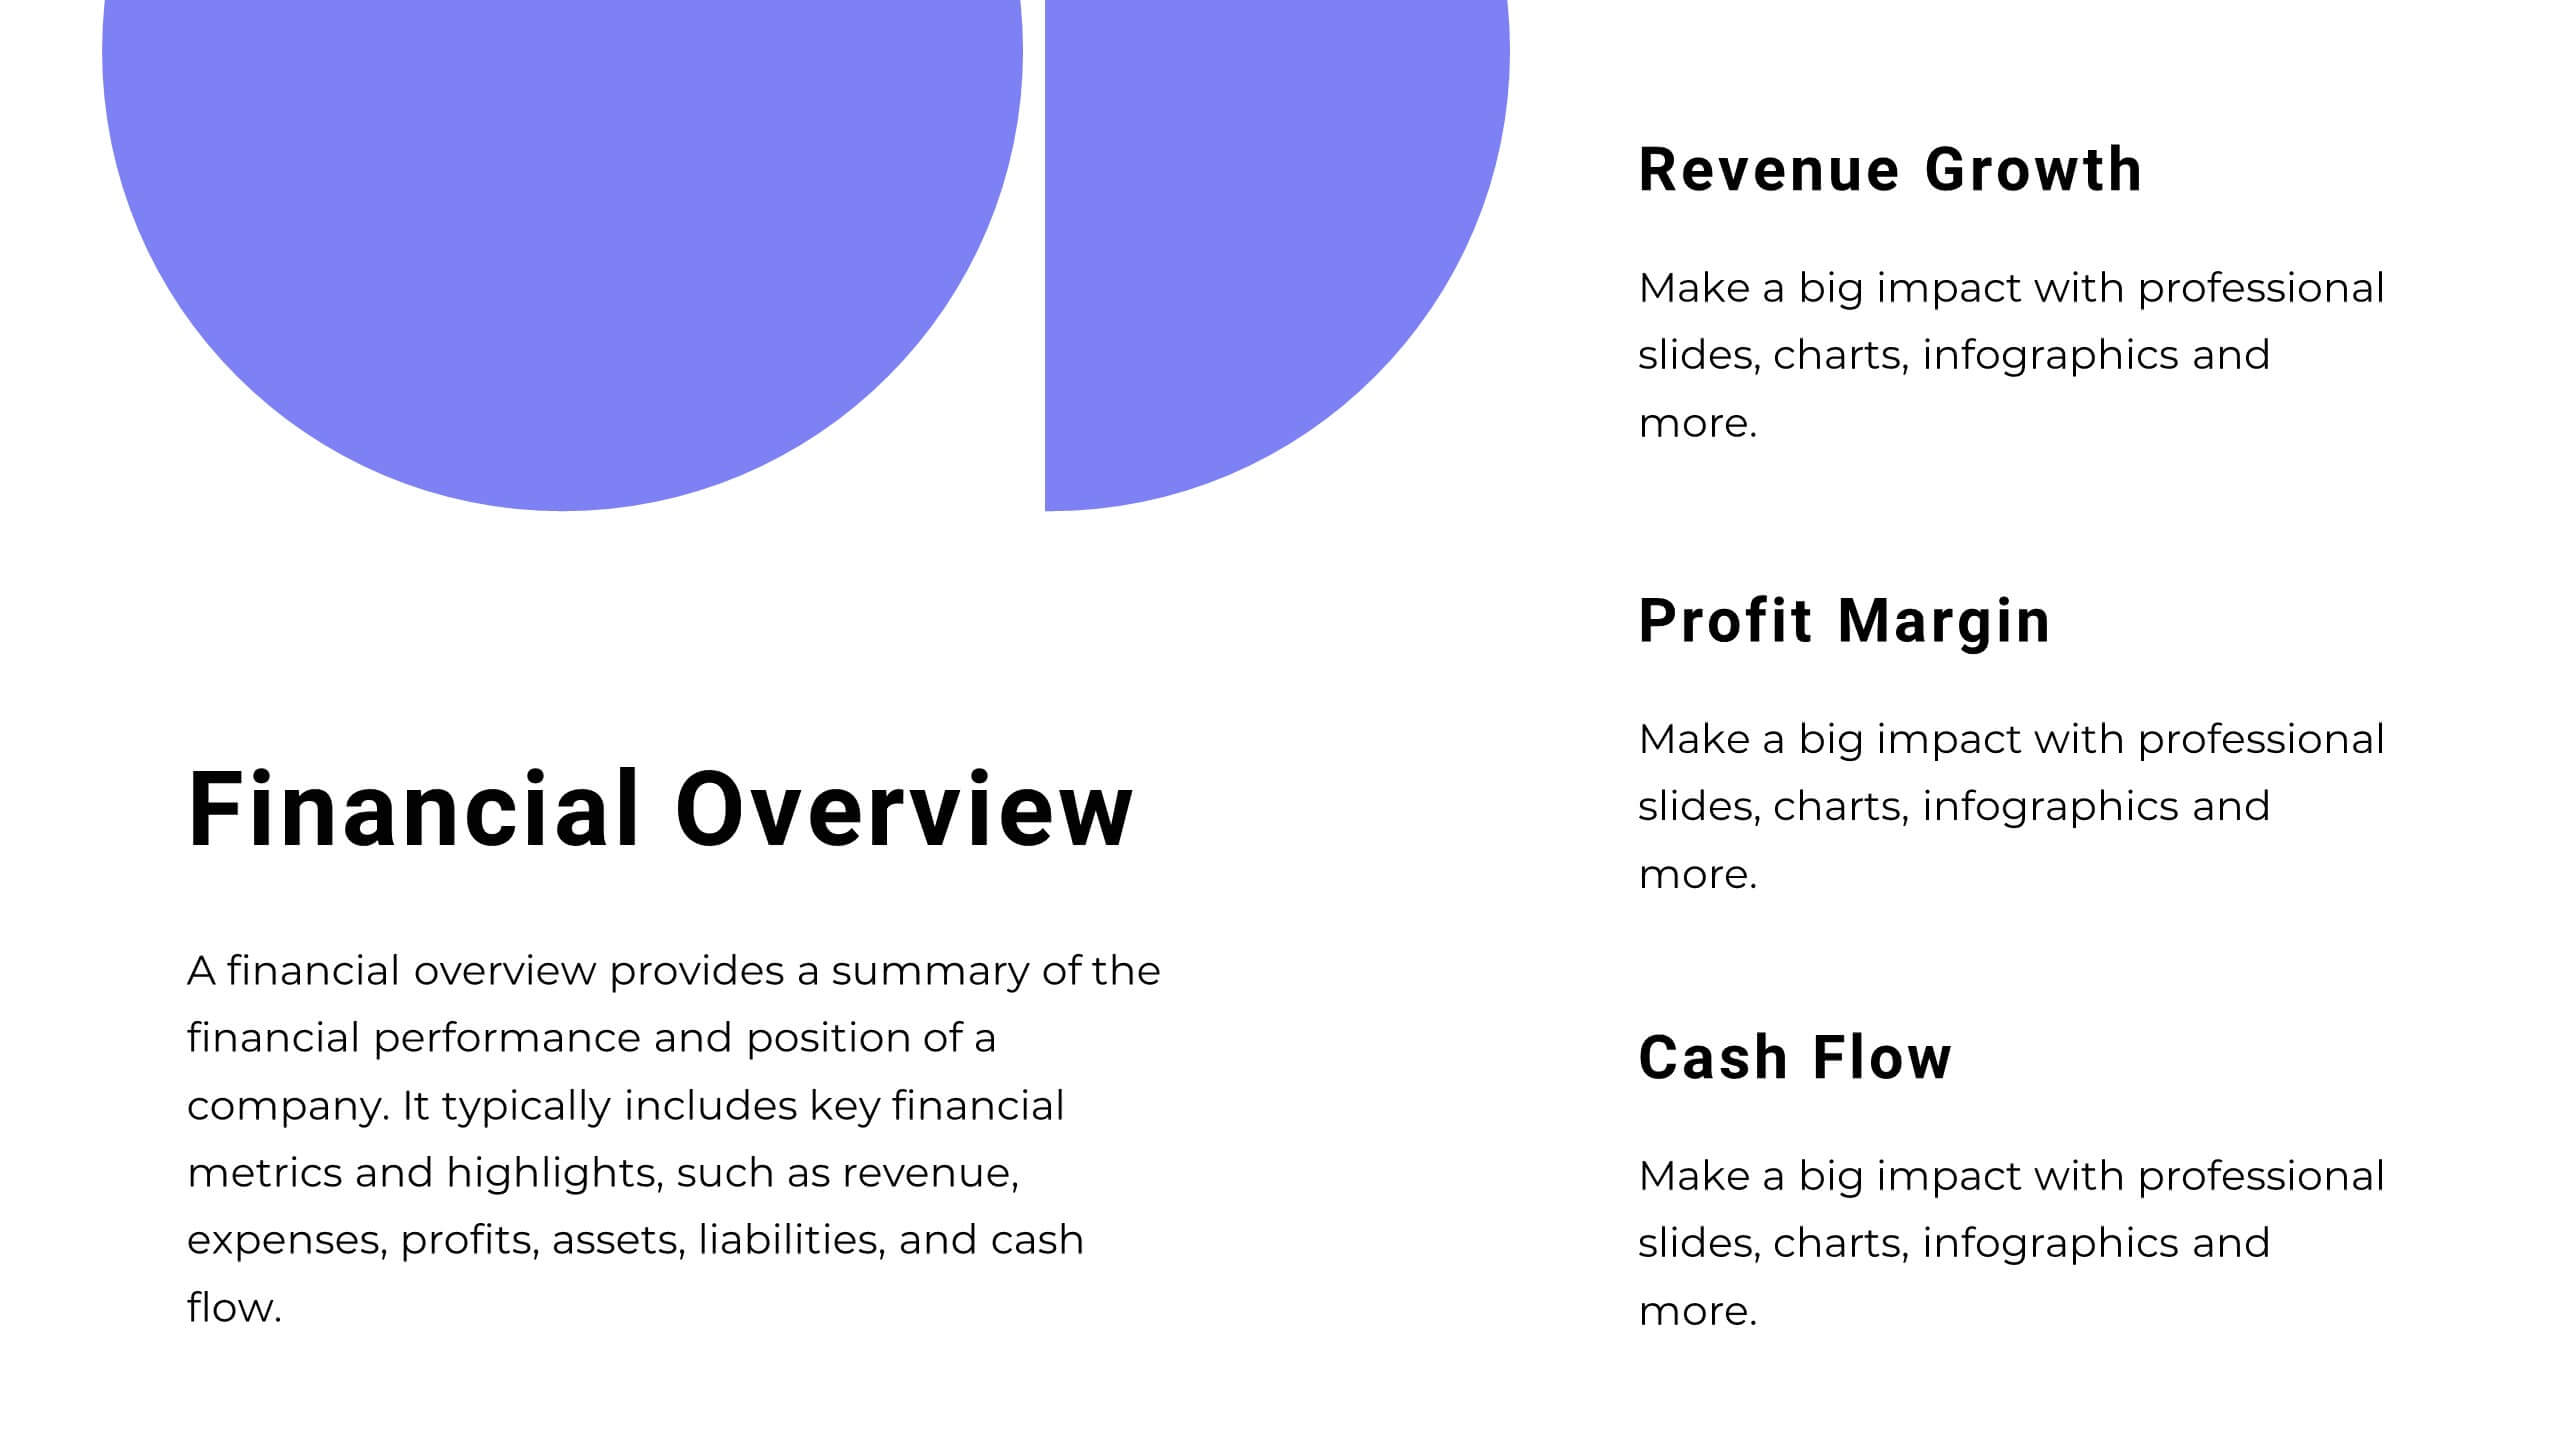
Talestra Startup Pitch Deck Presentation
Make a strong first impression with this clean and modern startup pitch deck. Covering key areas such as mission and vision, market analysis, business model, growth plan, and financial overview, it's designed to captivate investors and stakeholders. Fully customizable and compatible with PowerPoint, Keynote, and Google Slides.


6 diapositivas
Modern Circle Infographic
Our Modern Circle infographic is a contemporary visual tool designed for seamless integration with Powerpoint, Keynote, and Google Slides. This infographic is particularly useful for professionals and educators looking to present information in a cyclical process or to illustrate a concept that involves interconnected elements. The design of the Modern Circle infographic is intuitive and engaging, facilitating the representation of processes, relationships, or statistics in a clear, circular format. The sleek and modern aesthetic ensures that your information is conveyed in a visually appealing manner, keeping your audience engaged and focused on the content. By utilizing this infographic, you have the ability to present complex data or concepts in a simplified form, making it accessible for all audience types. Whether you’re detailing a business cycle, demonstrating a feedback loop, or presenting a series of steps in a continuous process, the Modern Circle infographic is your go-to for adding a touch of sophistication to your presentations. Its adaptability and stylish design will enhance your ability to communicate effectively with any audience.


4 diapositivas
OKRs Alignment for Performance Goals Presentation
Visualize and align your objectives with precision using the OKRs Alignment for Performance Goals Presentation. This template illustrates how Objectives, Key Activities, and Results converge toward a shared target, helping you communicate goals clearly to teams and stakeholders. Perfect for quarterly planning, team alignment, and executive reviews. Fully editable in Canva, PowerPoint, Keynote, and Google Slides.


5 diapositivas
Business Overview and Highlights Summary
Summarize your company’s key milestones with this Business Overview and Highlights Summary slide. Featuring a clean layout with a bold briefcase visual and four spotlight areas, it’s ideal for showcasing achievements. Fully editable in PowerPoint, Keynote, and Google Slides.


26 diapositivas
Thadd Presentation Template
Thadd presents your business in a professional light. The bold fonts and colors make for a clean, professional aesthetic that won't distract from your message. It features a strong horizontal identity that instantly communicates your brand. Charts, timelines and easy to edit text give this template an edge over the competition. It comes with easy to edit text and images, making changing content a breeze. It makes for a great business tool for companies who want to get their message across without wasting time on graphics and design. Invest in your future and download this template today.


4 diapositivas
Patient Care Plan and Metrics Presentation
Turn healthcare data into meaningful stories with this modern and professional presentation. Perfect for highlighting patient progress, clinical outcomes, and care efficiency, it balances visuals and data for clarity and impact. Easy to edit and fully compatible with PowerPoint, Keynote, and Google Slides for smooth customization.


4 diapositivas
Business Cycle Diagram Overview Presentation
Illustrate your business processes with this modern cycle diagram template. Designed to showcase four interconnected stages, it’s ideal for visualizing workflows, project phases, or continuous improvement models. Fully editable in Canva, PowerPoint, and Google Slides, this template helps you present complex cycles with clarity and visual impact.


7 diapositivas
Subsistence Agriculture Infographic
Bring the essence of sustainability to your presentations with our Subsistence Agriculture infographic, designed for seamless integration with Powerpoint, Keynote, and Google Slides. This infographic is perfect for educators, agricultural professionals, and sustainability advocates who need to convey the importance of self-sufficient farming practices and their impact on local communities. Our Subsistence Agriculture infographic illustrates the fundamentals of agriculture that relies on the self-production of food by individuals and small communities. It highlights how this method supports sustainability, food security, and ecological balance. The visually engaging elements emphasize traditional farming techniques, crop diversity, and the role of agriculture in rural livelihoods. By incorporating this infographic into your presentations, you present a compelling narrative on the significance of subsistence farming in today's world. It not only educates your audience on the basics but also inspires discussions on the broader implications for global food systems. Use this infographic to effectively communicate the value of subsistence agriculture in maintaining community resilience and environmental stewardship.


6 diapositivas
5-Year Financial Forecast Slide Presentation
Show your long-term growth with a clean, visual touch that makes numbers easy to follow and goals clear to everyone. This modern layout highlights yearly progress using engaging icons and percentage indicators, perfect for financial reports or investor decks. Fully compatible with PowerPoint, Keynote, and Google Slides for seamless editing.