


Características


¿Tienes alguna pregunta?
Recomendar


4 diapositivas
Regional Economic Analysis of Europe Map Presentation
Explore Europe's economy with the Regional Economic Analysis of Europe Map template, a streamlined presentation designed to showcase economic data and trends across the continent. Designed for clarity, it includes a customizable map and data bars for financial statistics. Ideal for PowerPoint presentations, it helps professionals highlight economic trends and investment opportunities in different European regions effectively.


2 diapositivas
Pink Ribbon Event Slide Deck Presentation
Bring awareness and compassion to your presentation with a bold ribbon design that symbolizes unity and support. Perfect for health campaigns, charity events, or educational talks, this layout helps you share key messages with clarity and impact. Fully compatible with PowerPoint, Keynote, and Google Slides for easy customization.


6 diapositivas
Employee Welcome and Orientation Guide Presentation
Welcome new hires with clarity using the Employee Welcome and Orientation Guide Presentation. Featuring a timeline-style layout with flag icons, this design helps outline key onboarding stages—from introductions and training to policies and first-week expectations. Easy to customize in Canva, PowerPoint, Keynote, or Google Slides for a smooth employee experience.


6 diapositivas
Onboarding 30-60-90 Day Roadmap Presentation
Get your team excited from day one with this colorful, easy-to-follow visual layout! This presentation template helps clearly map out onboarding goals and key activities across 30, 60, and 90 days. Perfect for HR professionals and team leads, it's fully editable and works with PowerPoint, Keynote, and Google Slides.


5 diapositivas
Financial Goals Infographics
Financial Goals are essential for creating a roadmap towards a secure financial future. This vertical infographic template is designed to illustrates goals, progress, and performance of financial investments. This is a perfect tool to help businesses, investors, and financial advisors communicate complex financial data in a simple and easy-to-understand way. It includes colorful illustrations and icons with text boxes that can show financial growth and progress. There are also sections for your investment strategies and financial metrics. You can fully customize this template to suit your specific needs.


7 diapositivas
Customer Journey Infographic Presentation Template
A Customer Journey Infographic is an illustration of the different stages a customer goes through when interacting with a business or organization. It is a way to show the customer's experience with the business or organization, from the initial contact to the post-purchase follow-up. This template is perfect for showing how people interact with your business, the emotions and feedback of your customer at each stage. This template includes lots of photo layouts, charts, and timelines that you can customize to show the different stages a customer goes through on their journey with your business.


20 diapositivas
Legendra Artist Portfolio Presentation
Showcase your creative journey with this dynamic artist portfolio presentation template. Highlight your featured projects, creative process, collaborations, and pricing in a visually engaging format. Perfect for artists, designers, and creative professionals looking to impress potential clients. Fully editable in PowerPoint, Keynote, and Google Slides.


22 diapositivas
Nightbloom Business Development Proposal Presentation
Develop impactful and persuasive business proposals with this polished and professional template. Designed to streamline your pitch, this layout includes slides for keynote introductions, session breakdowns, and objectives, ensuring every detail of your proposal is clearly communicated. Highlight your agenda, workshop sessions, and breakout topics to keep your audience engaged and informed. Add personal touches with speaker profiles, Q&A sections, and sponsor acknowledgments for a complete and professional presentation. Fully customizable and compatible with PowerPoint, Google Slides, and Keynote, this template enables you to tailor the design to your specific branding and goals. Perfect for business leaders, consultants, and development teams looking to make a lasting impression.


34 diapositivas
Bootstrapping Pitch Deck
Introducing our Bootstrapping Pitch Deck presentation! This template is designed to help you create a compelling pitch deck for your startup or business. With its minimal and modern design, this template will help you communicate your approach and showcase your business to potential investors, partners, or stakeholders. The slides are designed with a minimalist layout that allows for easy comprehension and emphasizes the key points of your pitch. The visuals, such as charts, graphs, and icons, are strategically used to convey information in a visually engaging manner and support your key messages. This template is fully customizable.


5 diapositivas
Workout Benefits Infographics
Engaging in regular workouts and physical exercise offers numerous benefits for both physical and mental well-being. These vertical infographic templates aim to motivate and educate individuals about the positive impact of workouts on physical health, mental well-being, and overall quality of life. These infographics are the perfect tools to be used in presentations, educational material, or fitness campaigns, this template helps inspire and inform viewers about the significant benefits of incorporating workouts into their daily routines. Compatible with Powerpoint, Keynote, and Google Slides.


20 diapositivas
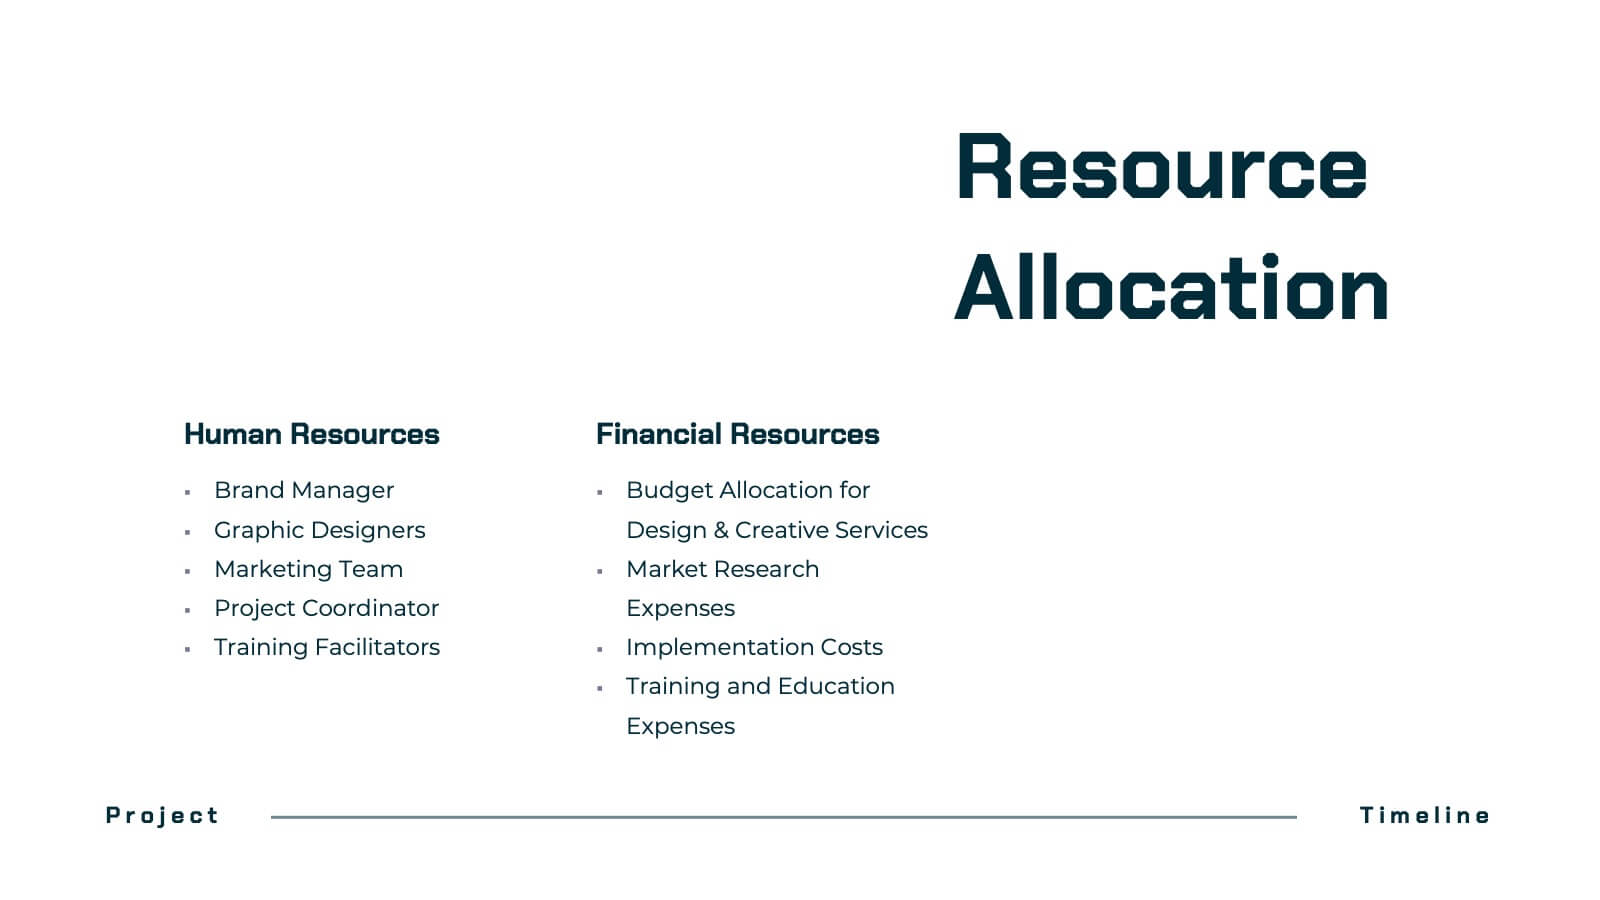
Dynastream Project Timeline Presentation
Stay on track with this detailed and well-organized project plan presentation designed for success! Covering essential areas like scope, objectives, timeline, budget breakdown, and risk management, it ensures every aspect of your project is clear and actionable. Perfect for team meetings or stakeholder updates, this template is fully compatible with PowerPoint, Keynote, and Google Slides.


6 diapositivas
IT Architecture System Infographic
IT architecture, referred to as information technology architecture, is a structured framework that defines how an organization's technology systems, applications, processes, and data interact and work together to support its business goals and objectives. This infographic template visually explains the components and structure of an IT architecture system within an organization. The visuals are included to simplify your technical concepts and guide your viewers through the intricacies of IT. This infographic can be customized to fit the specific needs of different organizations. Compatible with Powerpoint, Keynote, and Google Slides.


5 diapositivas
Artificial Intelligence Categories Infographics
Artificial Intelligence has the potential to revolutionize industries and create new opportunities for businesses and individuals. These infographic templates provide an overview of the different categories of artificial intelligence based on their functionality and applications. These infographics feature futuristic designs with icons and illustrations to represent each category of AI. The categories in this template are described with a short summary and corresponding icon or illustration. The infographic is designed with a vertical layout and uses a blue color scheme throughout. This template is perfect to introduce the basics of AI to an audience.


21 diapositivas
Eureka Startup Growth Plan Presentation
Present your startup growth plan effectively with this sleek, dynamic presentation template designed for innovators and entrepreneurs. With its vibrant color scheme and streamlined layout, it simplifies complex data, ensuring your audience stays engaged. The template offers slides for showcasing your mission, market analysis, business strategies, and revenue projections. Dedicated sections highlight team profiles, target audience insights, and funding goals, providing a comprehensive view of your growth trajectory. Use the timeline slides to map out milestones and visually articulate your progress. Fully customizable in PowerPoint, Google Slides, and Keynote, it adapts effortlessly to your specific needs, enabling you to communicate your vision with clarity. Ideal for pitching to investors, presenting at conferences, or internal strategic planning, this template equips you with the tools to drive home your ideas with professionalism and style. Empower your growth journey with a presentation that reflects your startup’s potential.


2 diapositivas
Professional Thank You Slide Presentation
End your presentation with a clean, modern slide that leaves a polished final impression. This layout gives you space to share closing notes, contact details, or key reminders in a clear and visually balanced style. Fully editable and compatible with PowerPoint, Keynote, and Google Slides.


2 diapositivas
Online Course Structure and Syllabus Deck Presentation
Welcome students with a vibrant and modern course intro slide. This template is perfect for online educators outlining course objectives and syllabus details. Features an image placeholder and text sections for clear communication. Fully editable in PowerPoint, Keynote, and Google Slides—ideal for virtual learning environments and eLearning programs.


5 diapositivas
Vegan Industry Infographics
The Vegan Industry is the market and economic activities associated with products and services that cater to the needs and preferences of vegans, who follow a plant-based lifestyle and avoid the use of animal products. These infographic templates educate and raise awareness about the benefits of a vegan lifestyle, sustainable food choices, and the increasing popularity of vegan products. These templates aims to inform and inspire individuals to consider the benefits of veganism, both for personal health and the well-being of animals and the environment. These allows you to highlight the growth and impact of the vegan industry to your audience.