


Características


¿Tienes alguna pregunta?
Recomendar


7 diapositivas
National Survey Results Infographics
Survey Results can provide valuable insights and data that can be used to make informed decisions, improve offerings, and stay ahead of the competition. This survey results template features a clean design and is a completely customizable presentation that allows you to easily change the colors, fonts and graphics. You can use this infographic as a tool to insert into your product and marketing presentations. This presentation is compatible with Powerpoint, Keynote and Google Slides. Simply add your information and have it customized with your text and chart options to suit your needs.


21 diapositivas
Dewspire Project Management Plan Presentation
Streamline your project planning process with this visually striking and organized presentation template. Perfectly designed to communicate every stage of your project management, it features sections for problem analysis, objectives, and the scope of work. The timeline, budget breakdown, and resource allocation slides ensure your plans are both clear and actionable. Highlight team expertise with dedicated meet the team layouts and showcase your commitment to quality through evaluation criteria and risk management plans. Ideal for team presentations or client proposals, this template supports PowerPoint, Google Slides, and Keynote, offering full customization for seamless adaptability. Deliver your project vision with confidence and precision!


7 diapositivas
Enterprise Governance Infographics
A Governance Infographic provides information about the principles and practices of governance, particularly in the context of organizations or institutions. This governance template can be used to cover a wide range of topics related to governance, including organizational structures, decision-making processes, risk management, compliance, and ethical standards. You can use this to include information on the roles and responsibilities of different stakeholders, such as board members, executives, and employees, as well as the policies and procedures that govern their interactions.


12 diapositivas
Effective Decision-Making with RAPID Presentation
Unlock streamlined decision-making with the Effective Decision-Making with RAPID template, a comprehensive guide designed to help organizations enhance and clarify their decision-making processes. Covering the key phases: Recommend, Agree, Perform, Input, and Decide, this template is essential for teams looking to optimize operational efficiency. Ideal for a variety of business environments, it is compatible with PowerPoint, Keynote, and Google Slides, offering versatility and ease of use for professionals.


6 diapositivas
Break-Even Point Financial Analysis
Simplify financial planning with this modern break-even analysis diagram. Ideal for startups, project managers, and finance teams, this circular layout visually tracks six key financial stages. Use it to illustrate cost structures, revenue goals, and profitability timelines. Fully editable in PowerPoint, Keynote, and Google Slides.


7 diapositivas
Marketing Calendar Schedule Organizer
Stay on top of every post, caption, and campaign with this simple and stylish visual planner—built to make your content calendar finally feel manageable. Designed to help marketers organize platforms, posting times, and links all in one place, it’s your go-to tool for streamlined weekly planning. Fully compatible with PowerPoint, Keynote, and Google Slides.


5 diapositivas
Business Insight Iceberg Presentation
Visualize surface-level data and deeper insights with the Business Insight Iceberg Presentation. Perfect for showcasing organizational structure, decision-making layers, or strategy breakdowns. Each editable layer helps communicate complexity clearly and effectively. Fully compatible with PowerPoint, Keynote, and Google Slides—ideal for professionals, analysts, and educators aiming for clarity and impact.


10 diapositivas
Overcoming Market Challenges Presentation
Overcome business obstacles with confidence using this Overcoming Market Challenges template. Designed with a dynamic step-by-step growth visual, this slide helps illustrate challenges, solutions, and progress in an engaging way. Ideal for strategy meetings, financial forecasts, and competitive analysis, this template makes complex information easy to understand. Fully editable for PowerPoint, Keynote, and Google Slides.


7 diapositivas
Organizational Structure with 7S Model Presentation
Bring your organizational framework to life with a clean, modern layout that makes complex relationships easy to understand. This presentation helps you explain key elements, show how they connect, and guide strategic discussions with clarity and structure. Fully editable and compatible with PowerPoint, Keynote, and Google Slides.


4 diapositivas
Green Business Sustainability Report Presentation
Communicate your sustainability efforts effectively with the Green Business Sustainability Report Presentation template. This visually engaging slide deck is designed to showcase eco-friendly business initiatives, corporate responsibility strategies, and environmental impact assessments. With an organic, nature-inspired design and a clear, structured layout, this template is perfect for sustainability consultants, corporate leaders, and environmental advocates. Fully editable and compatible with PowerPoint, Keynote, and Google Slides for seamless customization and presentation.


7 diapositivas
Productivity Comparison Infographic
Step into the dynamic realm of efficiency with our Productivity Comparison Infographic. Set against a pristine white backdrop, the palette dances with the invigorating energy of orange, the reliability of blue, and the fervor of red. This lively template boasts engaging infographics, custom-designed icons, and adaptable image placeholders that vividly illustrate the highs and lows of productivity metrics, tools, and strategies. Expertly crafted for Powerpoint, Keynote, or Google Slides. A must-have for business analysts, team leads, productivity coaches, or any professional keen on spotlighting productivity contrasts.


8 diapositivas
Business Strategy Planning Presentation
Strategize with Impact using this Business Strategy Planning Presentation template. This slide provides a visually compelling roadmap to outline key business strategies, objectives, and growth plans in an easy-to-follow format. Perfect for corporate meetings, executive briefings, and business planning sessions, this template ensures your business vision is communicated clearly and effectively. Fully editable and available for PowerPoint, Keynote, and Google Slides for seamless customization.


5 diapositivas
Circular Wheel for Process Flow
Visualize five interconnected stages or phases in a clean, circular layout. Ideal for presenting workflows, continuous cycles, or recurring business processes with clarity and structure. Easily customizable in PowerPoint, Keynote, and Google Slides to match your project needs.


7 diapositivas
Asia Population Infographic Presentation
An Asia Map infographic is a visual representation of the Asian continent, highlighting its geographic features, population, culture, history, and other relevant information. Use this template as a graphic representation of Asia that combines text, data, and images in a visually appealing and informative way. This template can be used as a political or physical maps, regional map, thematic maps, or a combination of these. They may also include charts, graphs, illustrations, photographs, or other visual elements to convey information effectively. This template is completely customizable.


21 diapositivas
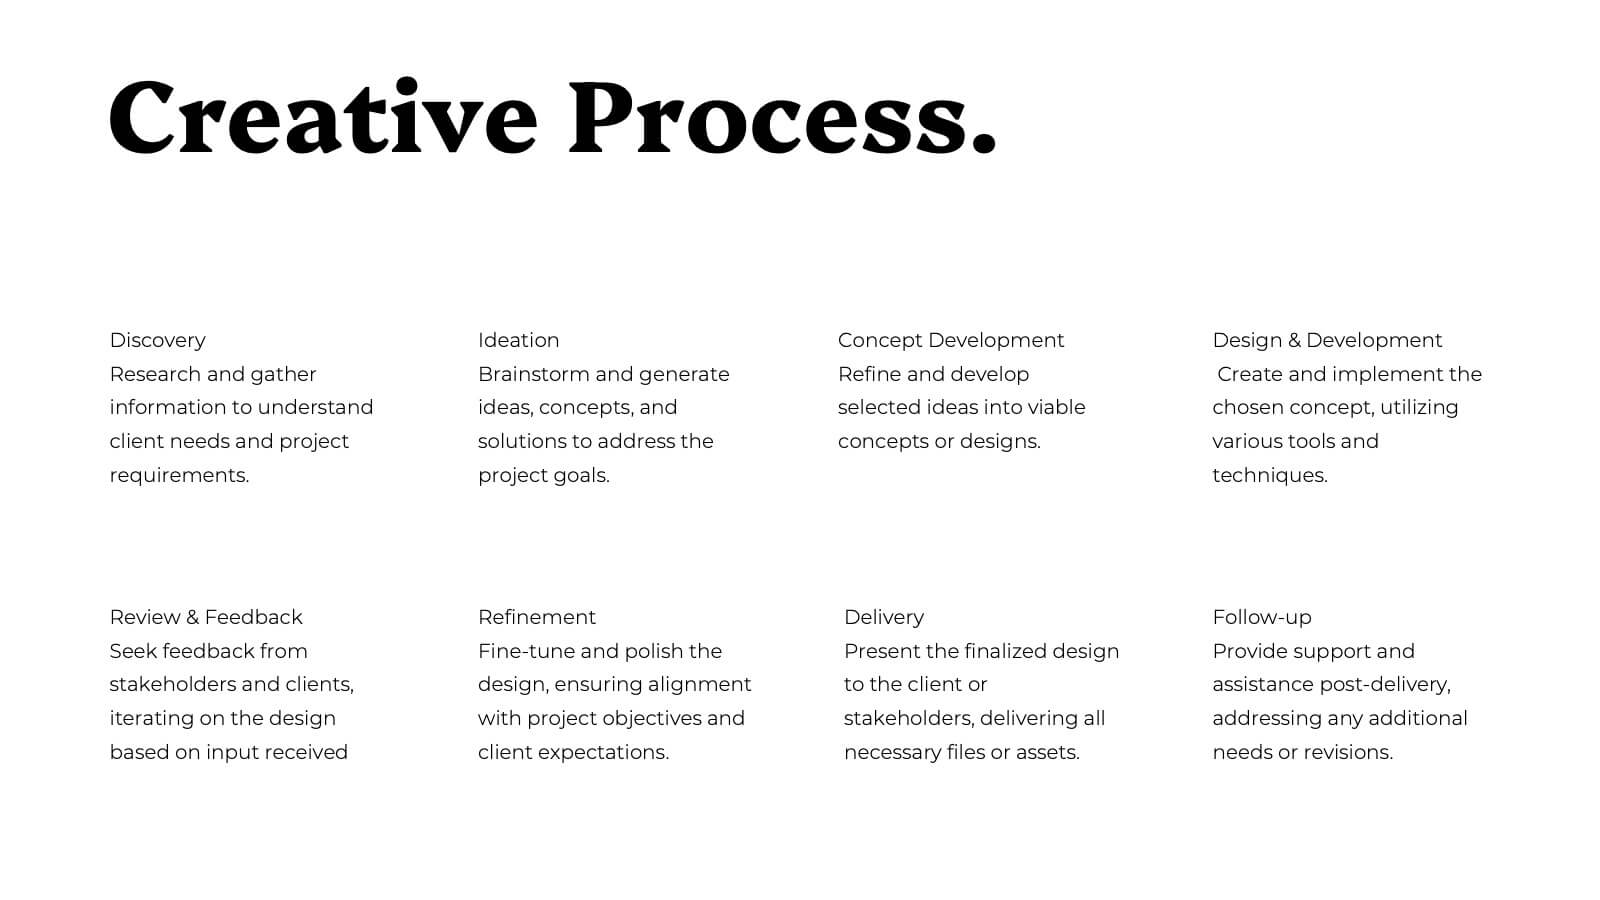
Arcadian Photography Portfolio Template Presentation
Showcase your best work with this sleek and stylish photography portfolio presentation template! It’s perfect for presenting your featured projects, creative process, and client testimonials in a visually stunning way. This template is fully customizable and offers a professional touch to your portfolio, making it ideal for both personal and client presentations. Compatible with PowerPoint, Keynote, and Google Slides.


20 diapositivas
Aether Marketing Research Report Presentation
The Marketing Research Report Presentation Template offers a sleek design with 20 fully customizable slides, ideal for presenting in-depth marketing insights. This template features sections for industry analysis, consumer behavior, emerging technologies, and marketing trends like SEO, social media, and influencer strategies. It also highlights e-commerce trends, personalization, sustainability, and storytelling techniques. The modern black-and-gold gradient aesthetic adds sophistication, making it perfect for professional reports. Compatible with PowerPoint, Keynote, and Google Slides, this template ensures a polished and engaging presentation experience.


6 diapositivas
Customer Perceived Value Analysis
Visualize what matters most to your audience using this customer-centric diagram. Perfect for marketers, brand strategists, and CX professionals looking to present value drivers, motivations, or user insights. Easily editable in PowerPoint, Keynote, and Google Slides—customize colors, icons, and text to align with your brand.