


Características


¿Tienes alguna pregunta?
Recomendar


6 diapositivas
Regional Finance Infographic
Regional finance plays a vital role in fostering economic growth, attracting investments, and improving the overall well-being of communities within a specific region. This infographic template focuses on financial trends, insights, and data related to specific regions or countries. It is designed to help businesses, organizations, or financial professionals analyze and understand the financial landscape of a particular region. The data-driven content in this template is suitable for businesses or individuals seeking insights to make informed decisions regarding investments, market entry, or financial planning in a specific region.


6 diapositivas
Stages of Product Life Cycle Infographics
Visualize the stages of a product's life cycle with our customizable infographic template. This template is fully compatible with popular presentation software like PowerPoint, Keynote, and Google Slides, allowing you to easily customize it to illustrate and communicate the key phases of a product's life cycle. The Stages of Product Life Cycle infographic template offers a visually engaging platform to depict the various stages, including introduction, growth, maturity, and decline. Whether you're a product manager, marketer, business owner, or student, this template provides a user-friendly canvas to create informative presentations and educational materials. Enhance your understanding of product life cycles with this SEO-optimized infographic template, thoughtfully designed for clarity and ease of use. Customize it to showcase the characteristics, strategies, and challenges associated with each stage, helping you make informed decisions about your products and their market positioning. Start crafting your personalized infographic today to explore the dynamic nature of the product life cycle.


5 diapositivas
Business Workflow Process Presentation
Optimize your operations with the Business Workflow Process template, designed to visually map out tasks and streamline workflows. Perfect for project managers and teams, this template enhances clarity and collaboration. Fully customizable and compatible with PowerPoint, Keynote, and Google Slides, making professional workflow presentations seamless and efficient.


4 diapositivas
Green Business and Climate Goals Presentation
Bring your sustainability message to life with a fresh and vibrant layout that guides viewers through key milestones. This template helps communicate eco-friendly initiatives and climate strategies in a simple timeline format. Ideal for showcasing goals, progress, and impact. Fully compatible with PowerPoint, Keynote, and Google Slides for easy editing.


8 diapositivas
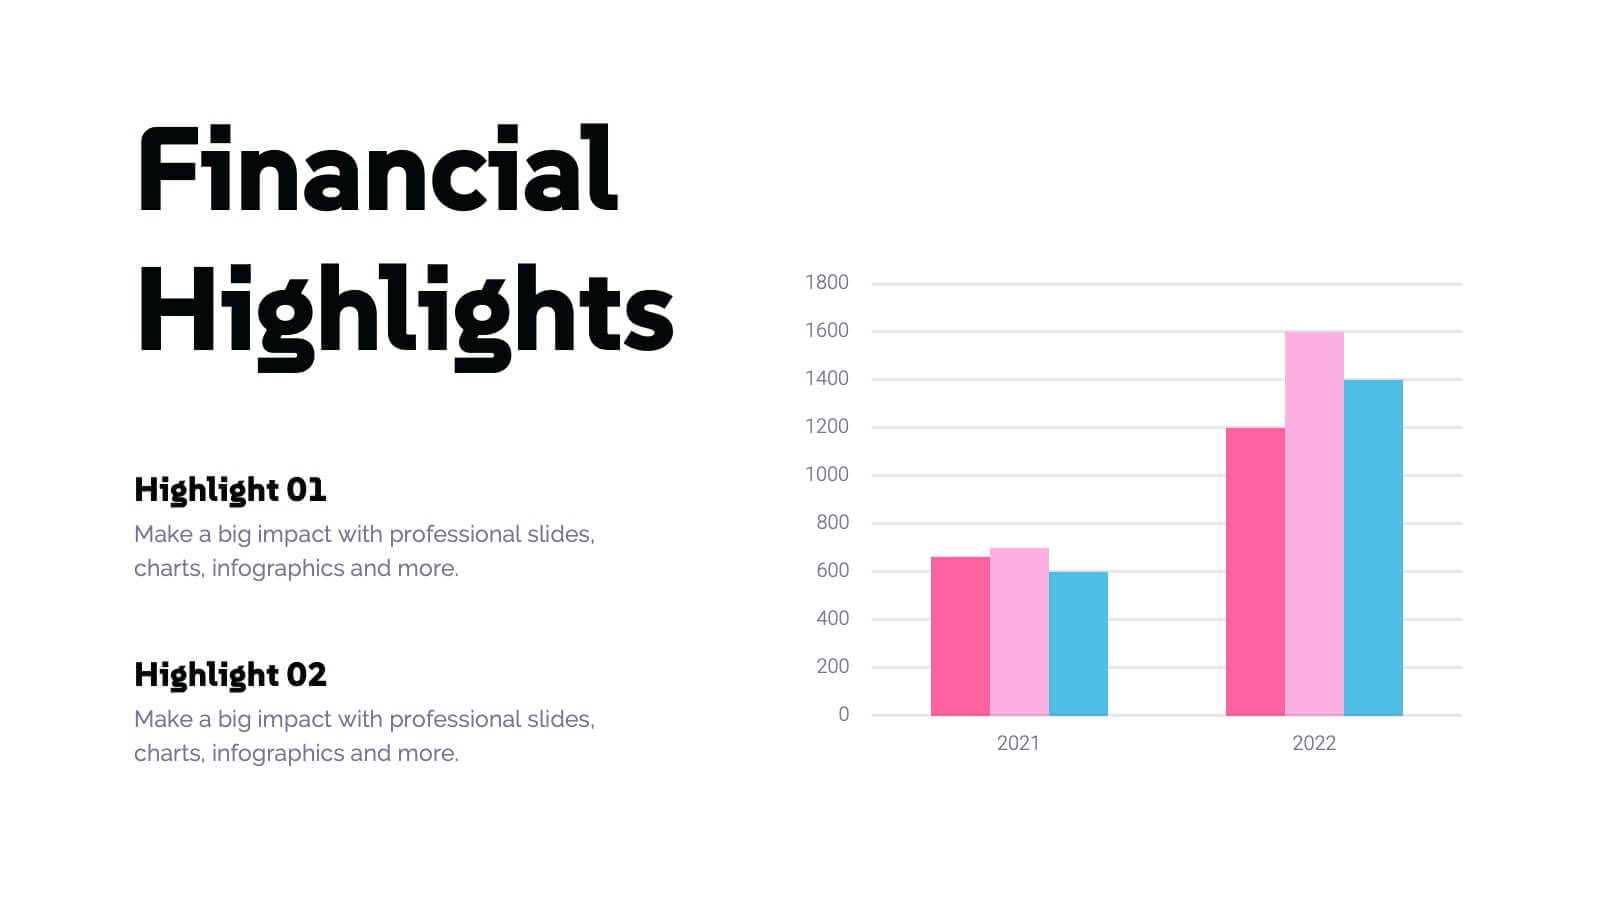
Impressive Business Metrics by Numbers
Highlight your company’s key wins with the Impressive Business Metrics by Numbers Presentation. This data-driven slide layout emphasizes three core metrics using bold numbering, modern icons, and clear titles—perfect for showcasing KPIs, milestones, or achievements. Ideal for reports, pitches, and performance reviews. Fully editable in PowerPoint, Keynote, and Google Slides.


6 diapositivas
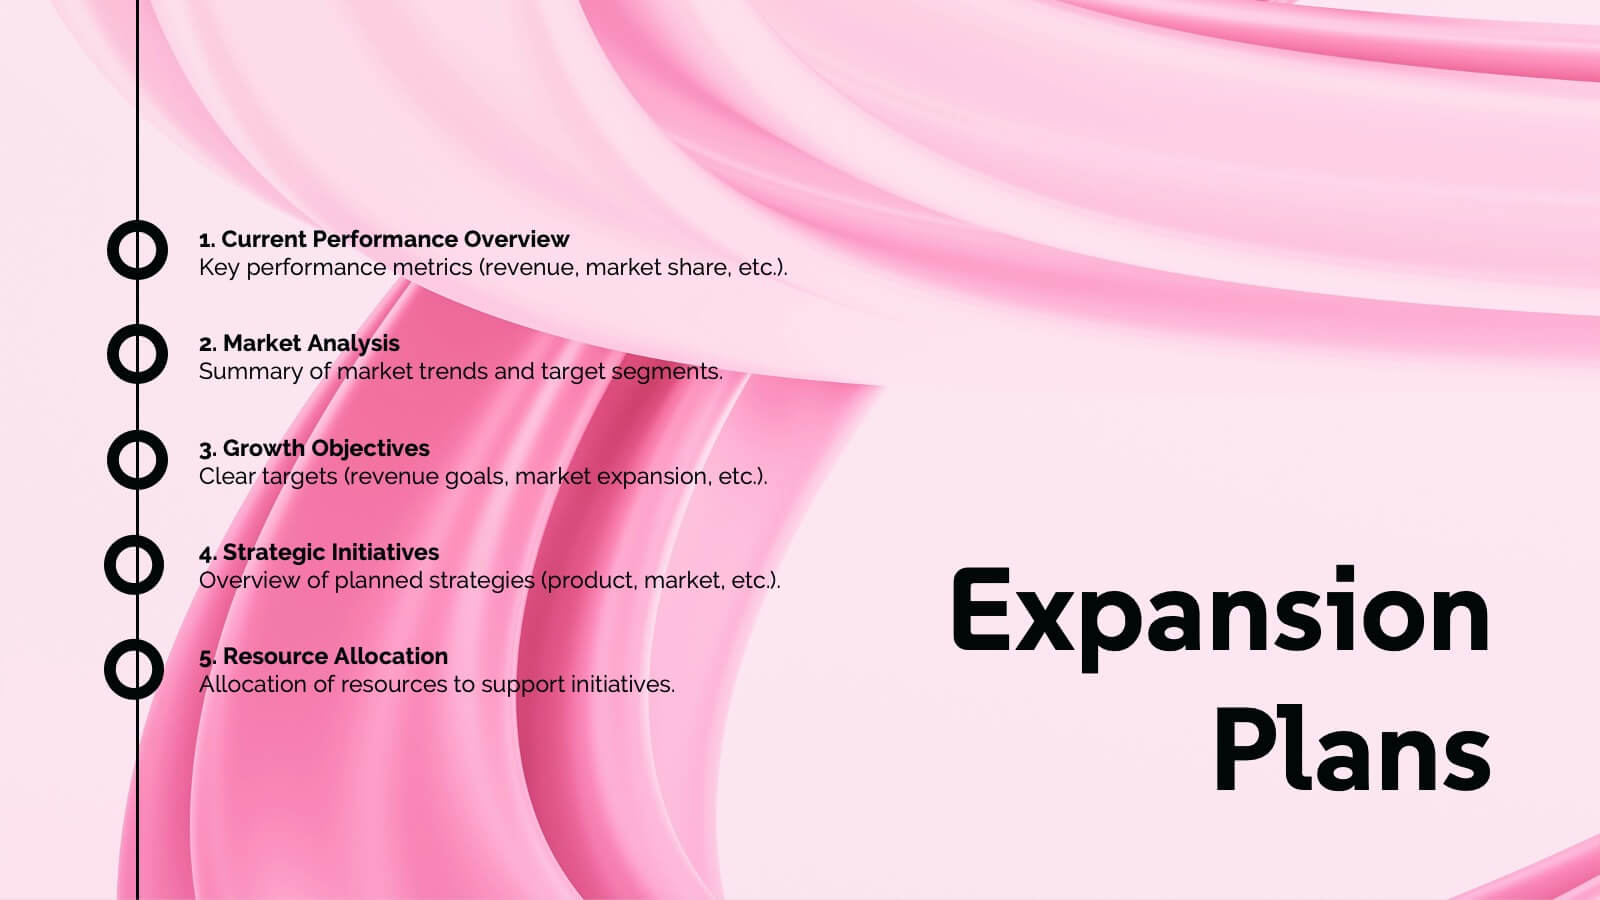
Business Process Flowchart Presentation
Streamline your workflow with the Business Process Flowchart presentation. This structured and visually engaging template helps you map out processes, optimize efficiency, and improve communication within your team. Designed for business analysts, managers, and strategists, this fully editable slide ensures clarity in decision-making and operations. Compatible with PowerPoint, Keynote, and Google Slides.


6 diapositivas
3D Shapes Infographic
3D shapes, also known as three-dimensional shapes or solids, are geometric figures that have three dimensions: length, width, and height (or depth). This Infographic visually explains various three-dimensional geometric shapes, their properties, and real-world applications. With this template you can summarize the benefits of the 3D Shapes in simplifying the understanding of complex shapes and encouraging practical applications in various fields. This infographic is the perfect study aid for students preparing for geometry exams. This is fully customizable and compatible with Powerpoint, Keynote, and Google Slides.


5 diapositivas
Online Advertising and SEO Marketing Presentation
Elevate your digital marketing strategy with this engaging infographic template! Designed for clarity, it simplifies online advertising and SEO concepts, covering key metrics, trends, and strategies. Perfect for teams, clients, or stakeholders, it’s fully customizable and compatible with PowerPoint, Keynote, and Google Slides for seamless presentations that captivate and inform.


21 diapositivas
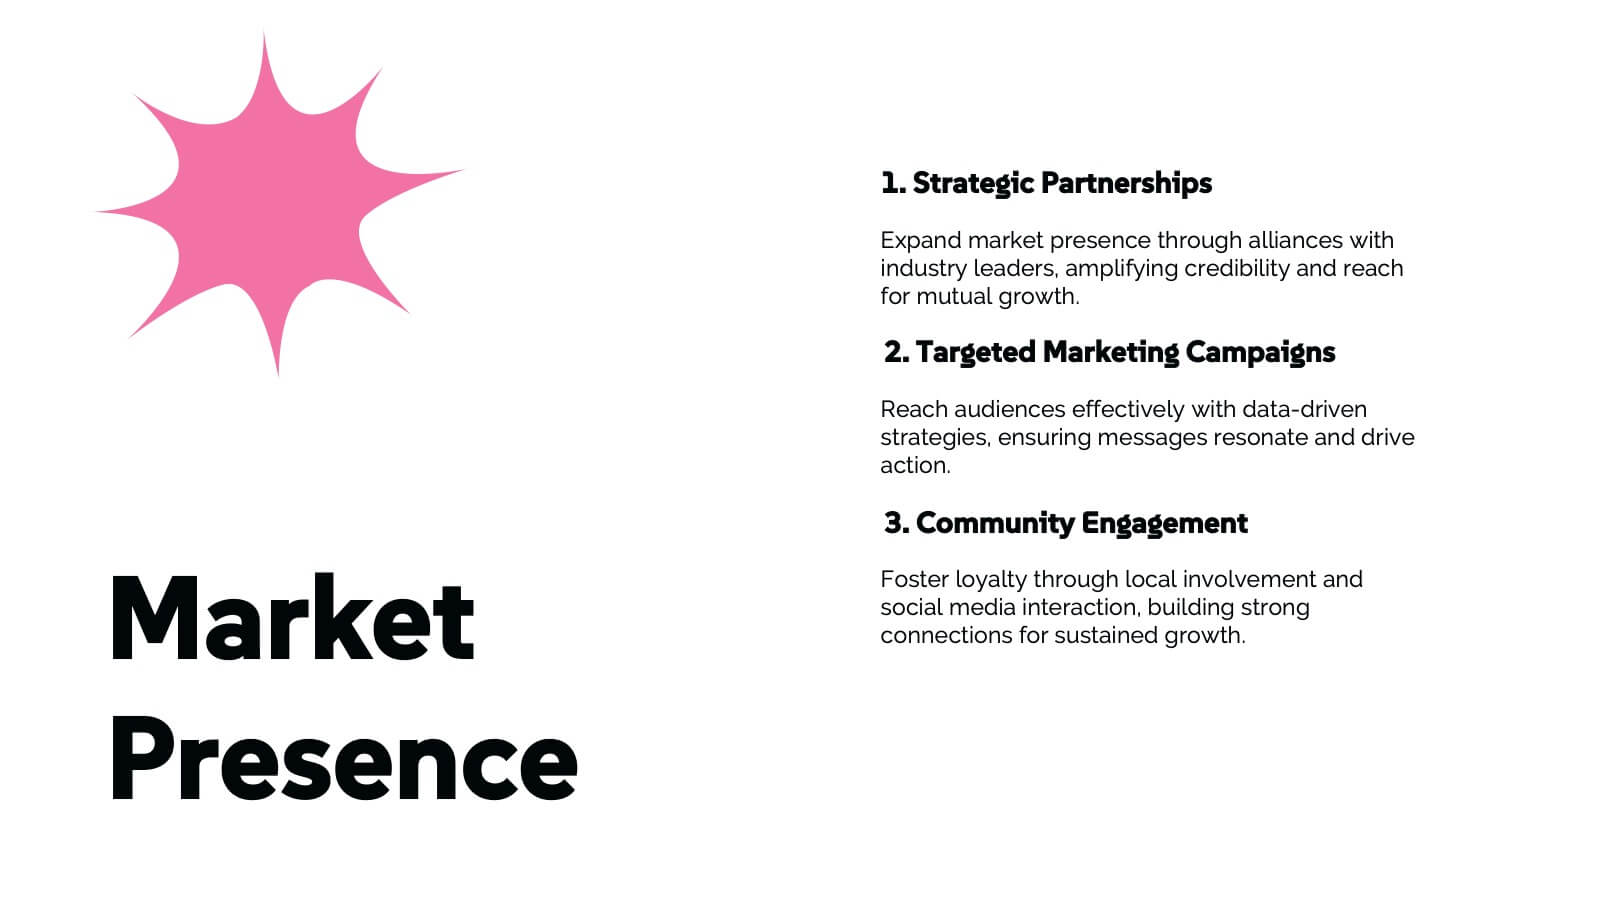
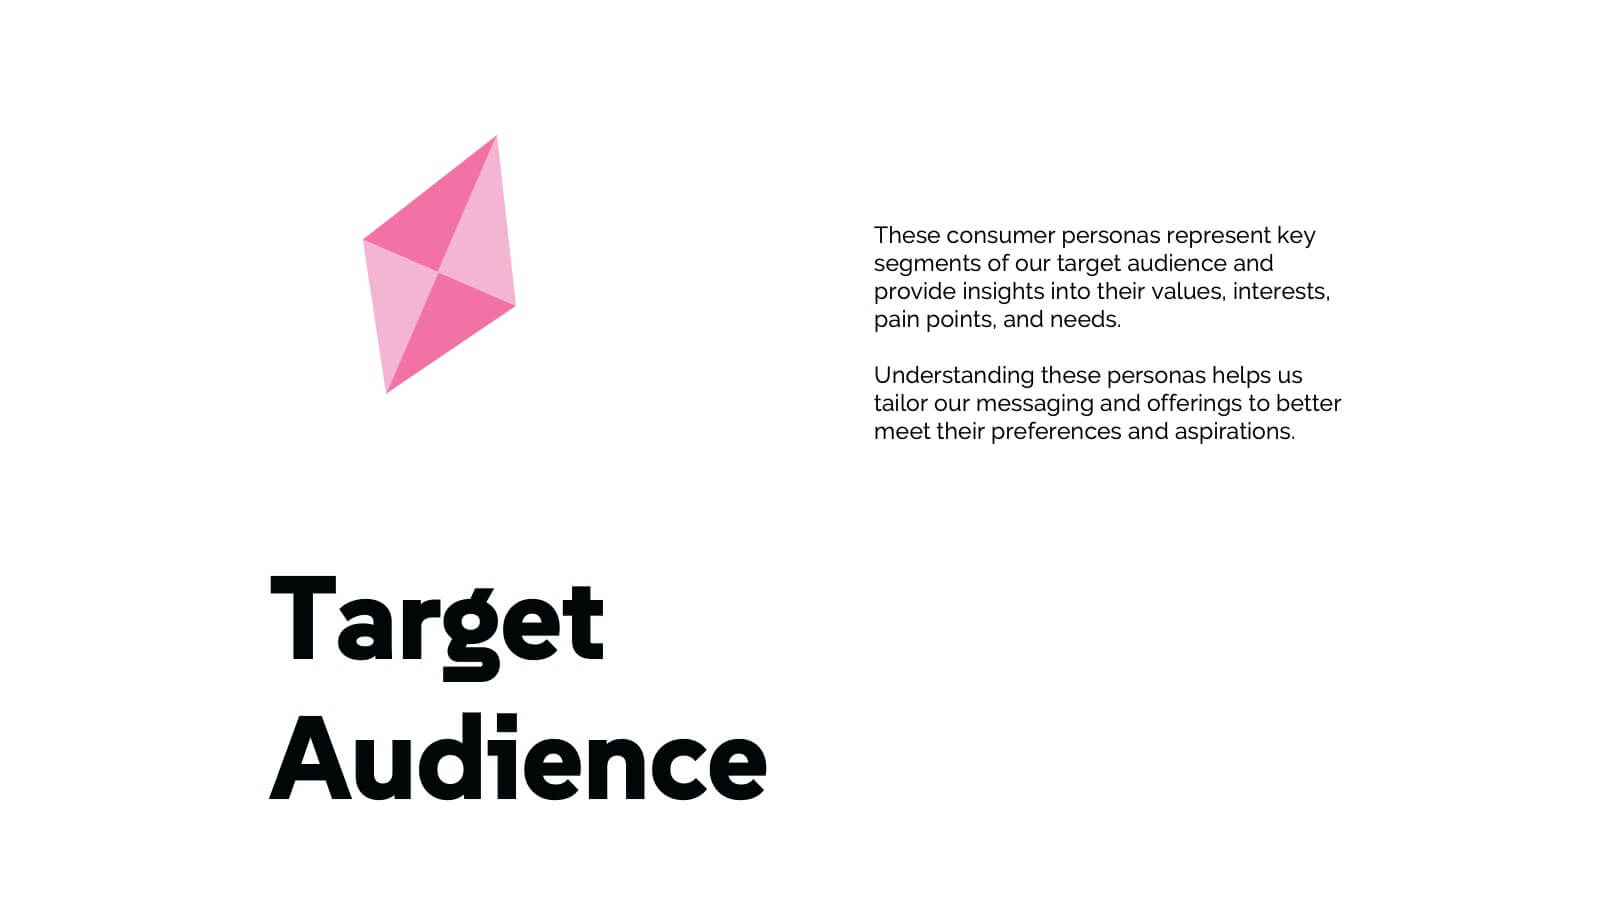
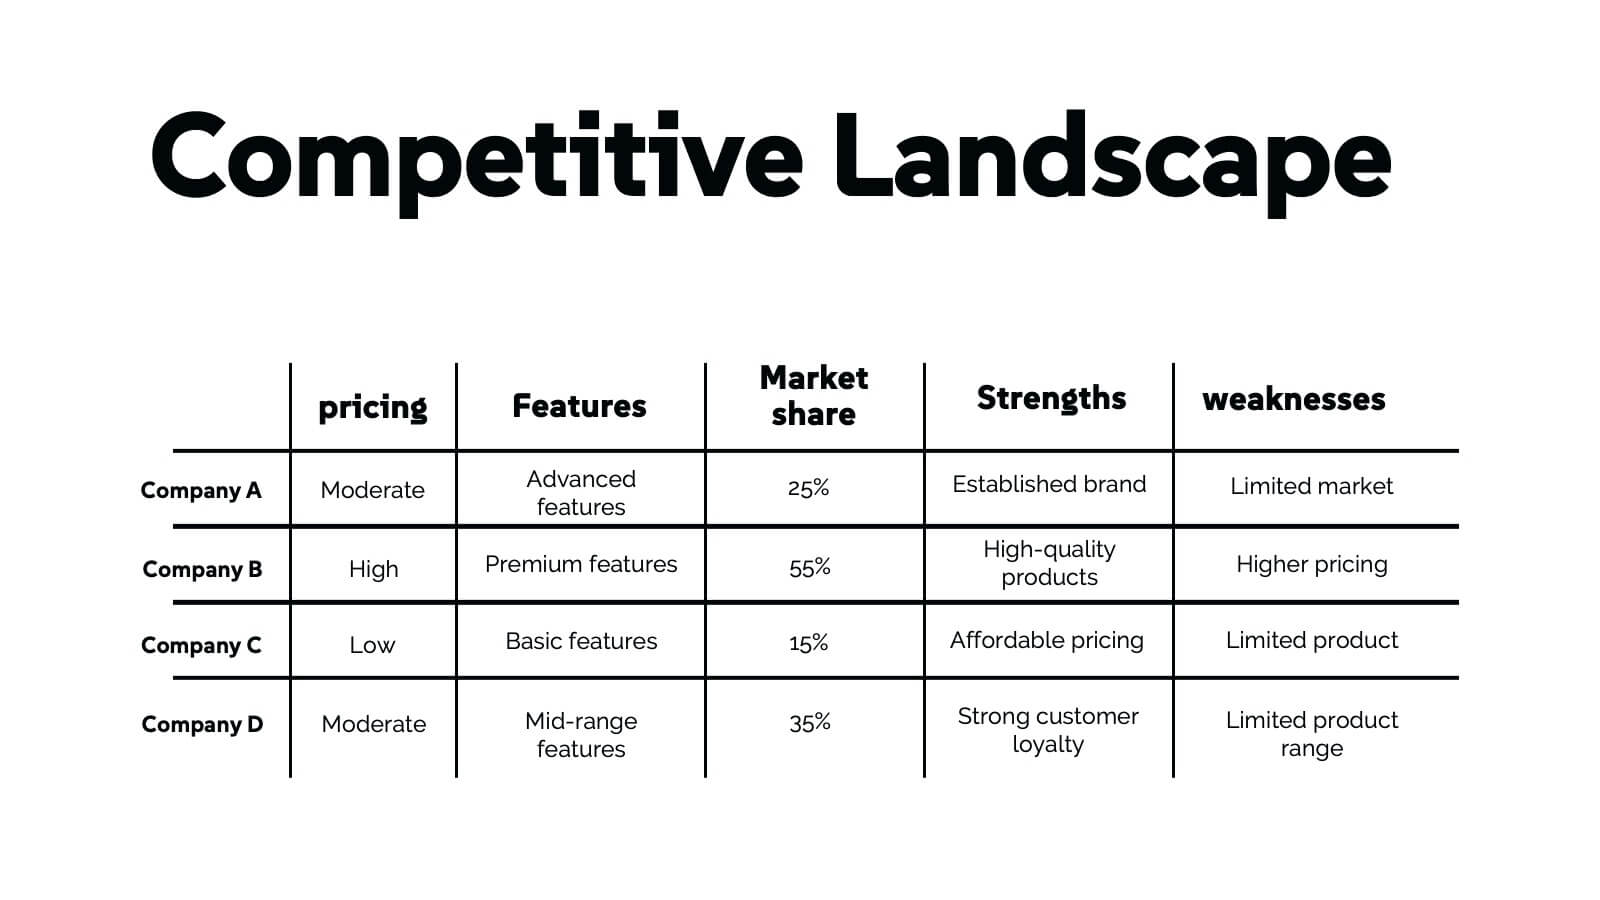
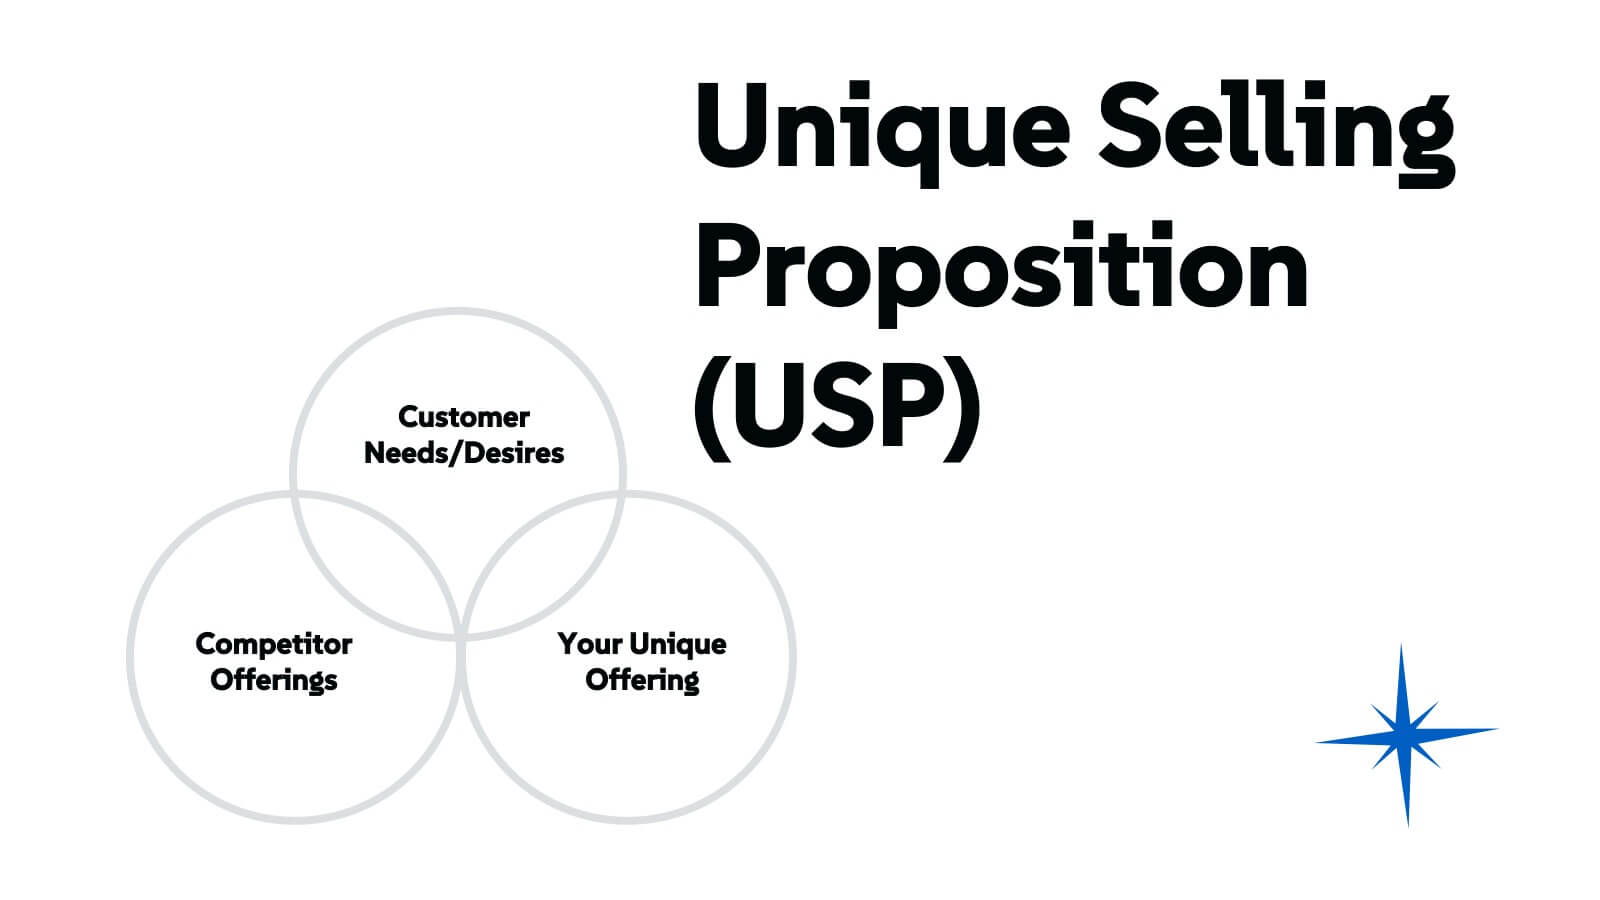
Chimera Marketing Campaign Presentation
Create a visually engaging digital marketing presentation with this modern template! Covering essential topics like company history, market presence, target audience, and competitive landscape, this template helps you showcase your marketing strategies effectively. Fully customizable, it works seamlessly with PowerPoint, Keynote, and Google Slides for professional presentations every time.


12 diapositivas
Business Event Planning Schedule Presentation
Optimize your event planning with the Business Event Planning Schedule template, which streamlines your organization efforts by providing a clear timeline from January to June. It's perfect for entering key business insights or data at various stages. Designed for adaptability, this template ensures your planning remains concise and relevant. Compatible with PowerPoint, Keynote, and Google Slides, it integrates effortlessly into your workflow.


7 diapositivas
Human Resources Administration Infographic
Human Resources Administration involves managing and overseeing various aspects of an organization's human capital and related processes. Our HR administration Infographic is your compass in the vast realm of HR, guiding you through essential aspects, best practices, and strategies crucial for successful HR management. This template is your guide to navigating the HR terrain. Compatible with Powerpoint, Keynote, and Google Slides. Discover best practices, strategies, and essential aspects of HR, empowering you to lead with expertise, empathy, and efficiency in the exciting world of human resources.


5 diapositivas
Online Learning Platforms and Strategies Presentation
Simplify complex educational strategies with this layered house-shaped diagram designed for digital learning topics. Each tier represents a strategic element of your e-learning platform, from planning to implementation. Featuring five clearly labeled sections with editable icons and text, this slide is ideal for showcasing course structures, platform features, or training rollouts. Fully customizable in PowerPoint, Keynote, and Google Slides.


20 diapositivas
Etherwave Graphic Design Project Plan Presentation
Bring your creative vision to life with this vibrant graphic design project plan template, perfect for showcasing design concepts, mood boards, and prototypes. With sections for design elements, feedback, and implementation, it guides you through each stage of the creative process. Ideal for designers, this template is compatible with PowerPoint, Keynote, and Google Slides.


8 diapositivas
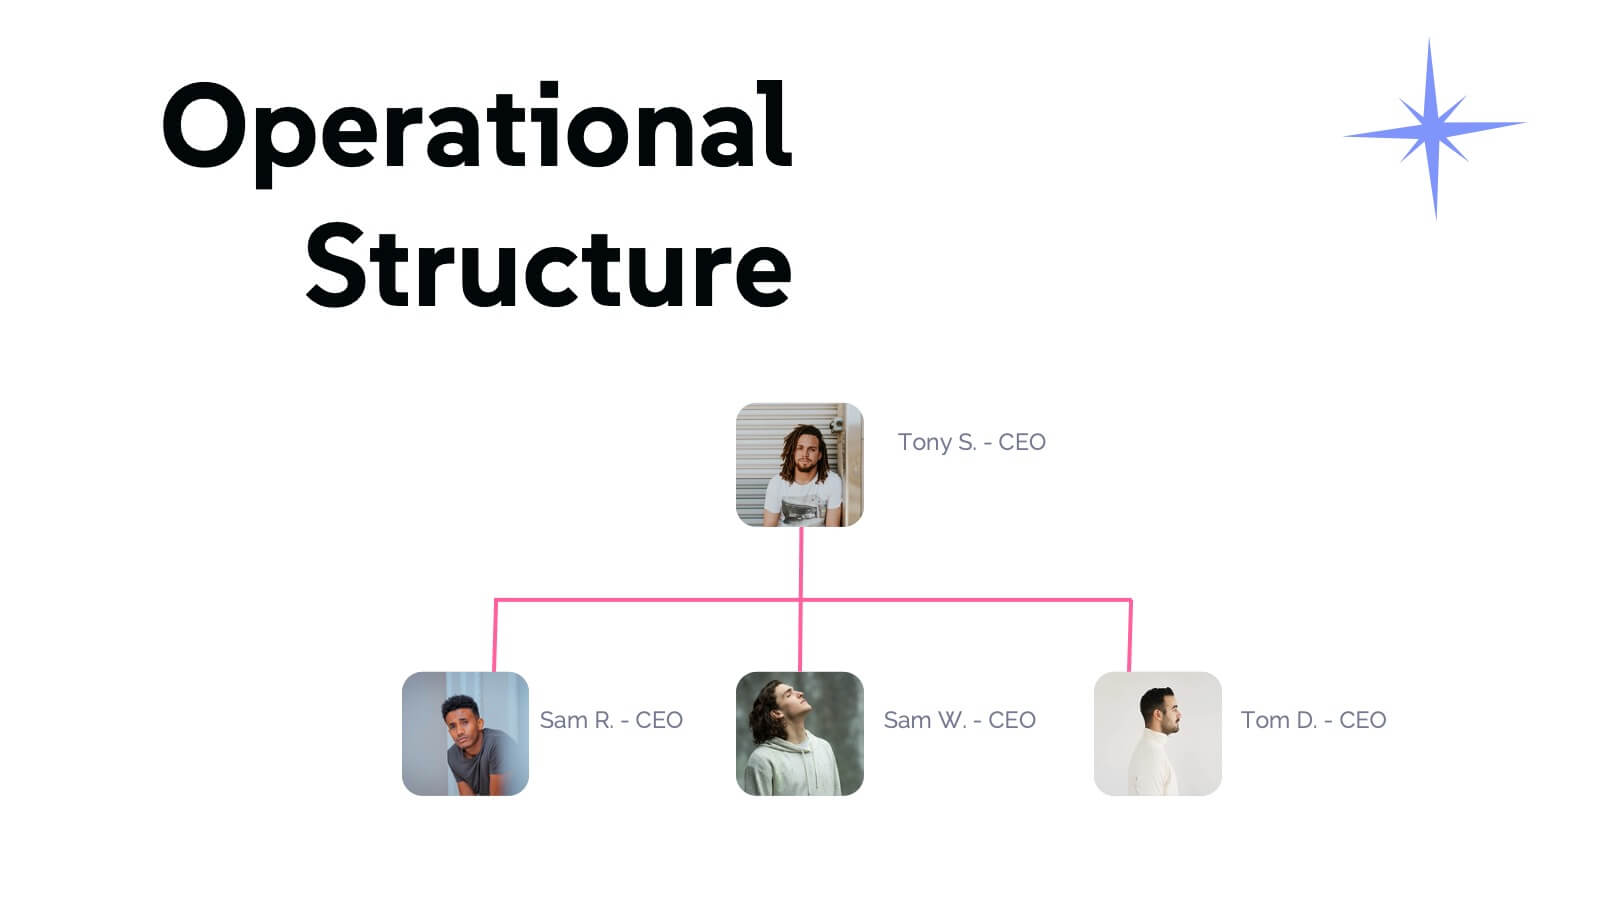
Project Stakeholder Mapping Presentation
Visualize the impact and influence of different stakeholder groups with our Project Stakeholder Mapping Presentation template. This tool offers a clear graphical representation to guide project managers in understanding stakeholder dynamics, ensuring effective engagement and strategic decision-making. Compatible with PowerPoint, Keynote, and Google Slides.


5 diapositivas
Editable Mind Mapping Presentation
Clarify complex thoughts with the Editable Mind Mapping Presentation. This sleek template features a central profile design with five branching points to visualize ideas, processes, or strategies. It's perfect for brainstorming sessions, team collaboration, or project planning. Fully customizable and compatible with PowerPoint, Keynote, and Google Slides.


2 diapositivas
Pink Ribbon Event Slide Deck Presentation
Bring awareness and compassion to your presentation with a bold ribbon design that symbolizes unity and support. Perfect for health campaigns, charity events, or educational talks, this layout helps you share key messages with clarity and impact. Fully compatible with PowerPoint, Keynote, and Google Slides for easy customization.


7 diapositivas
30 60 90 Nutritional Plan Infographic
Chart a path to healthful living with the 30 60 90 Nutritional Plan Infographic. In a vibrant mix of yellow, purple, blue, and white, this template presents a visually delightful guide to nutrition enthusiasts and health-conscious audiences. The tailored design encourages a gradual approach to dietary transitions, making it easier to understand and adhere to. Health coaches, dietitians, or fitness trainers will find this as an indispensable tool for workshops, webinars, or consultations. Its seamless integration with PowerPoint, Keynote, and Google Slides enhances the user experience during presentations.