


Características


¿Tienes alguna pregunta?
Recomendar


4 diapositivas
Editable Table Chart Presentation
Simplify side-by-side evaluations with the Editable Table Chart Presentation. Designed for clear comparisons, this layout uses checkmarks, icons, and a clean structure to display features or data across multiple categories. It's perfect for showcasing product options, service tiers, or strategic alternatives. Fully customizable and compatible with PowerPoint, Keynote, and Google Slides.


7 diapositivas
Smart Goals Infographic
Smart goals are a framework used to create effective and achievable objectives in various contexts, including personal development, business, education, and more. Our smart goals infographic is your roadmap to success. Uncover the power of smart goals - Specific, Measurable, Achievable, Relevant, and Time-bound, and how they can revolutionize your journey towards personal and professional achievement. This Infographic is more than a visual guide; it's an invitation to transform your ambitions into achievements. Discover the power of smart goals, seize control of your destiny, and embark on a path to success like never before.


7 diapositivas
Project Management Tools Infographic
Project management is the discipline of planning, organizing, securing, and managing resources to achieve specific goals within a defined time frame and budget. This visually appealing and informative template allows you to represent project lifecycles, key milestones, team roles, and more, making complex project data easily digestible. Fully customizable and compatible with Powerpoint, Keynote, and Google Slides. Illustrate the project lifecycle from initiation to completion for a comprehensive understanding. Utilize this template to effectively show project progress and objectives, ensuring your audience is informed throughout the project's lifecycle.


7 diapositivas
Future Vision Infographic
Chart a course towards a visionary future with our Future Vision Infographic Template. This dynamic template is designed to help organizations articulate and visualize their long-term goals and strategies in a clear and compelling way. Each slide offers a unique blend of geometric designs and bold color palettes, ideal for engaging stakeholders and inspiring action. Perfect for corporate presentations, strategic meetings, or digital showcases, this template allows you to lay out your vision with precision. It guides viewers through your roadmap to success, highlighting key milestones and the innovative steps you plan to take. Customize each element to echo your organizational identity and values, ensuring that your future aspirations resonate deeply with your audience. Whether you're aiming to motivate your team, attract investors, or inform your partners, our Future Vision template provides a robust foundation for powerful storytelling and strategic clarity.


8 diapositivas
Air Travel Safety and Operations Presentation
Capture your audience’s attention with this aviation window-inspired layout, designed to visualize safety protocols or operational steps in air travel. Featuring four distinct segments arranged like a view through a plane window, it’s ideal for airline safety briefings, operational workflows, or compliance overviews. Fully editable in PowerPoint, Keynote, and Google Slides.


8 diapositivas
Dynamic Pricing Strategies Presentation
Navigate market complexities with our 'Dynamic Pricing Strategies' presentation template, perfect for outlining variable pricing models that respond to market demands. This versatile tool is ideal for businesses looking to adapt and thrive, with designs compatible with PowerPoint, Keynote, and Google Slides.


7 diapositivas
Social Hierarchy Infographics
A Social Hierarchy is a way of organizing and ranking individuals or groups within a society based on factors such as social status, wealth, power, and prestige. This template features a powerful message about the difference in power between different groups, a stylish design and is fully customizable. Designed for use in Powerpoint, Google Slides and Keynote. Use this template to make your point clear in a meaningful way that really sticks with your audience. This hierarchy themed infographic is best suited for presentations about company structure, business hierarchies and office politics.


5 diapositivas
Music Eras Infographics
Music history is often divided into distinct eras or periods based on the characteristics and predominant styles of music during specific time periods. These infographic templates are designed to present a chronological overview of significant musical periods, highlighting their characteristics, key composers, notable genres, and major developments. These templates serves as a comprehensive visual guide to help audiences understand the evolution of music throughout history. This template provides a captivating overview of the major music eras, allowing viewers to appreciate the distinct characteristics and contributions of each period.


7 diapositivas
Modern Education Infographic
Immerse yourself in the evolving world of learning with our Modern Education Infographic. With a crisp white canvas, the design incorporates an energizing mix of orange, the trust-building hue of blue, and a dash of passionate red. This template boasts modern infographics, bespoke icons, and versatile image placeholders, offering a visual guide to contemporary educational methods, tools, and trends. Precision-made for Powerpoint, Keynote, or Google Slides. Ideal for educators, curriculum developers, edtech startups, or any professional keen on showcasing the transformation in learning techniques.


4 diapositivas
Task and Role Allocation Matrix
Clarify team responsibilities with this modern Task and Role Allocation Matrix. Easily visualize who is Responsible, Accountable, Contributing, and Informed for each task. Ideal for team leaders, HR planners, and project coordinators. Fully customizable in PowerPoint, Keynote, and Google Slides.


5 diapositivas
Executive Summary of Business Goals Presentation
Showcase your strategic objectives clearly with this Executive Summary of Business Goals Presentation. Featuring a layered pyramid structure and bold icons, it effectively breaks down five key goals or priorities. Perfect for business reviews, annual plans, or leadership meetings. Fully customizable in Canva, PowerPoint, or Google Slides.


6 diapositivas
Executive Leadership Training Presentation
Enhance professional development with this executive leadership training template, designed with a step-by-step staircase layout symbolizing career progression. Perfect for leadership programs, corporate training, and skill-building workshops, it visually organizes six key topics for clarity. Fully editable in Canva, PowerPoint, or Google Slides, making customization effortless for any organization’s needs.


8 diapositivas
Effective Leadership Strategy
Visualize leadership pillars with this bold hexagonal layout designed to showcase four key components of effective leadership. Each colored segment allows you to present core strategies like vision, communication, decision-making, and team empowerment. Perfect for business training, organizational development, or executive briefings. Fully customizable in PowerPoint, Keynote, and Google Slides.


22 diapositivas
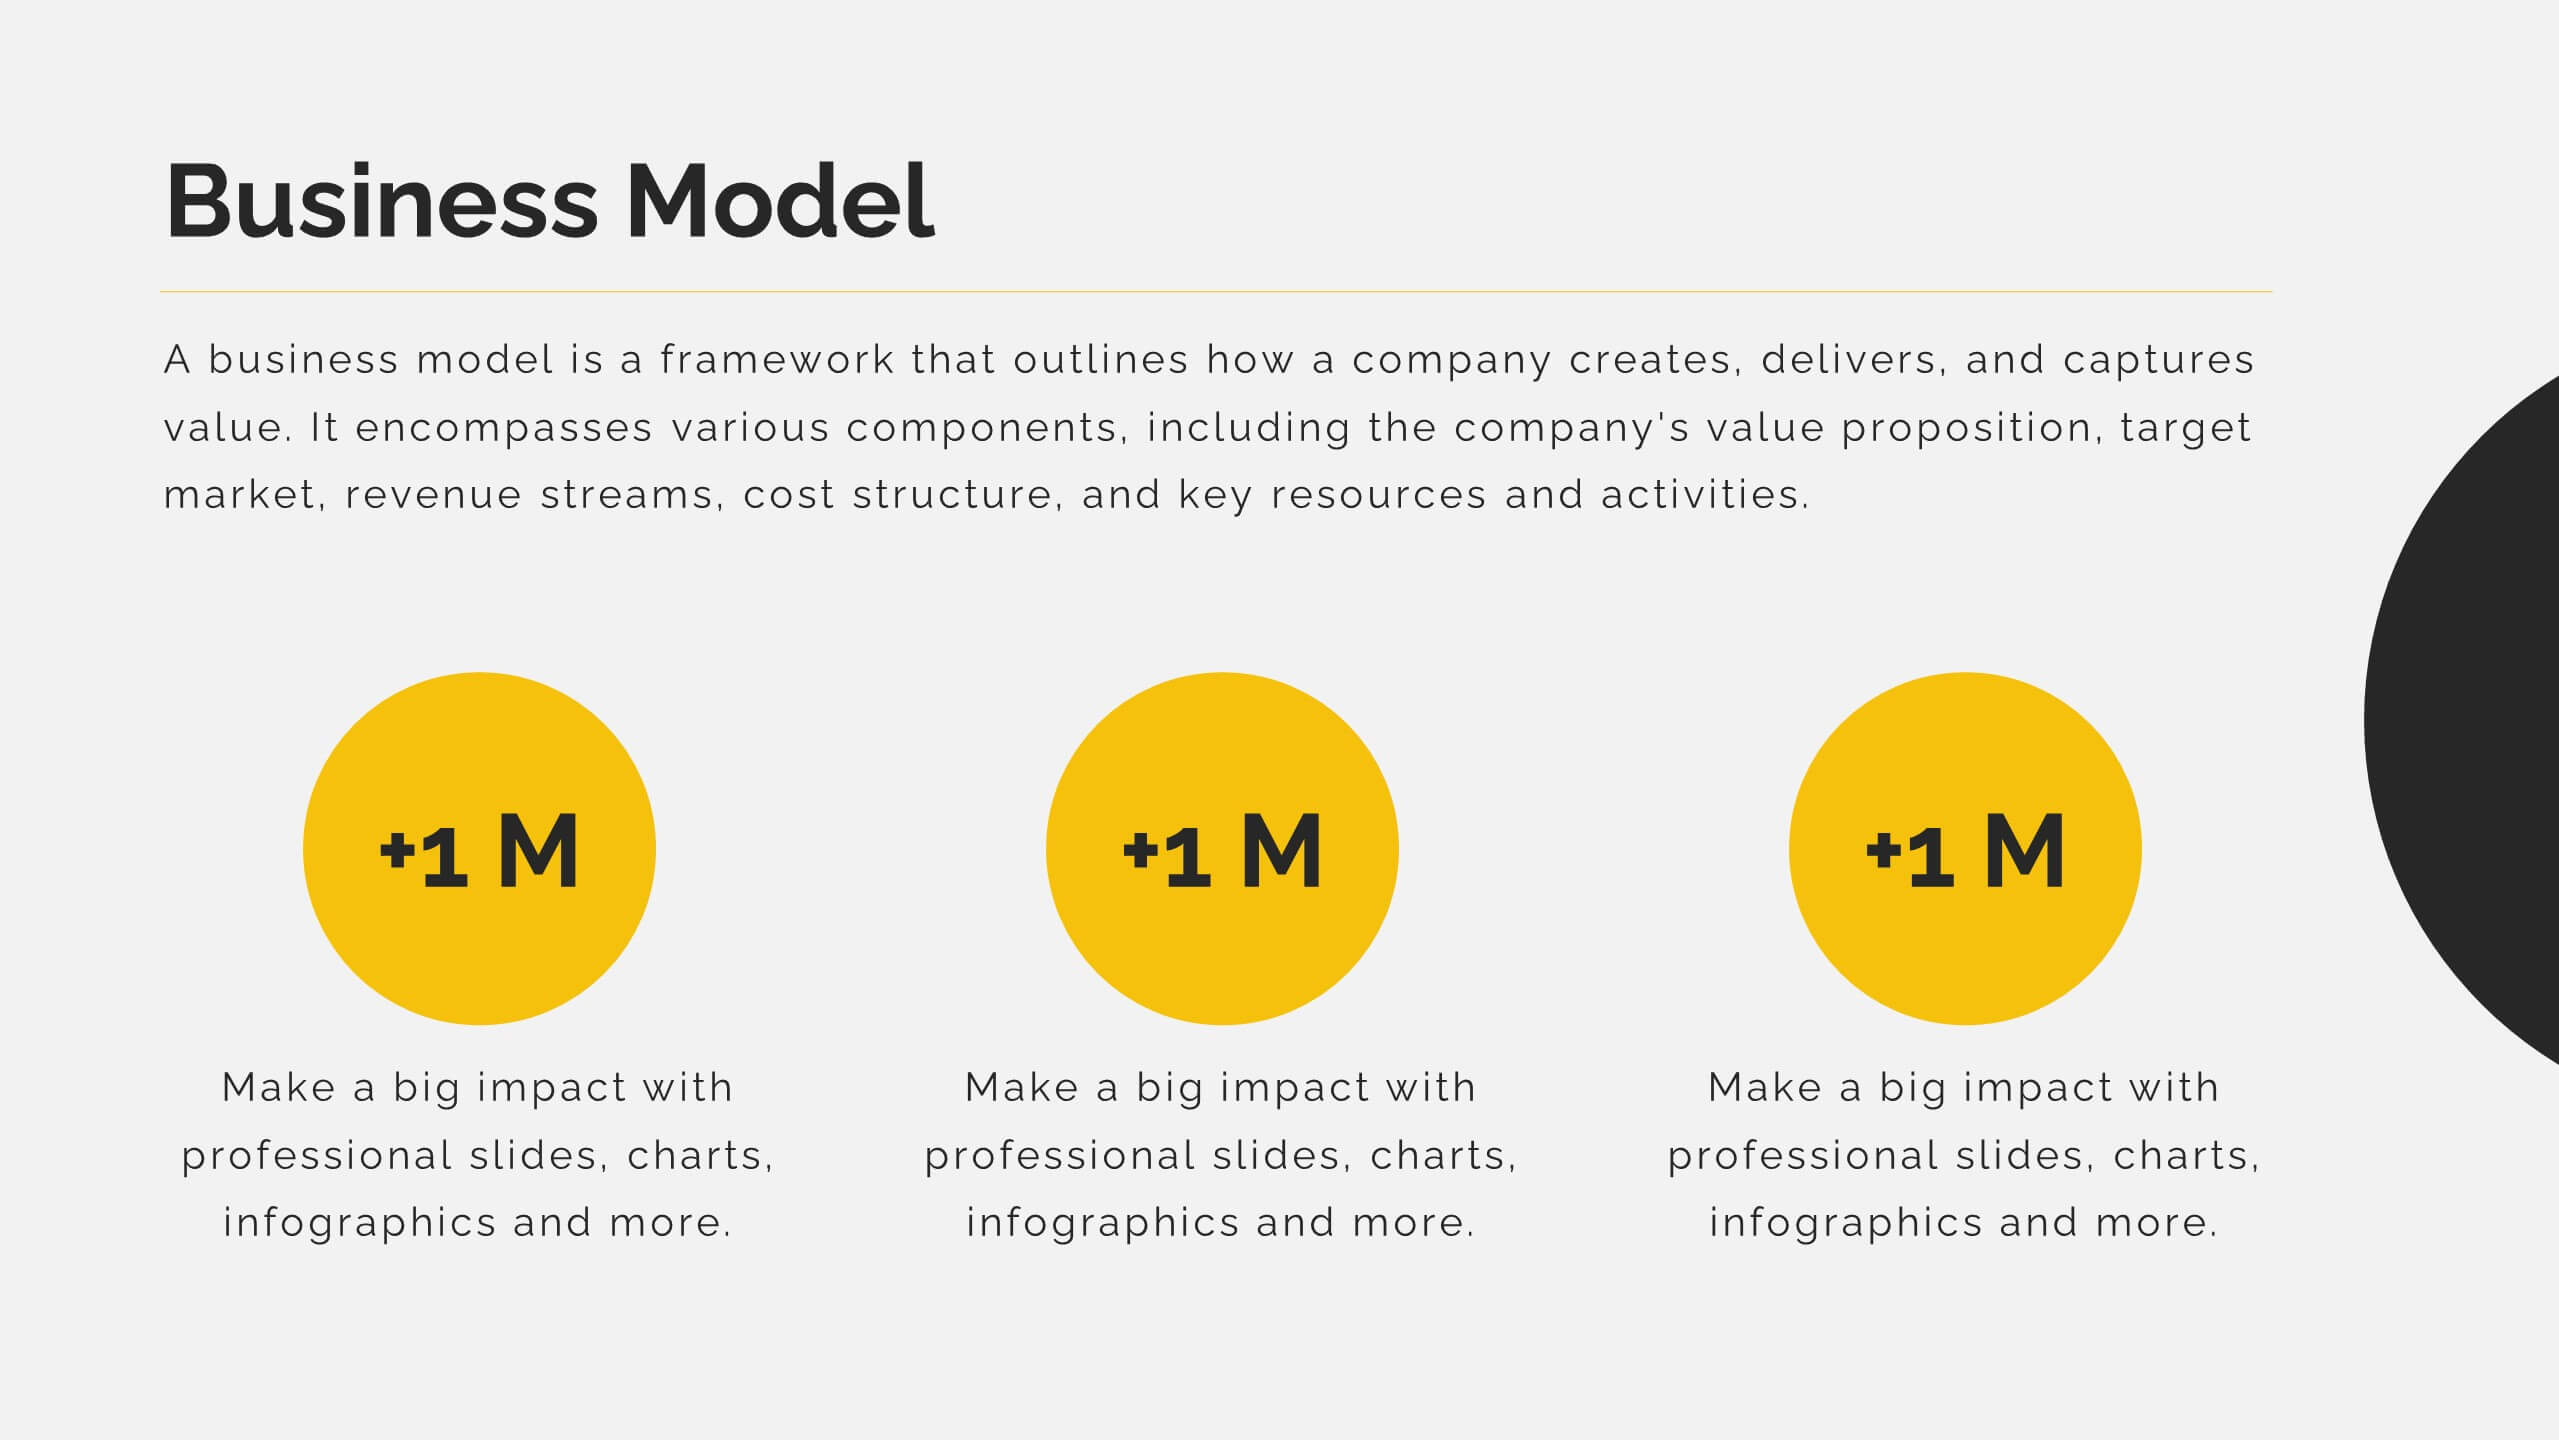
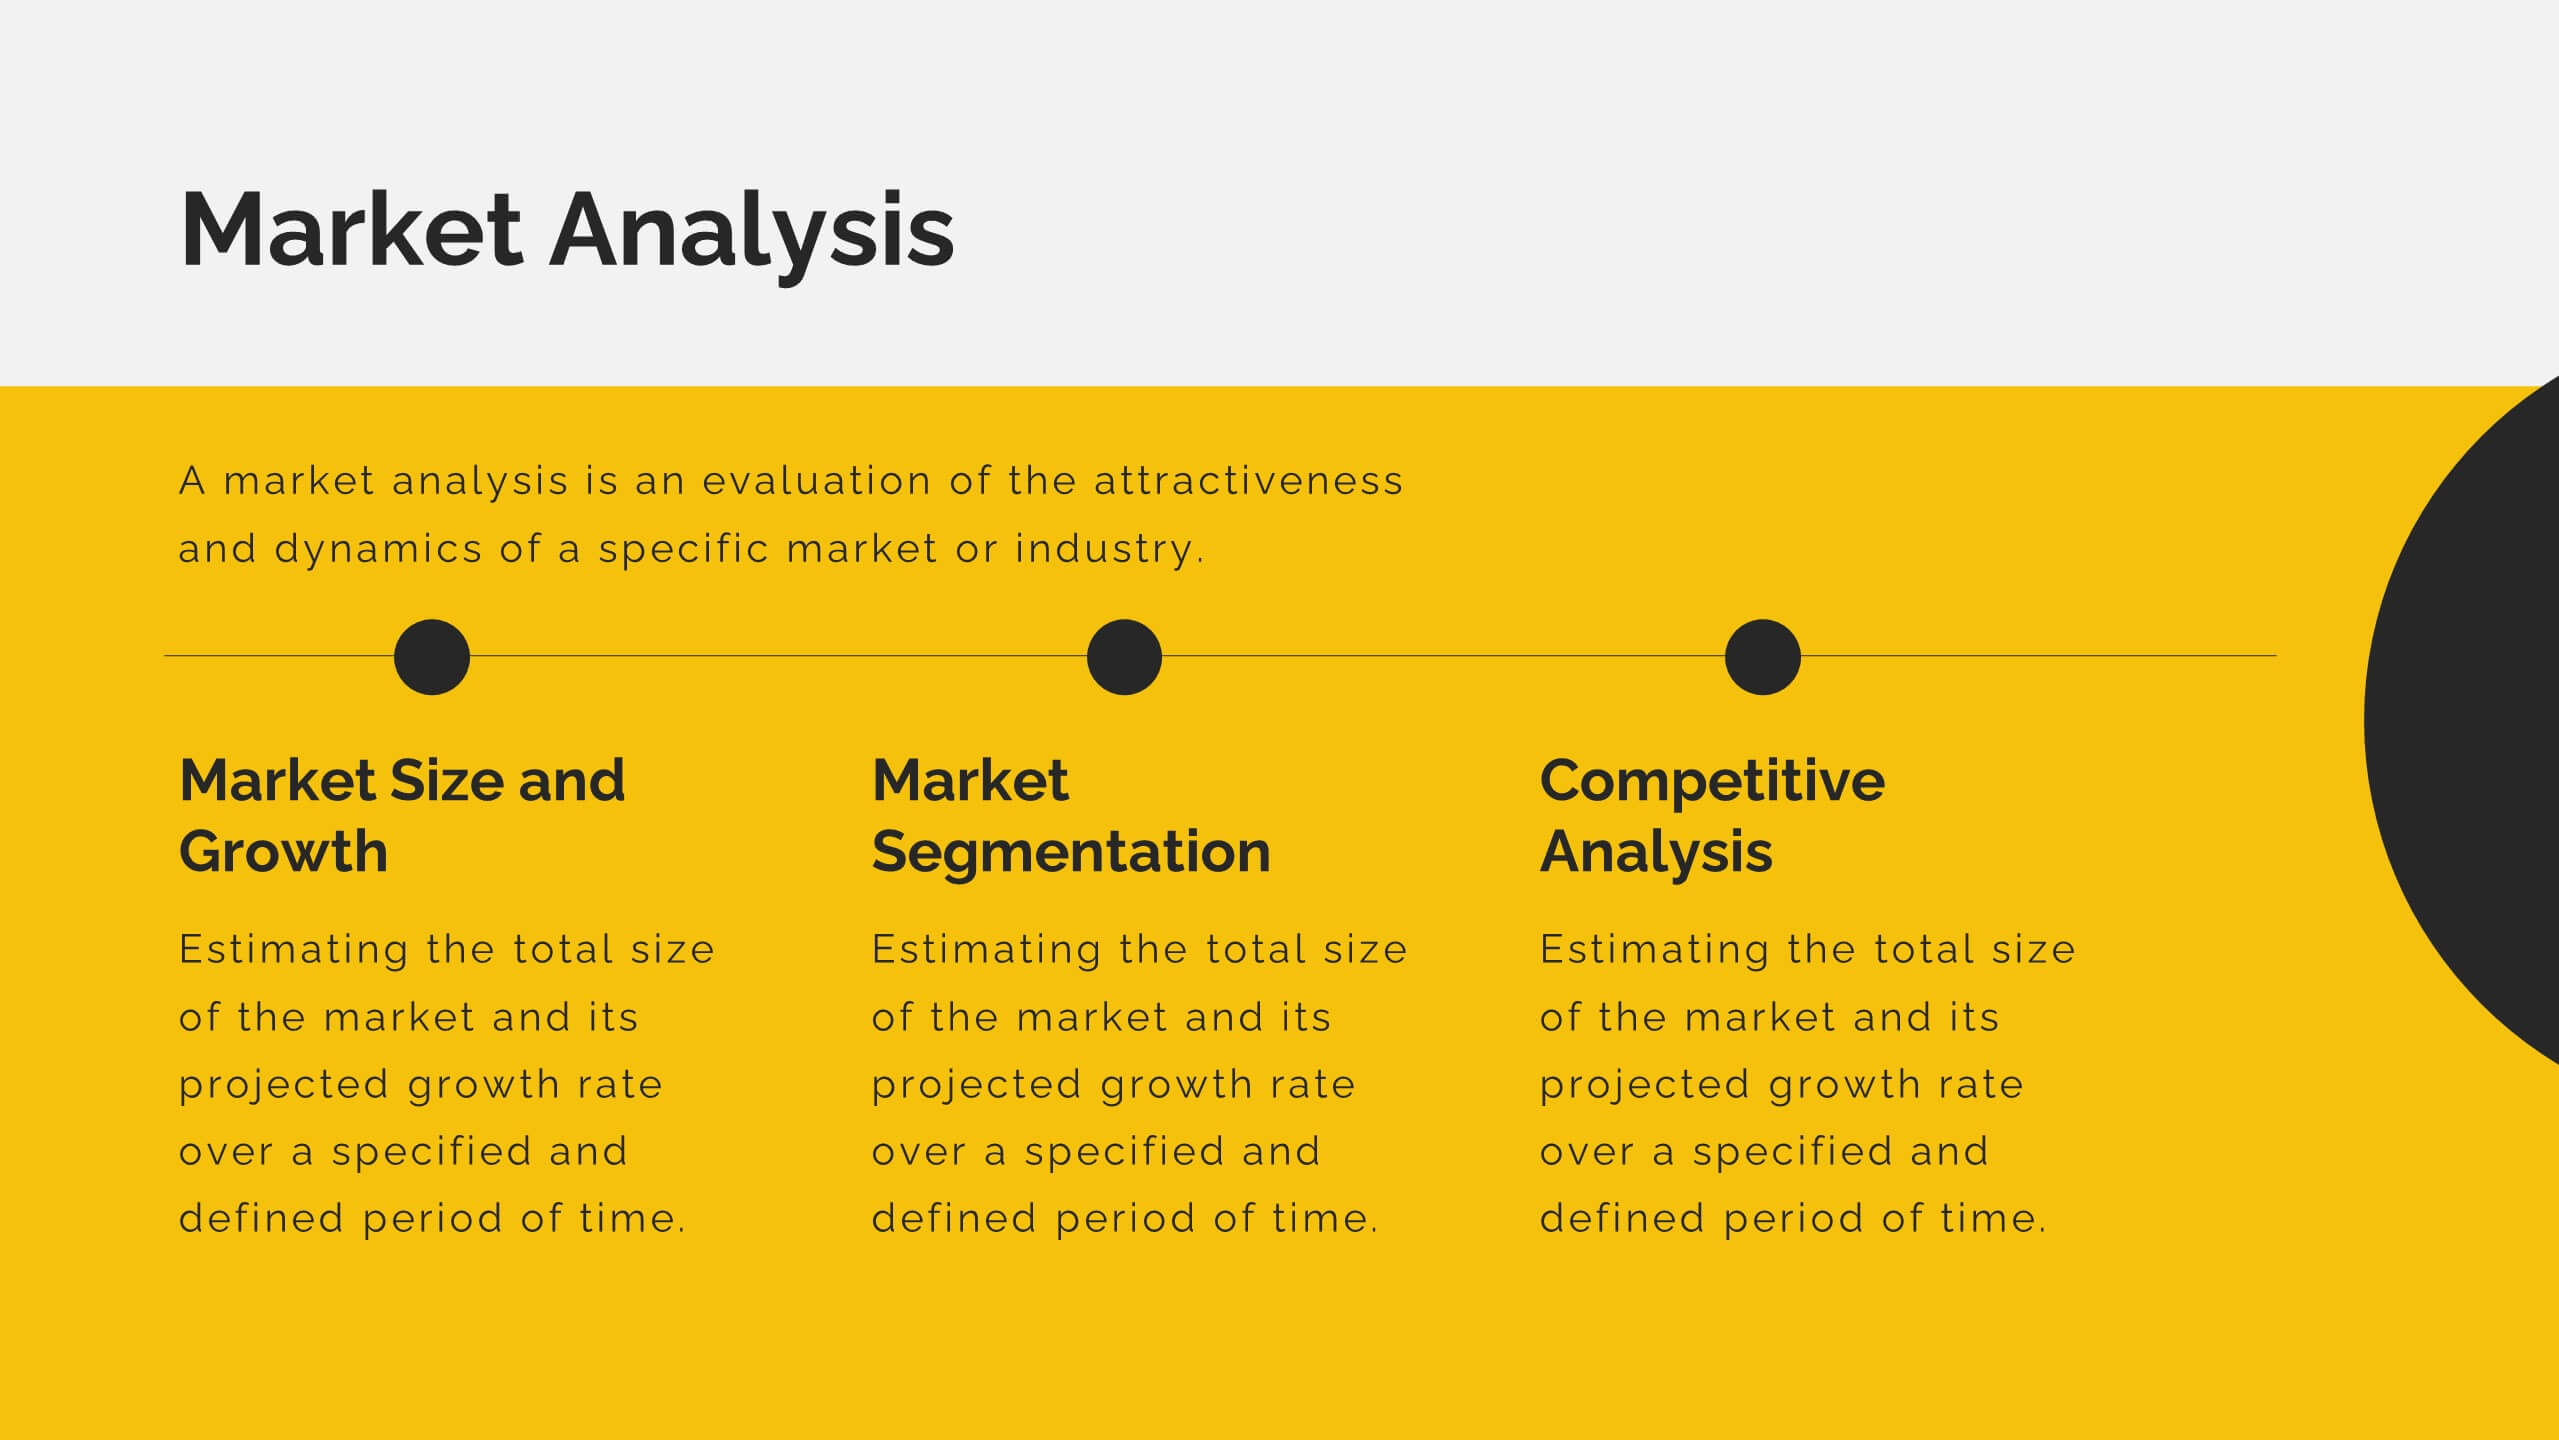
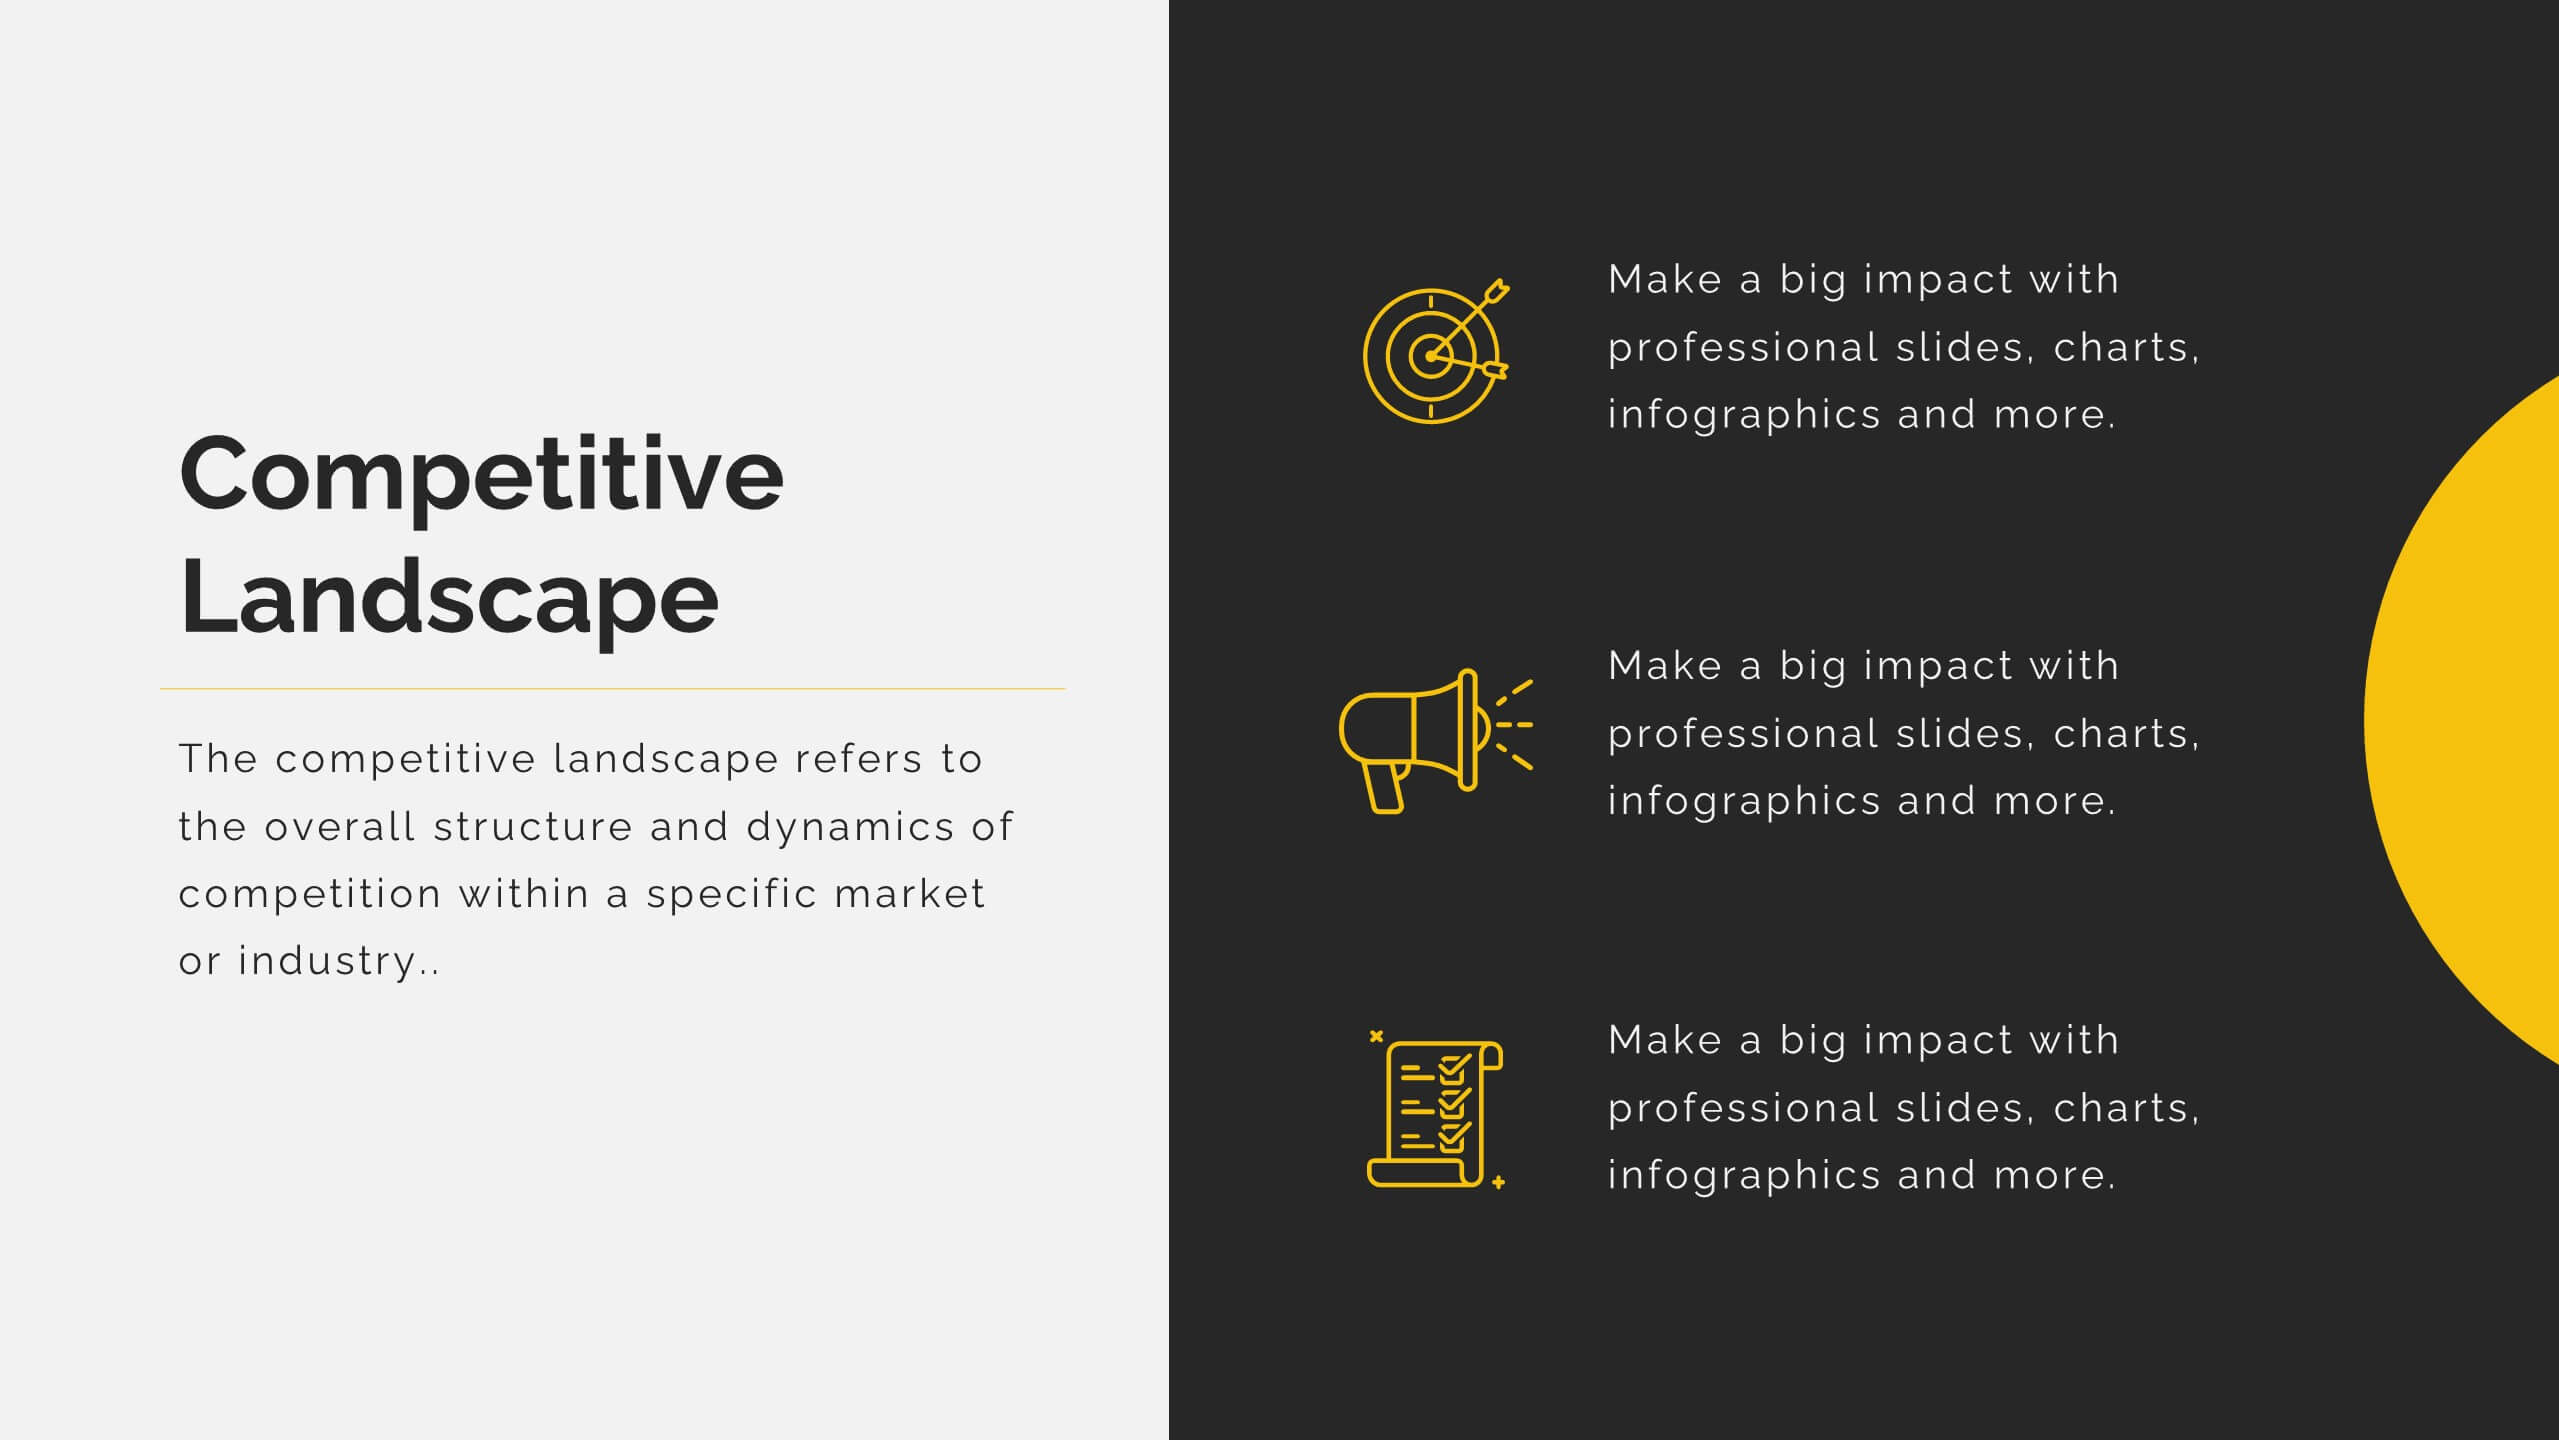
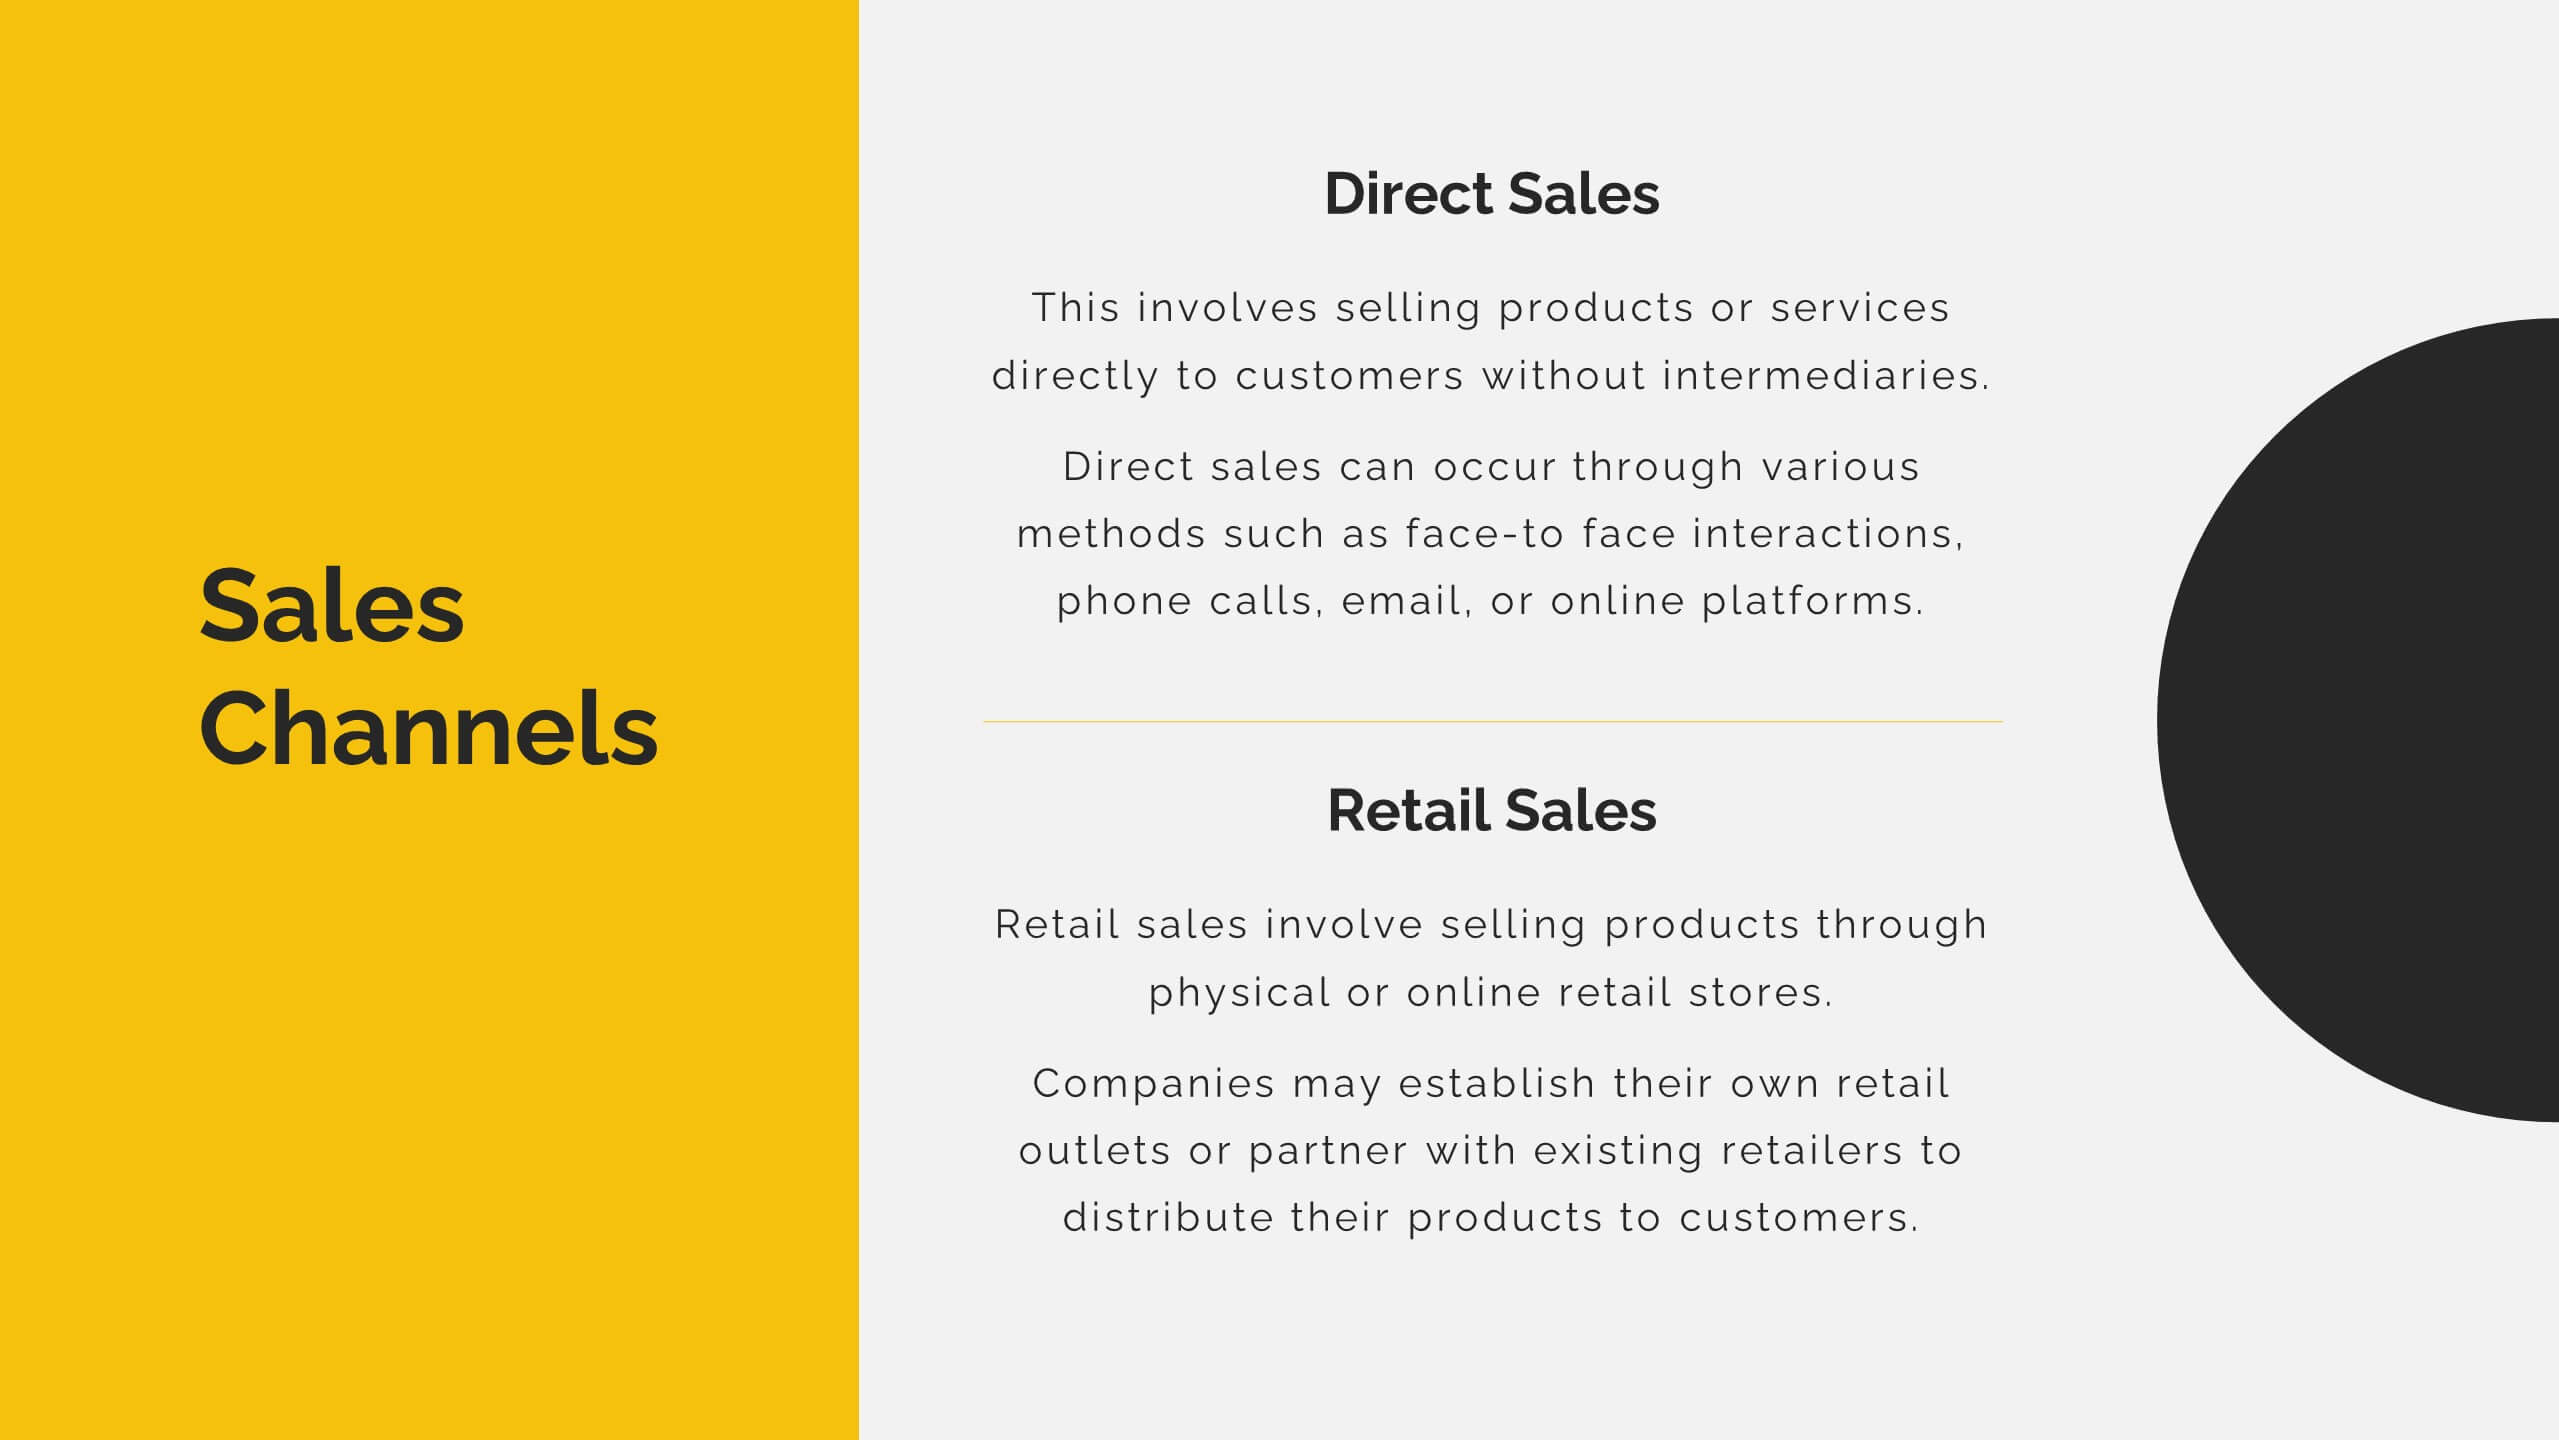
Mirage Startup Funding Proposal Presentation
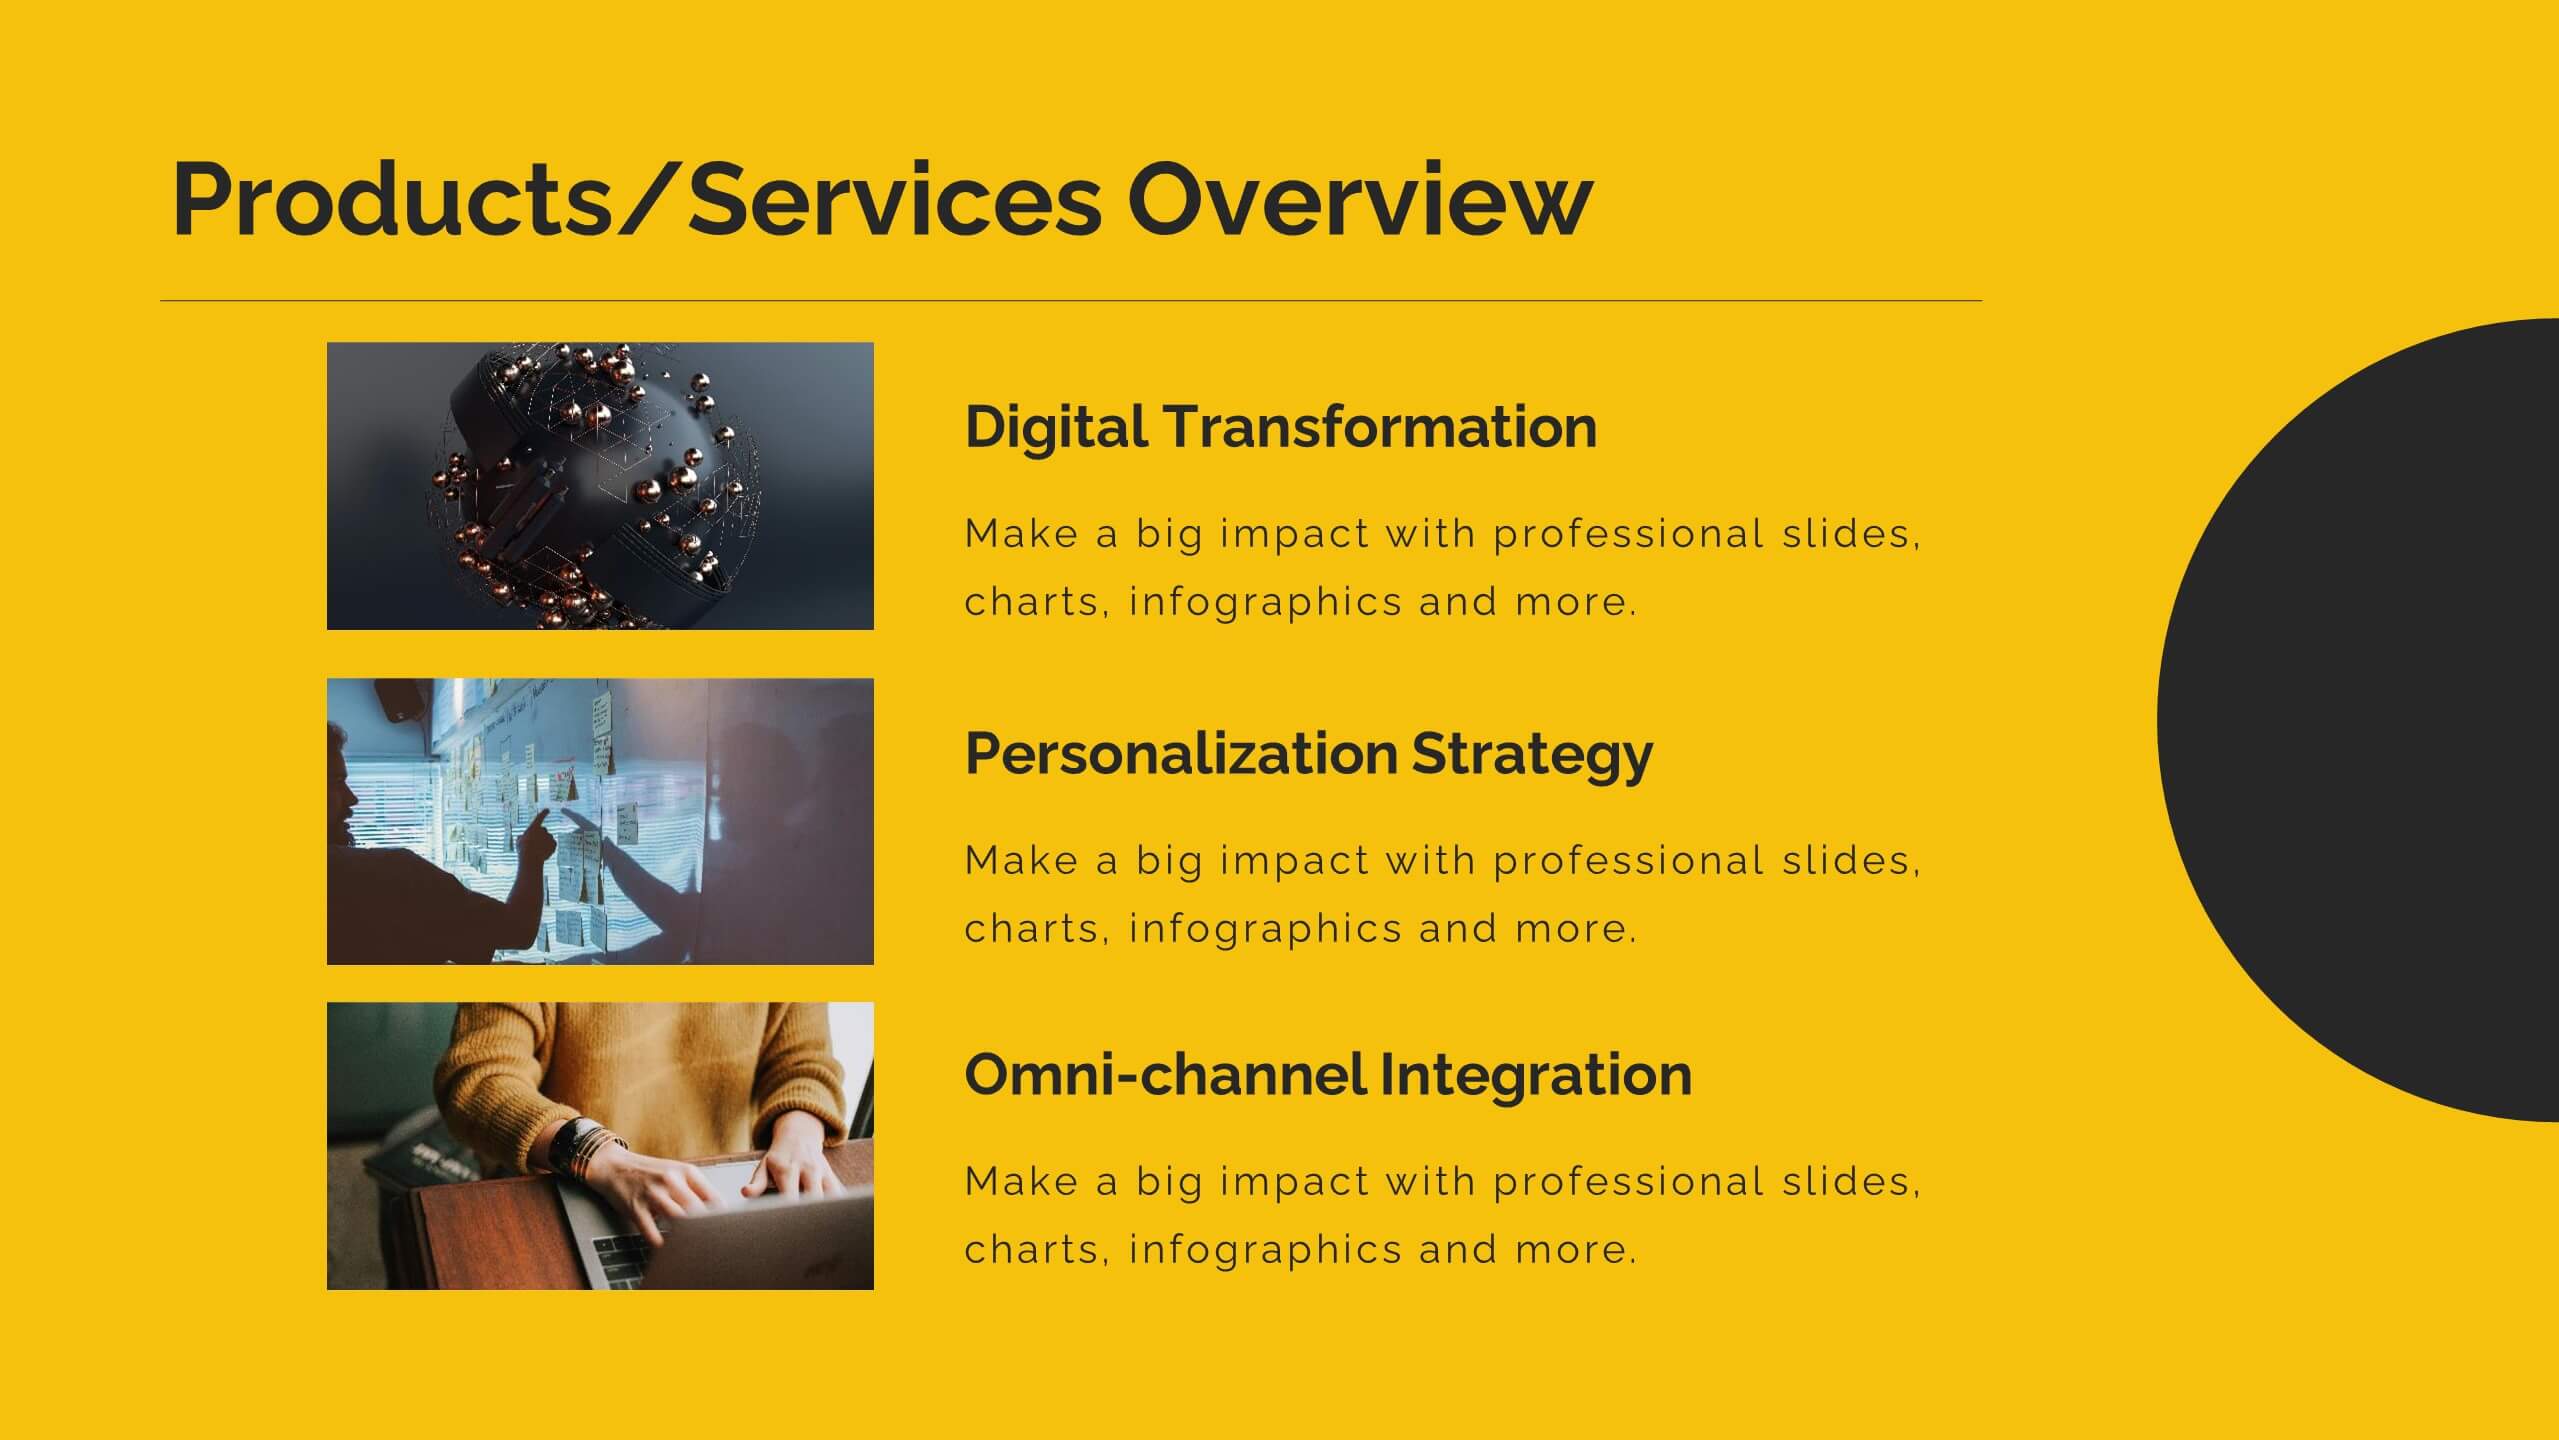
Secure funding with this dynamic startup proposal template! Perfect for presenting your mission, vision, business model, and market analysis. Ideal for entrepreneurs aiming to impress investors and stakeholders. Compatible with PowerPoint, Keynote, and Google Slides, this template ensures your proposal is clear, professional, and compelling. Achieve your startup goals today!


6 diapositivas
Budget Planning Spreadsheet Slide Presentation
Visualize your spending strategy with a clean, circular layout that turns complex financial data into simple, engaging visuals. This modern design helps you outline expenses, track categories, and showcase progress effectively in meetings or reports. Fully editable and compatible with PowerPoint, Keynote, and Google Slides for effortless customization.


5 diapositivas
Layered Business Pyramid Framework
Visualize business hierarchy and strategic layers with the Layered Business Pyramid Framework Presentation. This editable slide features a five-tier pyramid diagram aligned with corresponding text sections, ideal for showcasing organizational structures, workflow levels, or growth stages. Each layer is color-coded for clarity and impact, making your insights easy to digest. Fully compatible with PowerPoint, Keynote, and Google Slides.


6 diapositivas
Economic Pyramid Infographic
Showcase economic structures with our Economic Pyramid Infographic, compatible with Powerpoint, Google Slides, and Keynote. This template is designed for economists, educators, and business professionals, providing a visual hierarchy of economic indicators or demographics. Each level of the pyramid represents a different segment, such as income brackets, consumer classes, or resource distribution. It's an ideal tool for presentations that require a clear depiction of economic stratification or market segmentation. Customizable and easy to understand, this infographic helps simplify complex economic data into digestible visual tiers for any audience.