


Características


¿Tienes alguna pregunta?
Recomendar


12 diapositivas
Attention Interest Desire Actions Presentation
Spark curiosity from the very first slide with a bold, layered visual that turns complex ideas into a clear, memorable journey. This presentation walks viewers through each stage of your message, helping you build momentum and guide decisions with ease. Fully editable and compatible with PowerPoint, Keynote, and Google Slides.


5 diapositivas
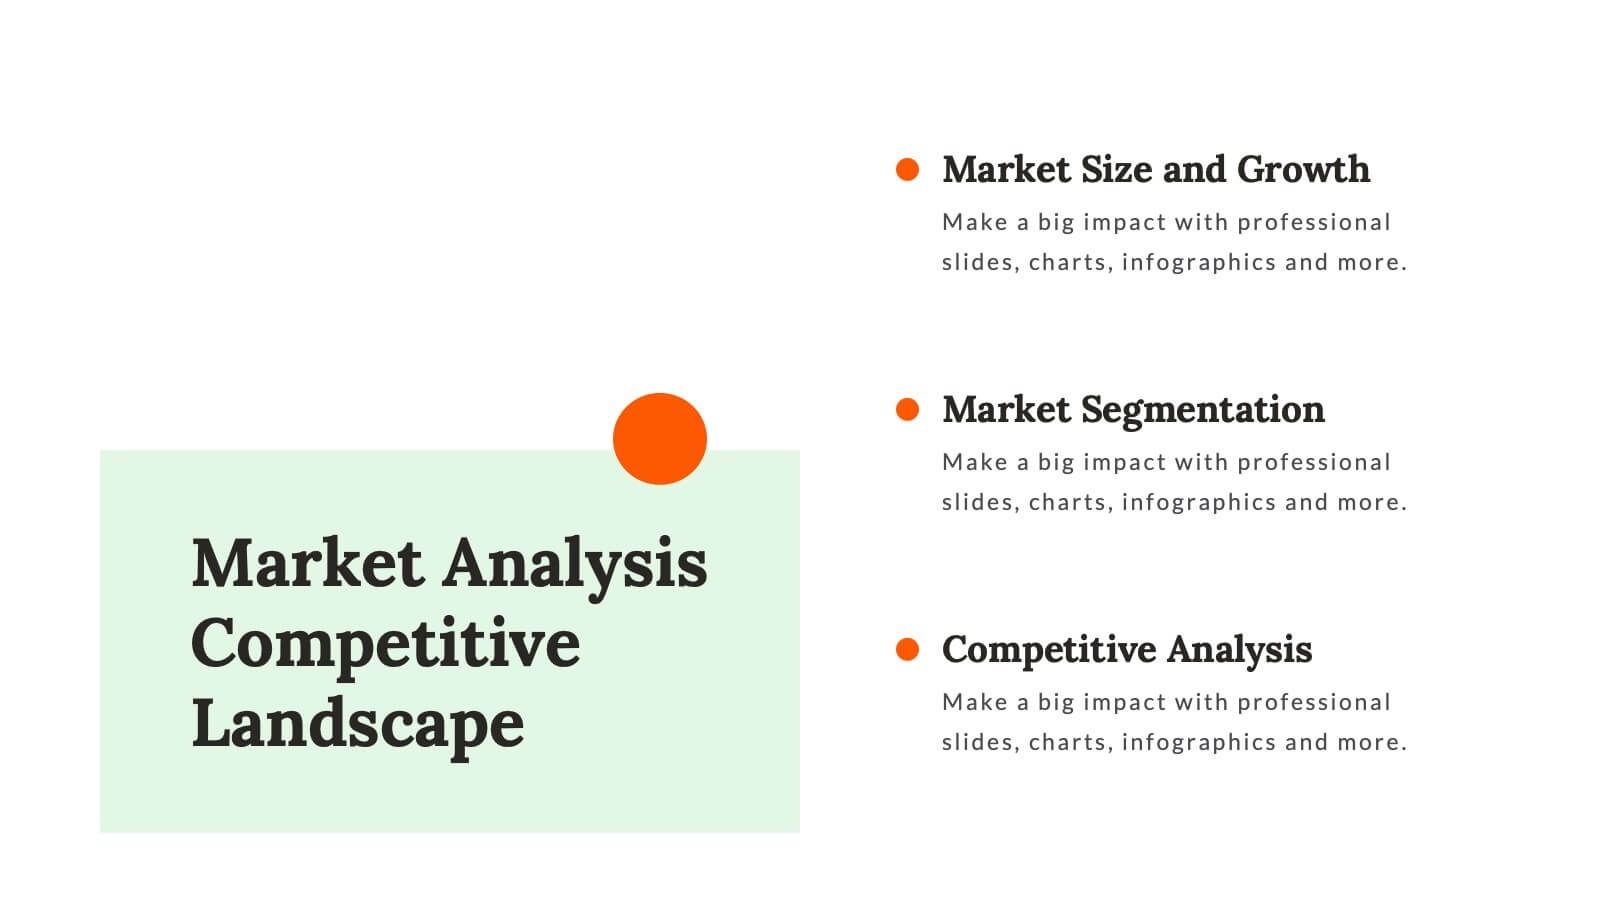
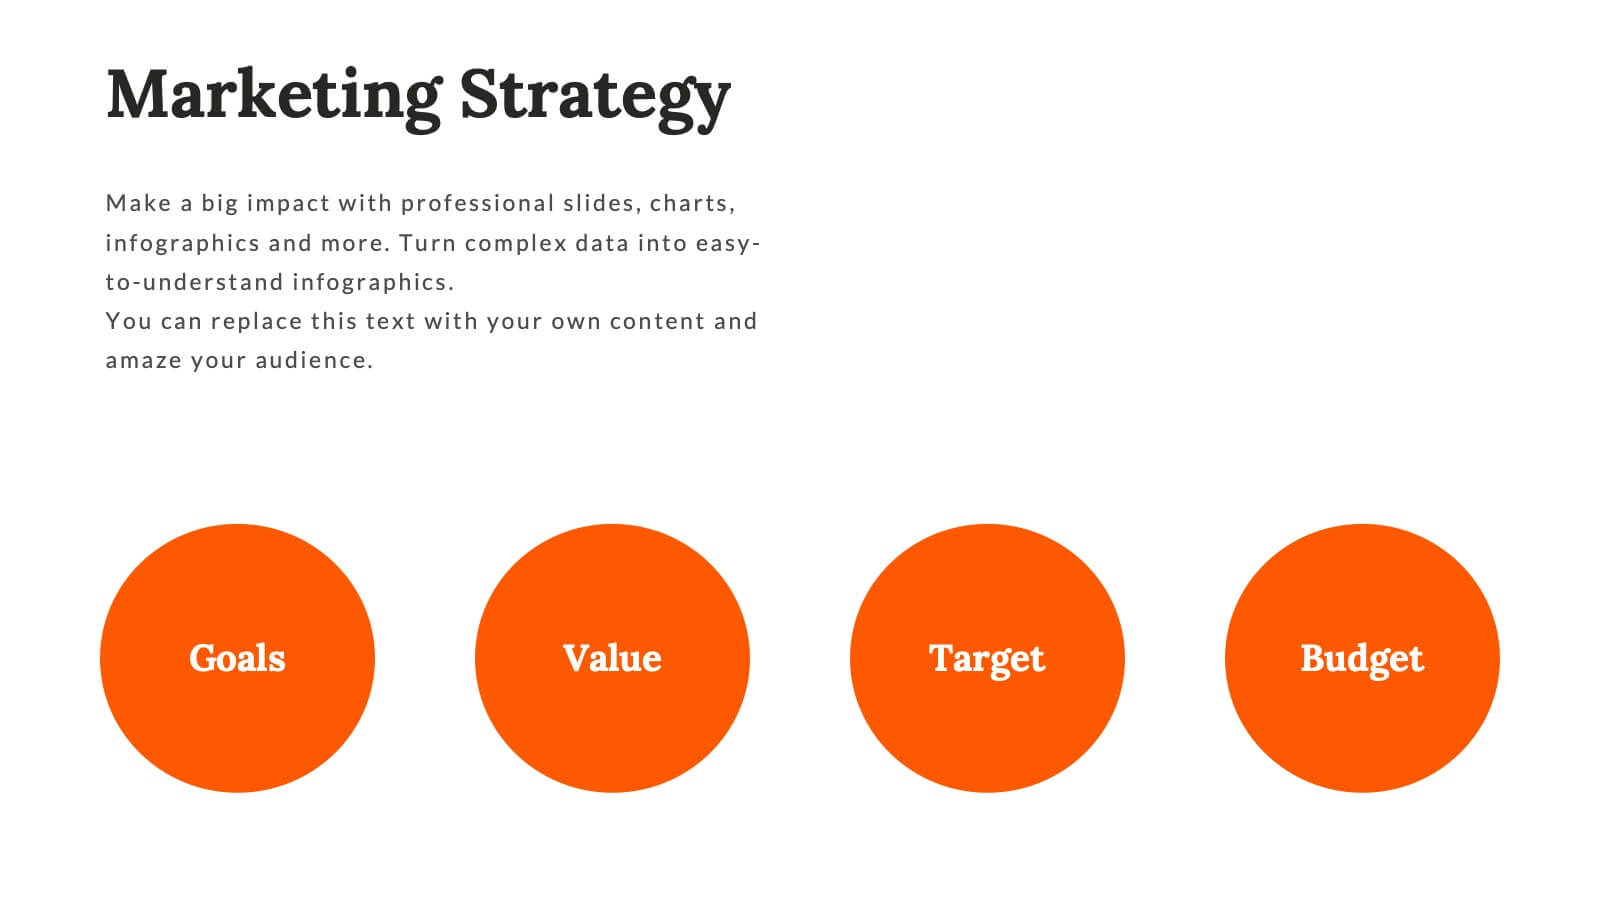
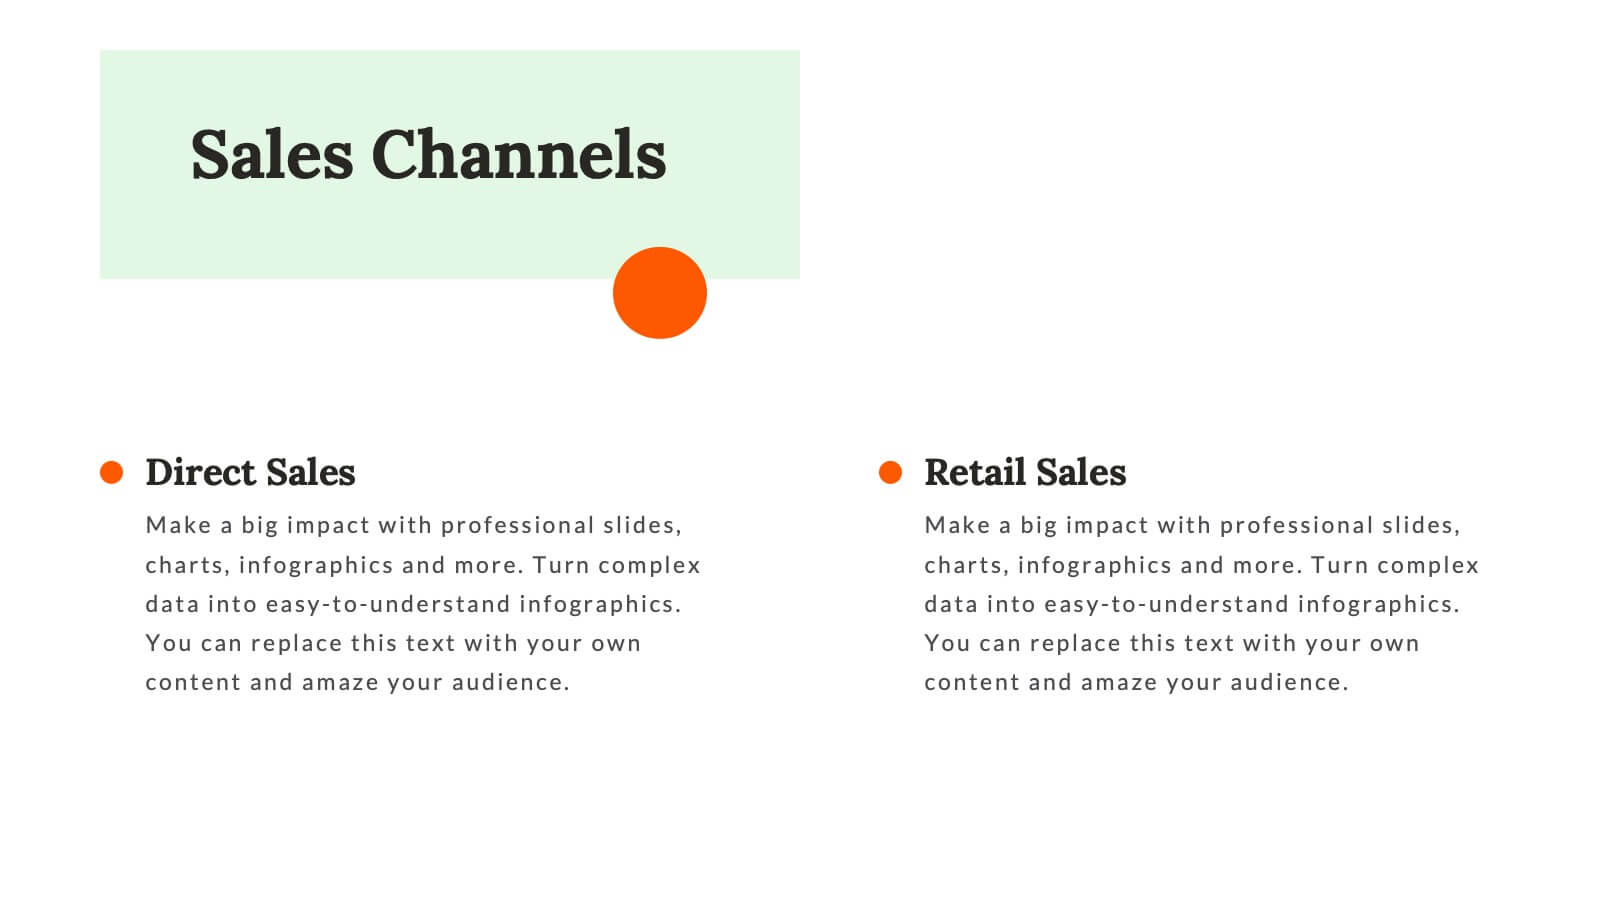
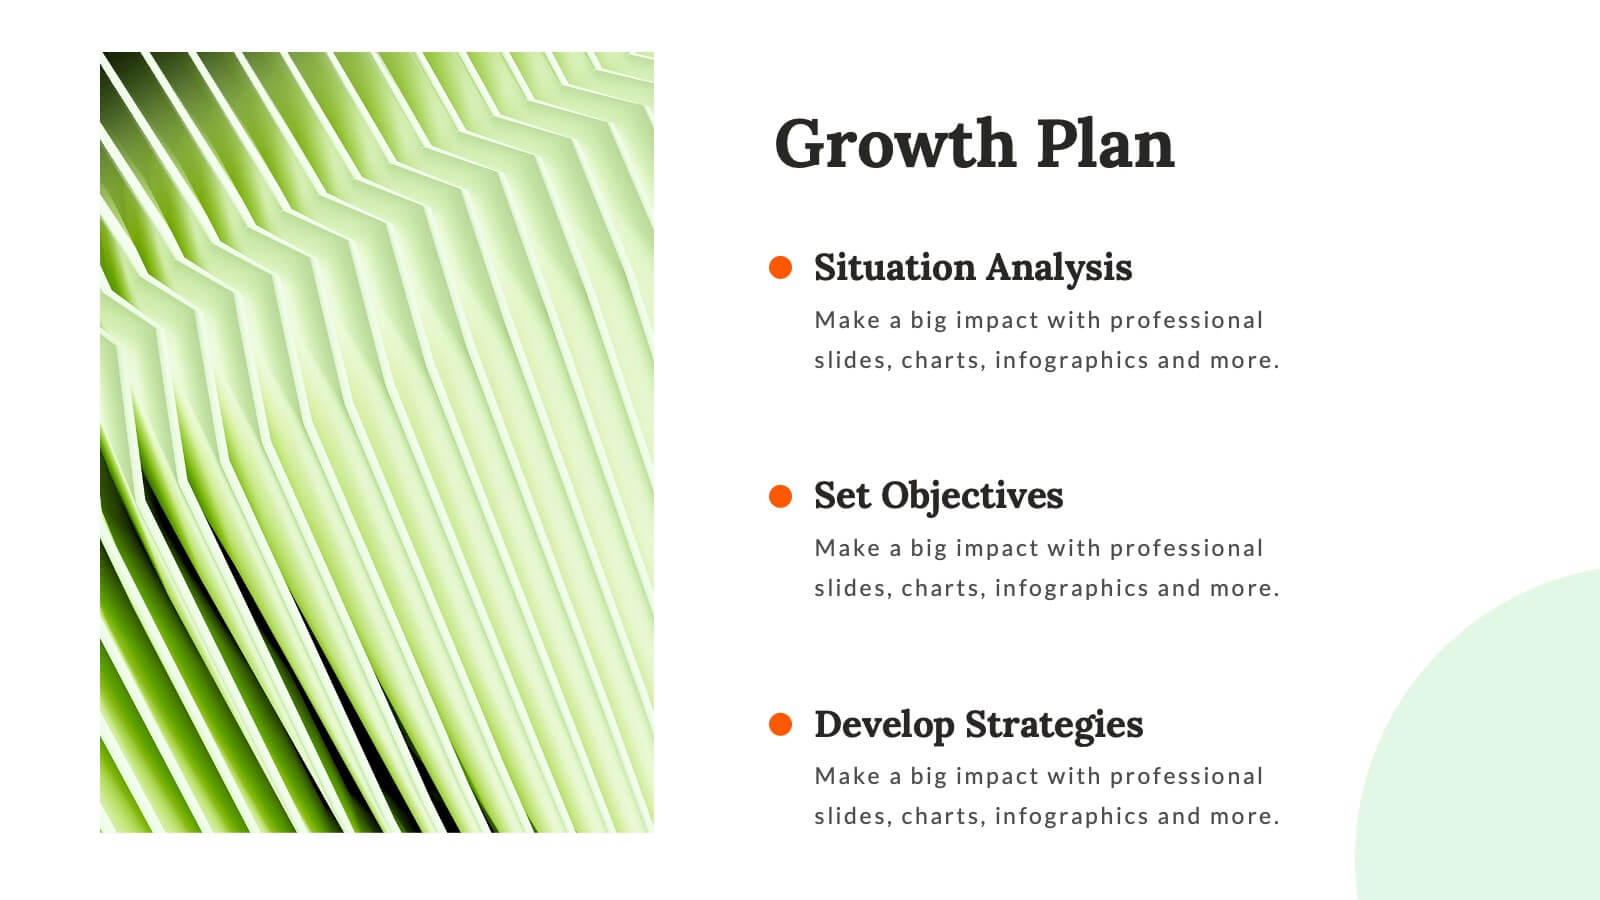
Professional Business Plans Presentation
Bring your ideas to life with a clean, structured slide that simplifies complex planning into an easy-to-follow visual. This presentation highlights key business priorities, long-term strategy, and action steps in a modern layered format that’s clear and practical for any audience. Fully compatible with PowerPoint, Keynote, and Google Slides.


4 diapositivas
Enterprise IT Architecture Presentation
Visualize the foundation of your organization’s technology with this sleek, layered presentation. Designed to showcase system hierarchies, integration processes, and strategic frameworks, it simplifies complex IT concepts through a clear, structured layout. Fully customizable and compatible with PowerPoint, Keynote, and Google Slides for effortless professional presentations.


5 diapositivas
Group Dynamics and Work Roles Presentation
Visualize team roles and responsibilities clearly with the Group Dynamics and Work Roles Presentation. This horizontal timeline layout highlights individual contributions and their position in the workflow, making it ideal for team structure, leadership roles, or project stages. Fully editable in Canva, PowerPoint, or Google Slides for smooth collaboration.


26 diapositivas
Premium Finance for Daily Life Presentation
Introducing our Premium Finance for Daily Life Presentation template this is a comprehensive and informative tool to educate individuals about the concept of premium finance and its relevance in everyday life. This presentation aims to provide valuable insights on how premium finance can be utilized to manage and optimize personal finances. The slides are fully customizable and compatible with PowerPoint, Keynote, and Google Slides. It features a professional design with clean layouts, visually appealing graphics, and icons related to finance and daily life activities. The presentation can cover various topics related to premium finance.


5 diapositivas
Logistics Flow Diagram Presentation
Turn complex processes into a clear visual journey with this dynamic presentation design. Ideal for illustrating workflows, delivery systems, or operational stages, it helps simplify how goods or data move from start to finish. Fully editable and compatible with PowerPoint, Keynote, and Google Slides for seamless customization and presentation.


20 diapositivas
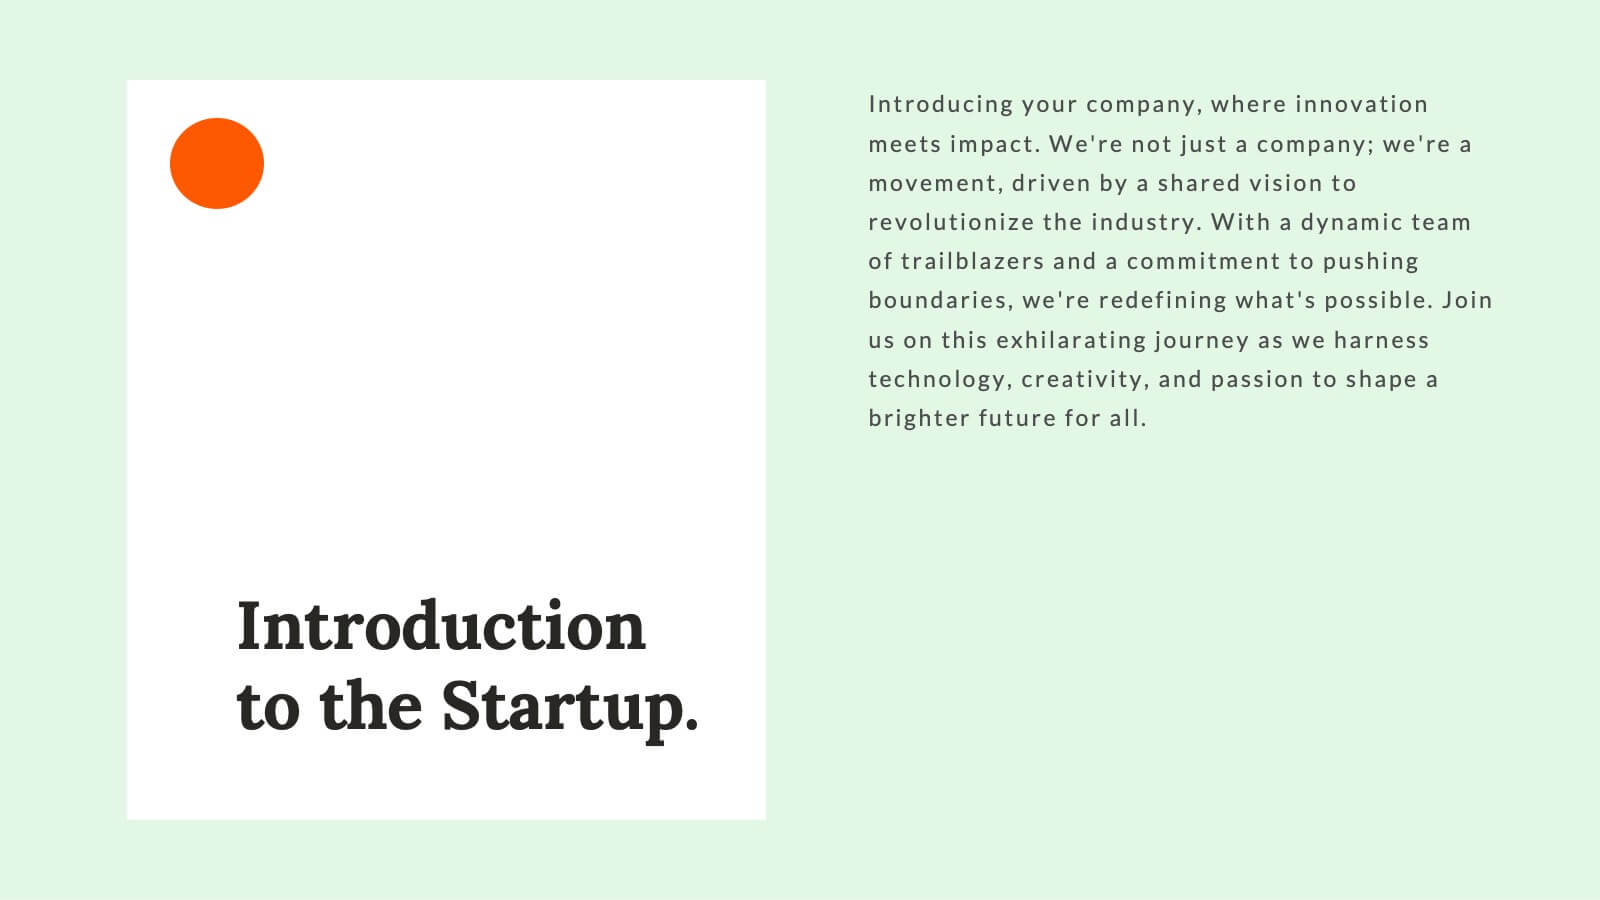
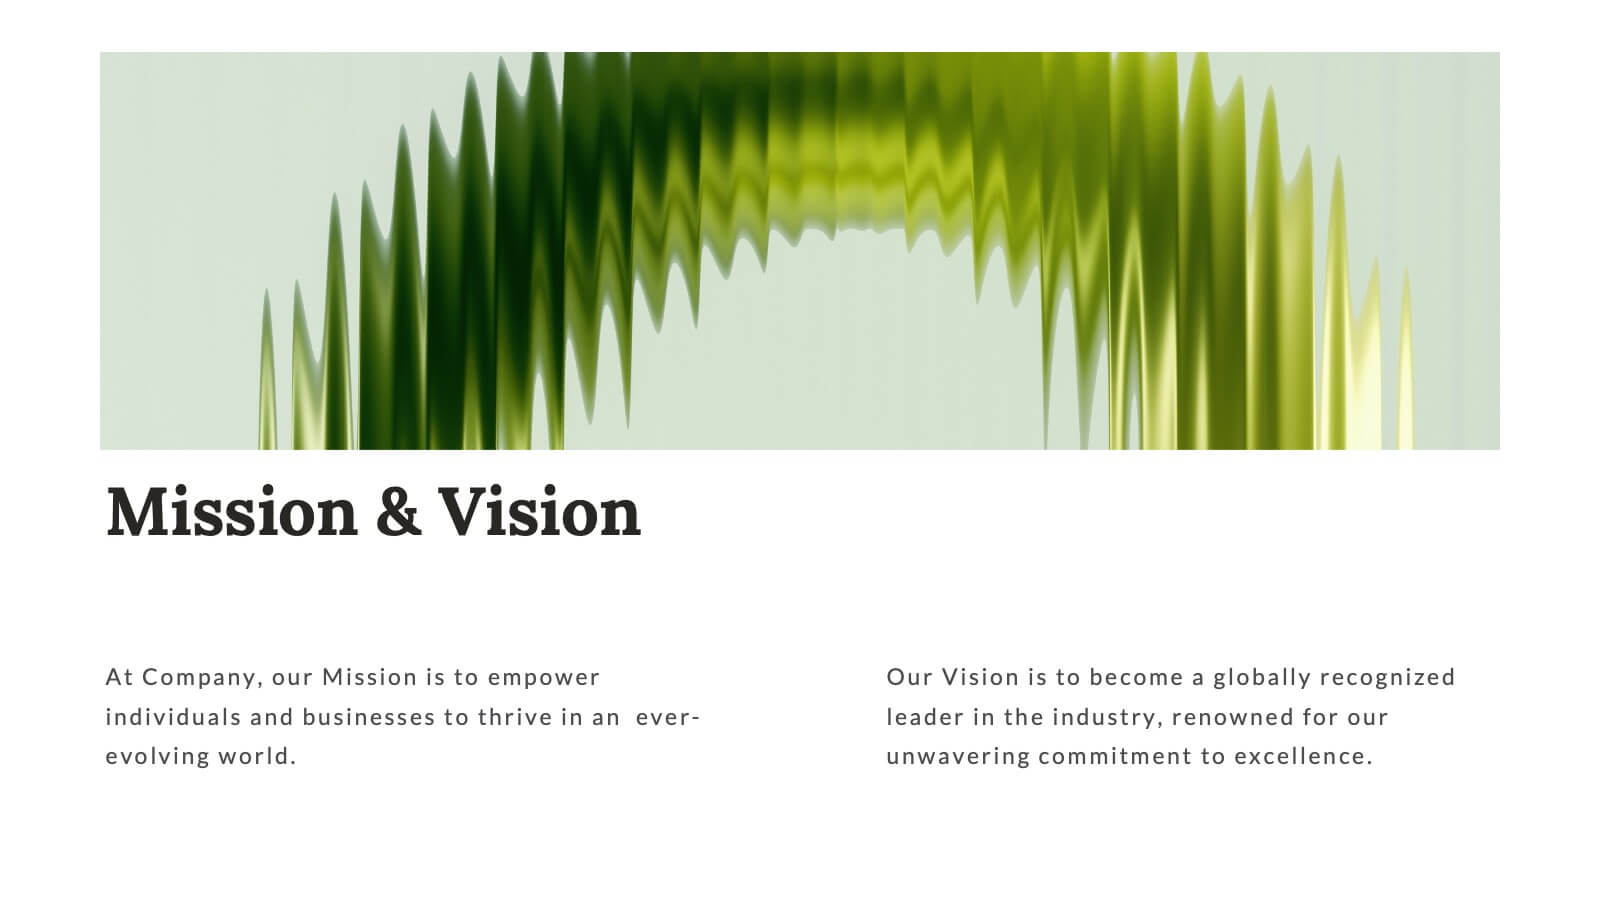
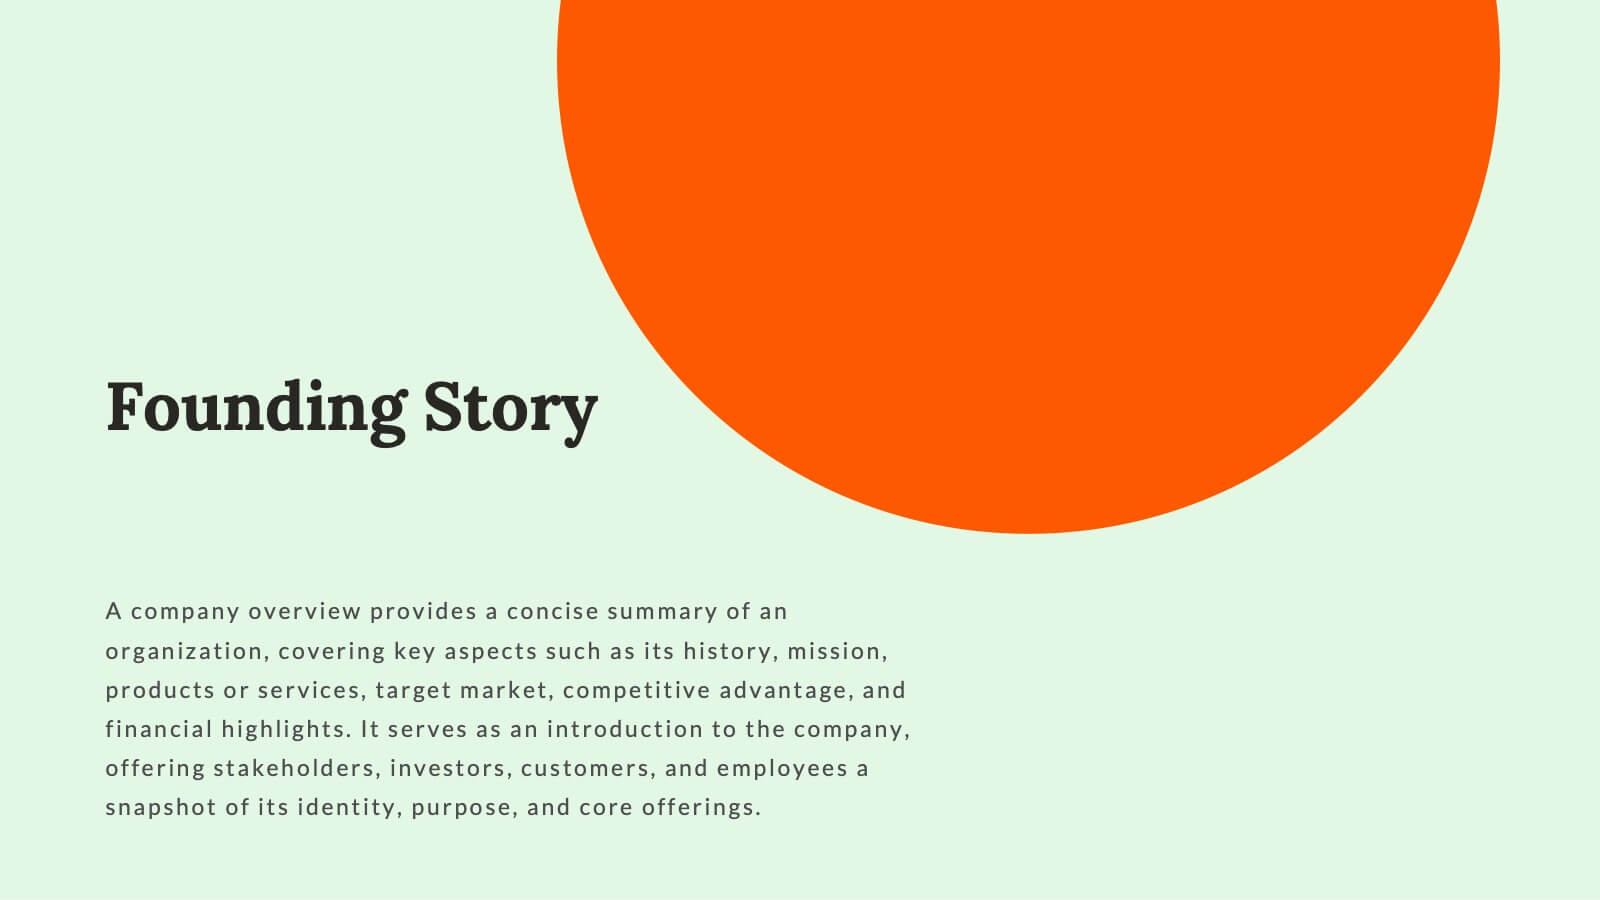
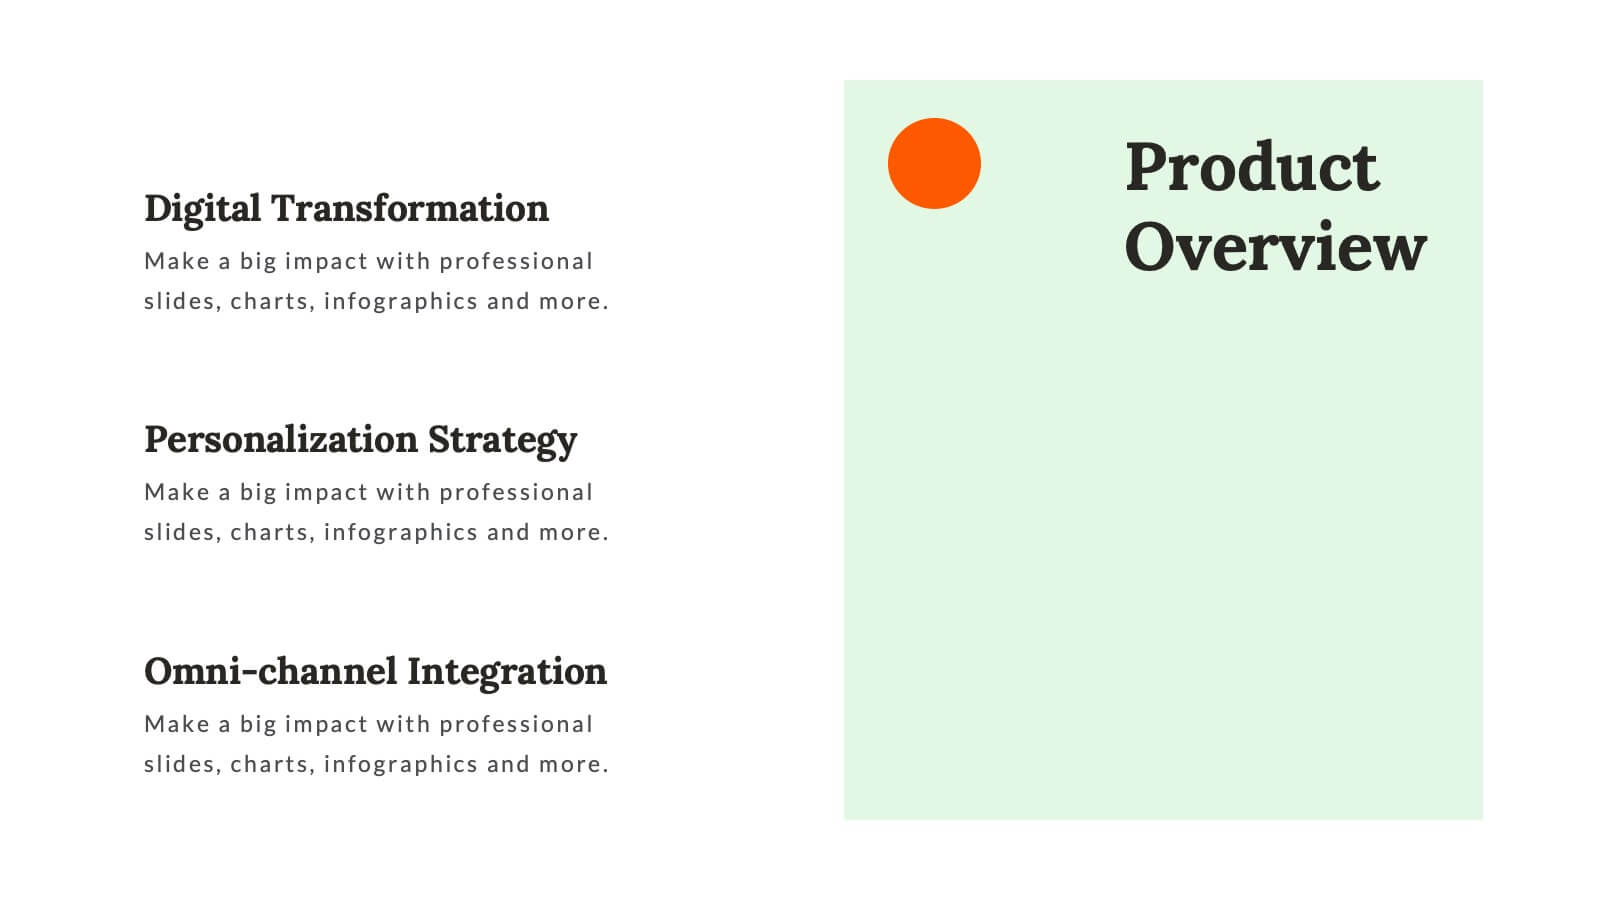
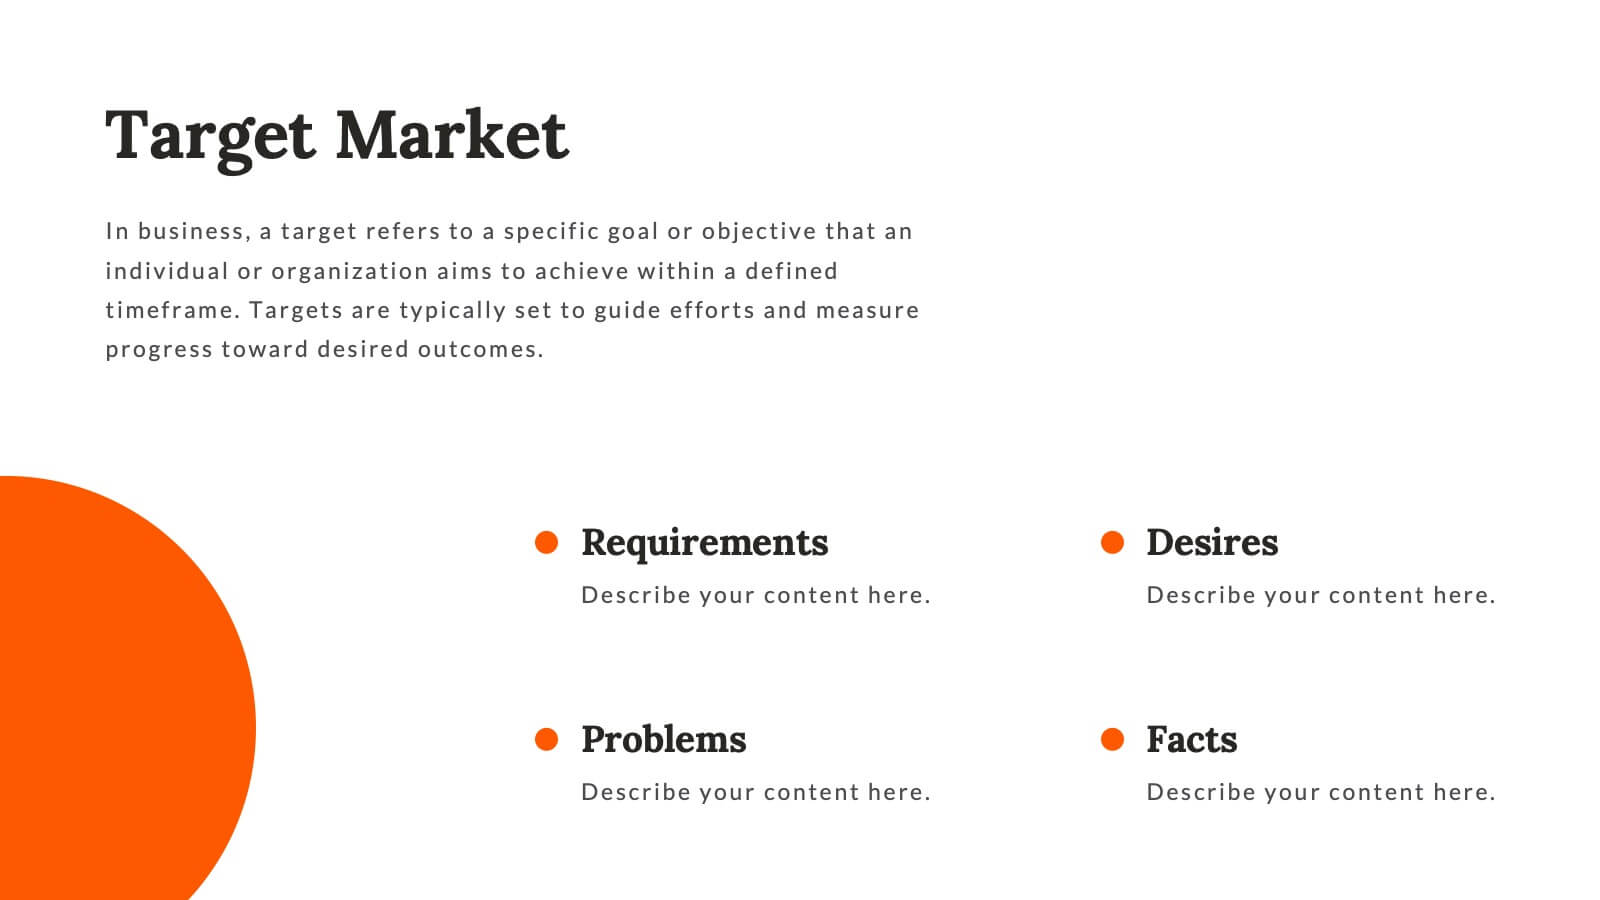
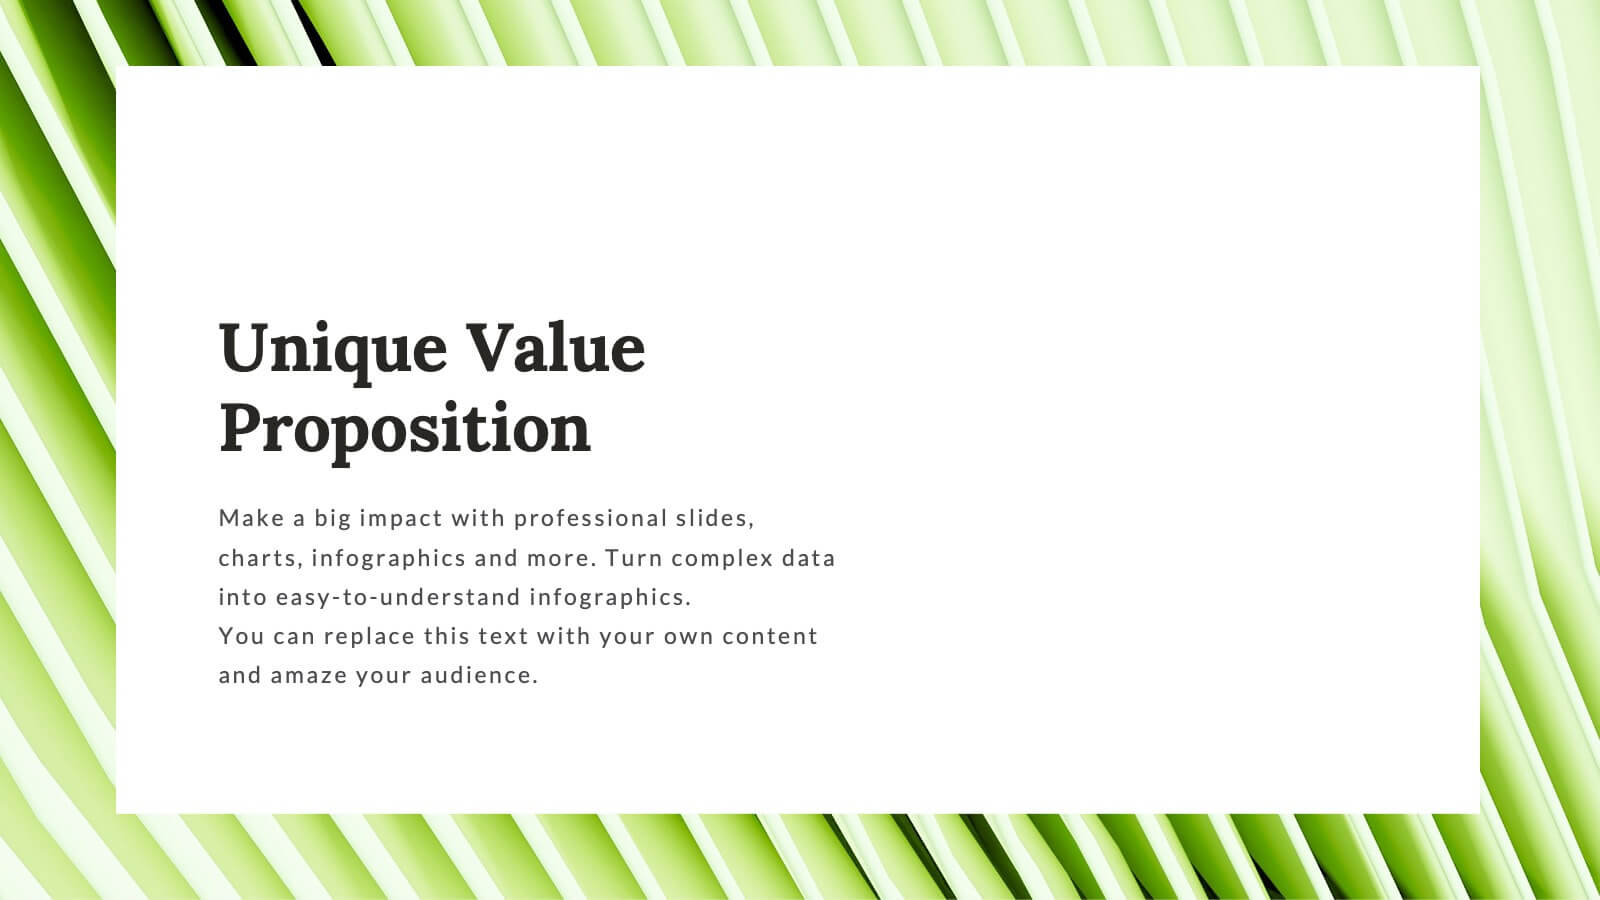
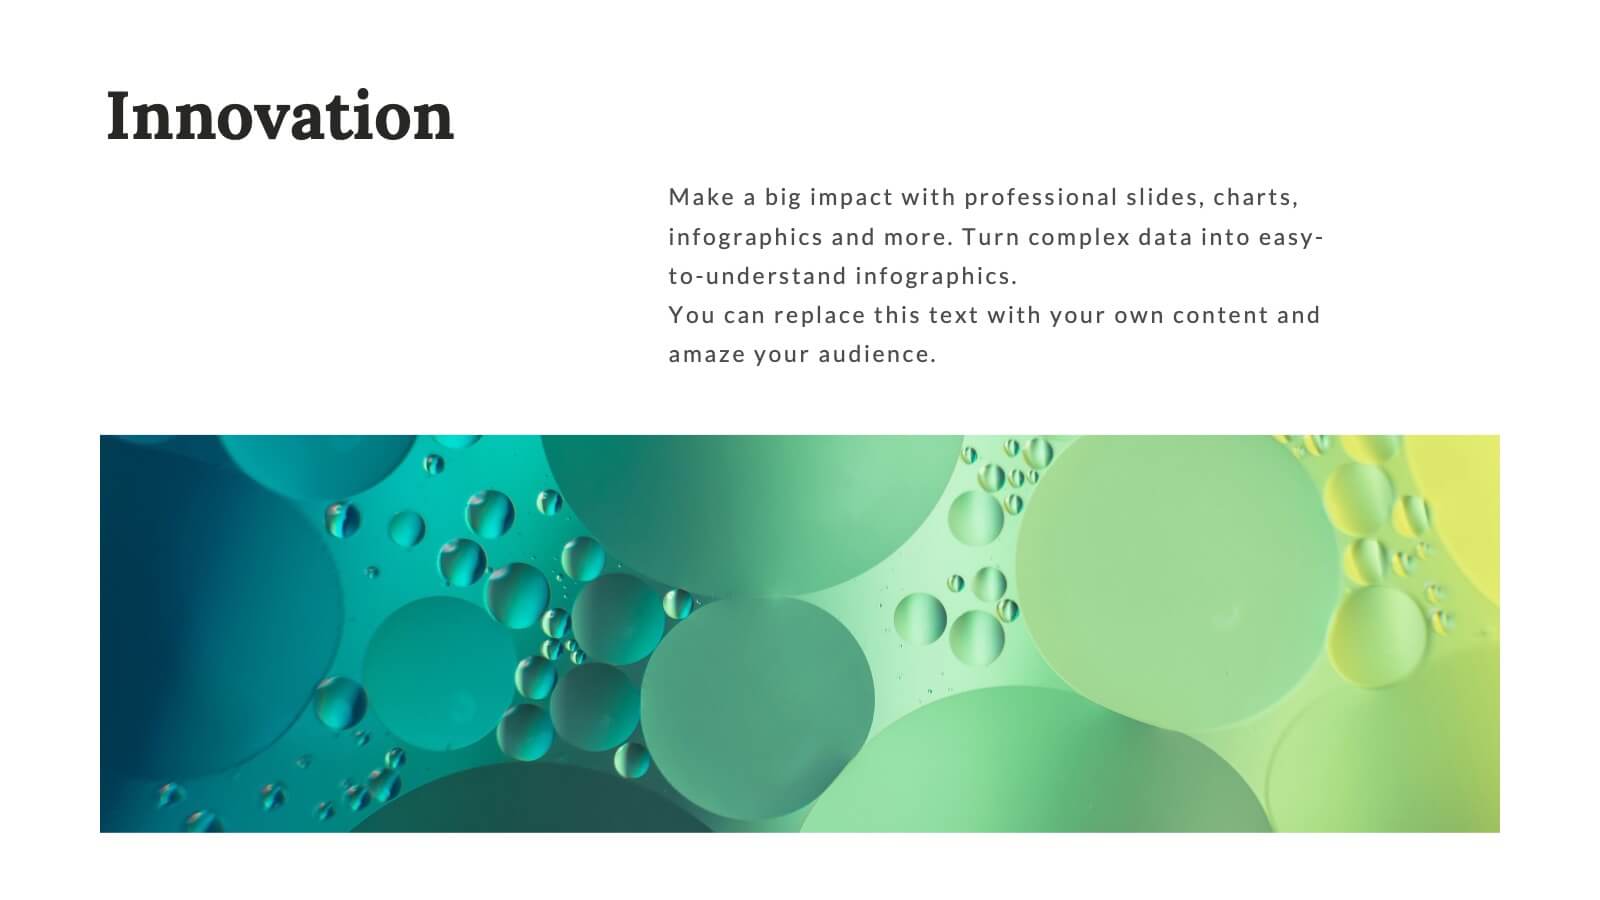
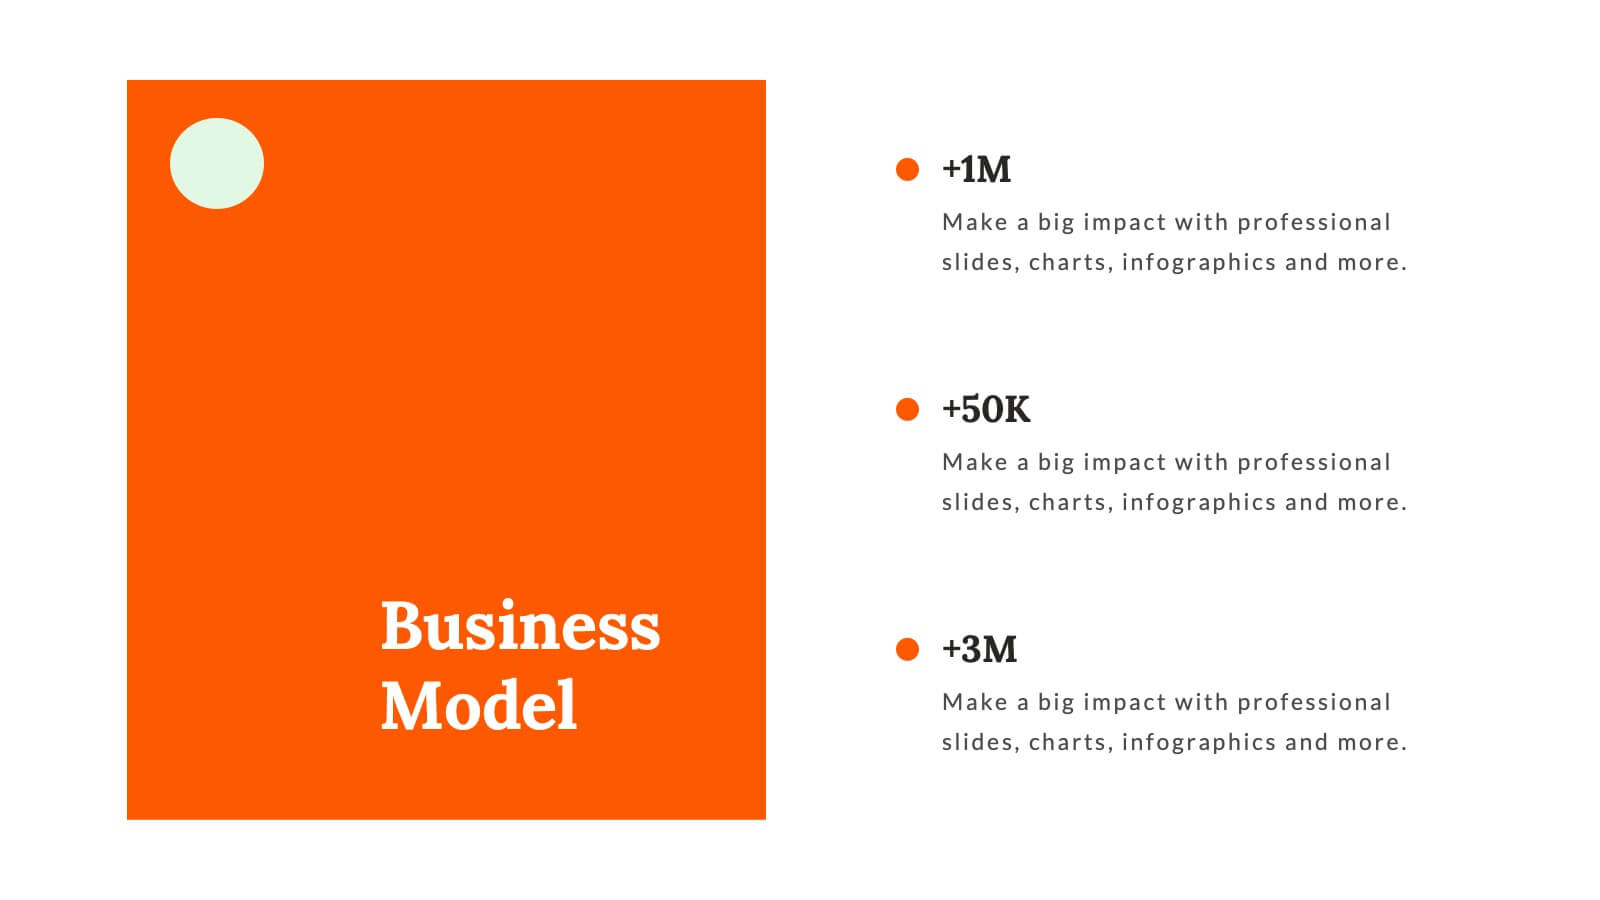
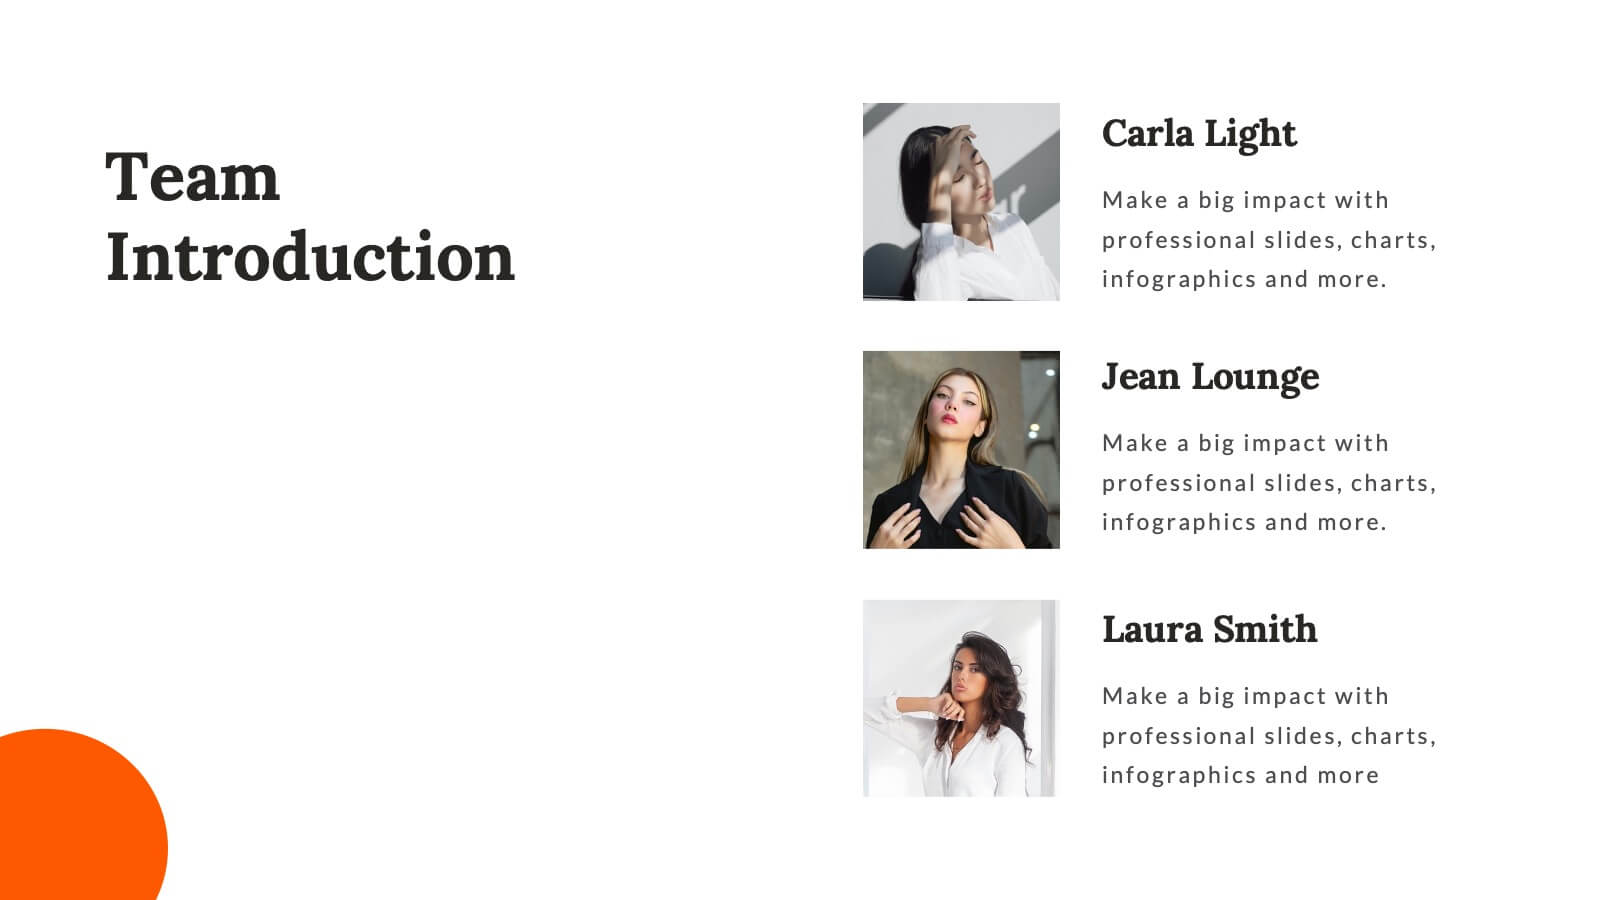
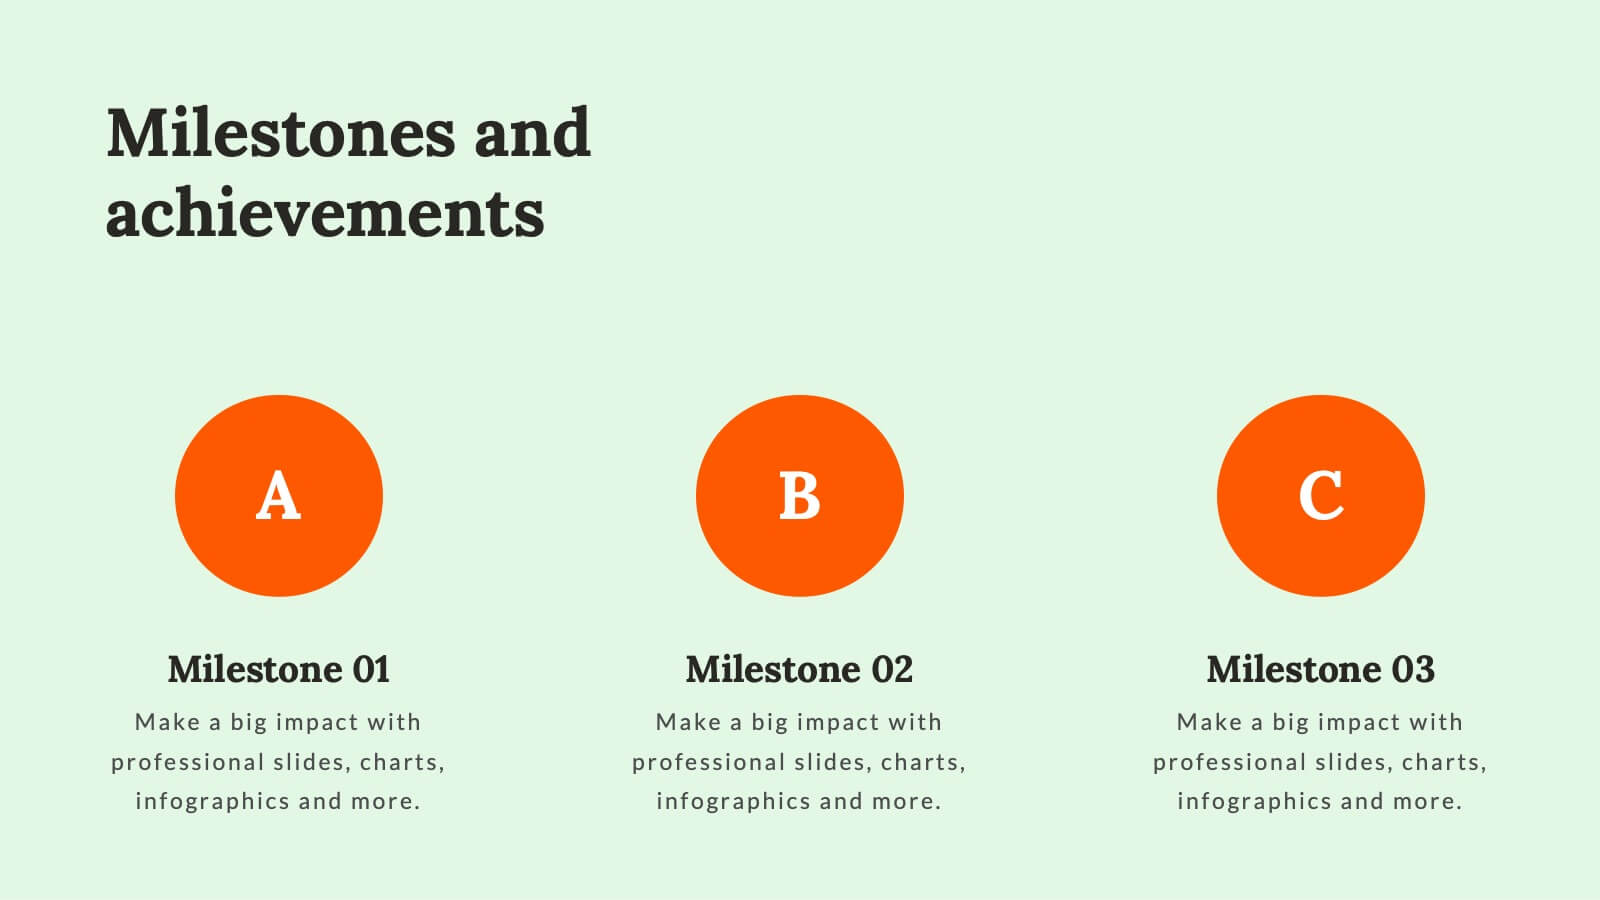
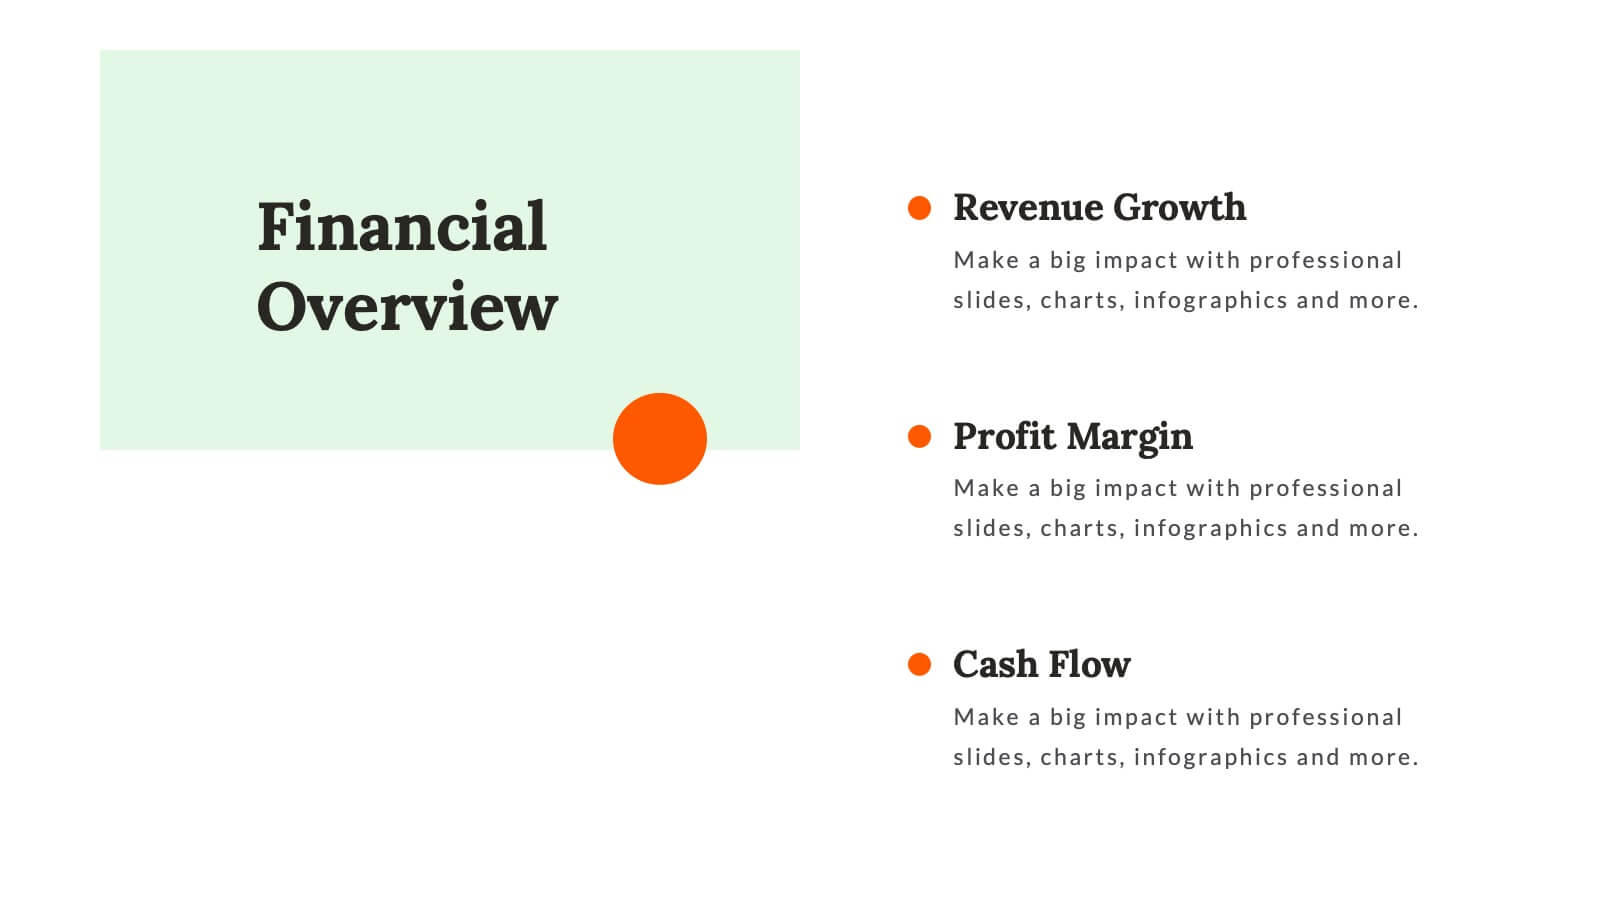
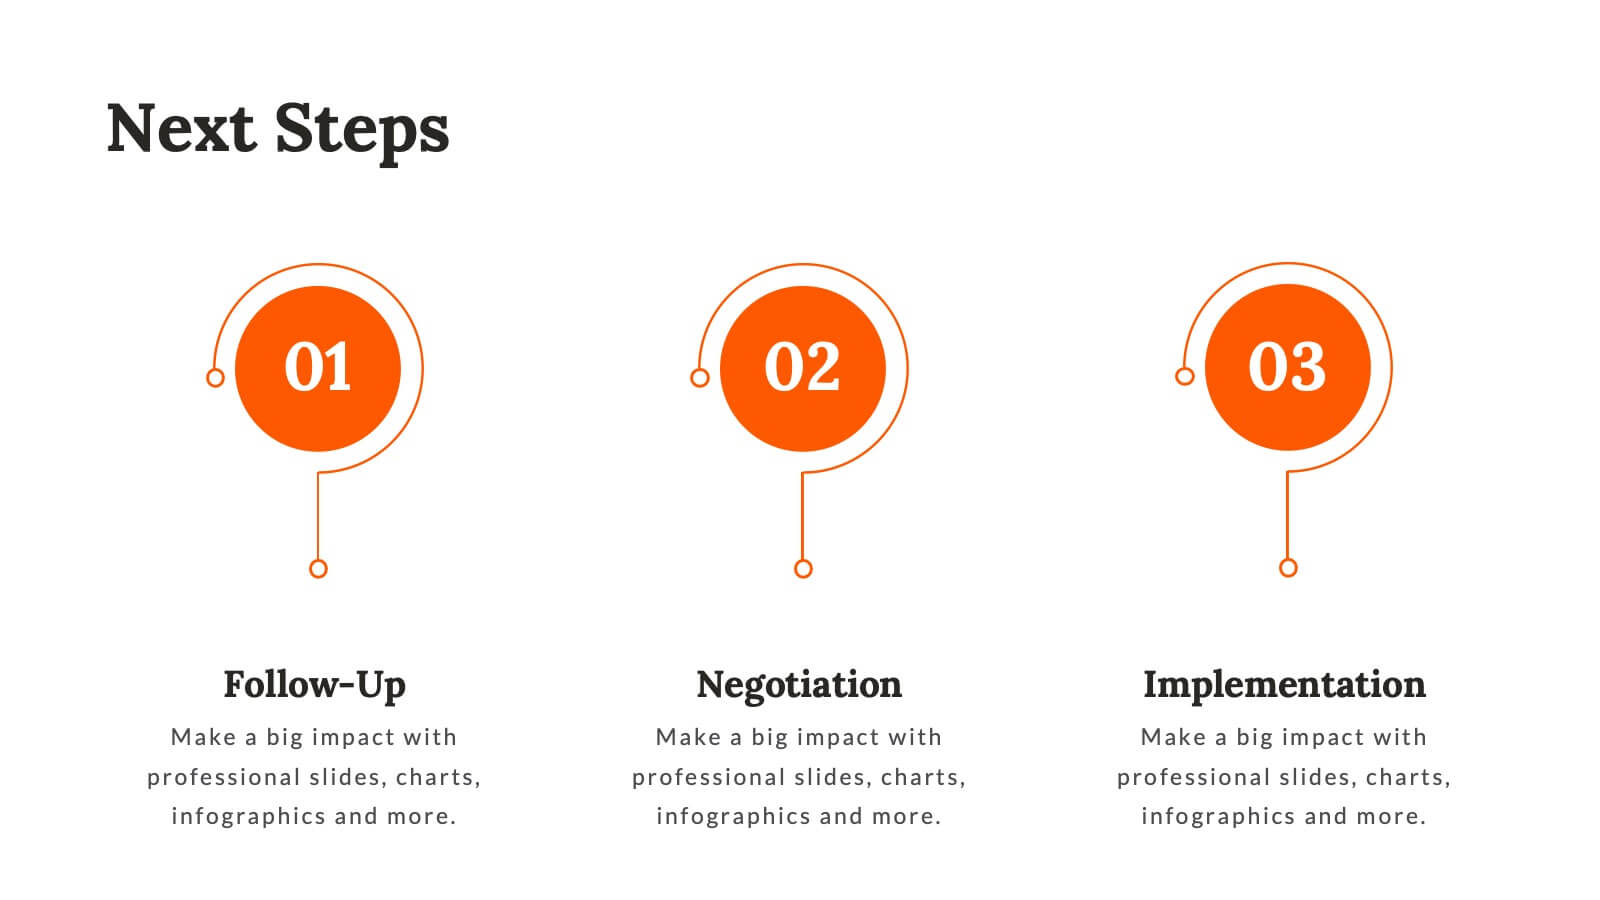
Cometis Small Business Pitch Deck Presentation
Introduce your business effectively with this pitch deck template, crafted for small businesses seeking impactful presentations. From company overview to objectives and strategies, this design is tailored to highlight your key messages. Dive into sections such as business highlights, team introductions, and future goals while maintaining a professional flow. This template includes callout slides, break announcements, and customizable placeholders for your brand visuals and content. Ideal for pitching ideas to stakeholders or presenting at workshops, it ensures clarity and engagement. Compatible with PowerPoint, Google Slides, and Keynote, it offers flexibility across platforms.


4 diapositivas
Elegant Watercolor Background Presentation
Add a touch of sophistication to your presentation with soft watercolor textures that create a calming, professional atmosphere. Perfect for creative projects, proposals, or portfolios, this elegant design blends artistry with clarity. Fully compatible with PowerPoint, Keynote, and Google Slides for seamless customization and a refined visual finish.


5 diapositivas
Country Highlight Asia Map Presentation
Showcase your regional insights with a clean and modern map that brings focus to key countries across Asia. Ideal for displaying market reach, growth metrics, or strategic locations, this visual layout makes data storytelling simple and effective. Fully compatible with PowerPoint, Keynote, and Google Slides for easy customization.


6 diapositivas
Editable Weekly Calendar Slide Presentation
Bring your week into focus with a vibrant layout that turns daily planning into something you actually look forward to. This presentation helps you outline tasks, deadlines, and priorities in a clear, color-coded structure perfect for productivity. Fully editable and compatible with PowerPoint, Keynote, and Google Slides.


6 diapositivas
Top Priorities Business List Presentation
Streamline your workflow with this structured priorities list template. Designed for business professionals, it visually organizes key tasks, helping teams focus on top objectives efficiently. With a clean and modern design, it's ideal for strategic planning, productivity tracking, and project management. Fully compatible with PowerPoint, Keynote, and Google Slides.


5 diapositivas
Online Learning Strategy Slides Presentation
Transform your virtual training ideas into visually engaging lessons with this dynamic presentation. Ideal for educators and online course creators, it helps structure digital learning strategies with clarity and purpose. Clean visuals make complex plans easy to follow. Fully compatible with PowerPoint, Keynote, and Google Slides for effortless customization.


4 diapositivas
Points-Based Membership Program Strategy Presentation
Communicate your rewards system with clarity using the Points-Based Membership Program Strategy presentation. This visual template is ideal for outlining tiered rewards, point accumulation methods, and redemption mechanics through a clean, card-themed layout. Perfect for loyalty teams, marketing strategists, and membership programs. Fully editable in PowerPoint, Keynote, and Google Slides.


4 diapositivas
Key Stakeholder Identification Presentation
A great presentation starts with clarity, and this slide brings your message to life with bold, visual focus. Use it to break down key stakeholder groups, highlight their roles, and communicate insights with ease. Clean lines and intuitive icons keep everything clear and engaging. Fully compatible with PowerPoint, Keynote, and Google Slides.


6 diapositivas
Timeline Planning with Gantt Layout Presentation
Organize your schedules clearly with this Timeline Planning with Gantt Layout presentation. Designed for efficient project tracking, this template breaks down tasks across phases and months, using a clean horizontal bar layout. Perfect for teams, planners, and managers. Fully editable in Canva, PowerPoint, and Google Slides to suit any workflow.


6 diapositivas
Six Sigma DMAIC Cycle Overview Presentation
Present each phase of the DMAIC methodology with the Six Sigma DMAIC Cycle Overview Presentation. This clean and professional layout walks through Define, Measure, Analyze, Improve, and Control in a clear, easy-to-follow structure. Perfect for Six Sigma professionals, quality managers, and operational teams. Fully editable in Canva, PowerPoint, Keynote, and Google Slides.


5 diapositivas
Country Breakdown South America Map Presentation
Turn complex regional data into clear visual insights with this modern map layout designed for South America. Perfect for showcasing country statistics, market segmentation, or performance comparisons, this slide keeps information clean and engaging. Fully compatible with PowerPoint, Keynote, and Google Slides for easy editing and professional presentations.