


Características


¿Tienes alguna pregunta?
Recomendar


5 diapositivas
Client Engagement Journey Touchpoints
Map out every stage of client interaction with the Client Engagement Journey Touchpoints Presentation. This visual slide template highlights four key customer touchpoints, with a central user icon to emphasize the client-centric approach. Ideal for showcasing brand awareness, first contact, engagement strategies, and conversion steps. Easily customizable in PowerPoint, Keynote, and Google Slides.


6 diapositivas
Social Psychology Infographic
Social psychology is a branch of psychology that focuses on how individuals' thoughts, feelings, and behaviors are influenced by their social interactions and the social environment. These infographics explore various concepts and principles of social psychology. This template is designed to provide a comprehensive overview of the fascinating field of social psychology and its relevance to understanding human behavior in social contexts. The template provides practical tips and strategies based on social psychology research for improving social interactions, communication skills, and building positive relationships.


5 diapositivas
Music & Arts Infographics
Music and Arts enrich our lives, stimulate our senses, and foster personal growth this plays a significant role in our lives and society. These infographic templates are perfect for promoting understanding and appreciation for music and arts. These can be used in educational settings, cultural organizations, or for personal enrichment, this template effectively conveys the significance of music and arts in our lives and inspires the audience to explore and engage with these creative expressions. These infographics include text boxes, icons, and color schemes that can be customized to fit your brand.


7 diapositivas
30 60 90 Business Plan Infographic
A 30-60-90 day plan is a strategic outline of goals and objectives that a person plans to achieve within specific timeframes—30, 60, and 90 days. Dive into the heart of strategic planning with our 30 60 90 business plan infographic. This bold and dynamic template is a visual roadmap, guiding you through the critical phases of a business plan and setting a solid course for success. Compatible with Powerpoint, Keynote, and Google Slides. This infographic is a powerful tool, illustrating the journey from inception to triumph in 90 days. Explore each crucial phase in crafting an effective business plan.


4 diapositivas
Market Research Survey Insights Presentation
Showcase key data from your latest research with this bold, megaphone-themed survey slide. Ideal for presenting percentages and key findings side-by-side, this layout draws attention to market trends, consumer feedback, or audience segmentation. Fully editable in PowerPoint, Keynote, and Google Slides.


7 diapositivas
Inversion Table Infographic
A table infographic is a visual representation of data or information presented in a tabular format, using a combination of text, numbers, and visual elements to make the information more engaging and easily understandable. This infographic template is great for comparing two or more variables and is a powerful way to convey your data. This infographic is designed to show your audience the key points of your data in a visually appealing way. This template is a good option if you want to present your information as an easy-to-read table with labels and numbers. The bright colors and fun design make it easy to see at a glance.


6 diapositivas
Circular Wheel Diagram Presentation
Bring motion and balance to your ideas with this clean, circular design that connects every element in a seamless flow. Ideal for showcasing continuous processes, team dynamics, or strategic cycles, it keeps your message clear and engaging. Fully compatible with PowerPoint, Keynote, and Google Slides for easy editing.


5 diapositivas
Real Estate Listings and Growth Map Presentation
Showcase listings, deals, and area growth with this Real Estate Listings and Growth Map Presentation. Each house graphic represents a stage or category—ideal for highlighting regions, property types, or development phases. Use icons and color changes to lead attention across the timeline. Fully editable and works in PowerPoint, Keynote, Canva, and Google Slides.


4 diapositivas
Social Media and Online Marketing Trends
Showcase emerging strategies with this mobile-inspired layout perfect for social media and online marketing updates. The clean design highlights trends like SEO, influencer marketing, and content innovation with clarity. Fully customizable and compatible with PowerPoint, Keynote, and Google Slides.


10 diapositivas
Effective Team Building Presentation
Spark stronger teamwork with a clean, engaging layout that makes group objectives easy to explain and even easier to remember. This presentation highlights key actions, shared responsibilities, and collaborative strategies in a simple visual flow that supports any team discussion. Fully compatible with PowerPoint, Keynote, and Google Slides.


6 diapositivas
Step-by-Step Onboarding Program Presentation
Turn your onboarding process into a seamless experience with a clean, structured layout that walks viewers through each stage of the journey. Ideal for HR teams, training sessions, or corporate orientations, this presentation ensures clarity and engagement. Fully compatible with PowerPoint, Keynote, and Google Slides for easy customization and delivery.


5 diapositivas
Purpose-Driven Mission and Values Presentation
Present your organization’s core purpose and guiding principles with this Purpose-Driven Mission and Values presentation. This clean, flag-style layout is perfect for showcasing five key pillars such as integrity, collaboration, or innovation. Easily customizable in Canva, PowerPoint, or Google Slides to align with your brand.


21 diapositivas
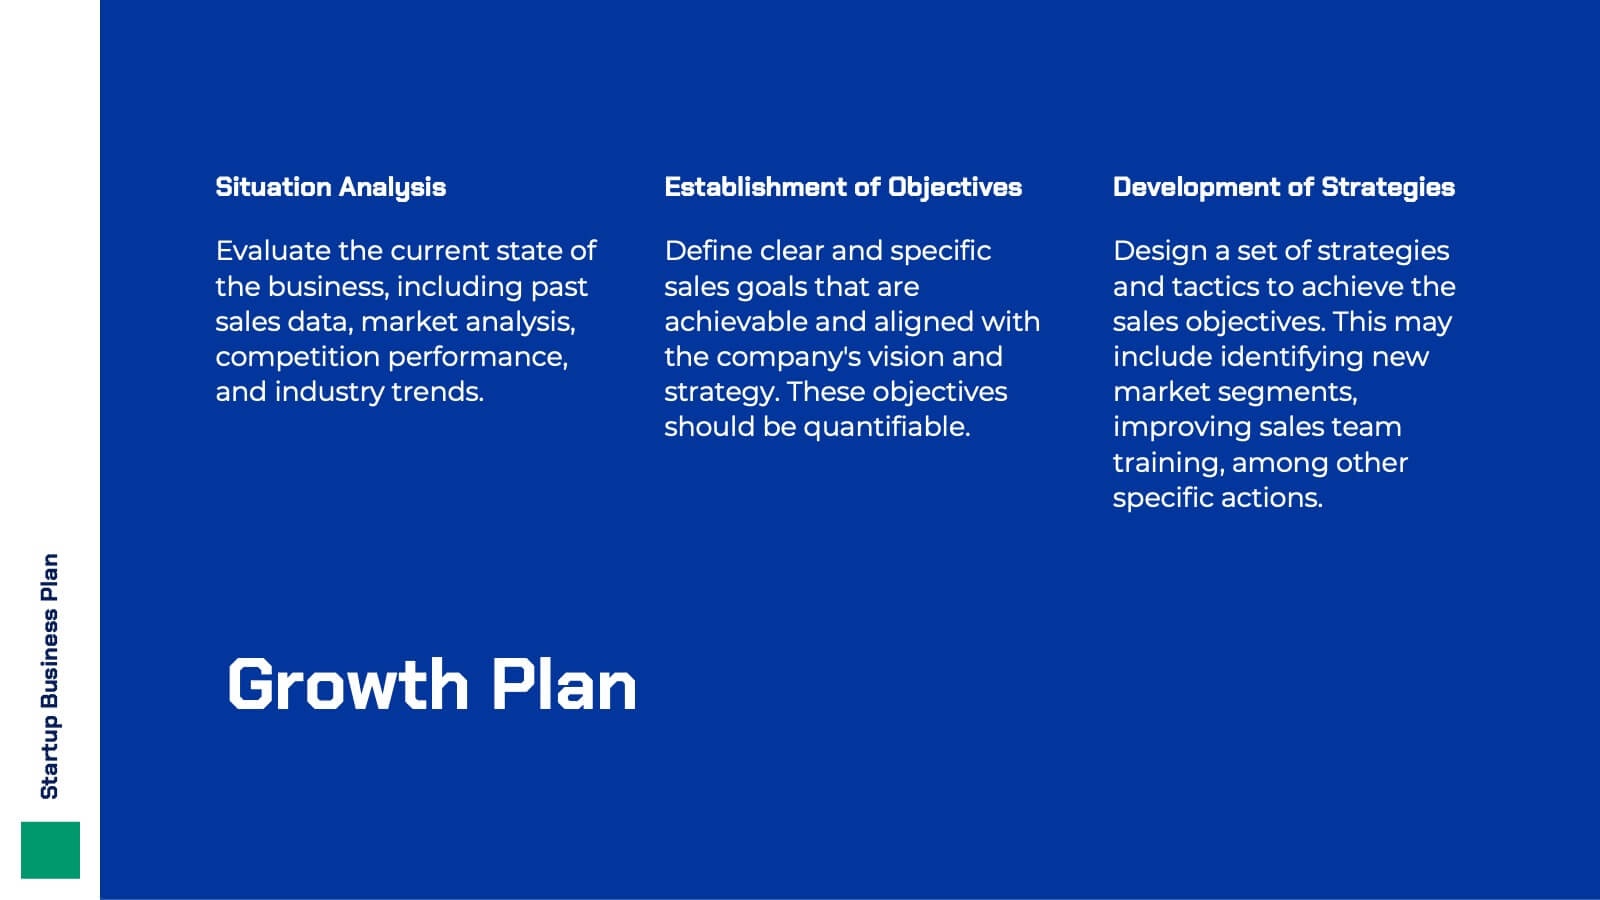
Hyperluma Startup Business Plan Presentation
Launch your vision with this startup business plan template, crafted to communicate your mission, market potential, and growth strategy with clarity and impact. Covering customer needs, unique value propositions, and financial projections, it’s ideal for entrepreneurs and founders. This template is compatible with PowerPoint, Keynote, and Google Slides, ready to fuel your startup’s journey.


7 diapositivas
Mental Agility Training Infographic
Embark on the enlightening path of training with our intricately designed mental agility training infographic. Illuminated by the motivation of yellow, the growth of green, and the depth of blue, our template effectively outlines training methodologies and outcomes. Adorned with precision-focused infographics, intuitive icons, and adaptable image placeholders, it renders complex training data into an easily digestible format. Expertly sculpted for Powerpoint, Keynote, or Google Slides. A quintessential tool for trainers, HR professionals, or any organization aiming to elevate its training regimen. Enlighten your audience; let every slide be a step towards mastery.


8 diapositivas
Corporate Office Scenes Illustrations Presentation
Bring workplace communication to life with this slide featuring an illustrated office meeting scene and a four-point list layout. Each segment is color-coded with accompanying icons, making it ideal for presenting corporate strategies, team roles, or process workflows. Designed for clarity and visual appeal, this slide is perfect for business reports, training decks, or client briefings. Easily customizable in PowerPoint, Keynote, and Google Slides.


7 diapositivas
Harvey Ball Assessment Infographic Presentation
A Harvey Ball Infographic is a graphic design element that utilizes the iconic Harvey Ball. This Harvey Ball template is designed as a way to increase morale and productivity in the workplace. This infographic is useful for businesses and organizations who want to present data or information in a way that is easy to understand and engaging to their audience. By incorporating the harvey ball into your presentations it adds a fun and lighthearted element to an otherwise dry or complex topic. Designed in Powerpoint, Keynote, and Google Slides, customized the text and graphs to fit your brand.


7 diapositivas
Team Work Strategy Infographic
Harness the collective strength of your team with our team work strategy infographic. Set against a pristine white backdrop, this design is accentuated with vivid strokes of purple, blue, yellow, and orange, symbolizing the diverse skills and unity in a team. Crafted for seamless compatibility with Powerpoint, Keynote, and Google Slides, the template features versatile graphics, detailed icons, and adaptable image placeholders. Envisage the synergy, collaboration, and the strategic prowess of a unified team, all laid out in a visually appealing format.