


Características


¿Tienes alguna pregunta?
Recomendar


22 diapositivas
Inspirae Project Status Report Presentation
This sleek and modern project status report presentation template is designed to help you effectively communicate progress, challenges, and key insights. It covers essential sections such as performance metrics, sales performance, risk assessments, and strategic initiatives, ensuring a comprehensive overview. Compatible with PowerPoint, Keynote, and Google Slides for seamless customization.


20 diapositivas
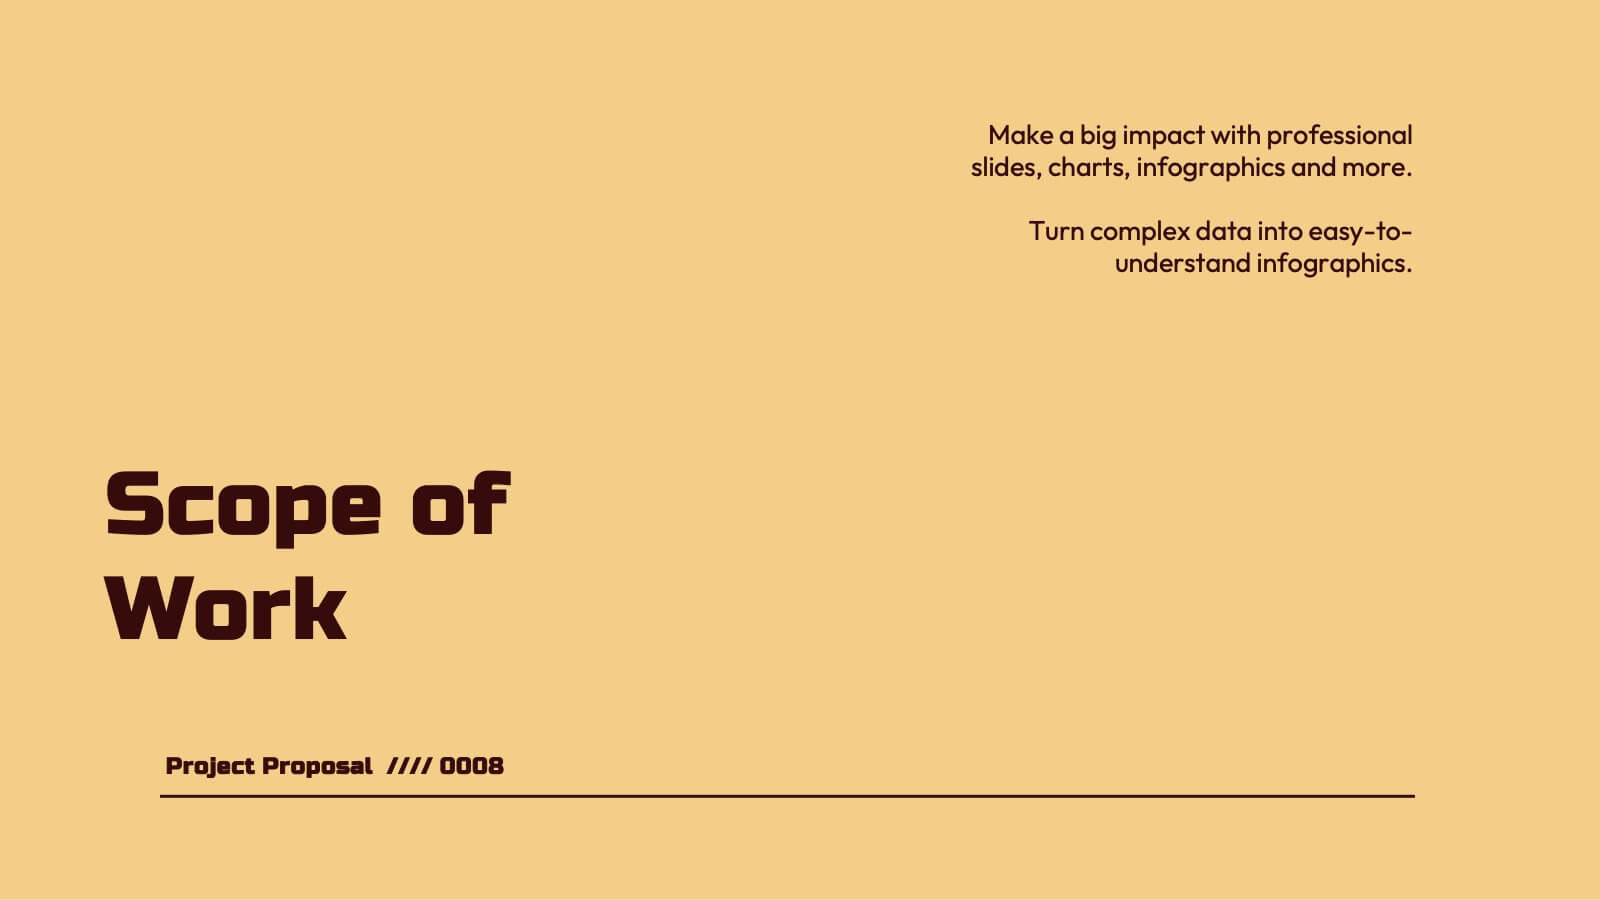
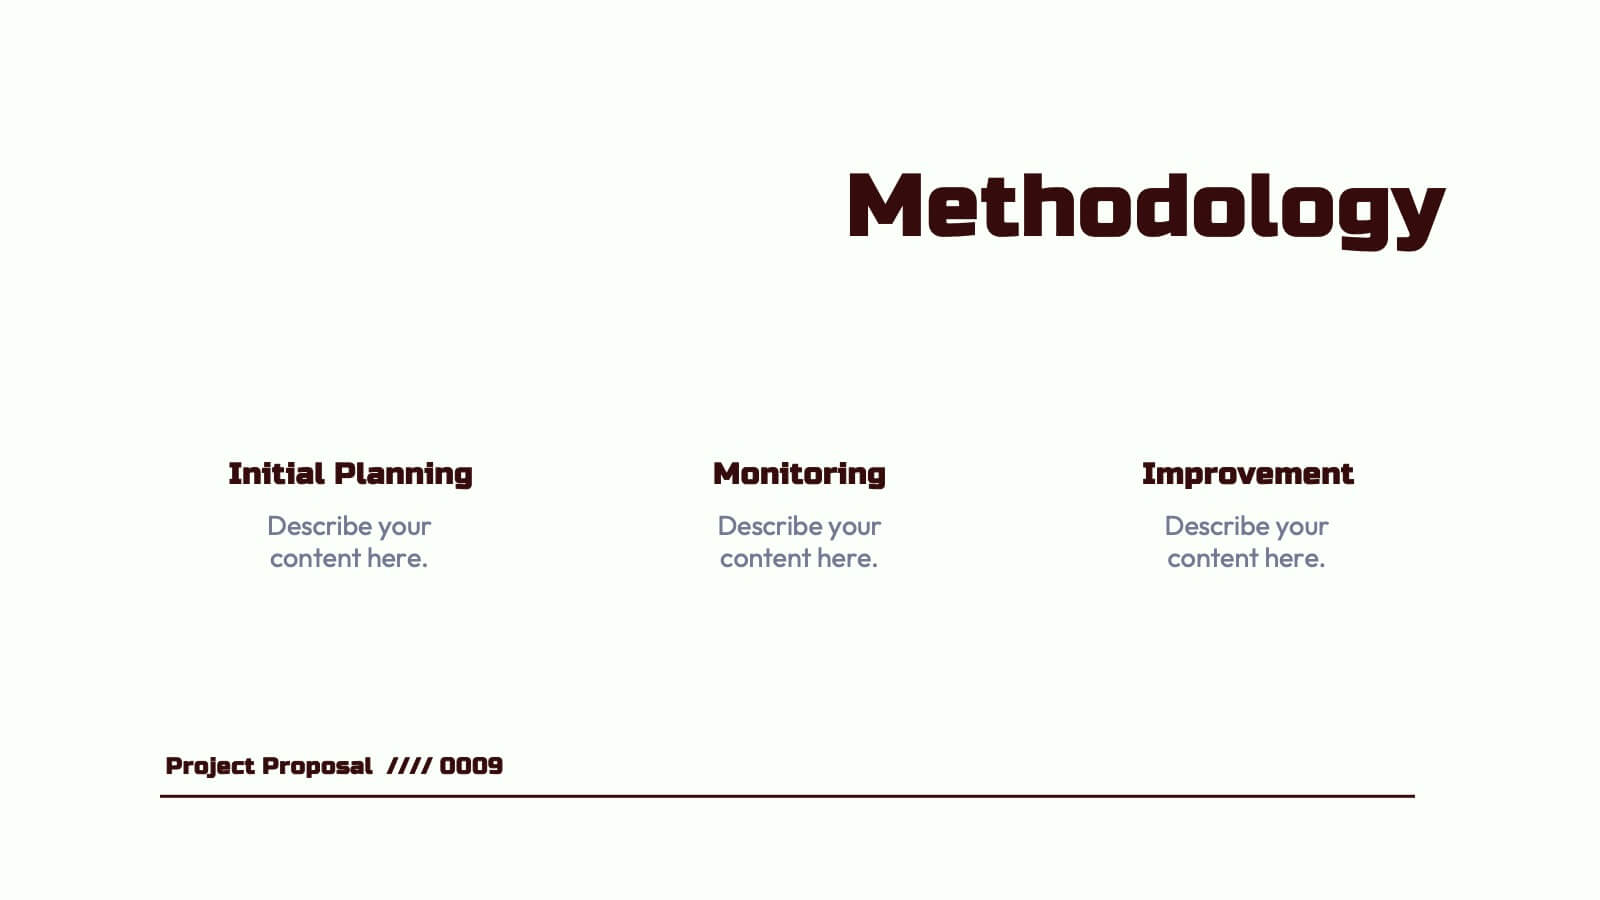
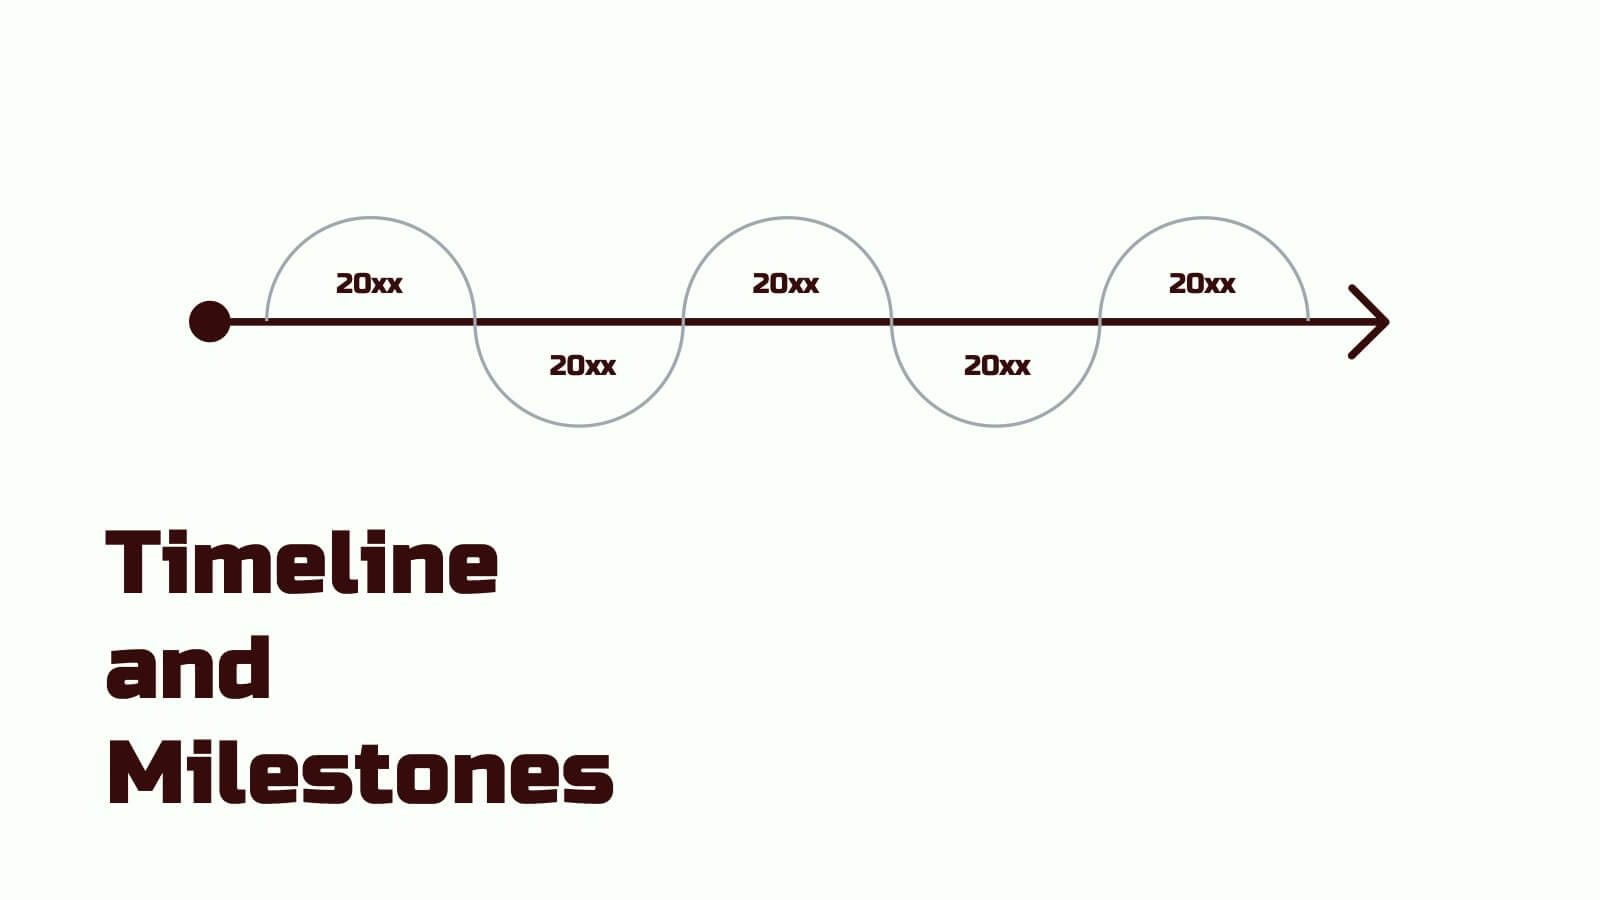
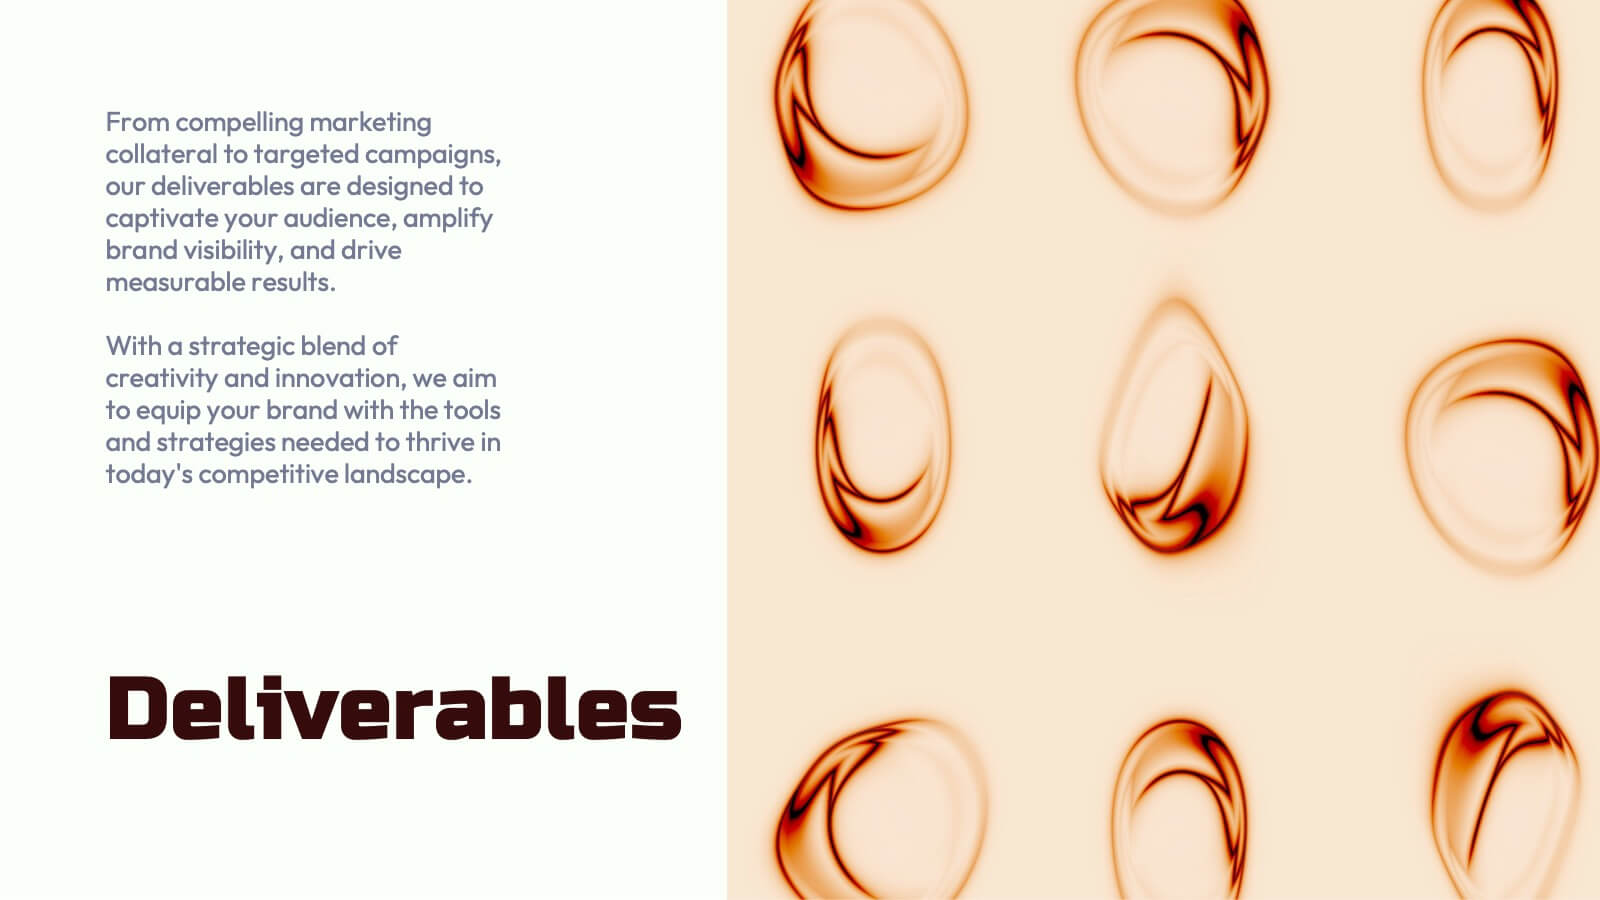
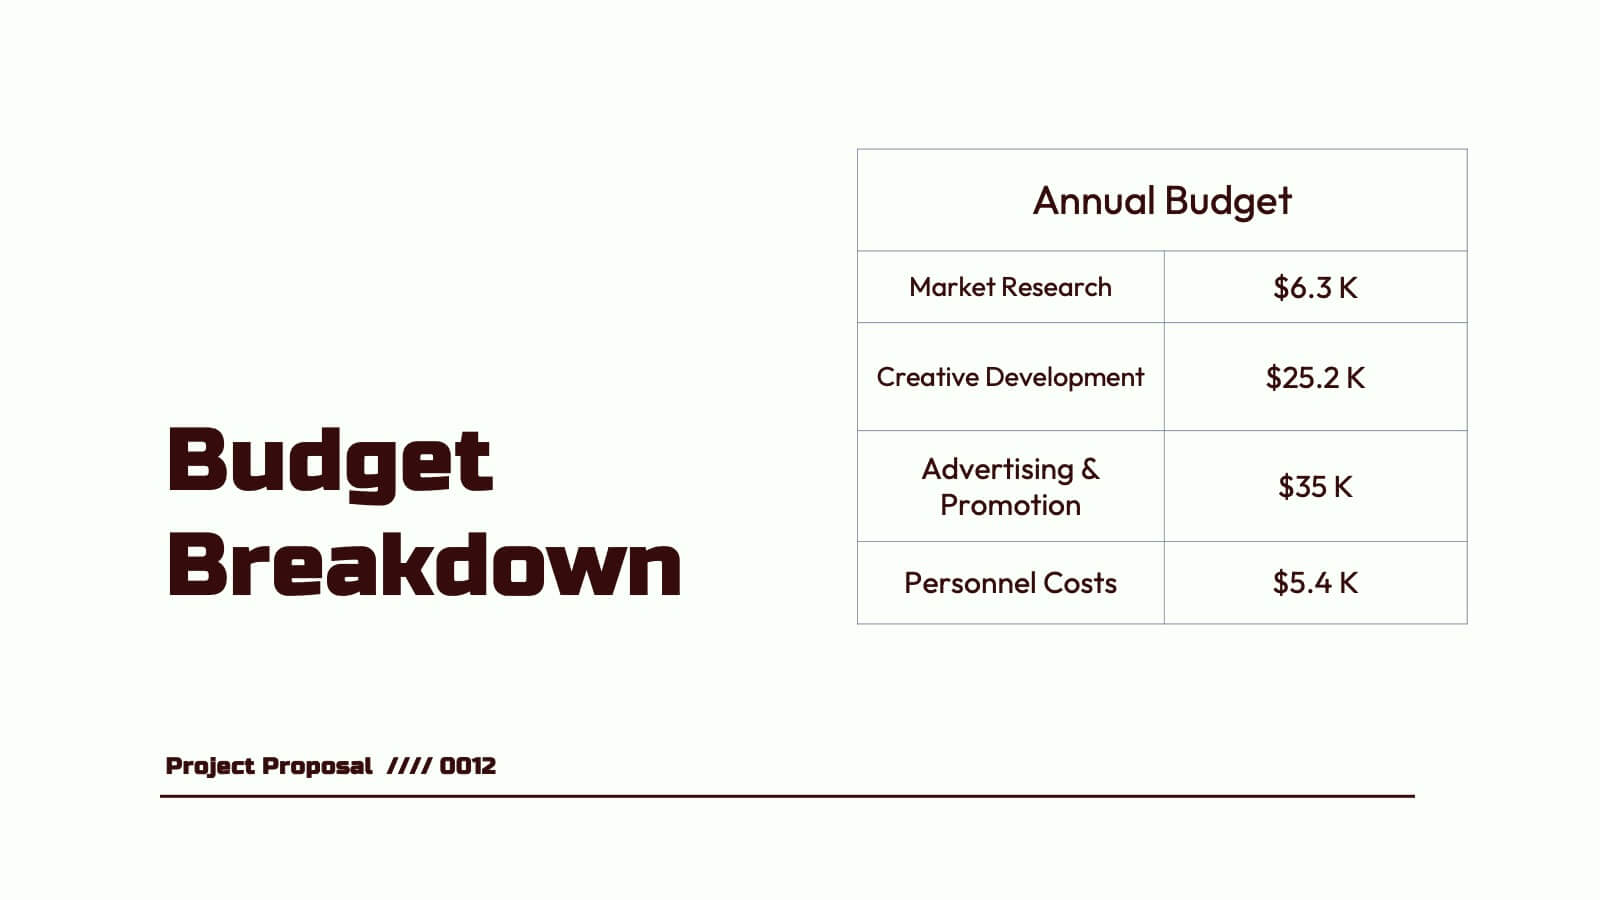
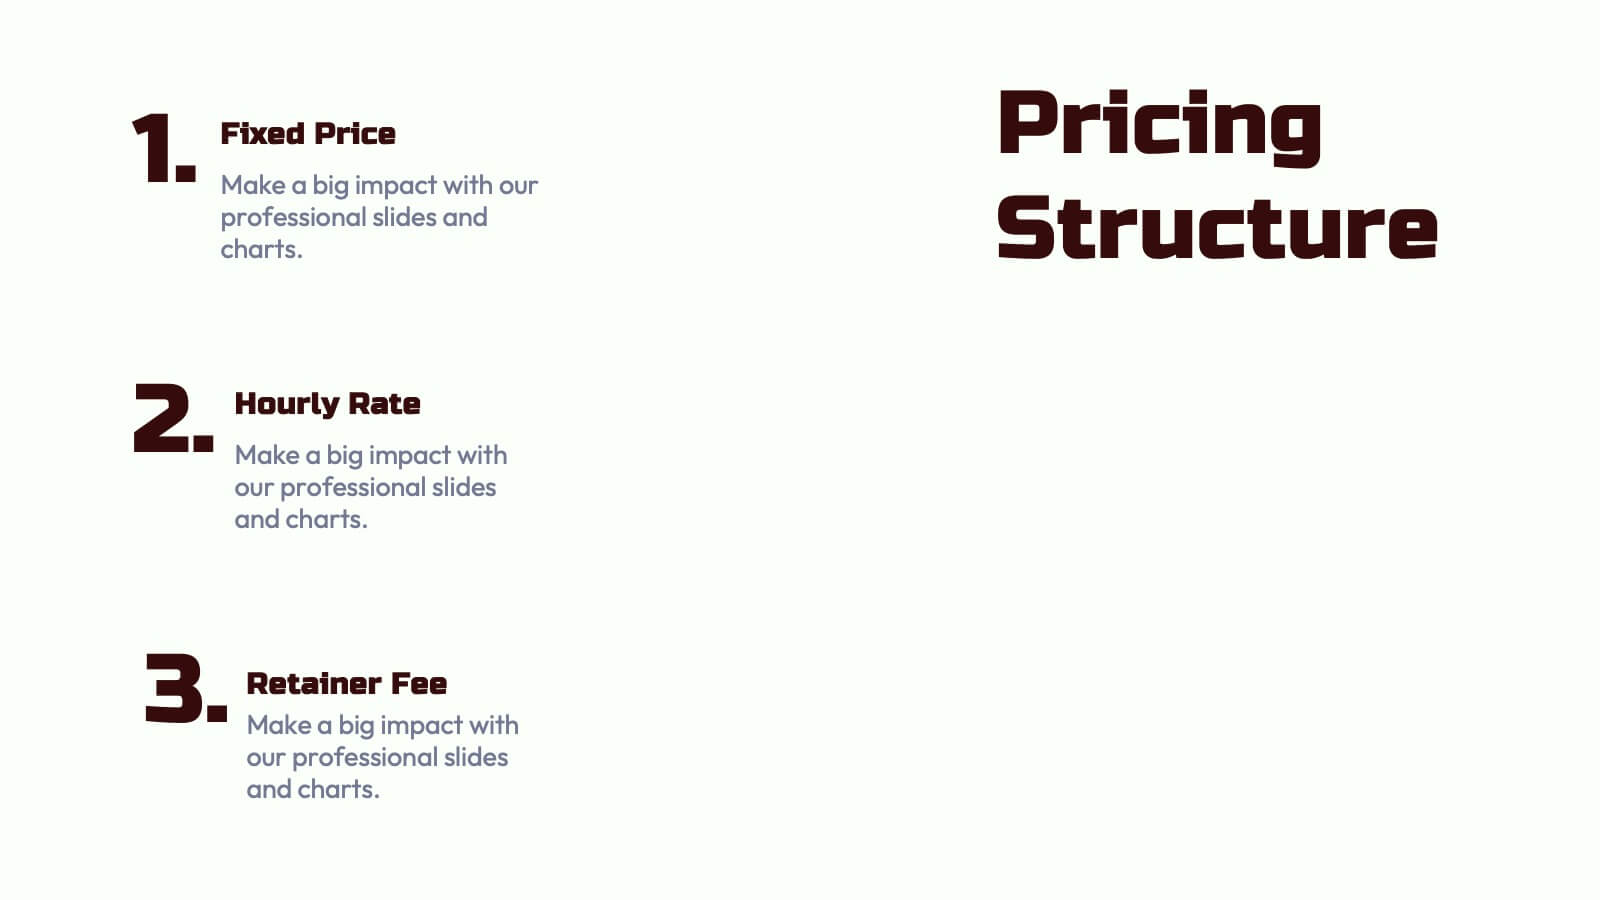
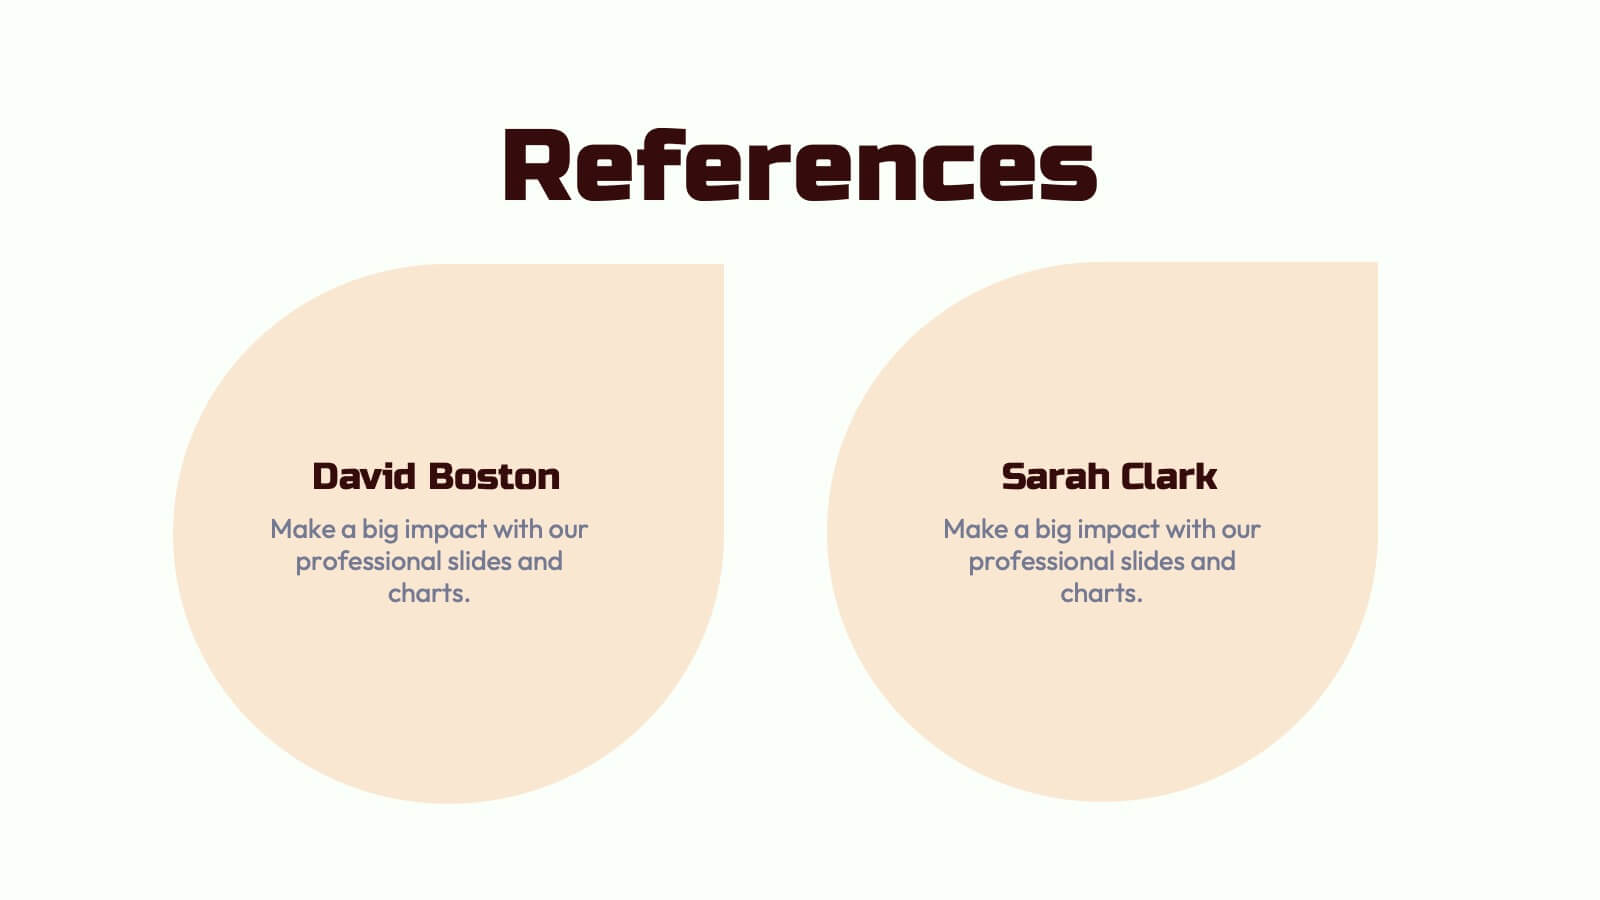
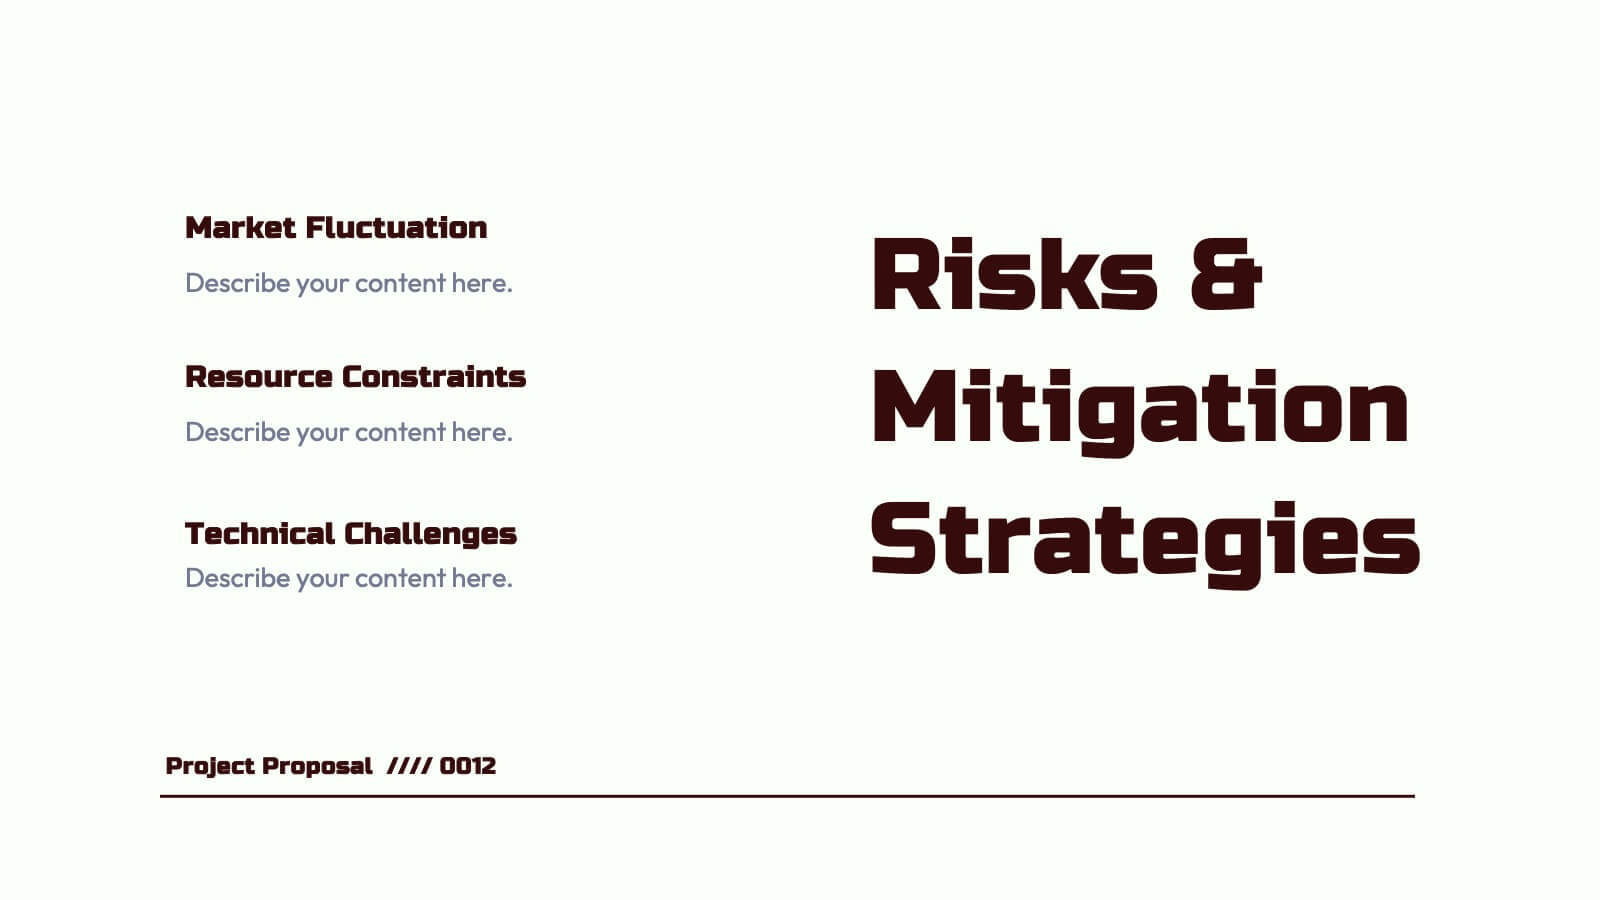
Nebula Project Proposal Presentation
Create a compelling project proposal with this structured, professional template! It includes sections for problem statements, proposed solutions, goals, timelines, and pricing. Perfect for organizing your ideas clearly and professionally, it's fully customizable and compatible with PowerPoint, Keynote, and Google Slides. This template makes it easy to present your proposals effectively and win clients.


7 diapositivas
Project Management Process Infographic
Navigate the vast arena of project management with our project management infographic. Anchored on a clear white base, the design is adorned with the calm of green, the trustworthiness of blue, and the innovative spirit of purple. Engage with meticulously designed infographics, tailored icons, and flexible image placeholders, providing a comprehensive visual guide to the realms of project planning, execution, and evaluation. Perfectly sculpted for Powerpoint, Keynote, or Google Slides. An invaluable asset for project managers, team leaders, consultants, or anyone in the corporate landscape wanting to visualize and optimize project stages.


4 diapositivas
South America Growth Market Strategy Presentation
Showcase expansion potential with the South America Growth Market Strategy Presentation. This slide template visually maps out your business strategy across the continent using location markers, ranking indicators (A–D), and concise text sections for each market. Perfect for growth analysis, investment briefings, or sales planning. Fully editable in PowerPoint, Keynote, Google Slides, and Canva.


21 diapositivas
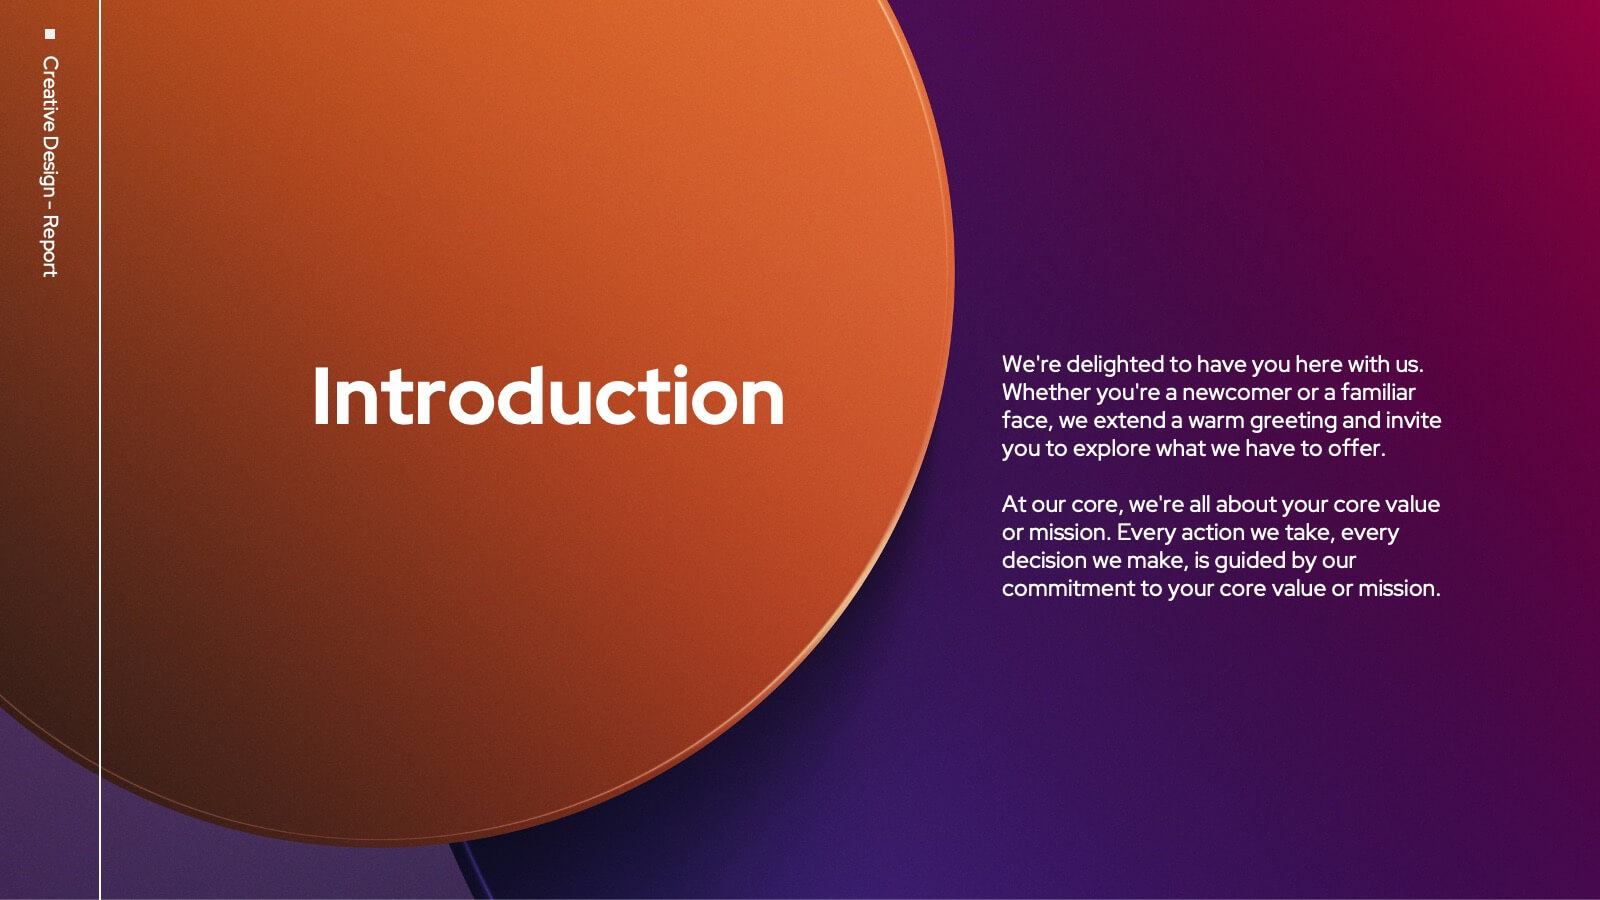
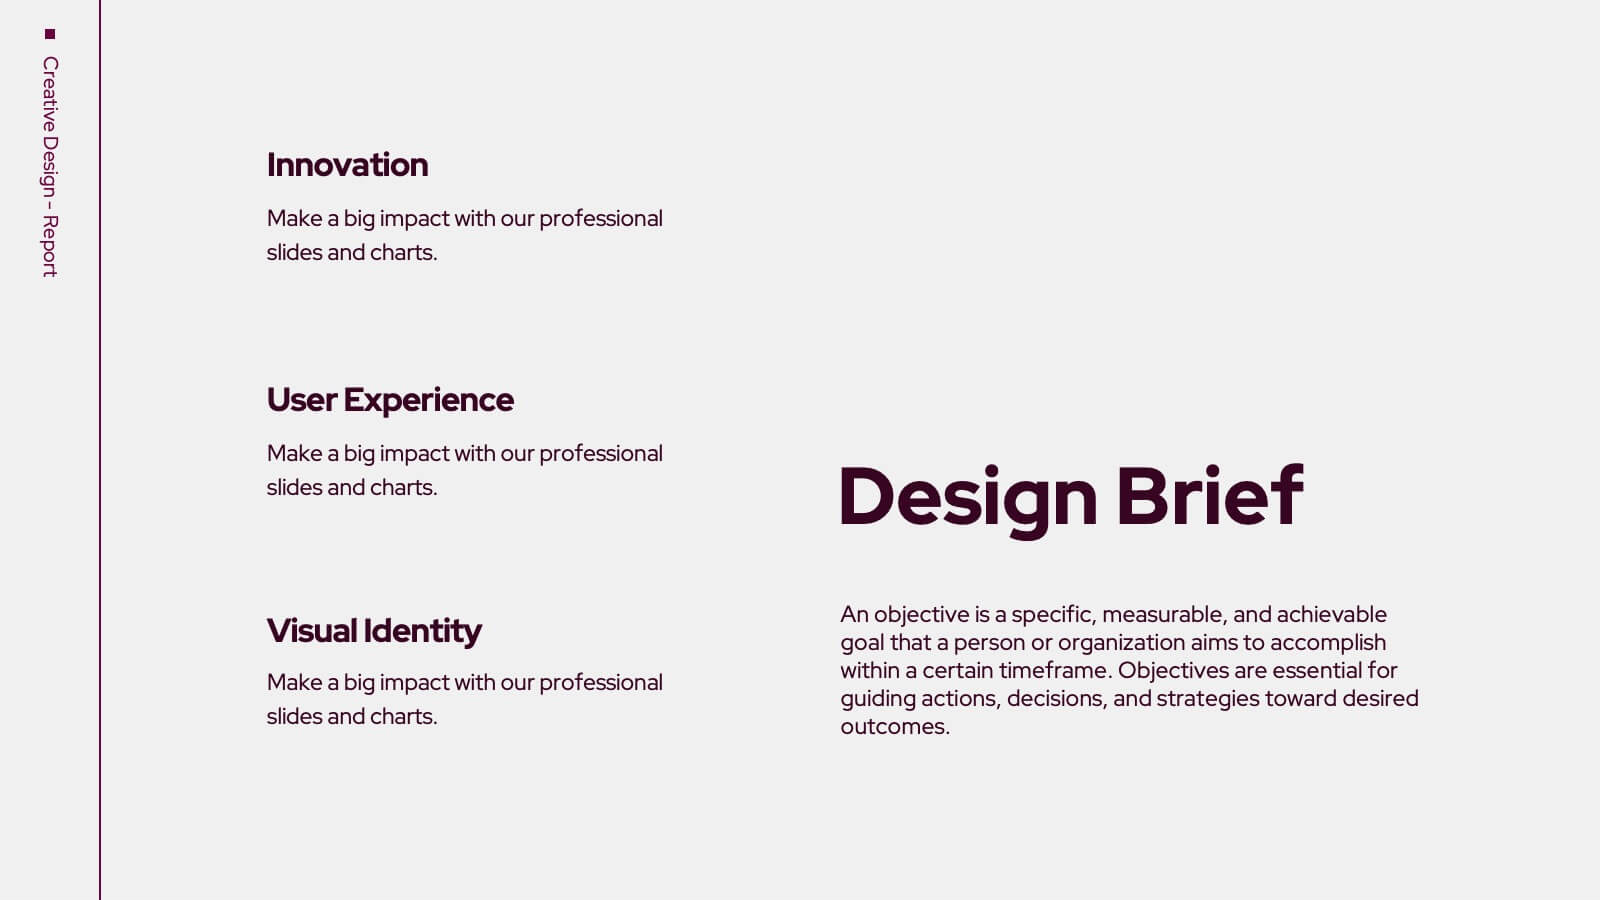
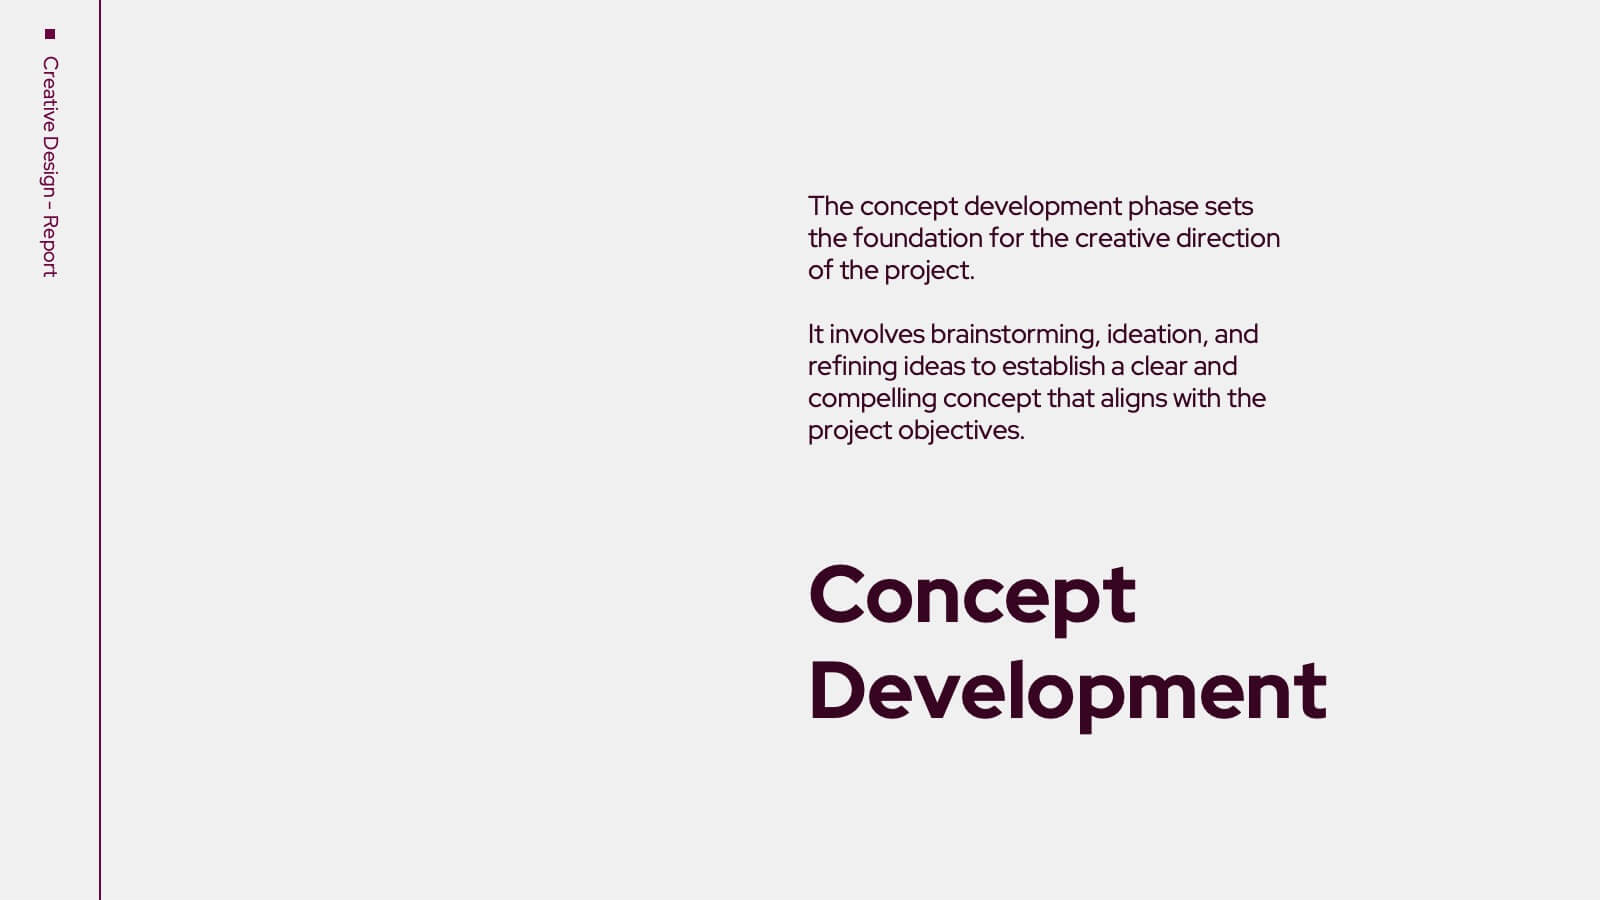
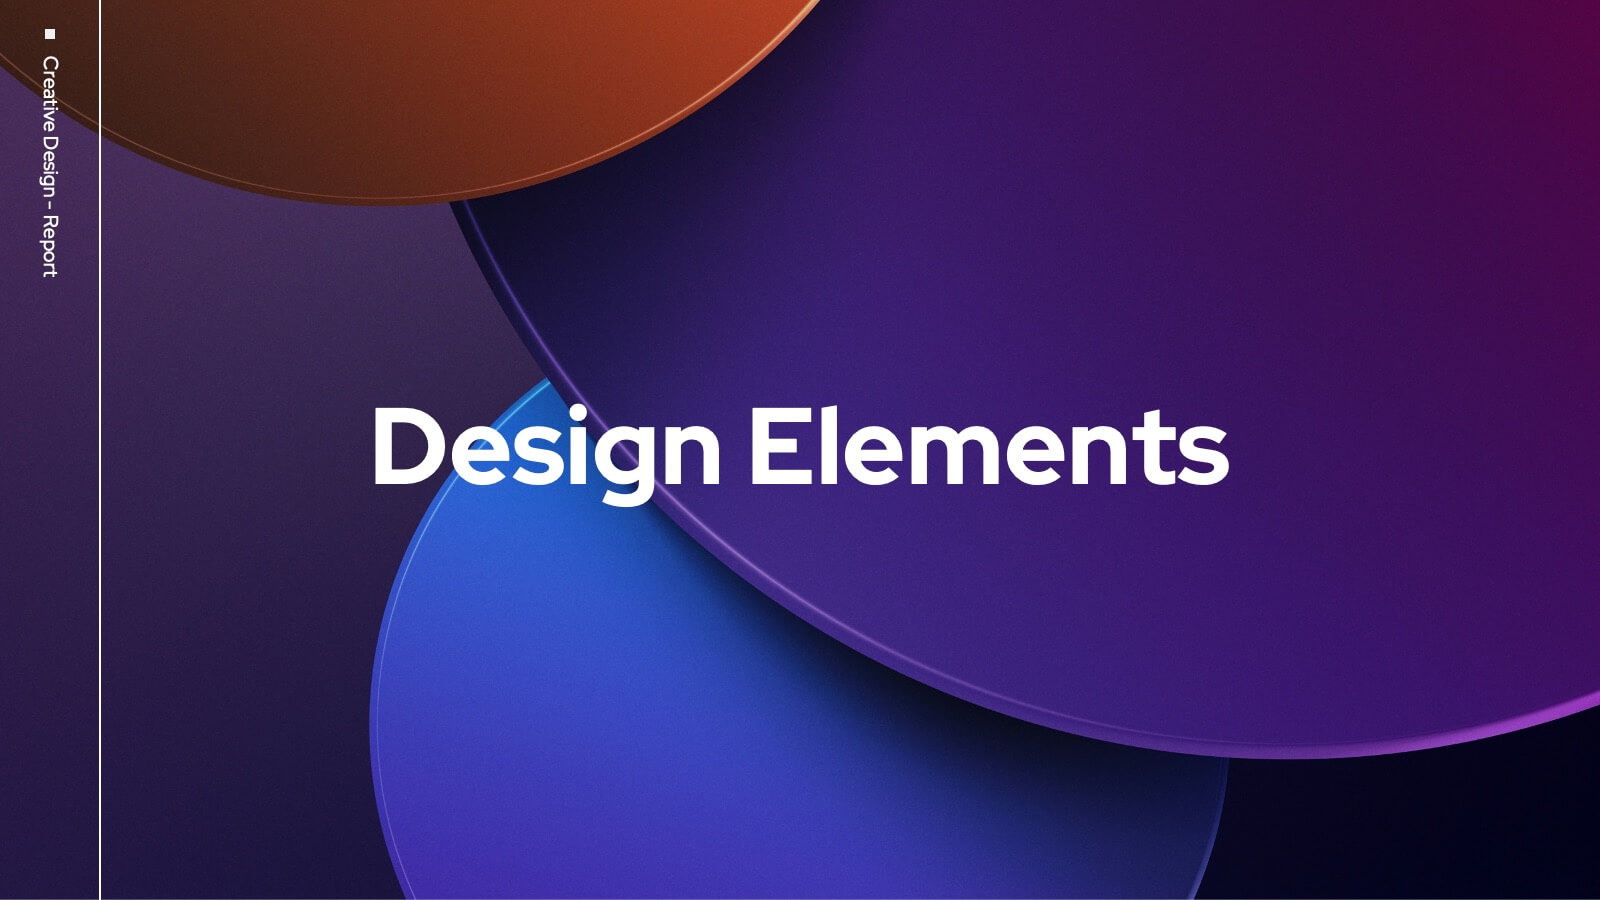
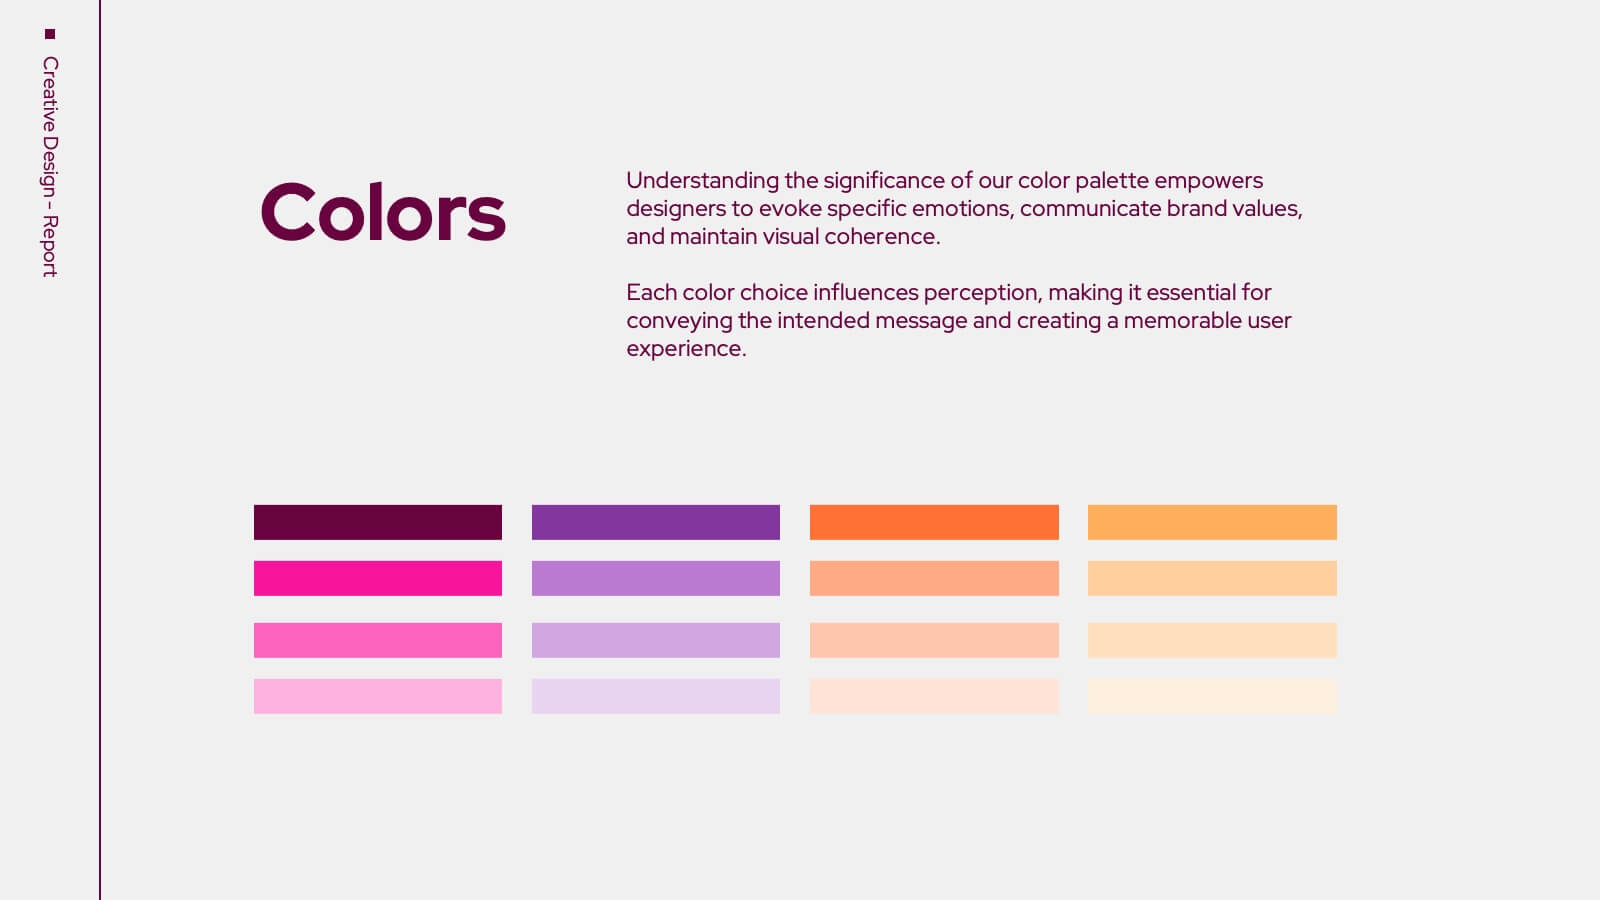
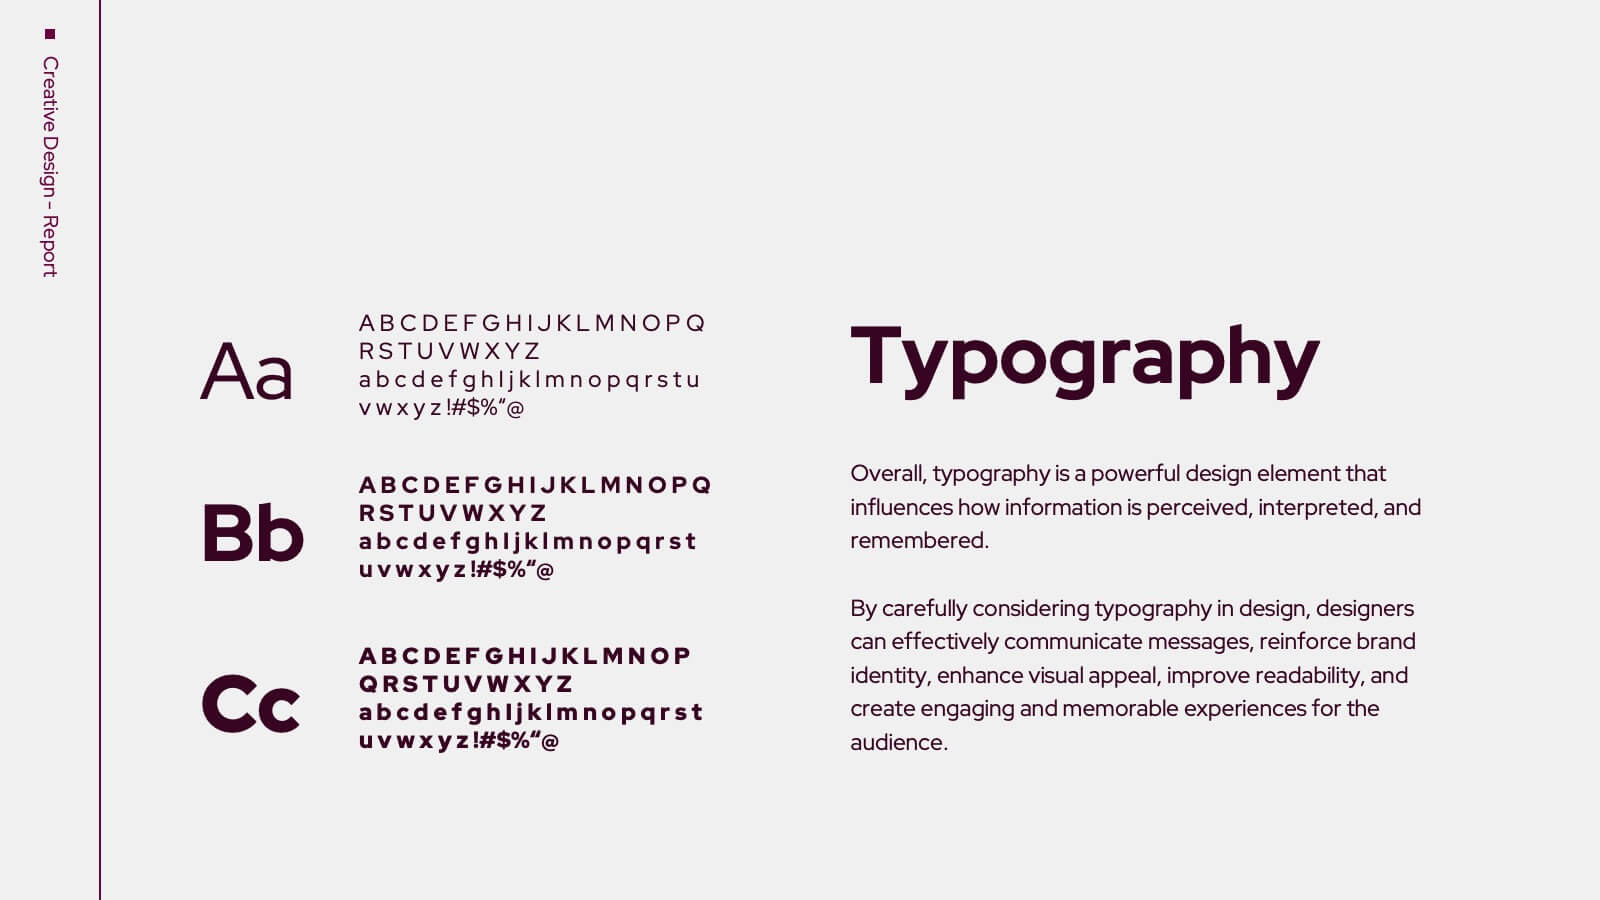
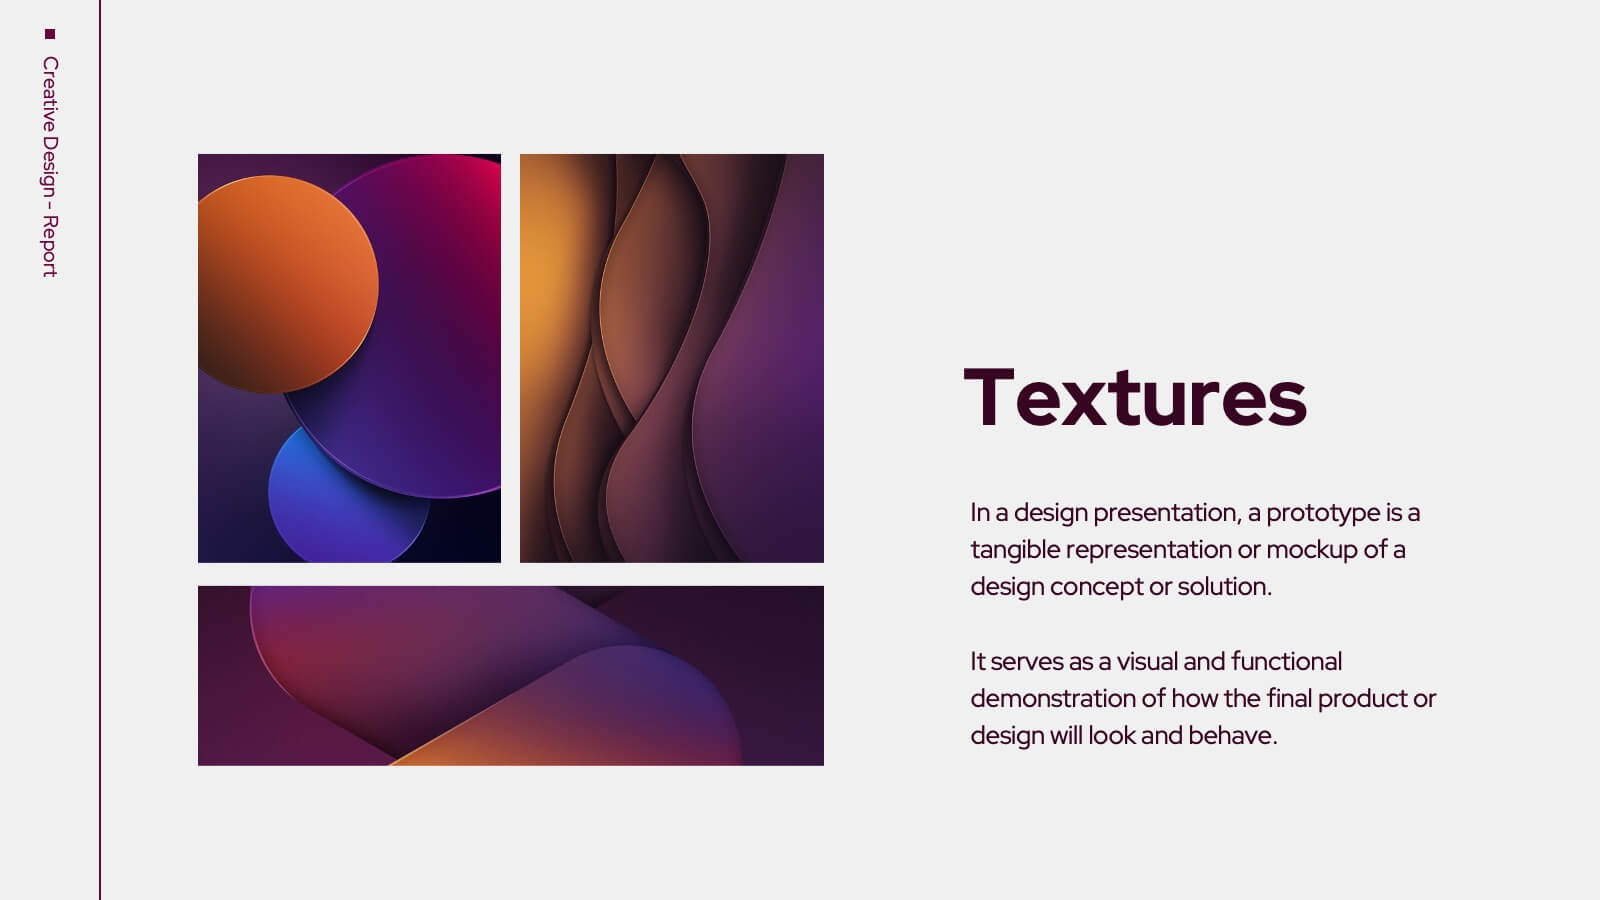
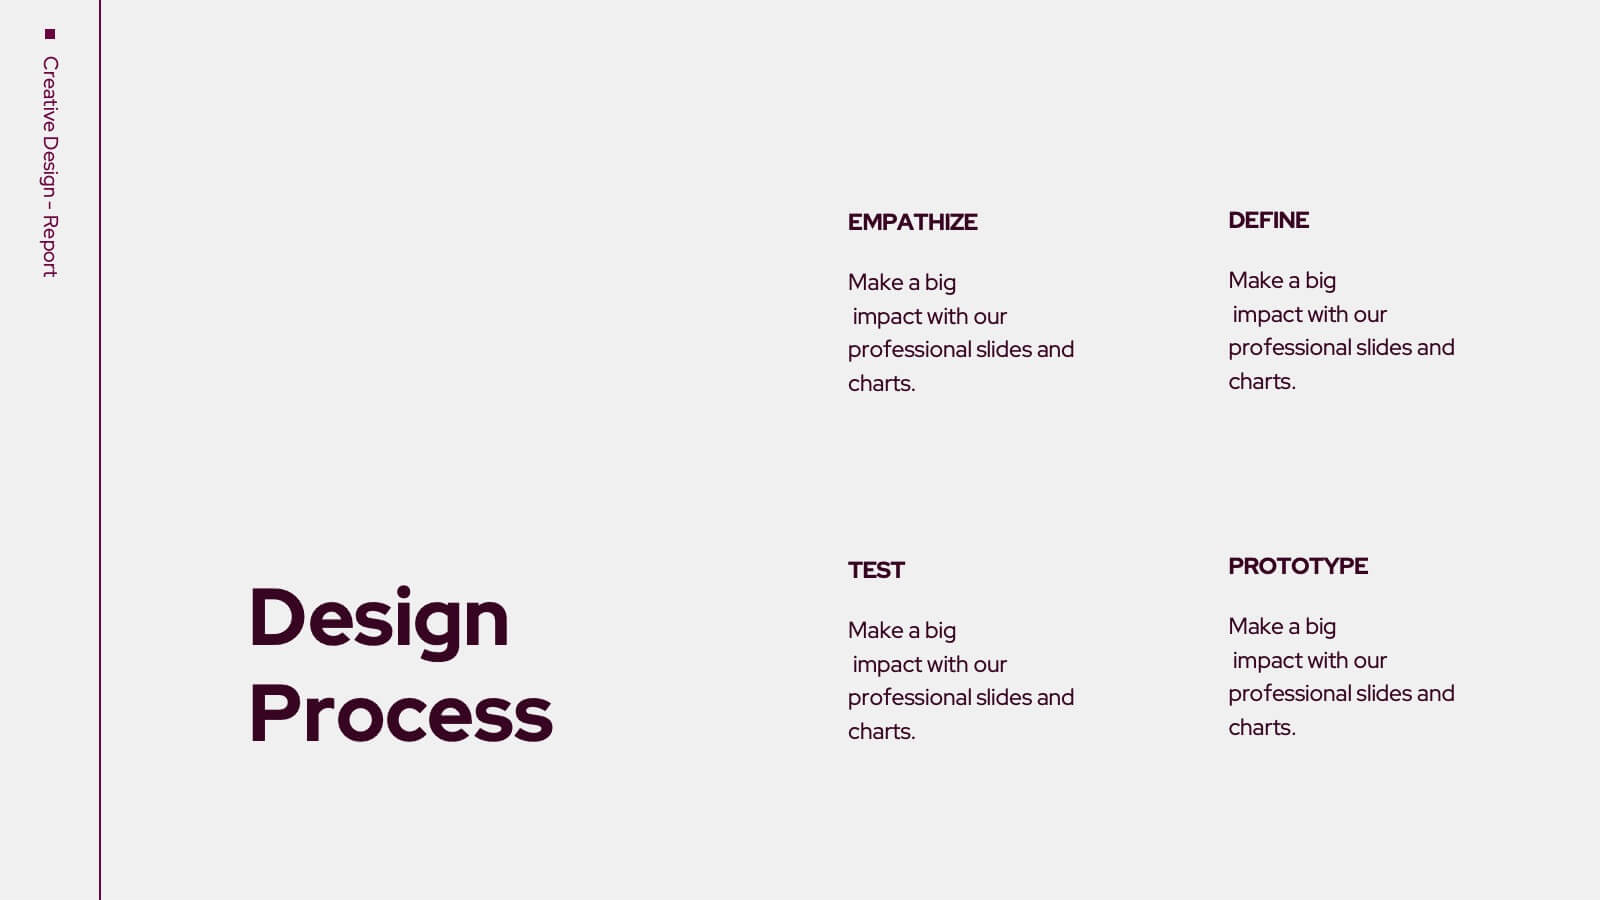
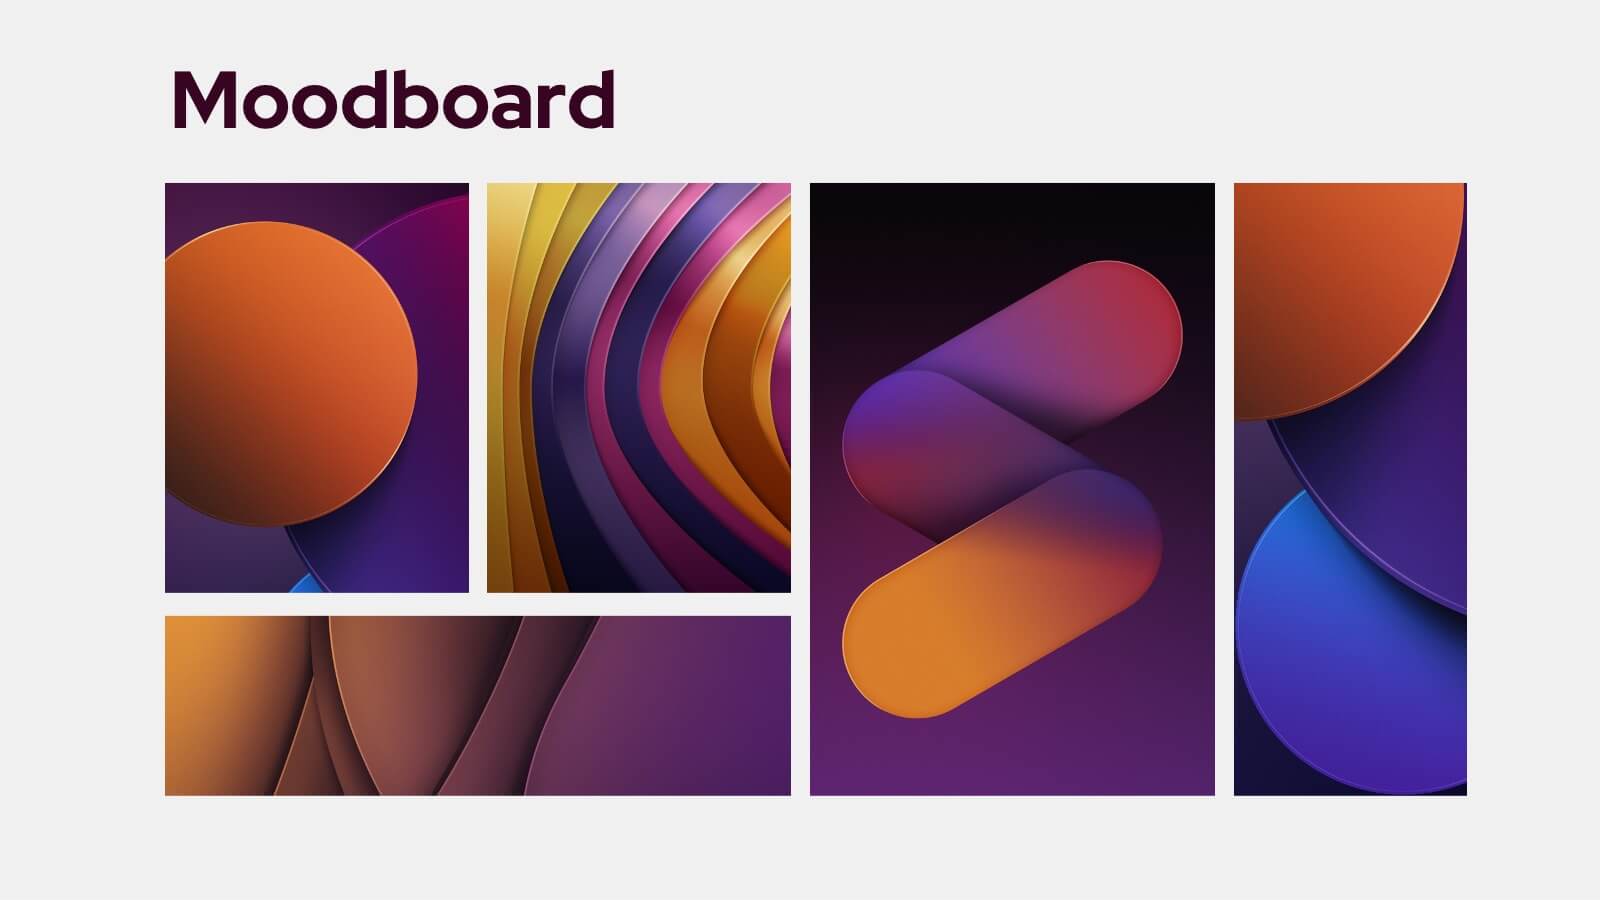
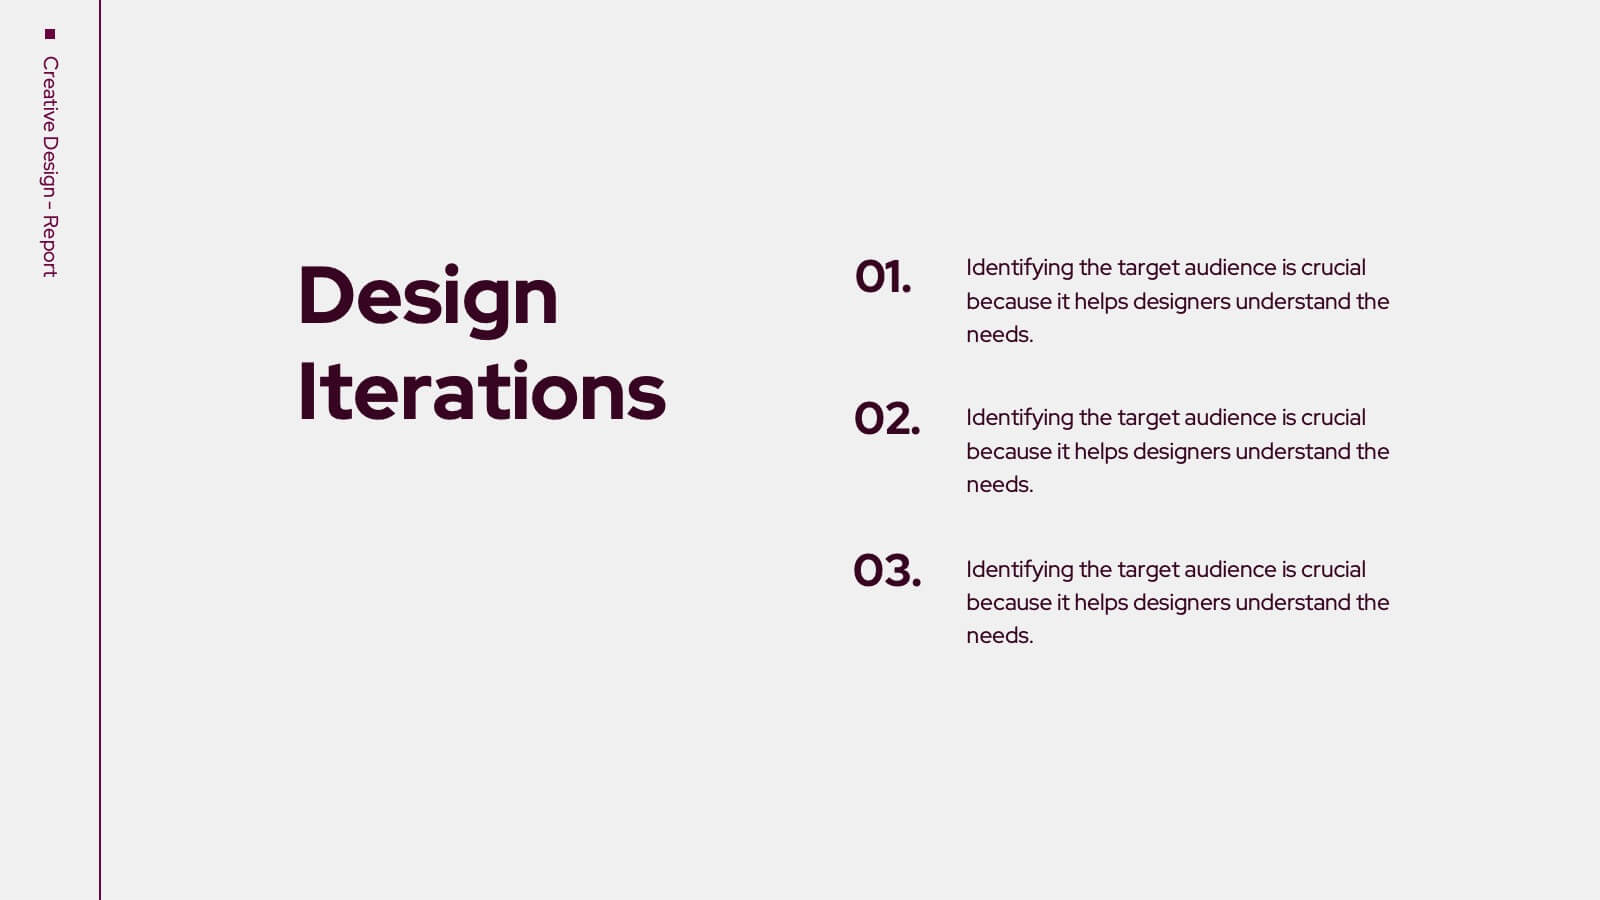
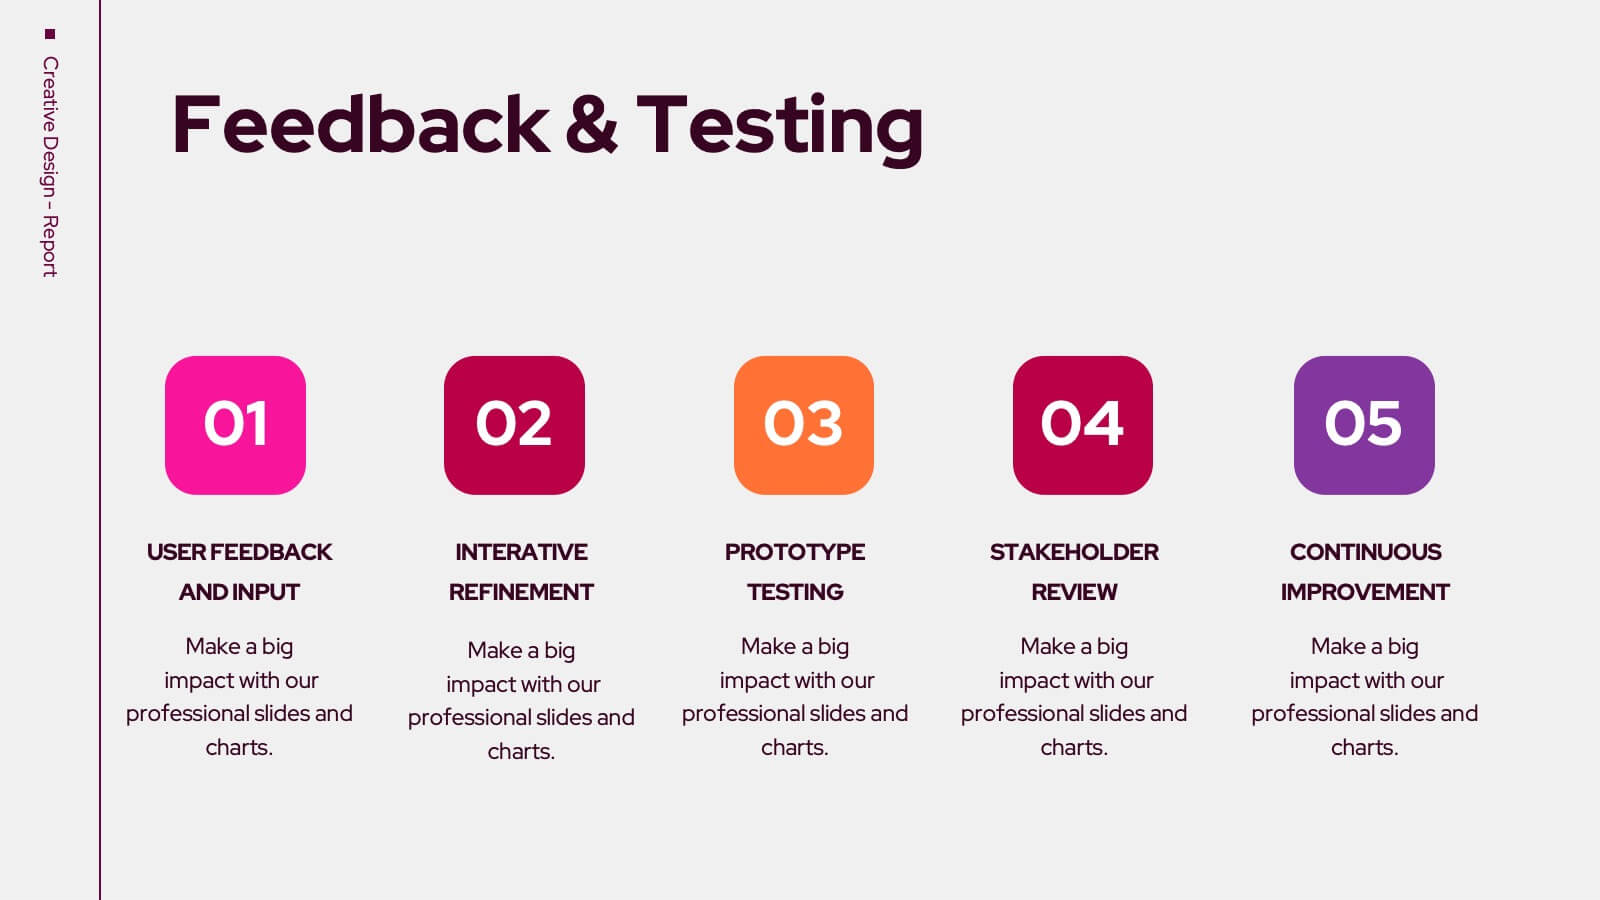
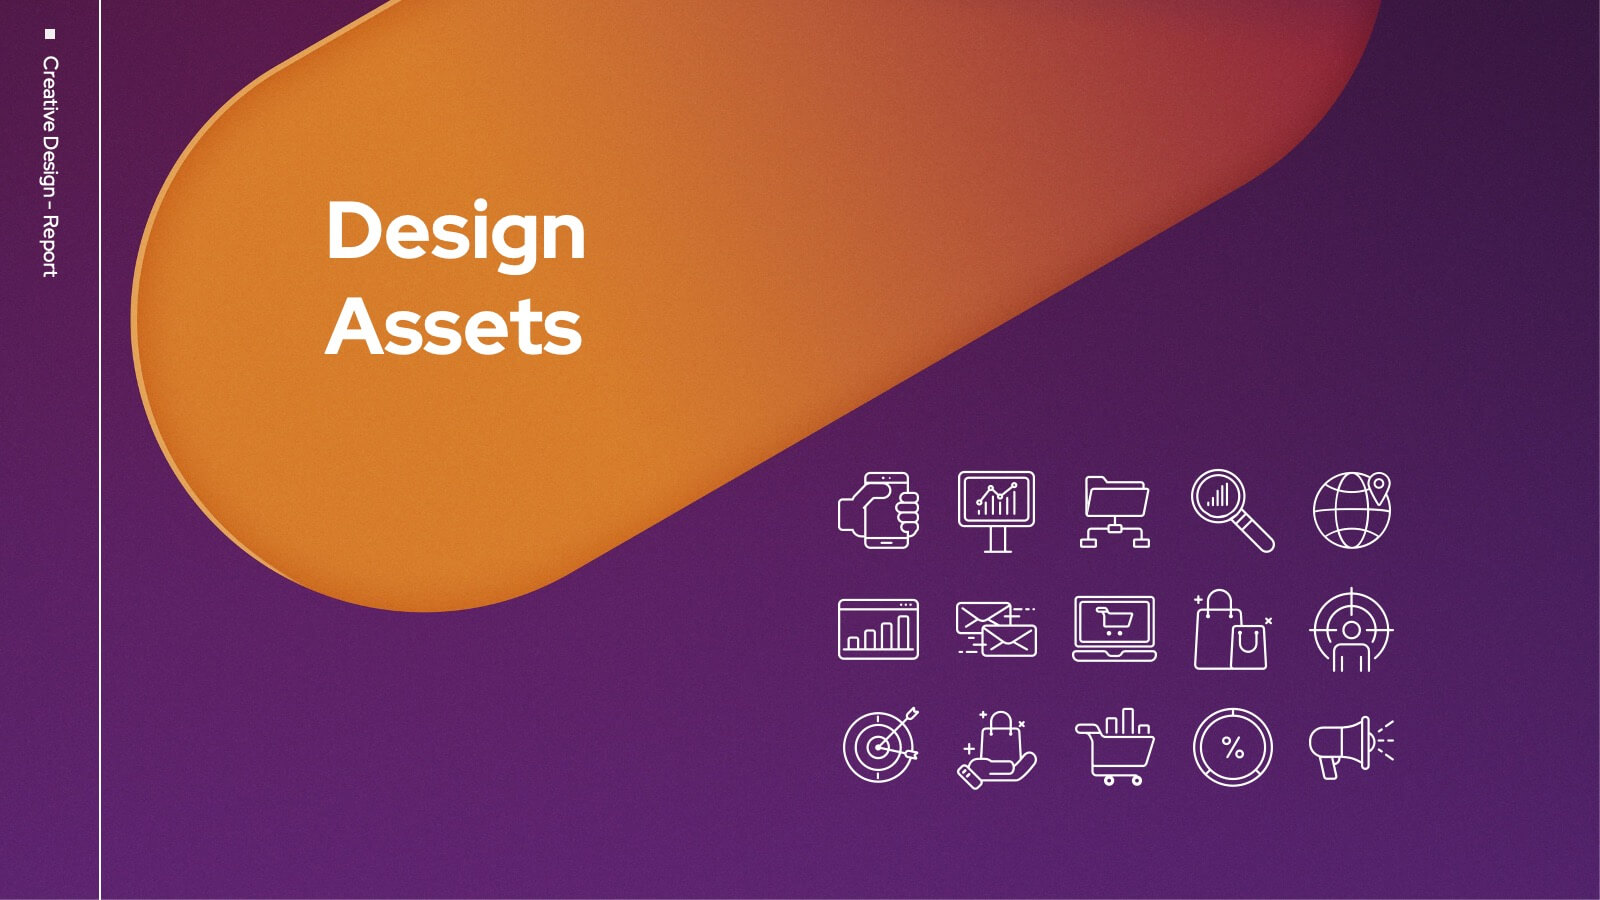
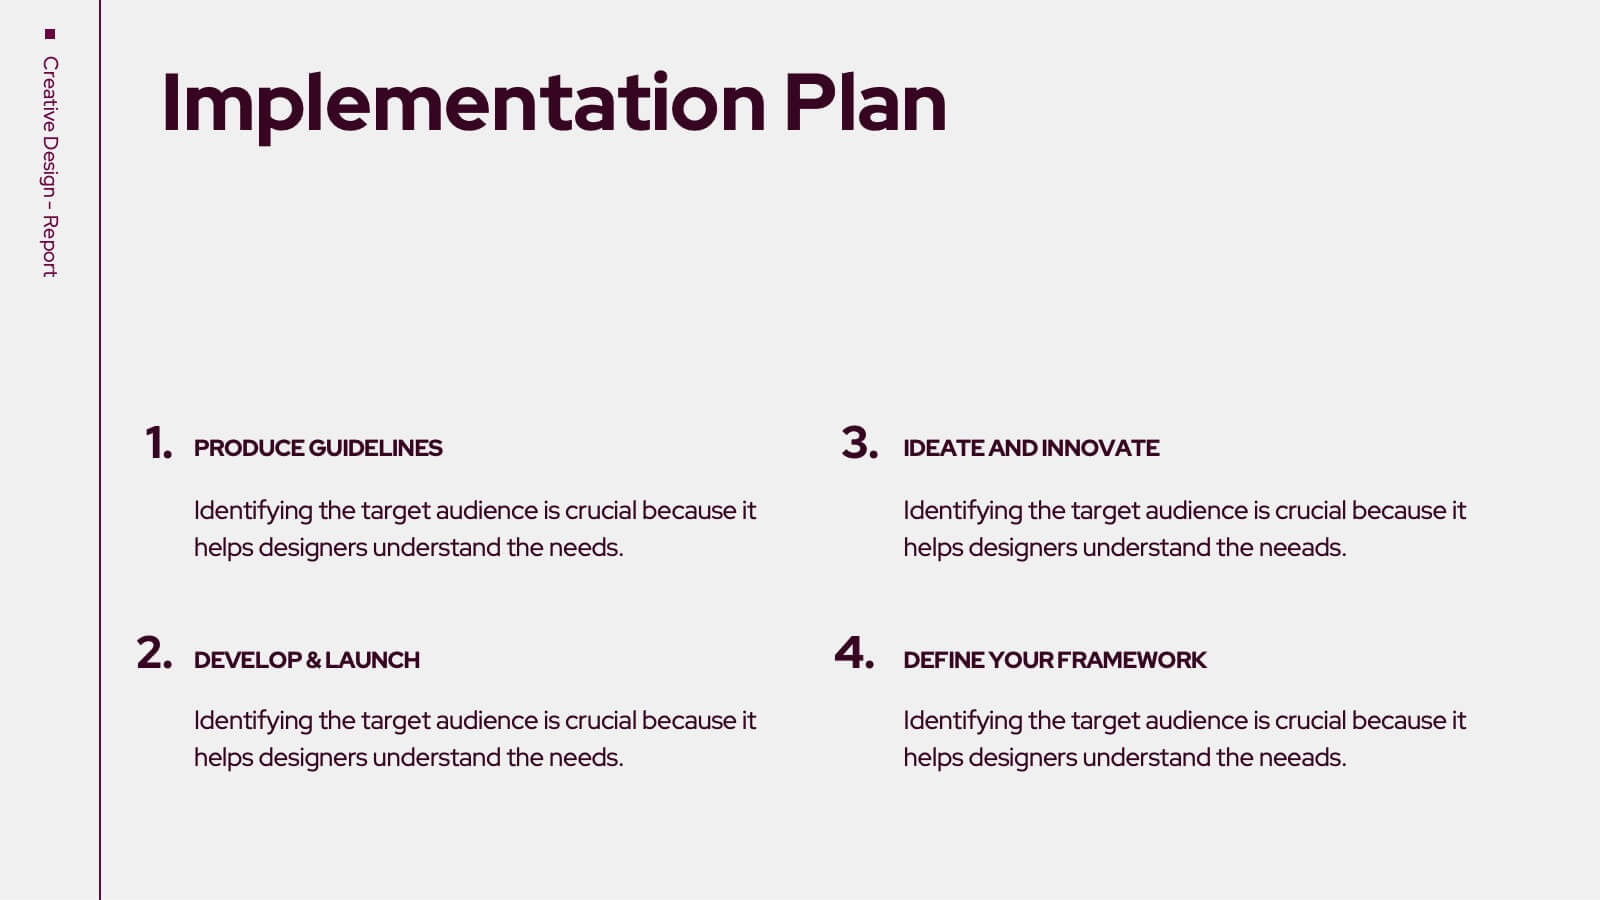
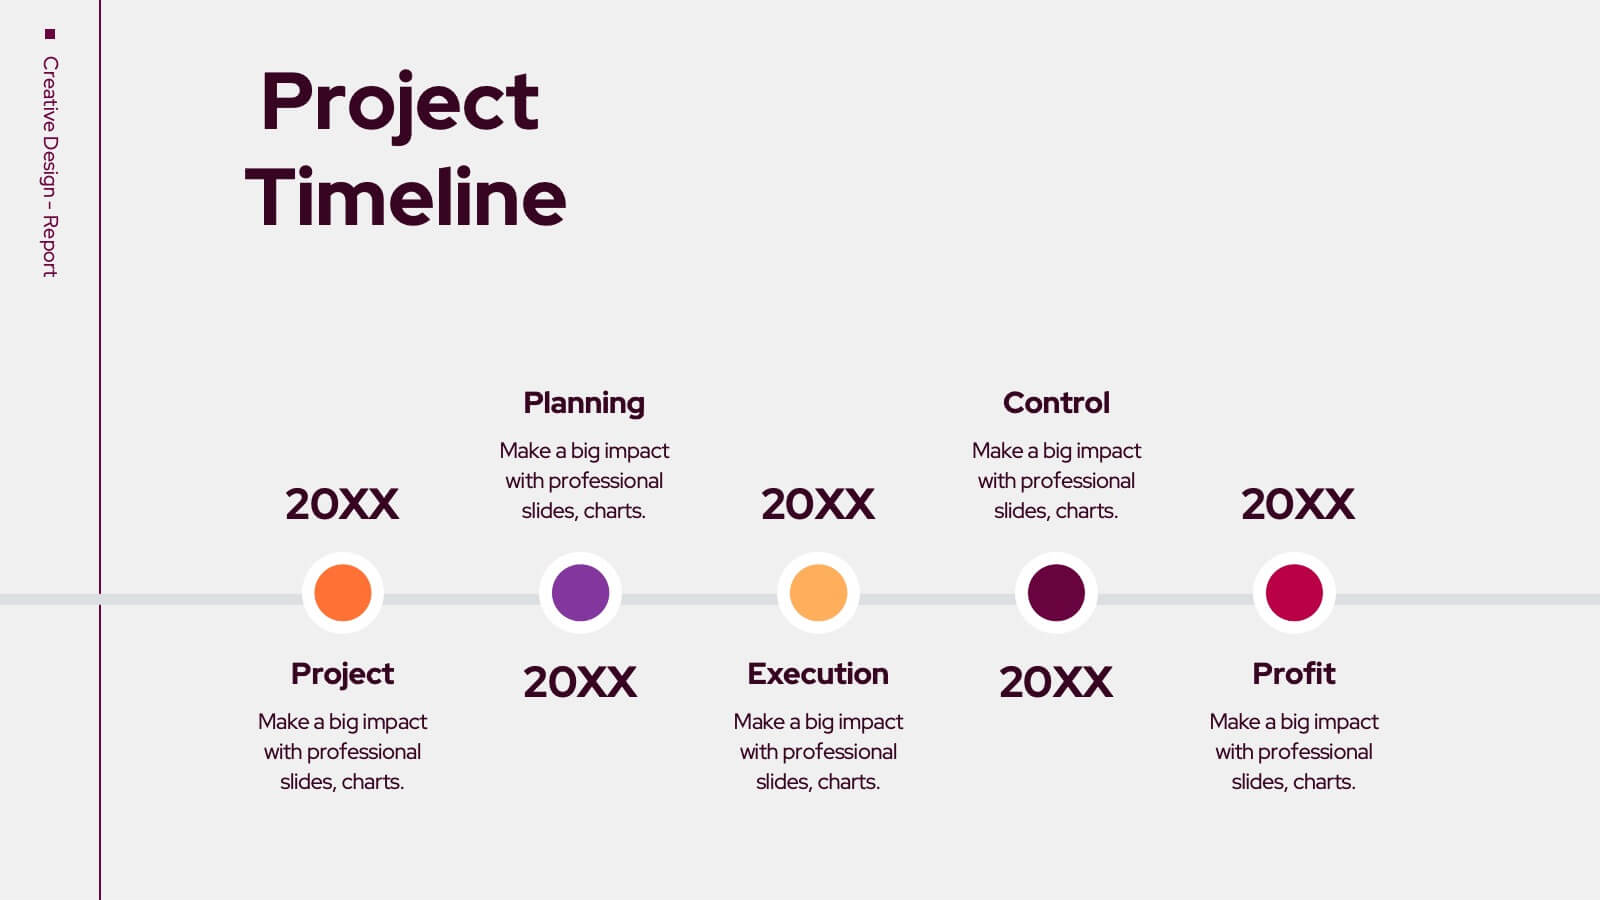
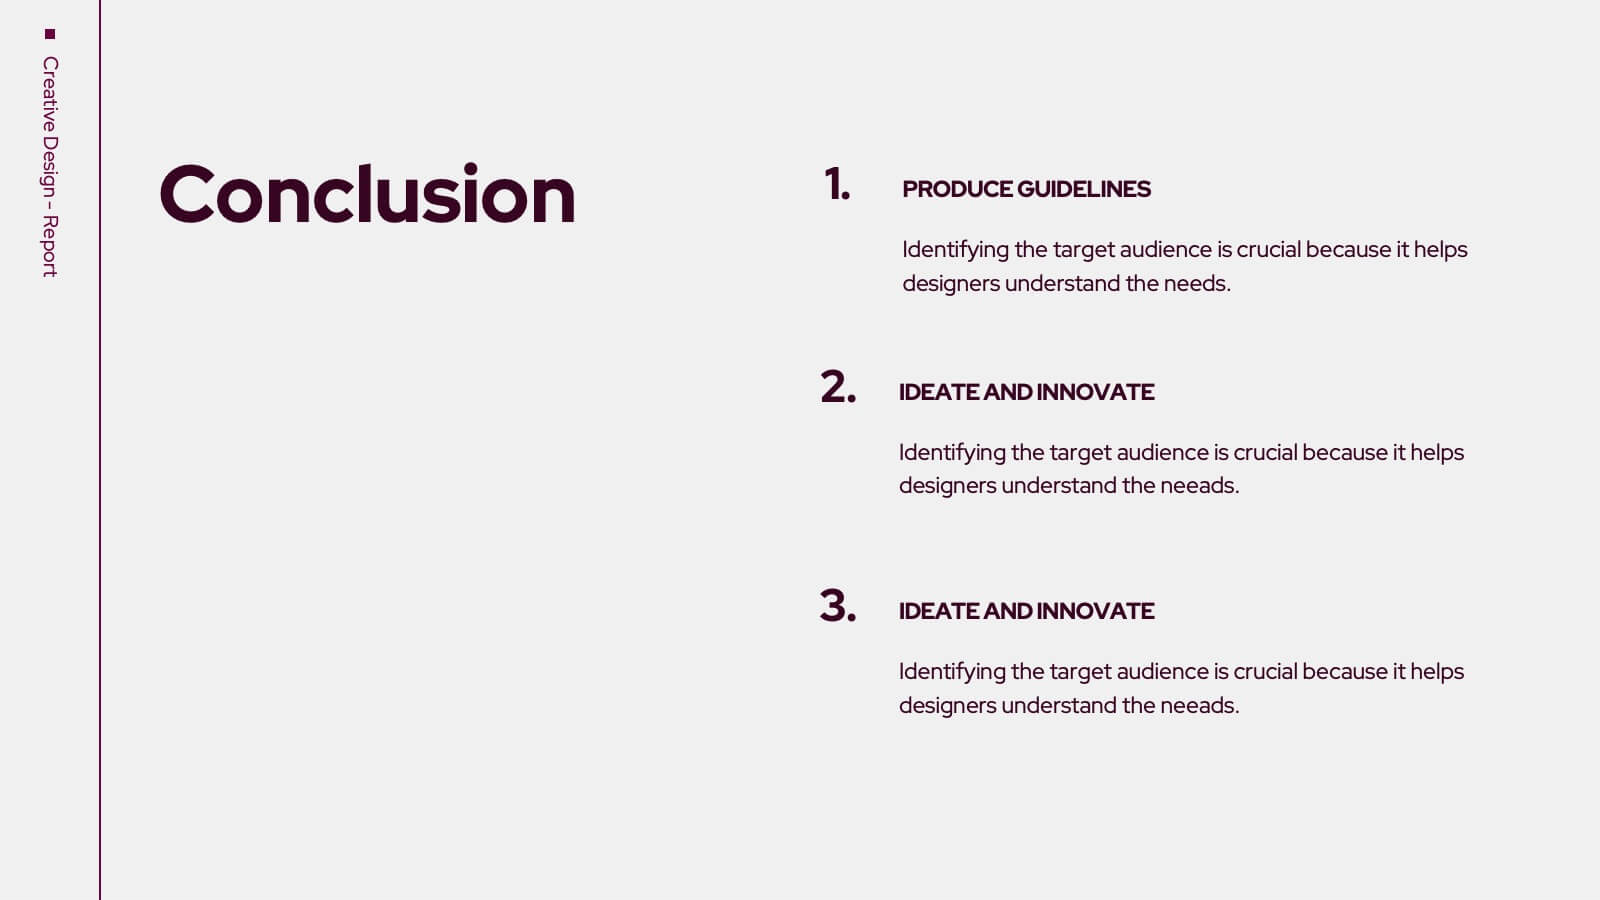
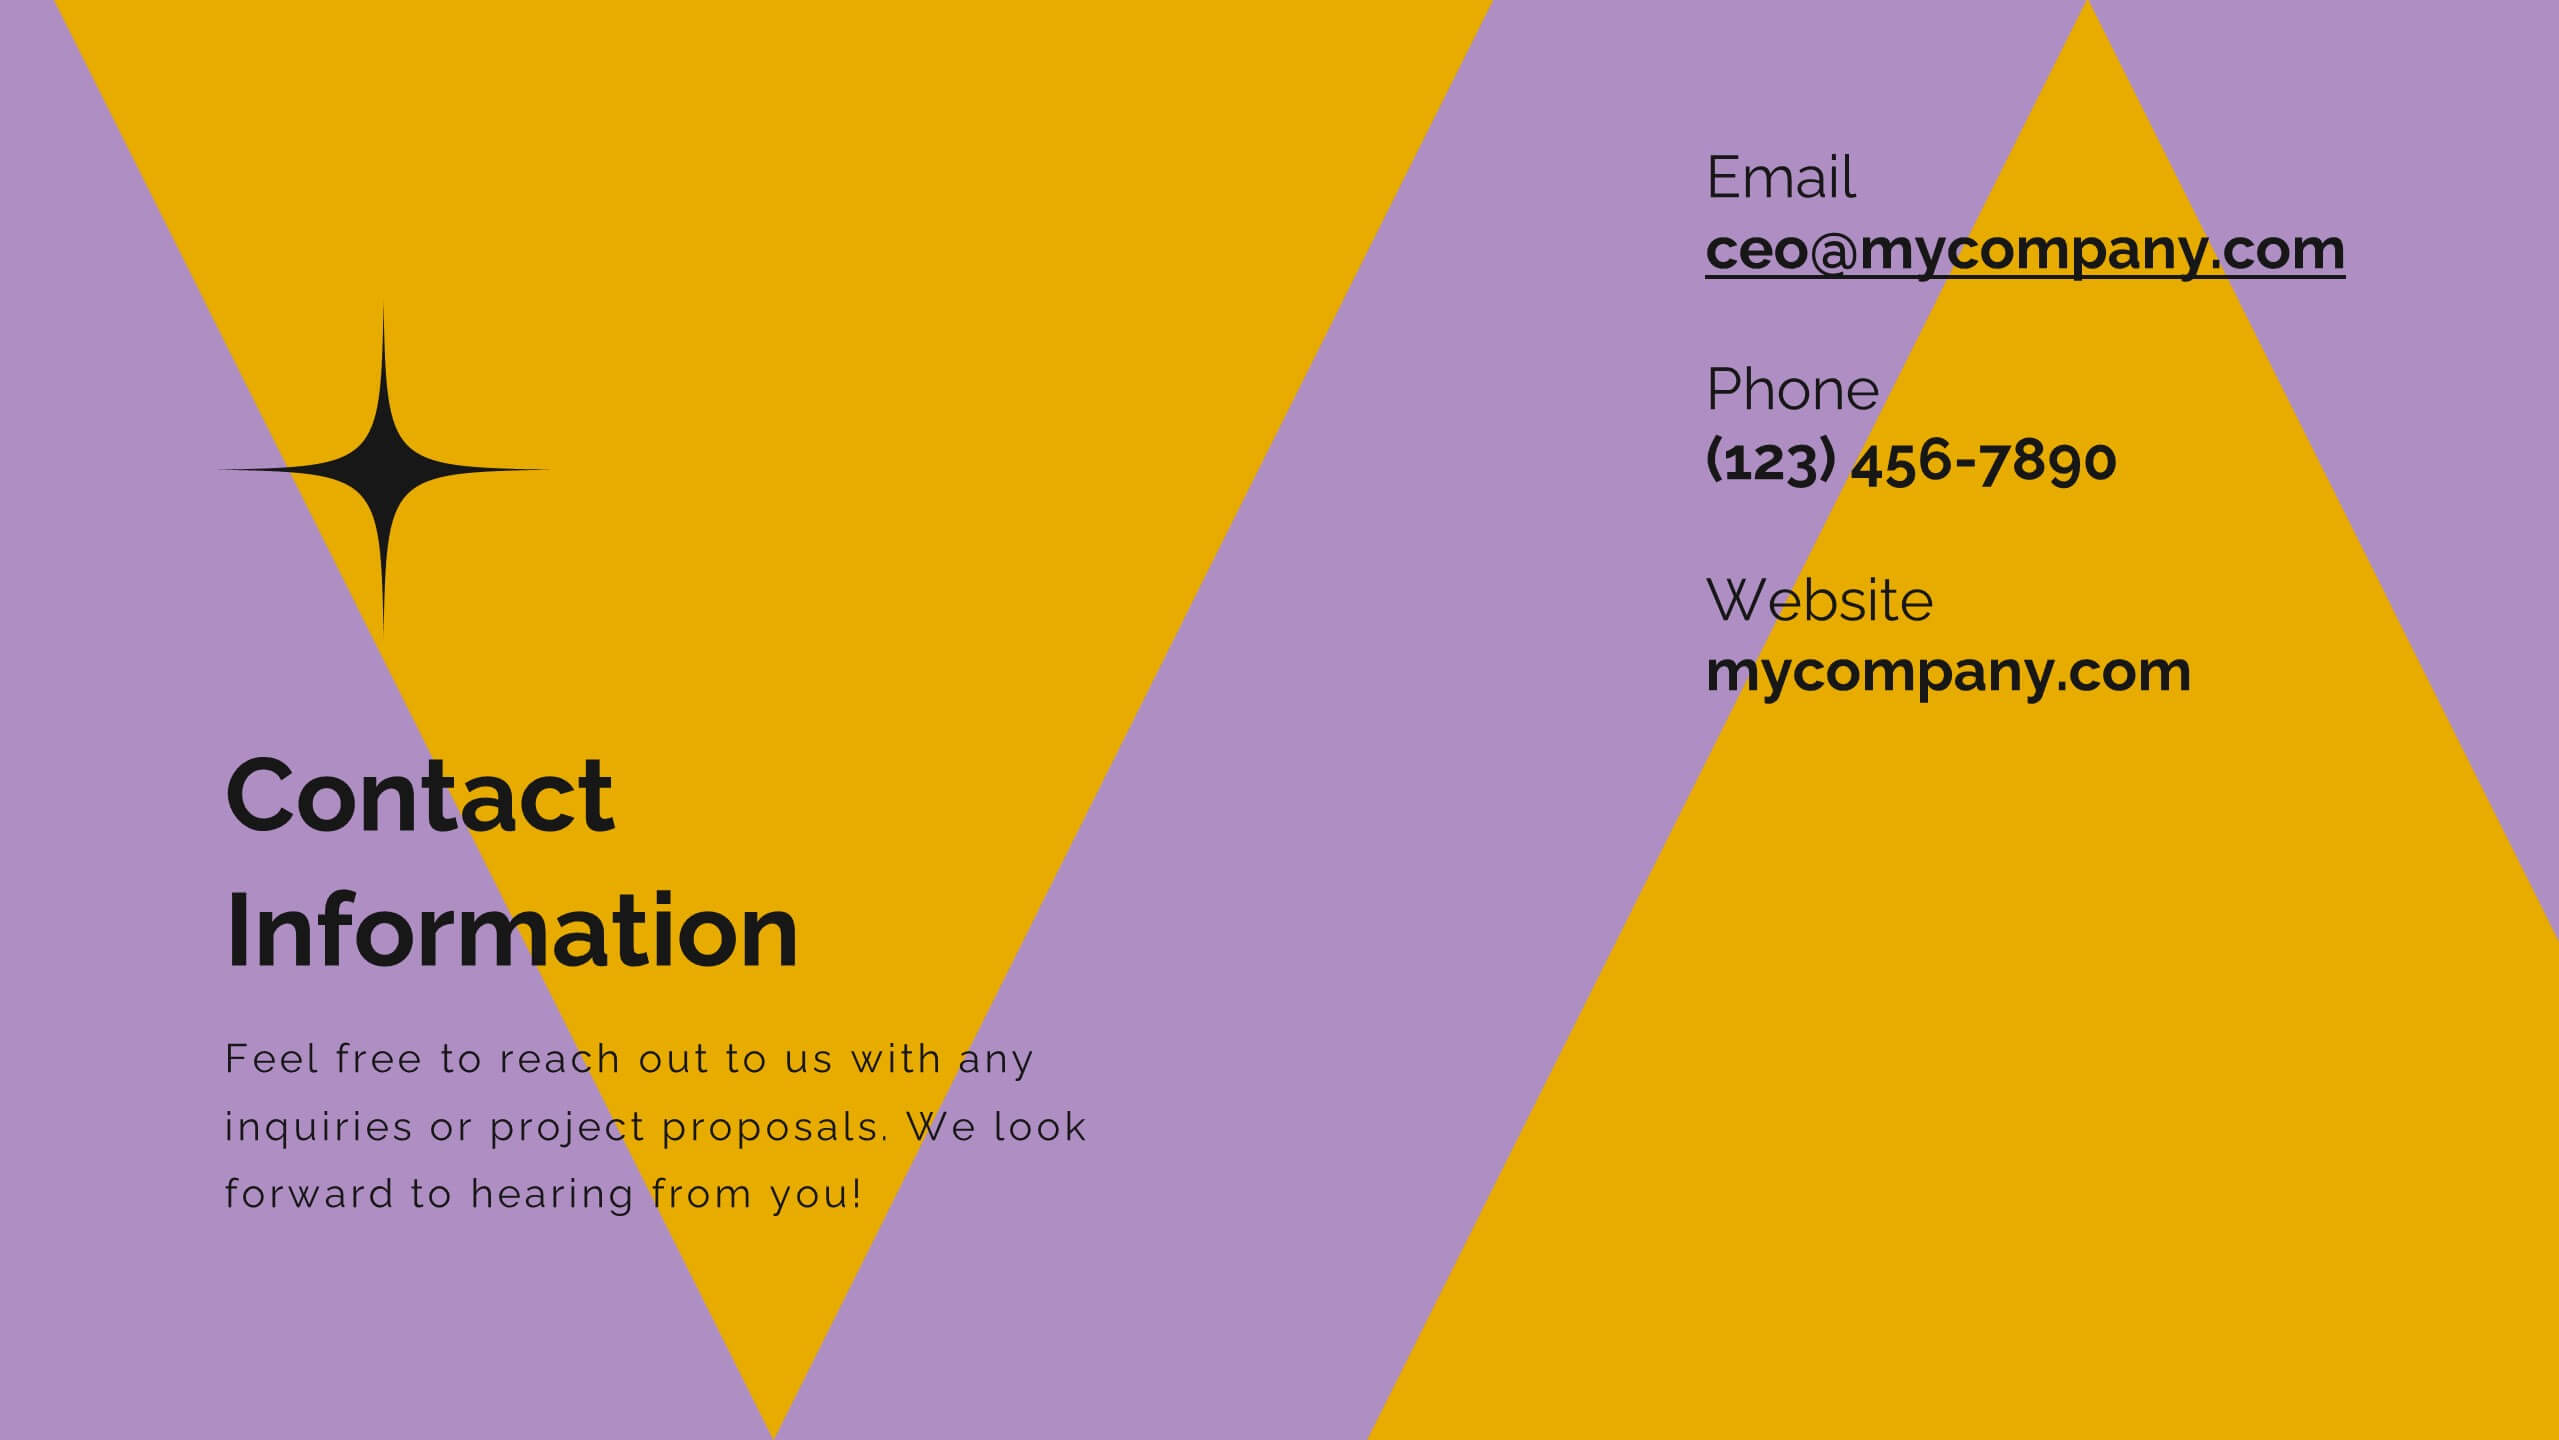
Trojan Creative Design Report Presentation
Unleash your creativity with this striking Trojan-inspired presentation template! Ideal for showcasing your design projects, this presentation enables you to highlight key concepts, inspirations, and visual elements effectively. Its engaging layout ensures your ideas shine through, captivating your audience. Compatible with PowerPoint, Keynote, and Google Slides for seamless presentations.


6 diapositivas
Social Challenges Infographics
Address social challenges effectively with our Social Challenge infographic template. This template is fully compatible with popular presentation software like PowerPoint, Keynote, and Google Slides, allowing you to easily customize it to illustrate and communicate various social challenges and their solutions. The Social Challenge infographic template offers a visually engaging platform to outline the nature of social issues, their impact on communities, and strategies for addressing them. Whether you're an advocate, nonprofit organization, community leader, or simply interested in making a positive impact, this template provides a user-friendly canvas to create informative presentations and educational materials. Raise awareness and promote solutions with this SEO-optimized Social Challenge infographic template, thoughtfully designed for clarity and ease of use. Customize it to showcase specific social challenges, statistics, success stories, and calls to action, ensuring that your audience gains a comprehensive understanding of the issue at hand. Start crafting your personalized infographic today to contribute to positive change in society.


5 diapositivas
SMART Objective Planning for Success Presentation
Turn your goal-setting process into a clear, actionable strategy with this SMART Objective Planning slide. Designed around the SMART framework—Specific, Measurable, Achievable, Relevant, Time-bound—this layout helps you articulate objectives with clarity and focus. Each segment features a bold letter with icons and editable descriptions beneath. Ideal for planning sessions, strategic reviews, and team alignment meetings. Compatible with PowerPoint, Keynote, and Google Slides.


5 diapositivas
Data-Driven Business Statistics
Visualize insights and percentages with this dynamic, data-driven infographic layout. Ideal for illustrating business progress, KPIs, and performance highlights. This editable template is fully compatible with PowerPoint, Keynote, and Google Slides, allowing you to tailor it effortlessly to fit your corporate style and messaging.


6 diapositivas
Internal Communication Framework Presentation
Foster stronger collaboration with this visual internal communication framework template. Ideal for showcasing how information flows within departments, this layout helps clarify messaging channels, responsibilities, and feedback loops. Whether you're streamlining communication strategies or presenting team structures, it’s fully editable and works seamlessly with PowerPoint, Keynote, and Google Slides.


20 diapositivas
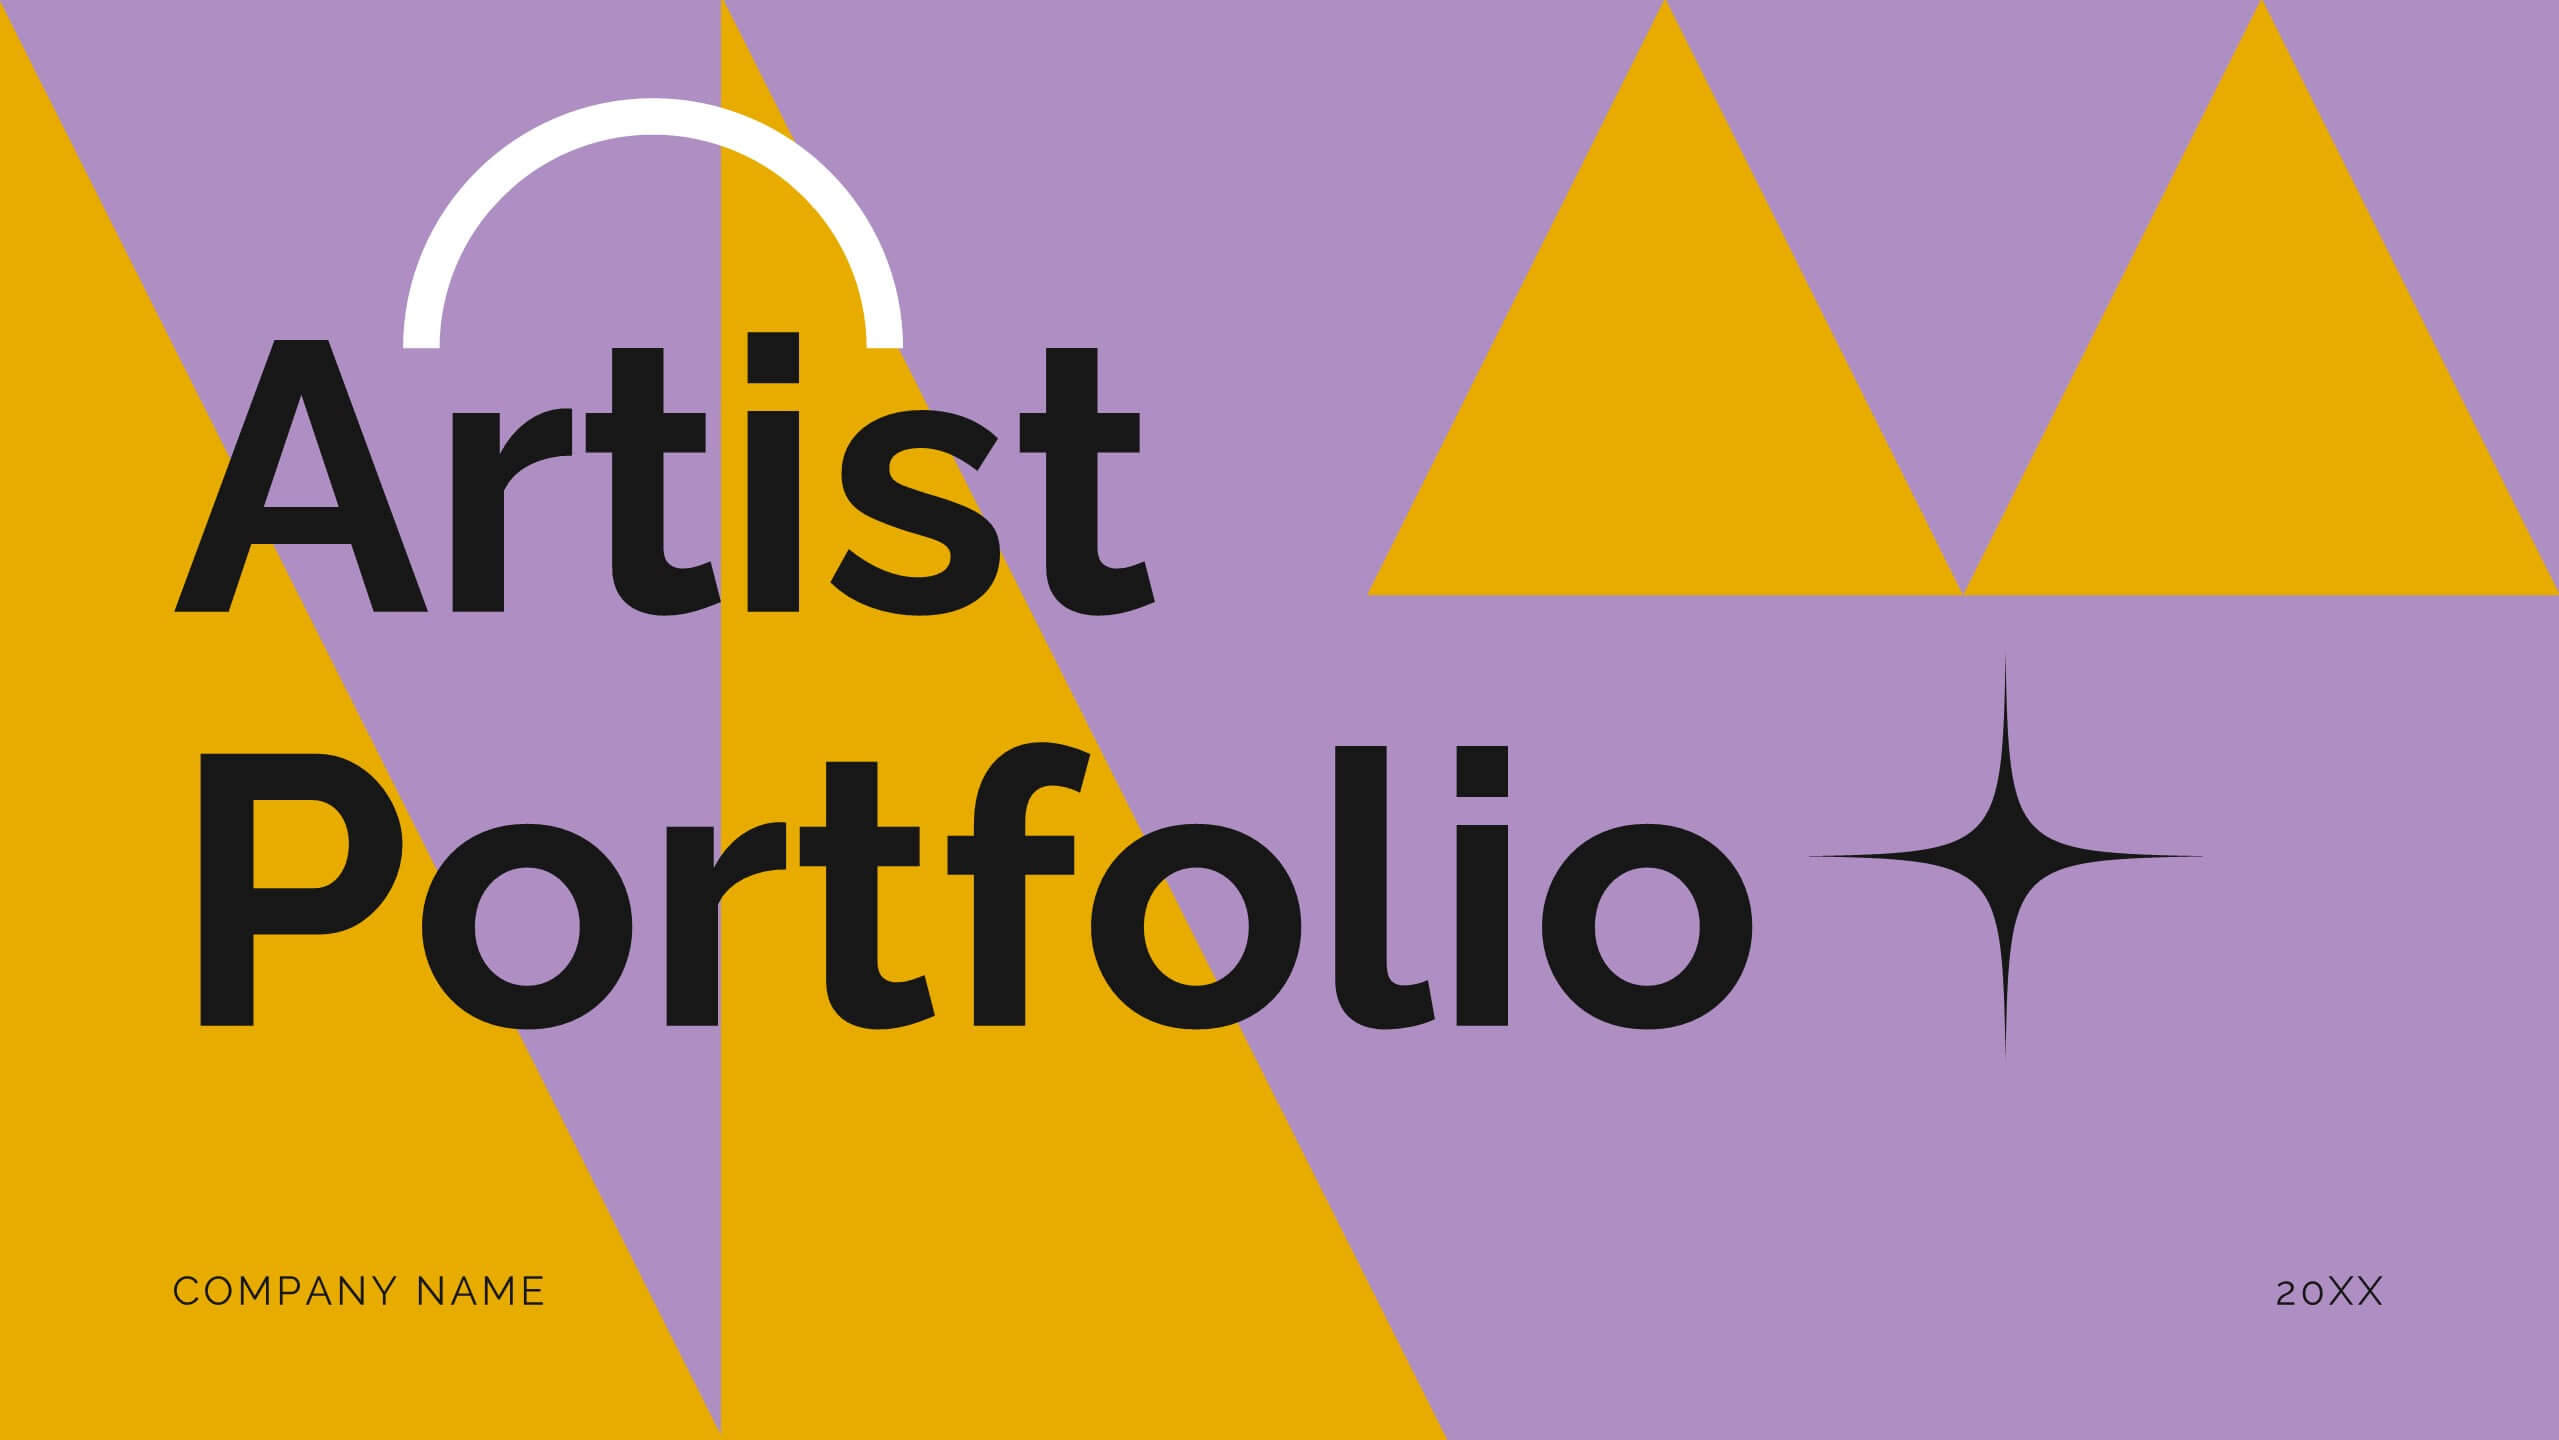
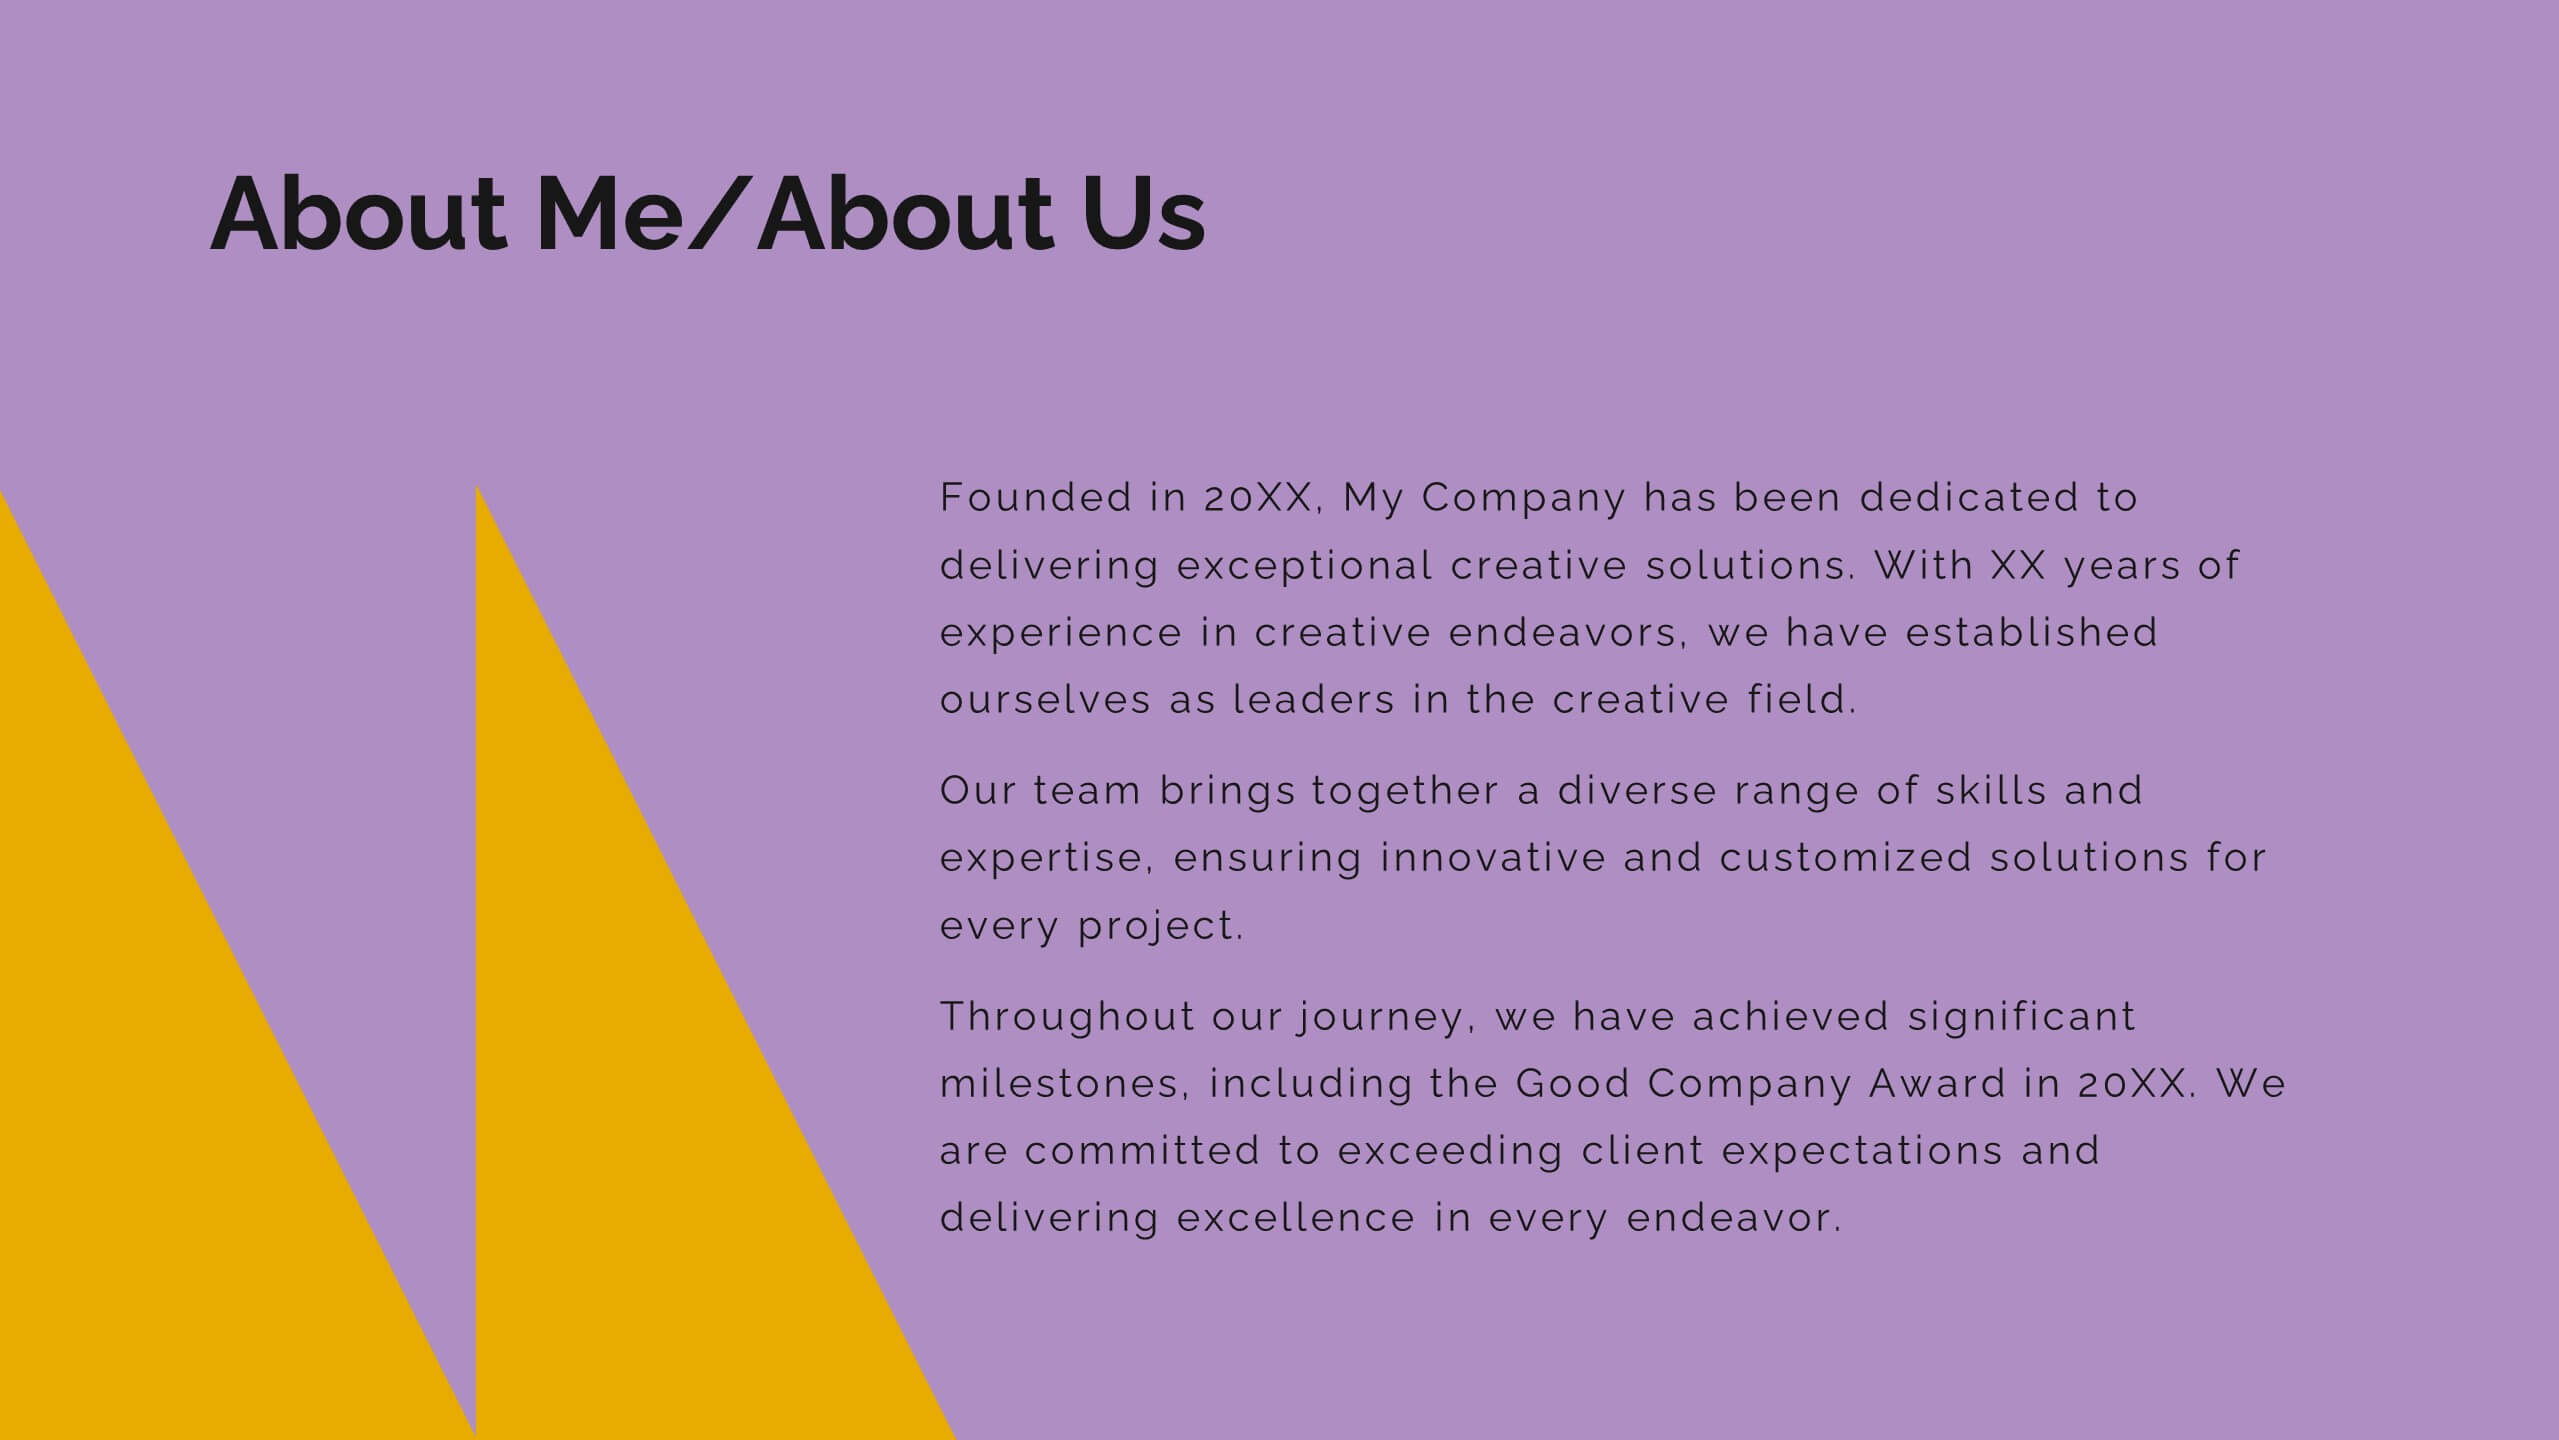
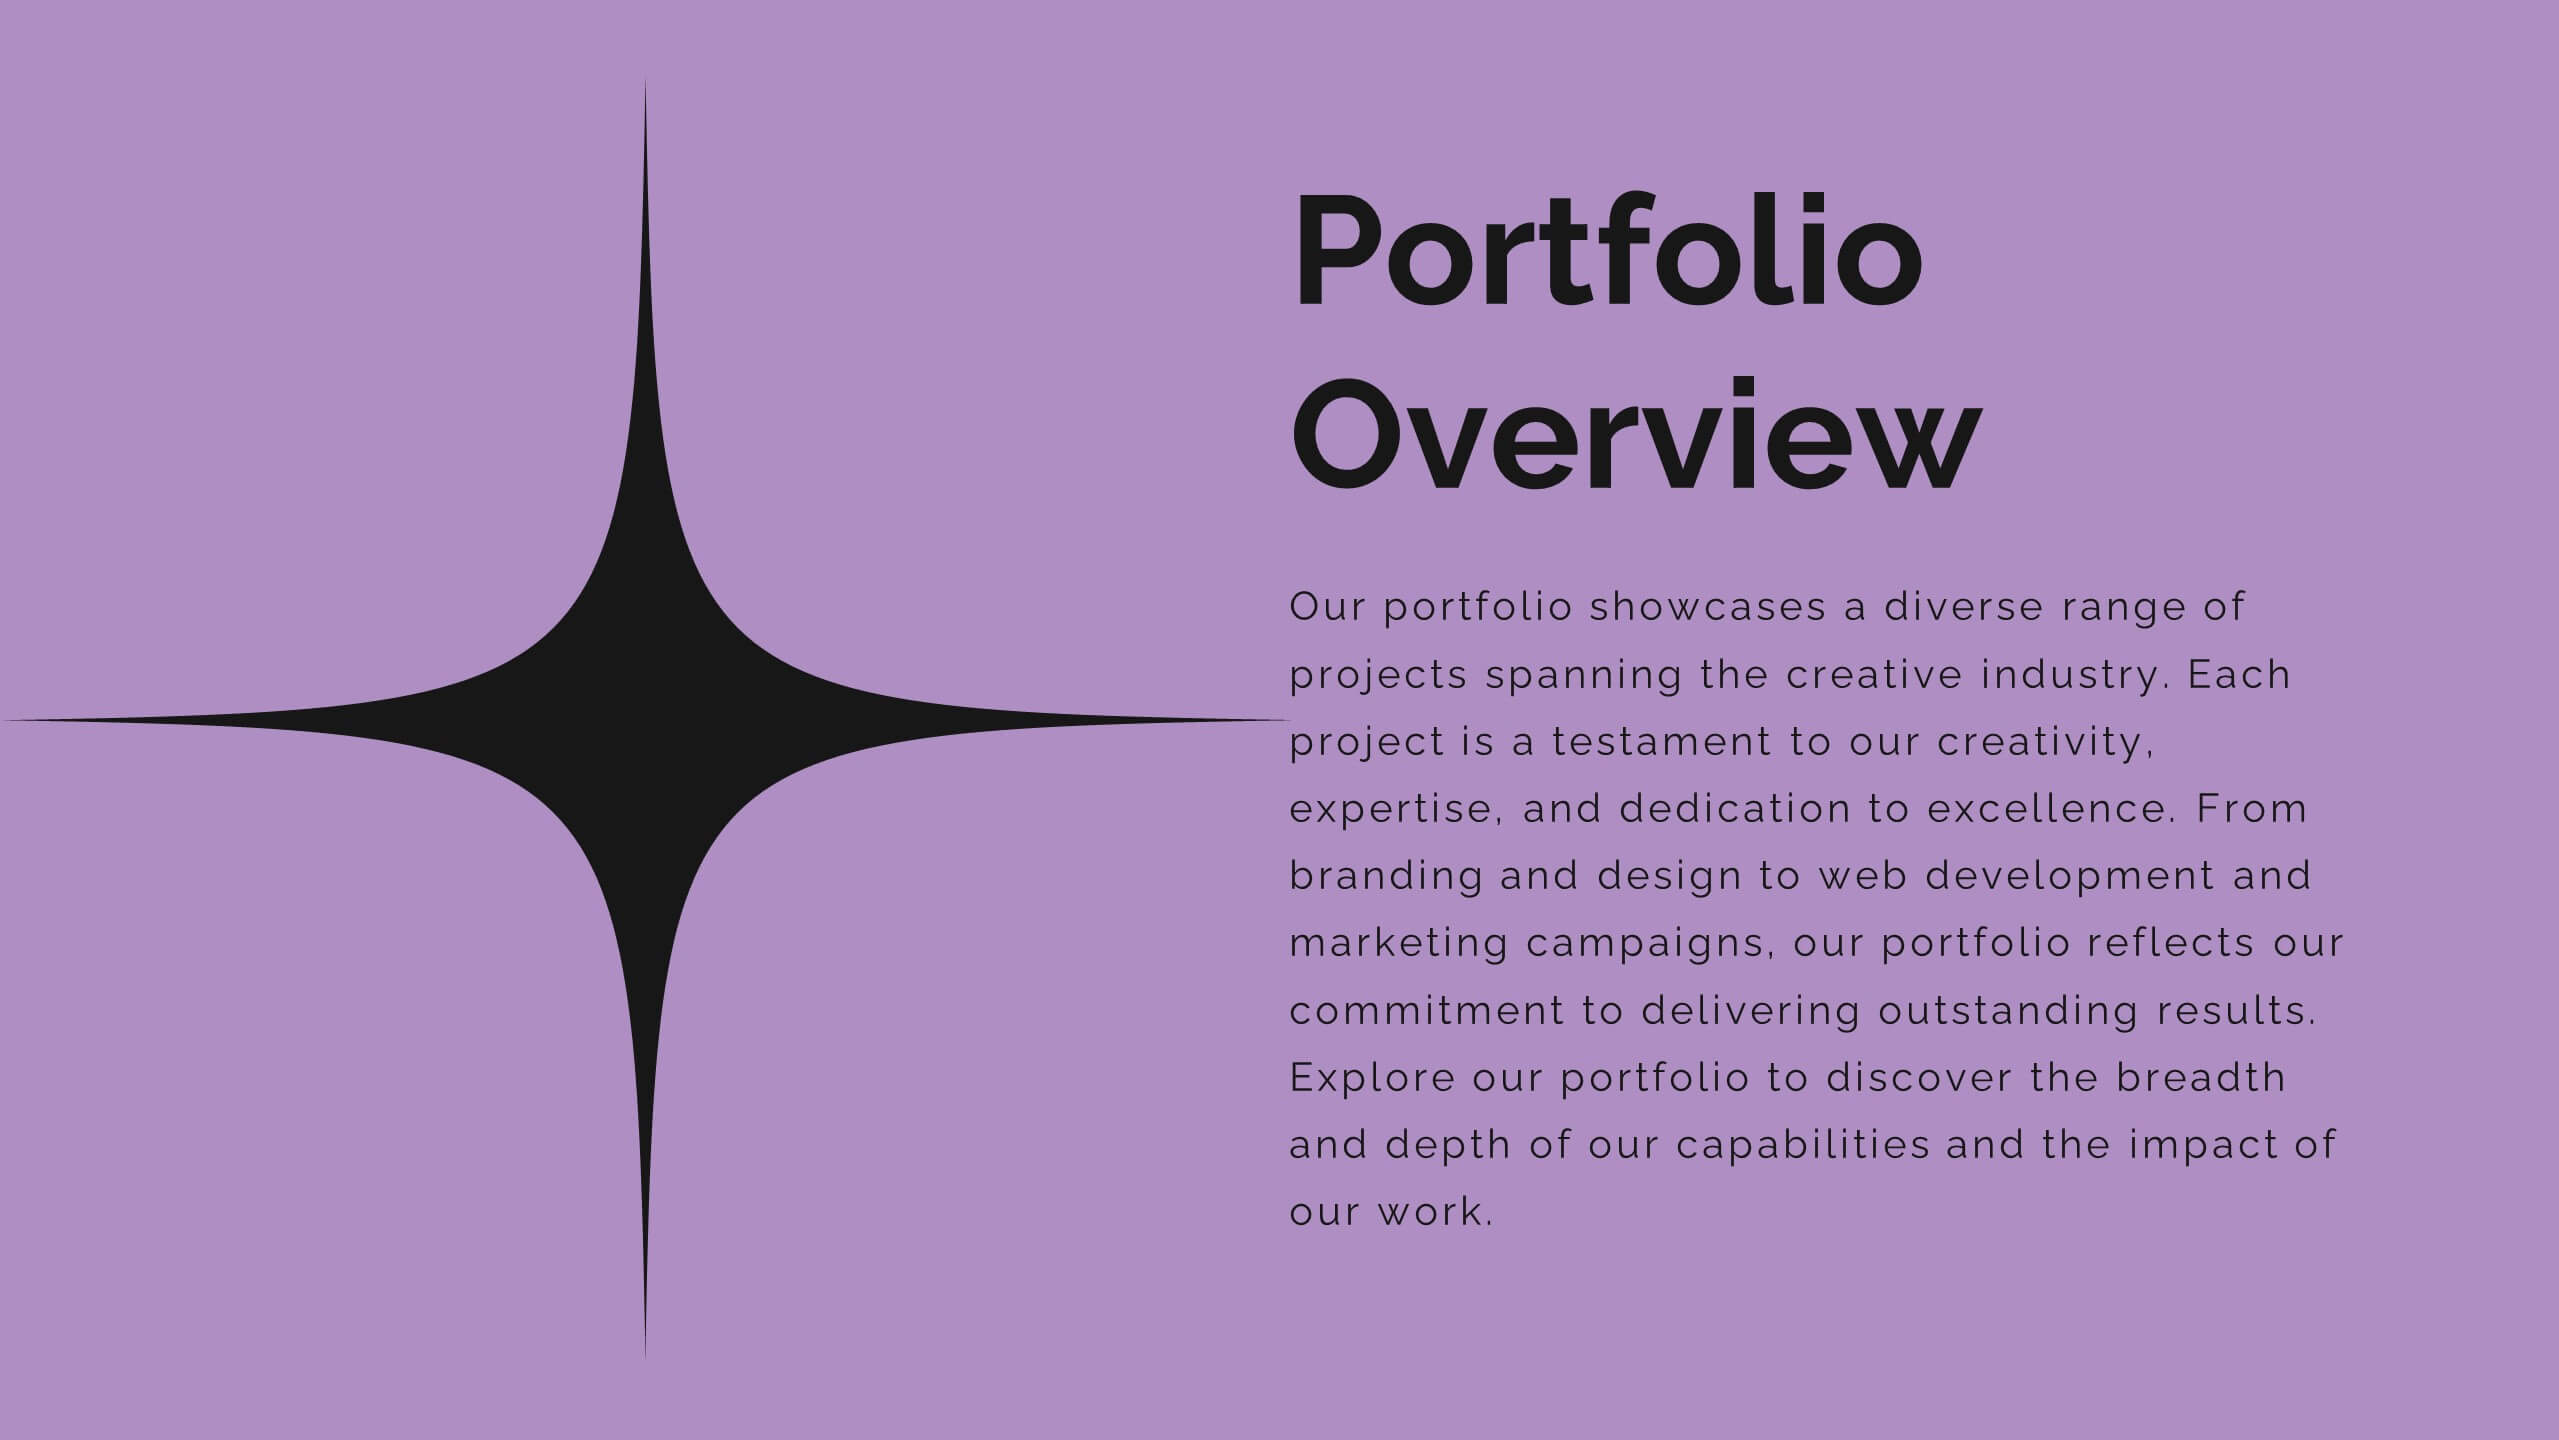
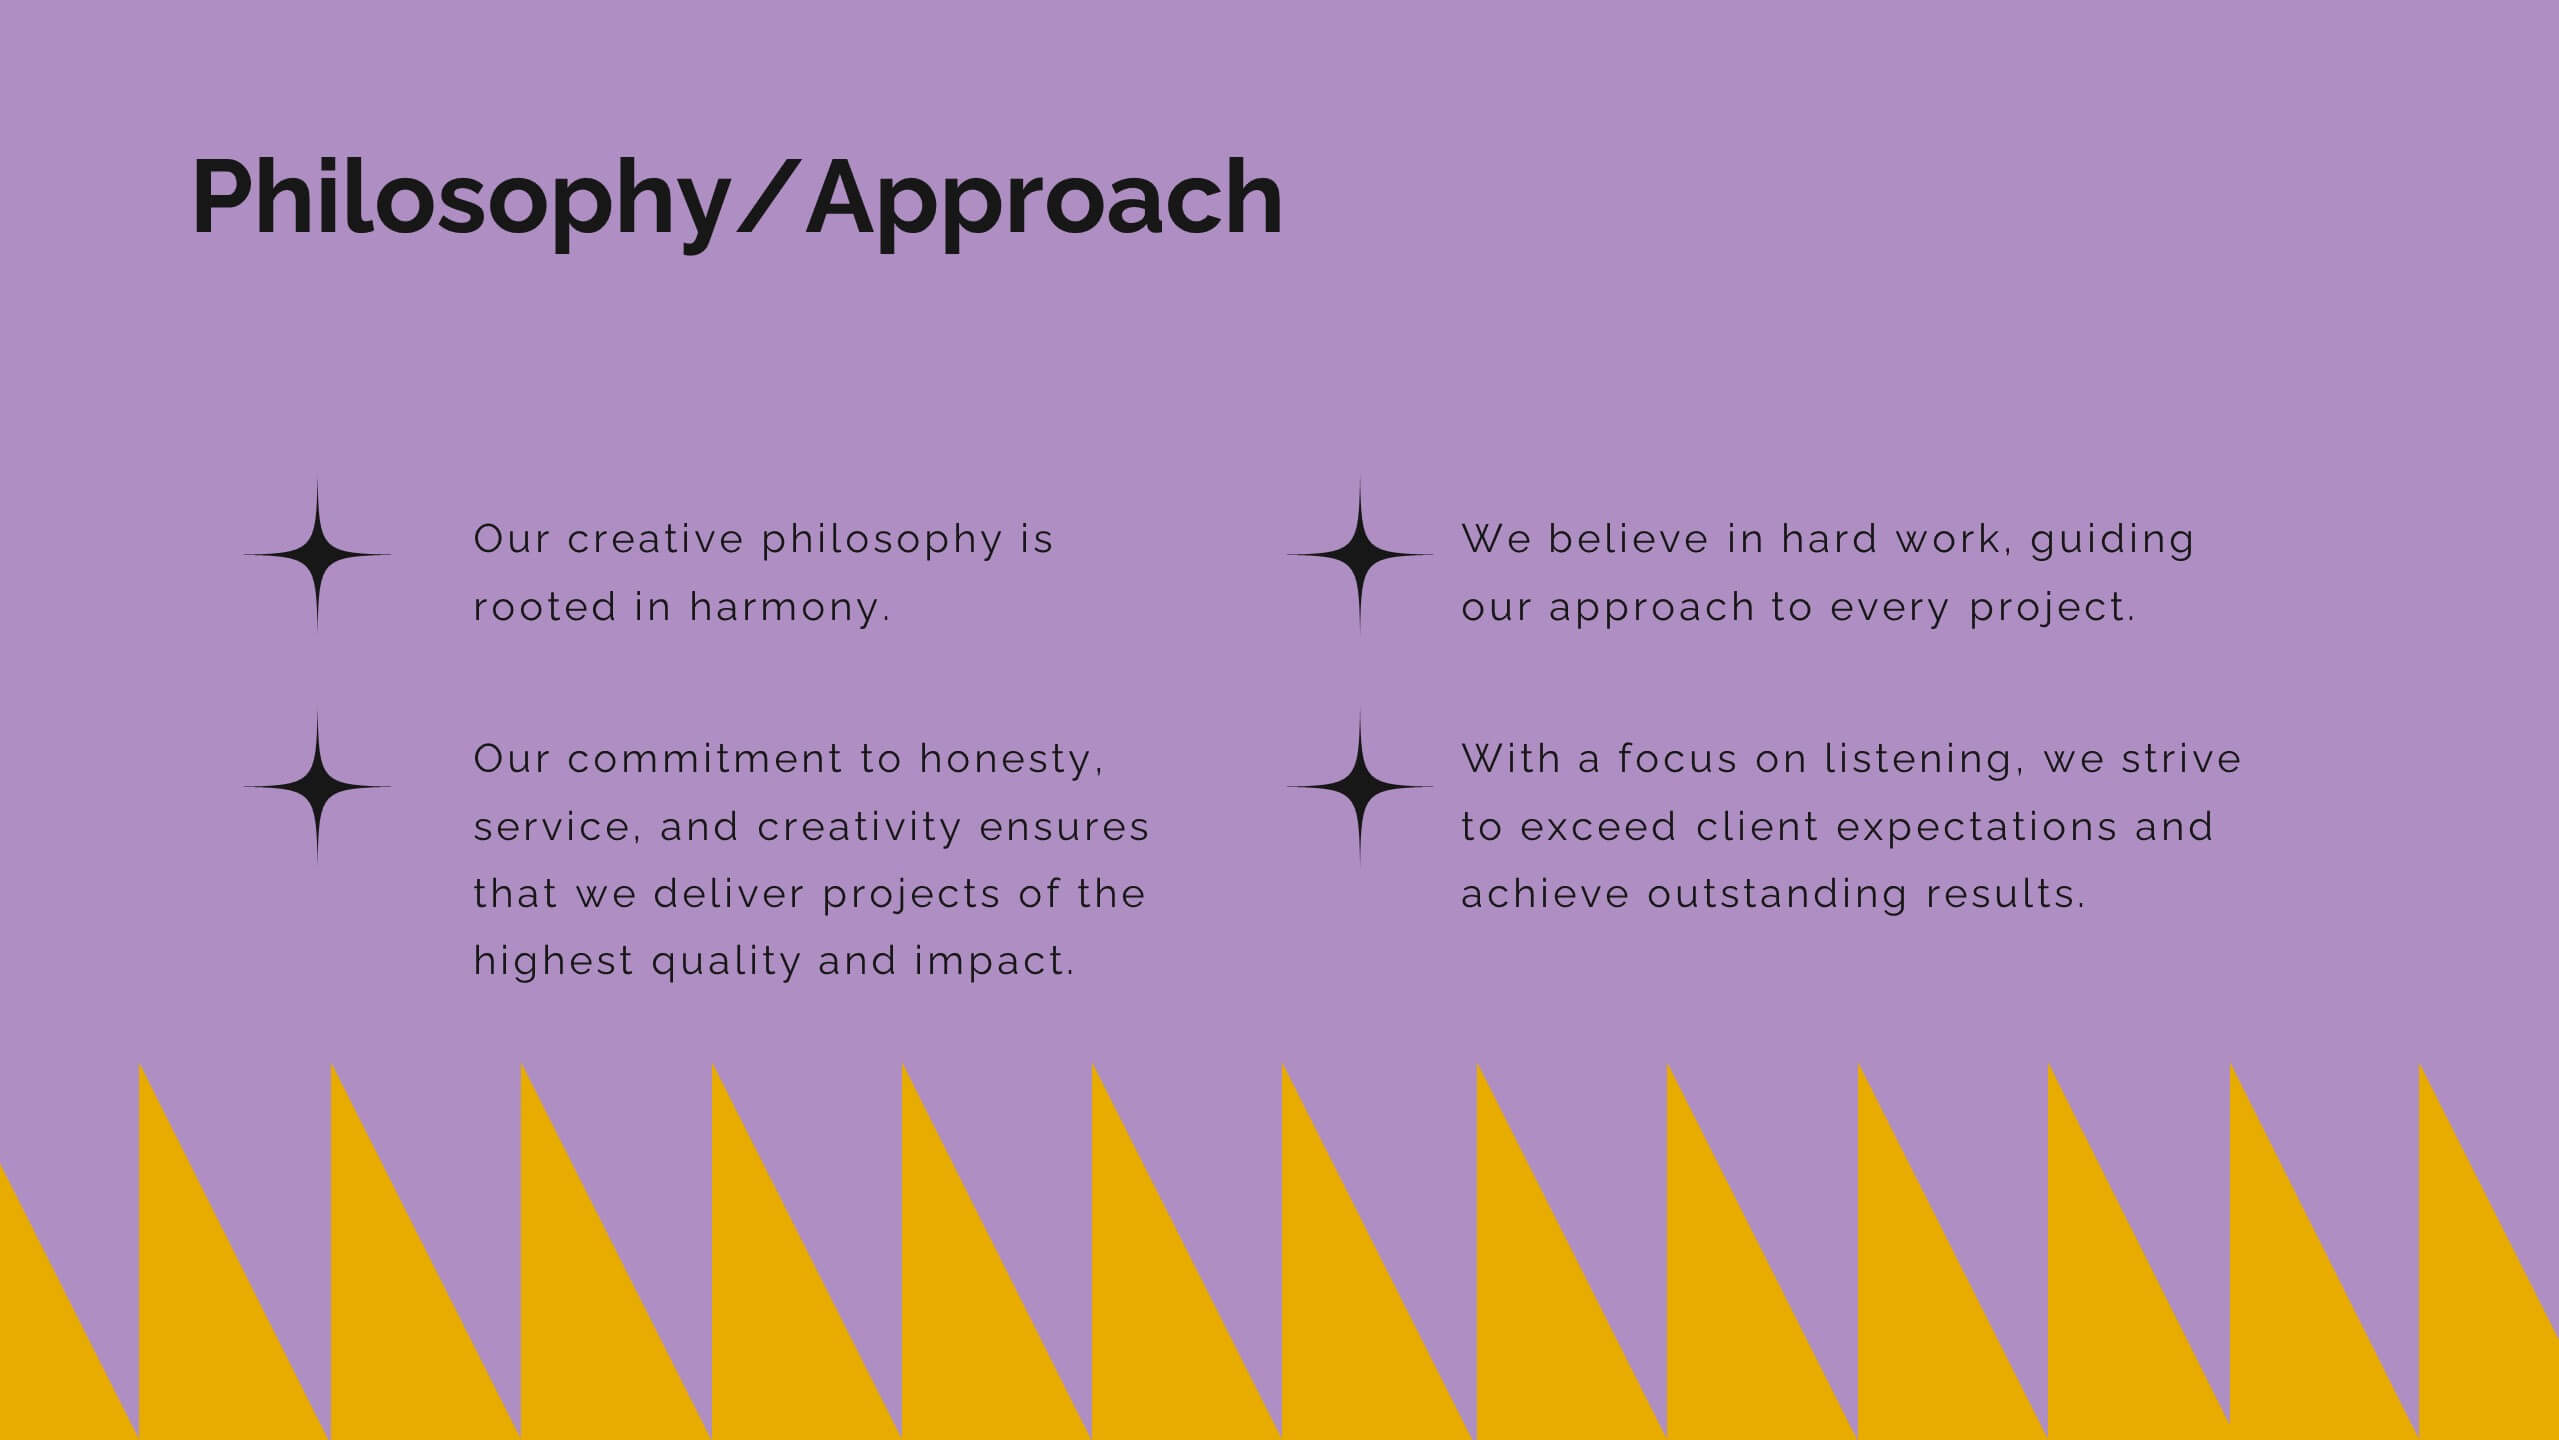
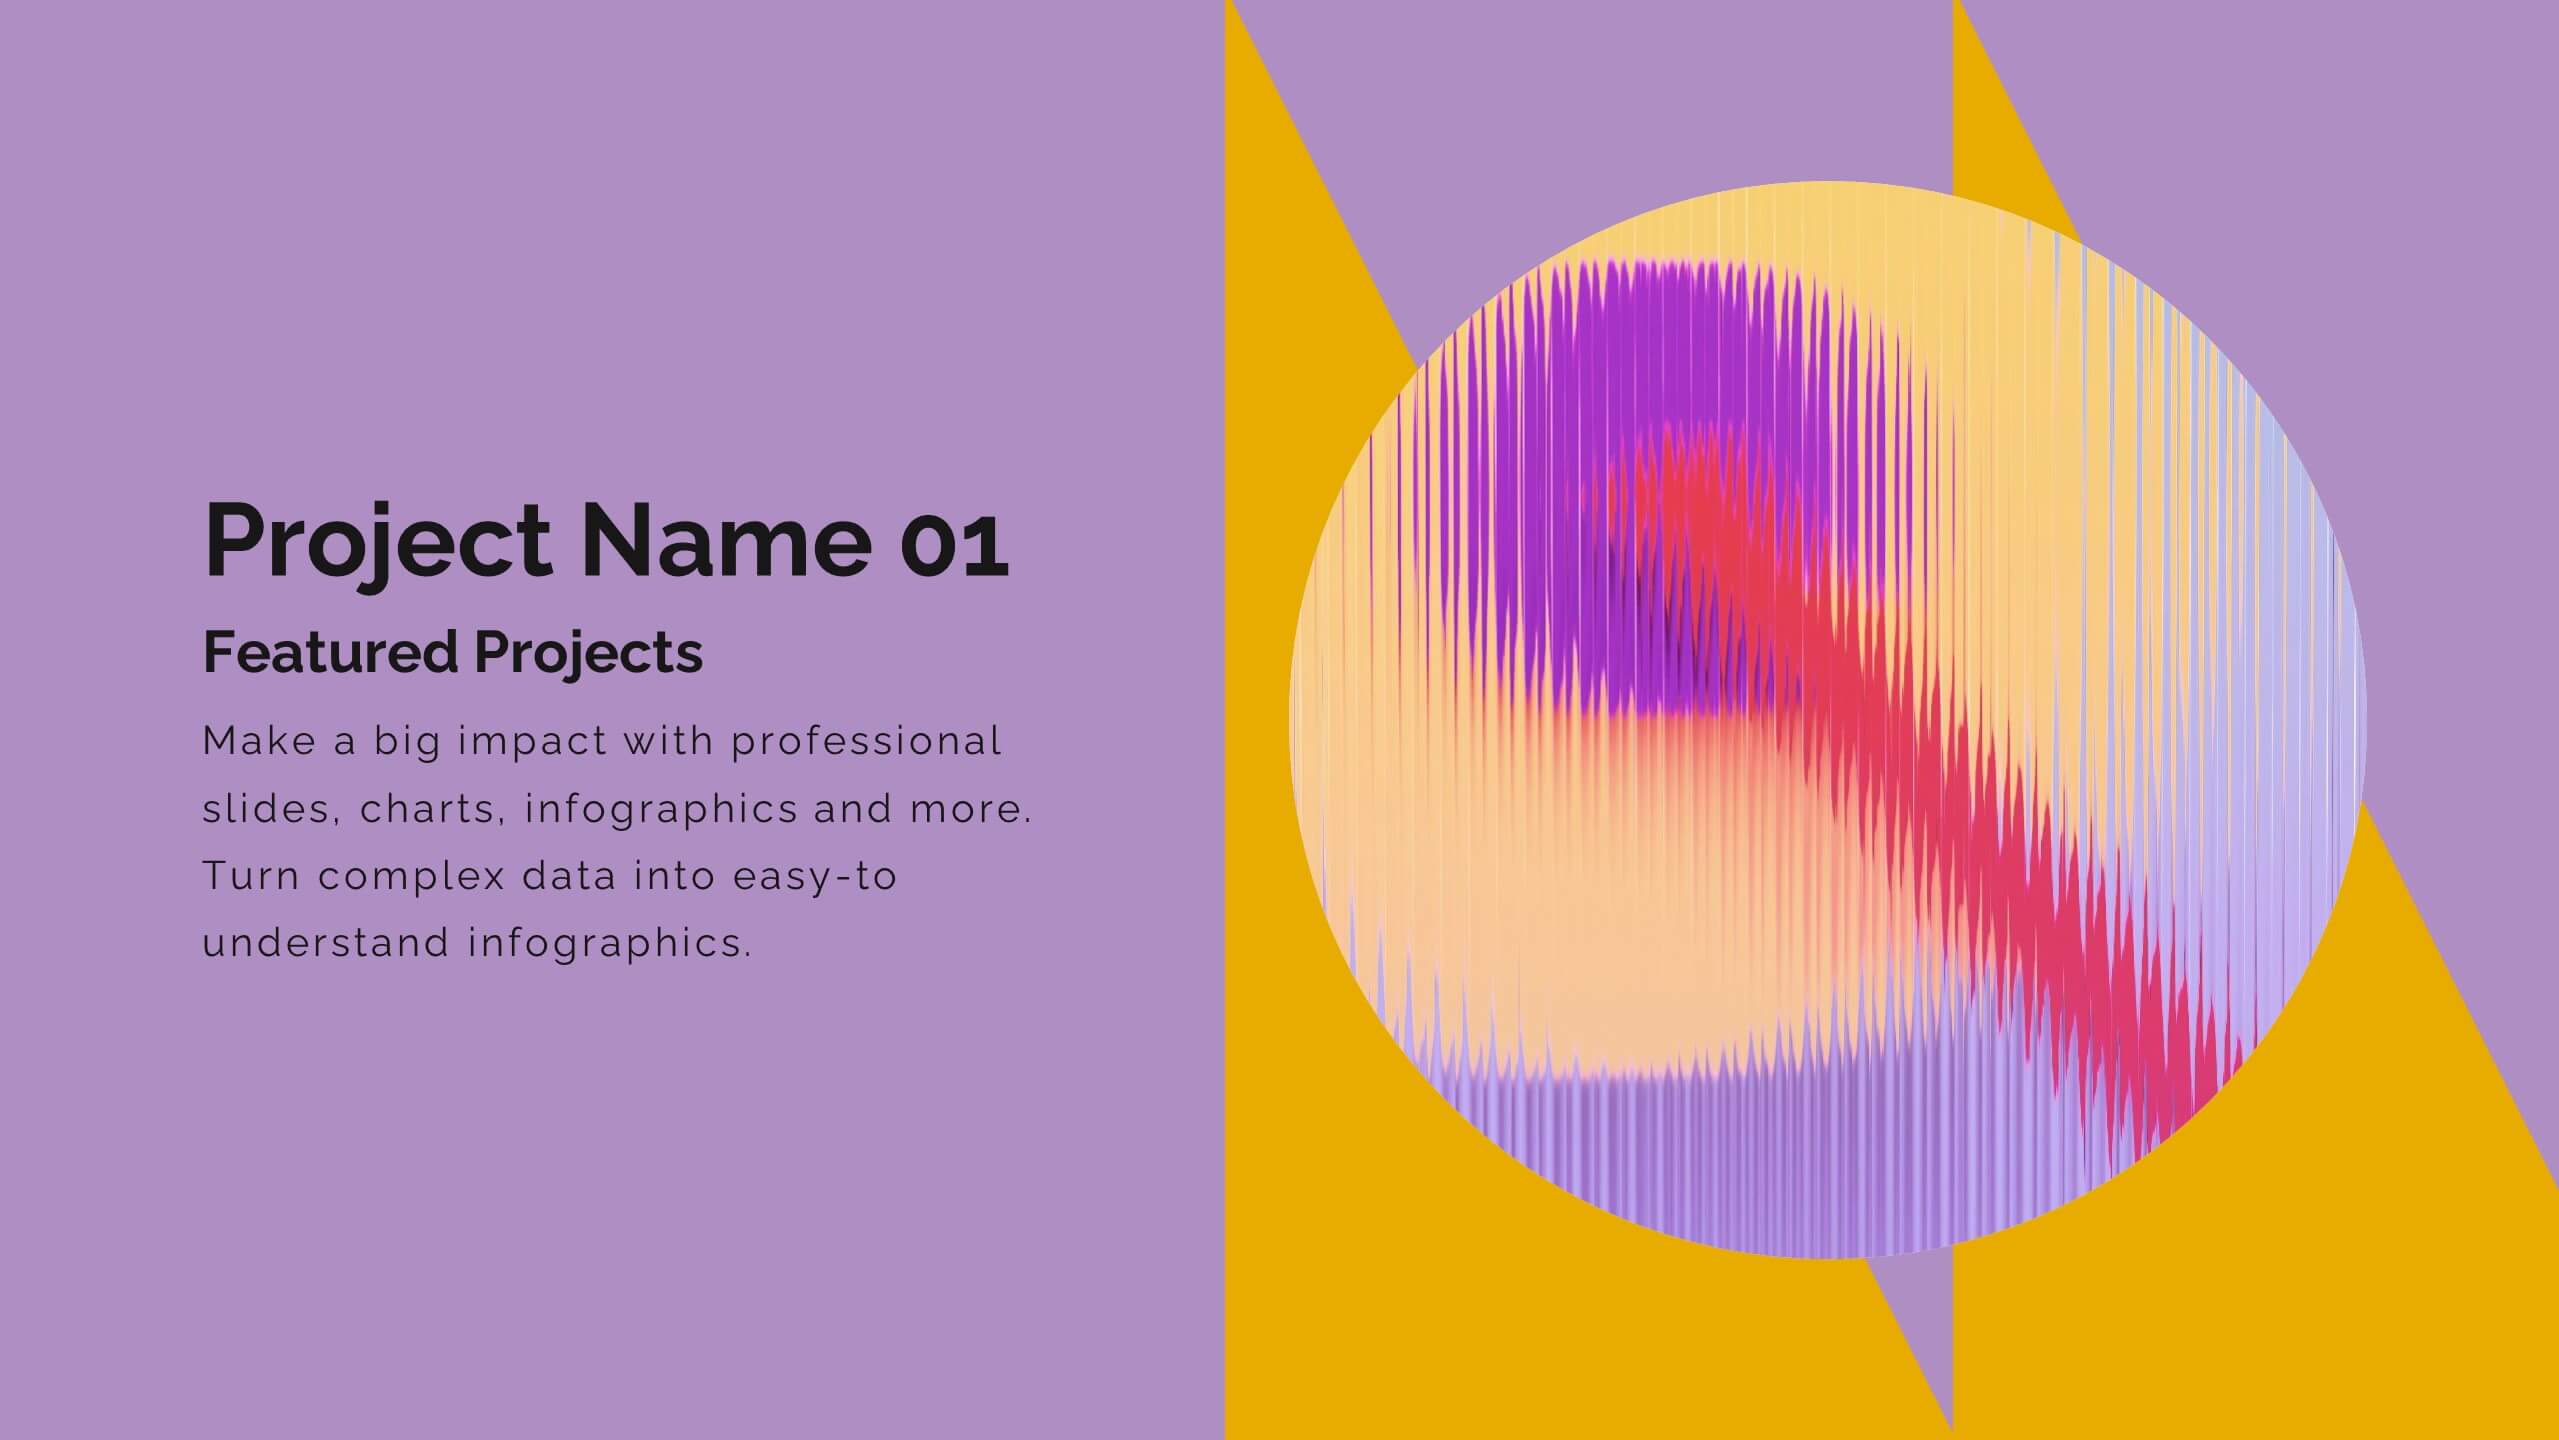
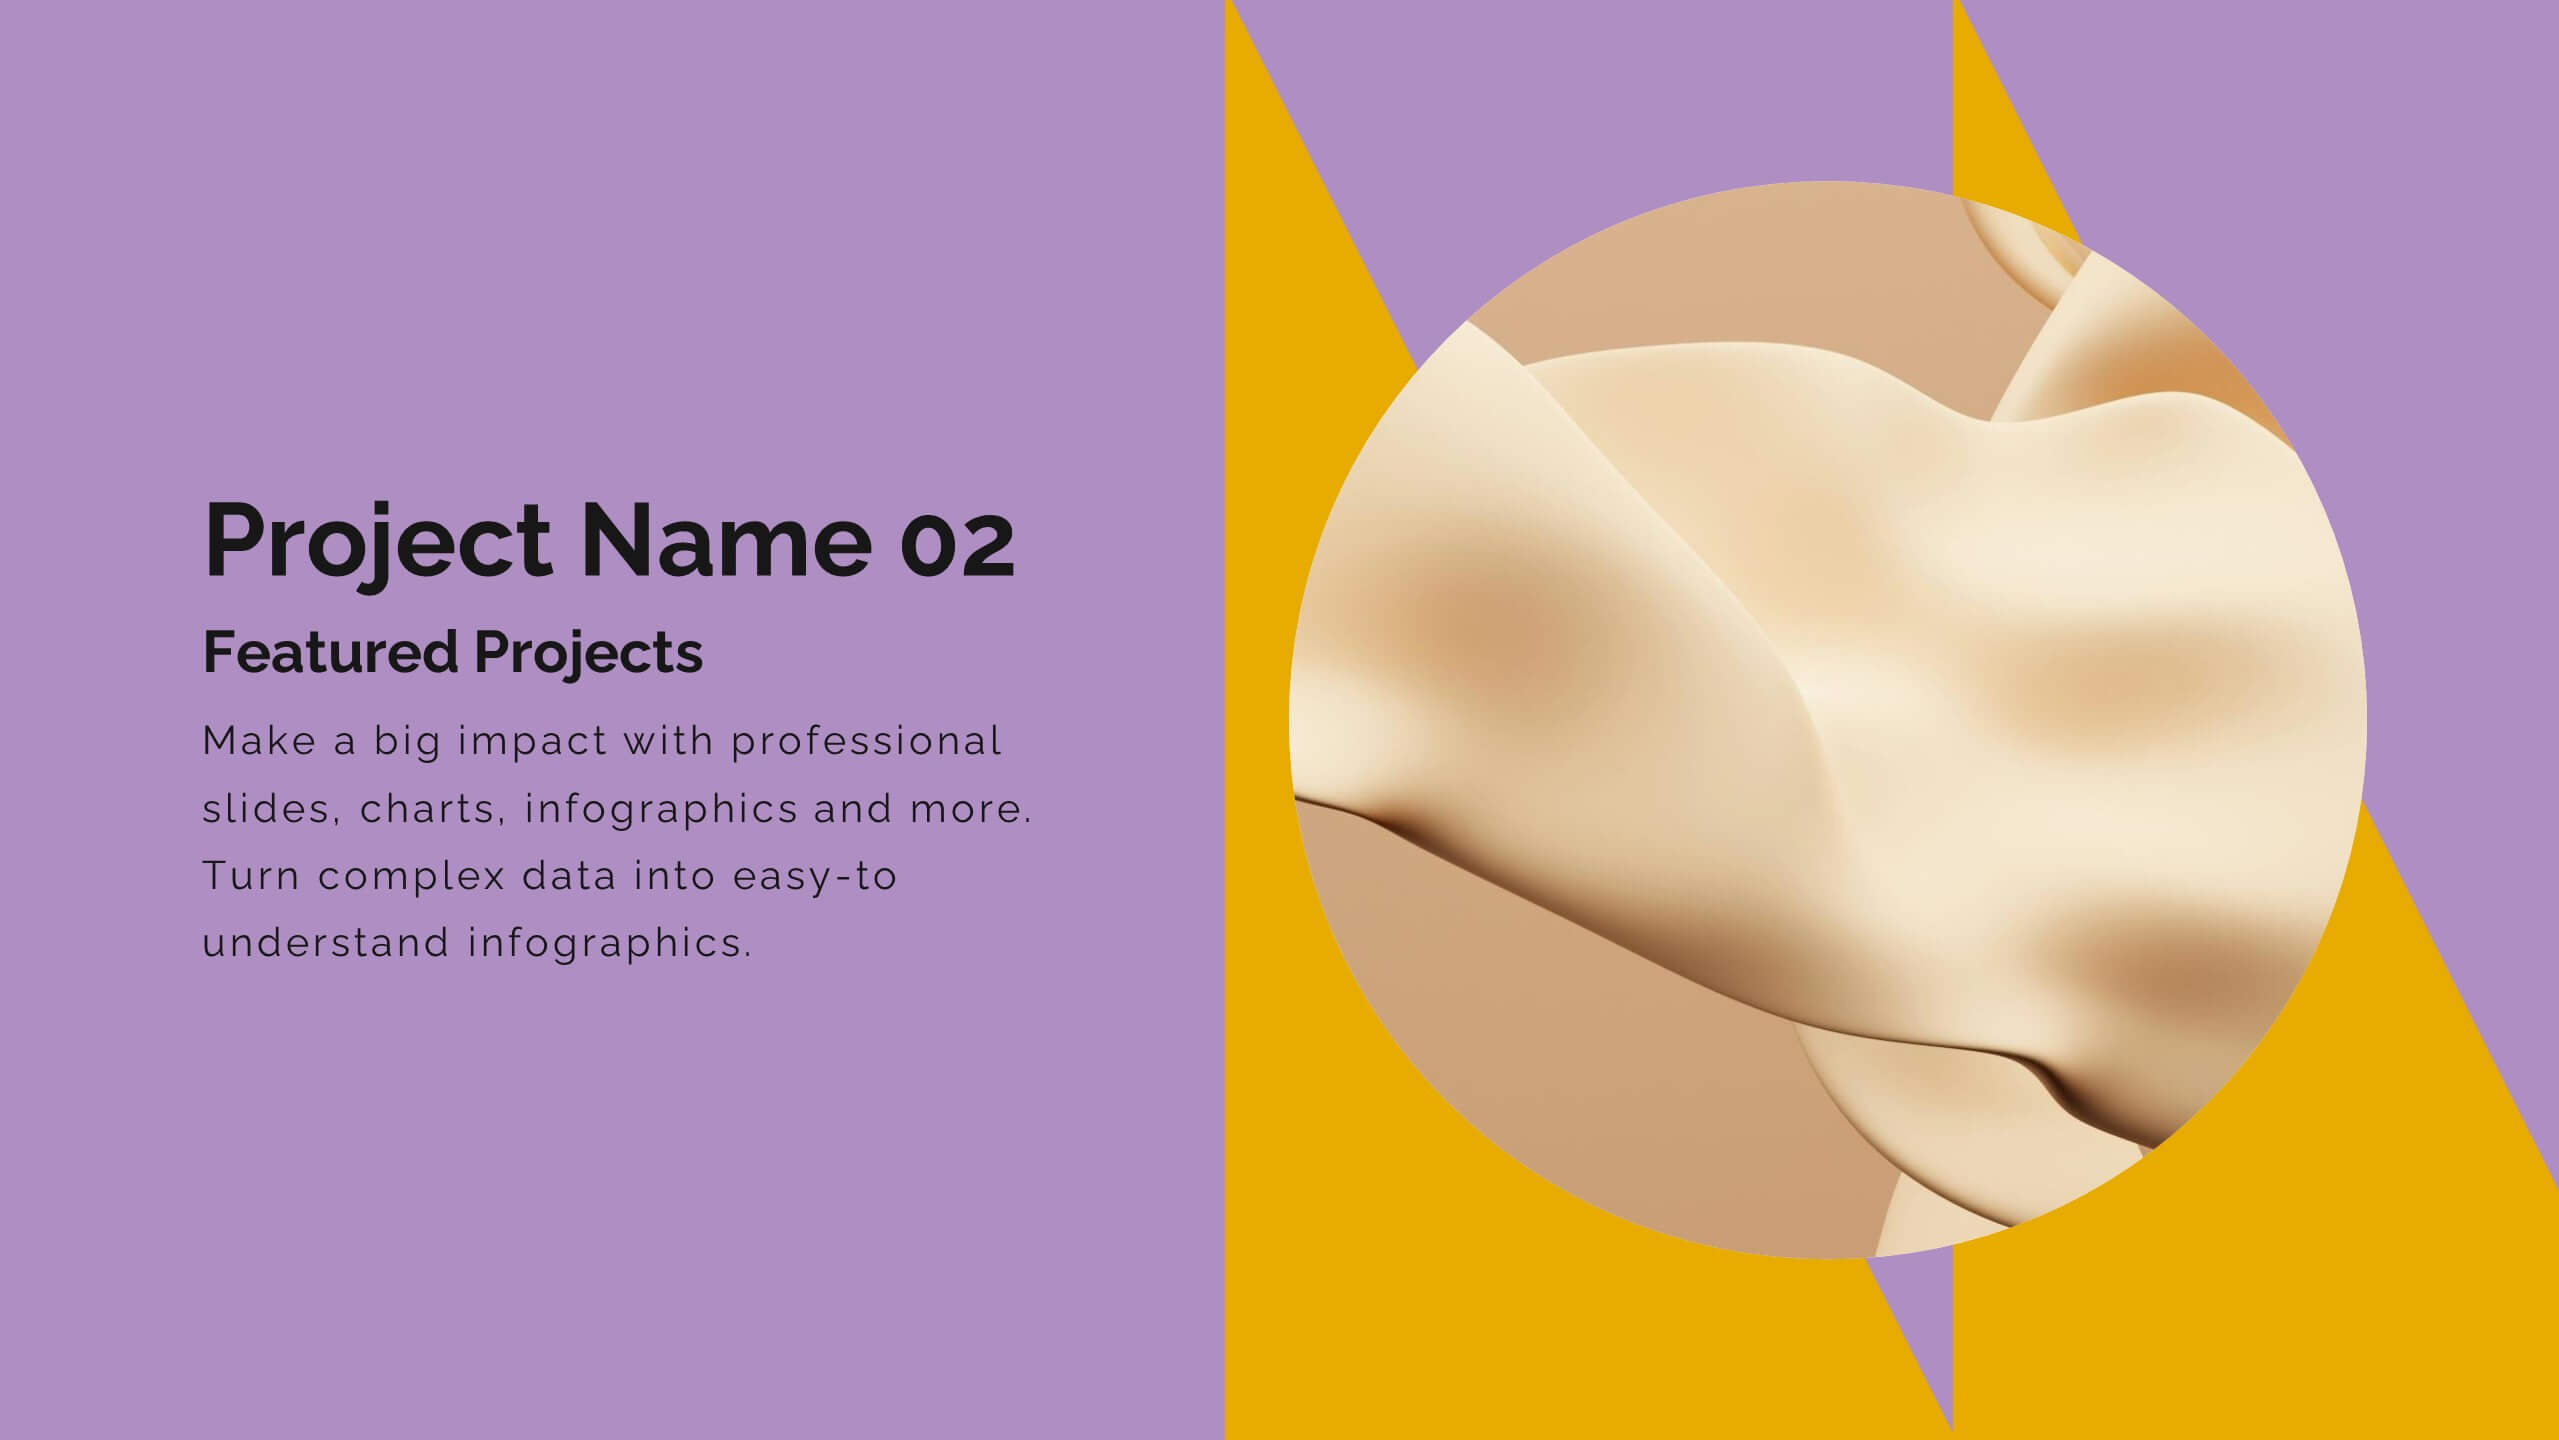
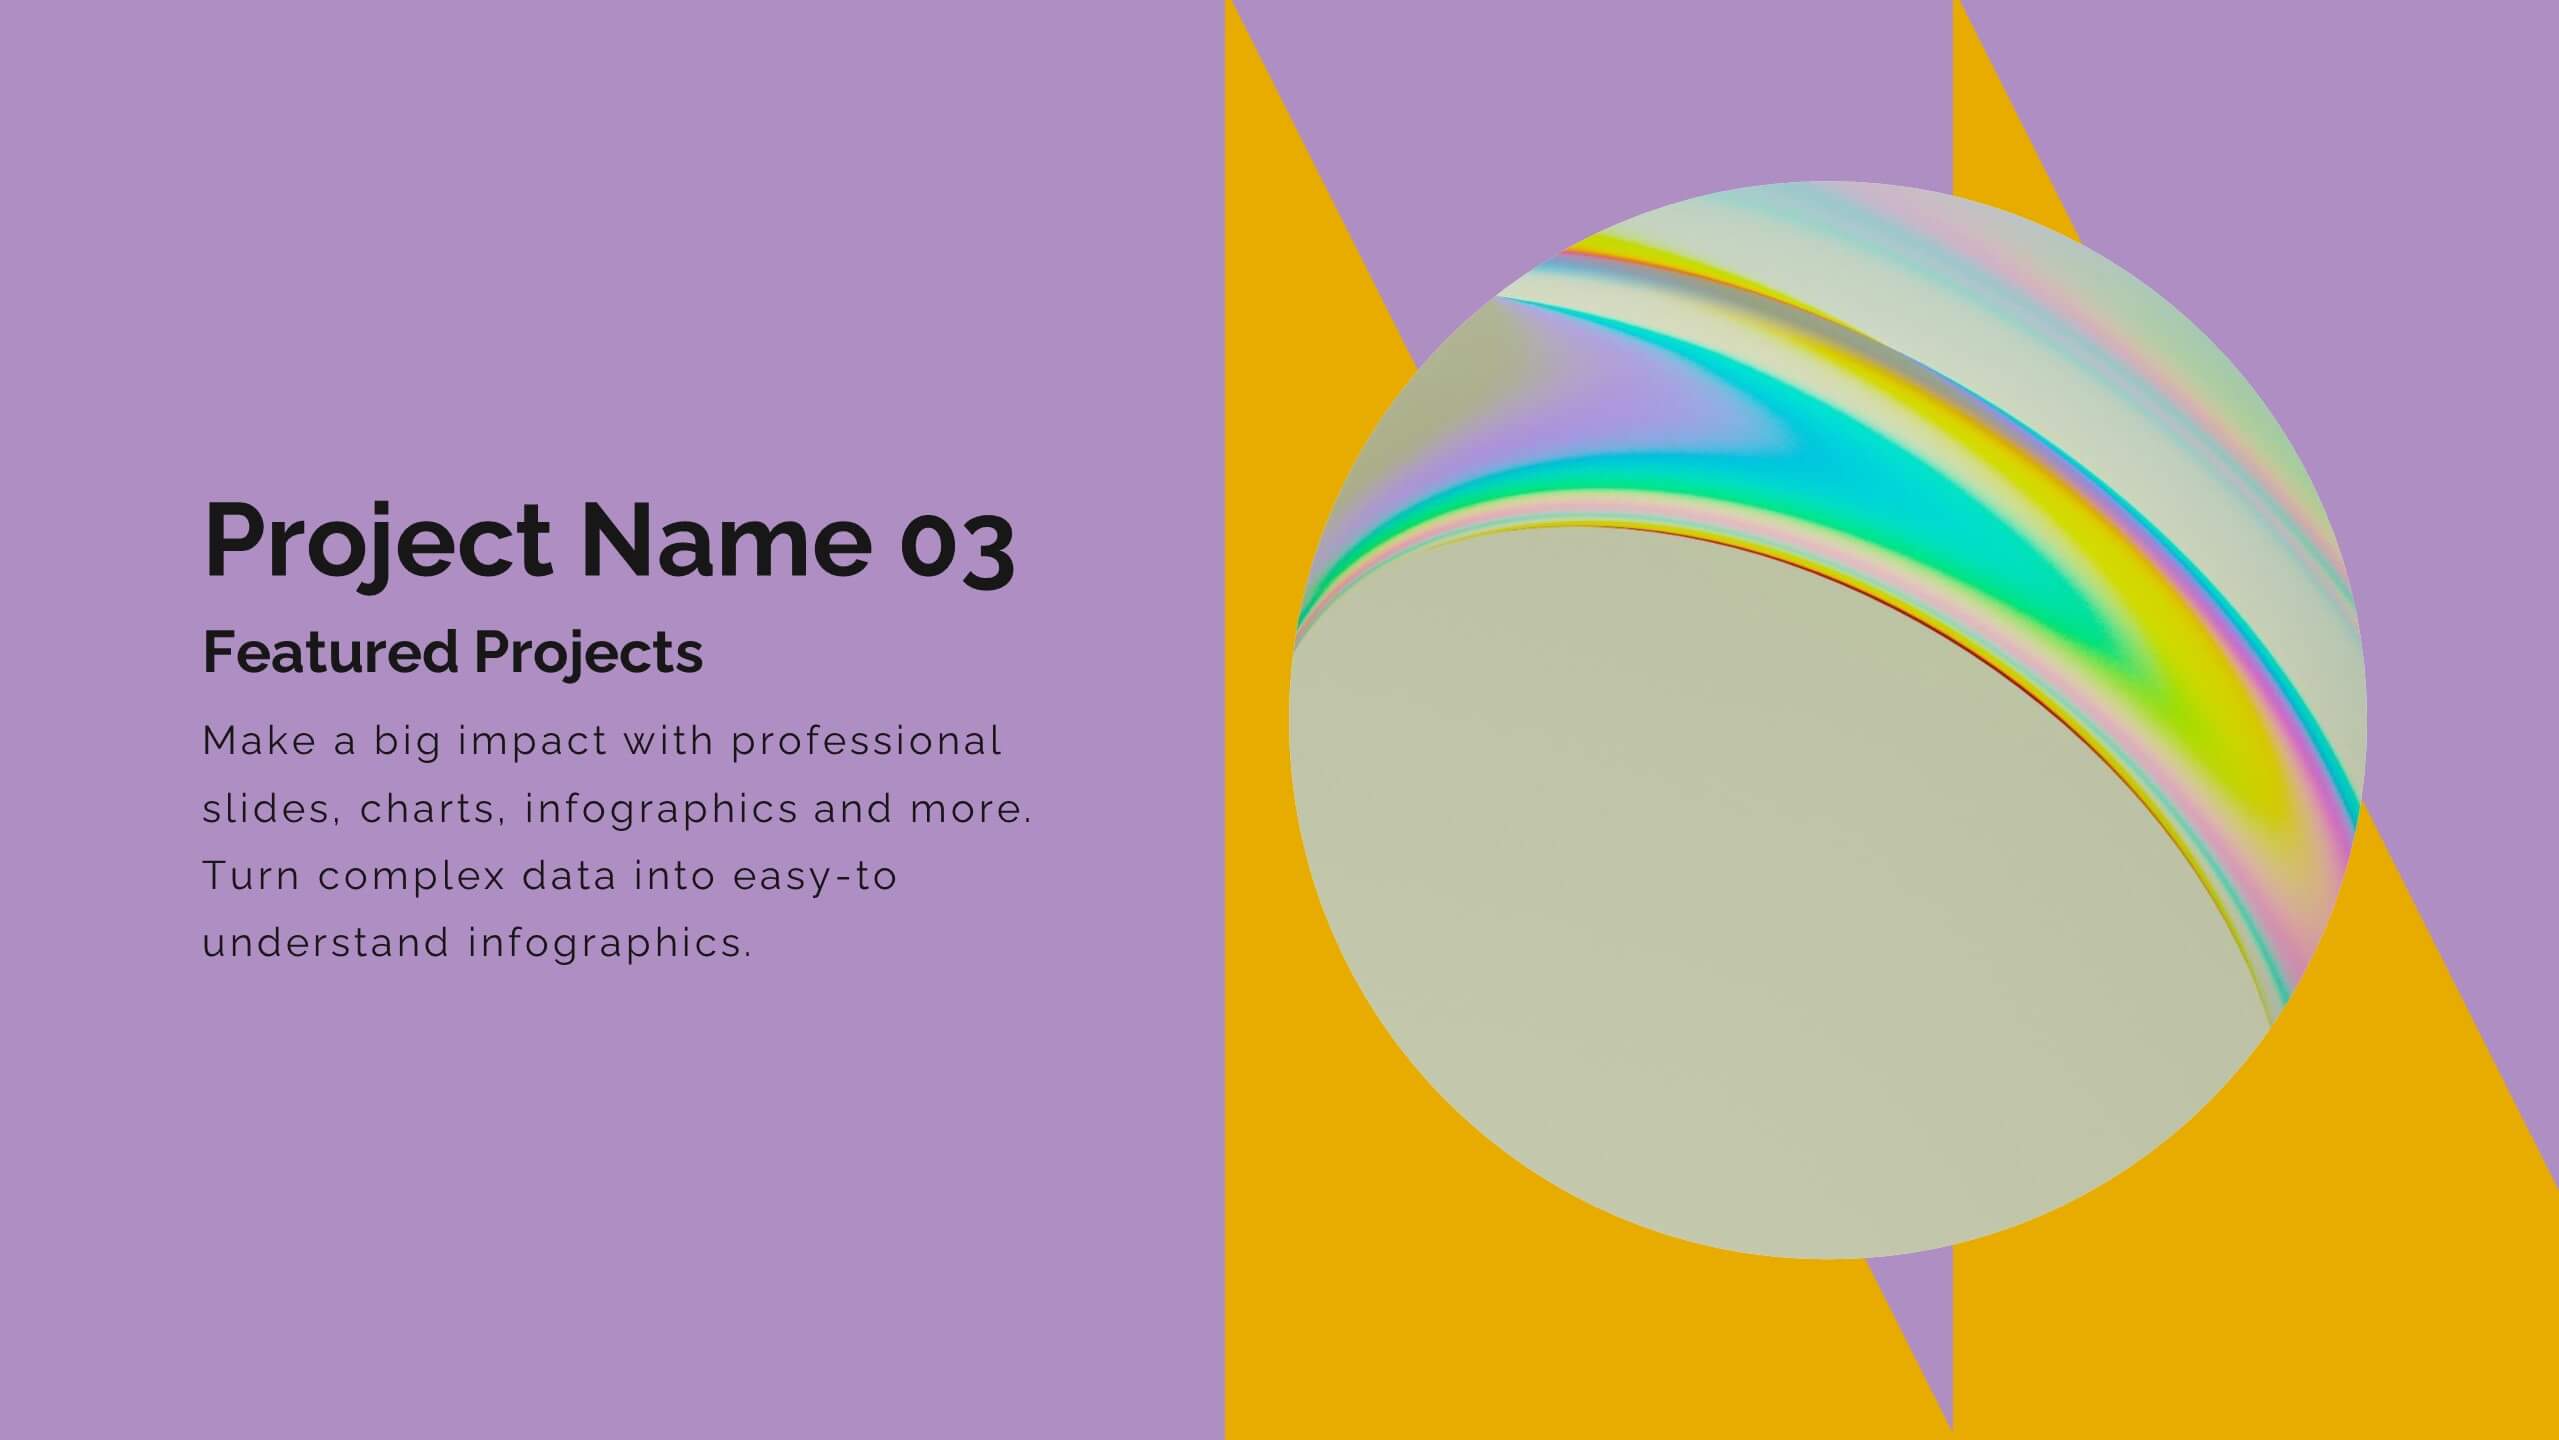
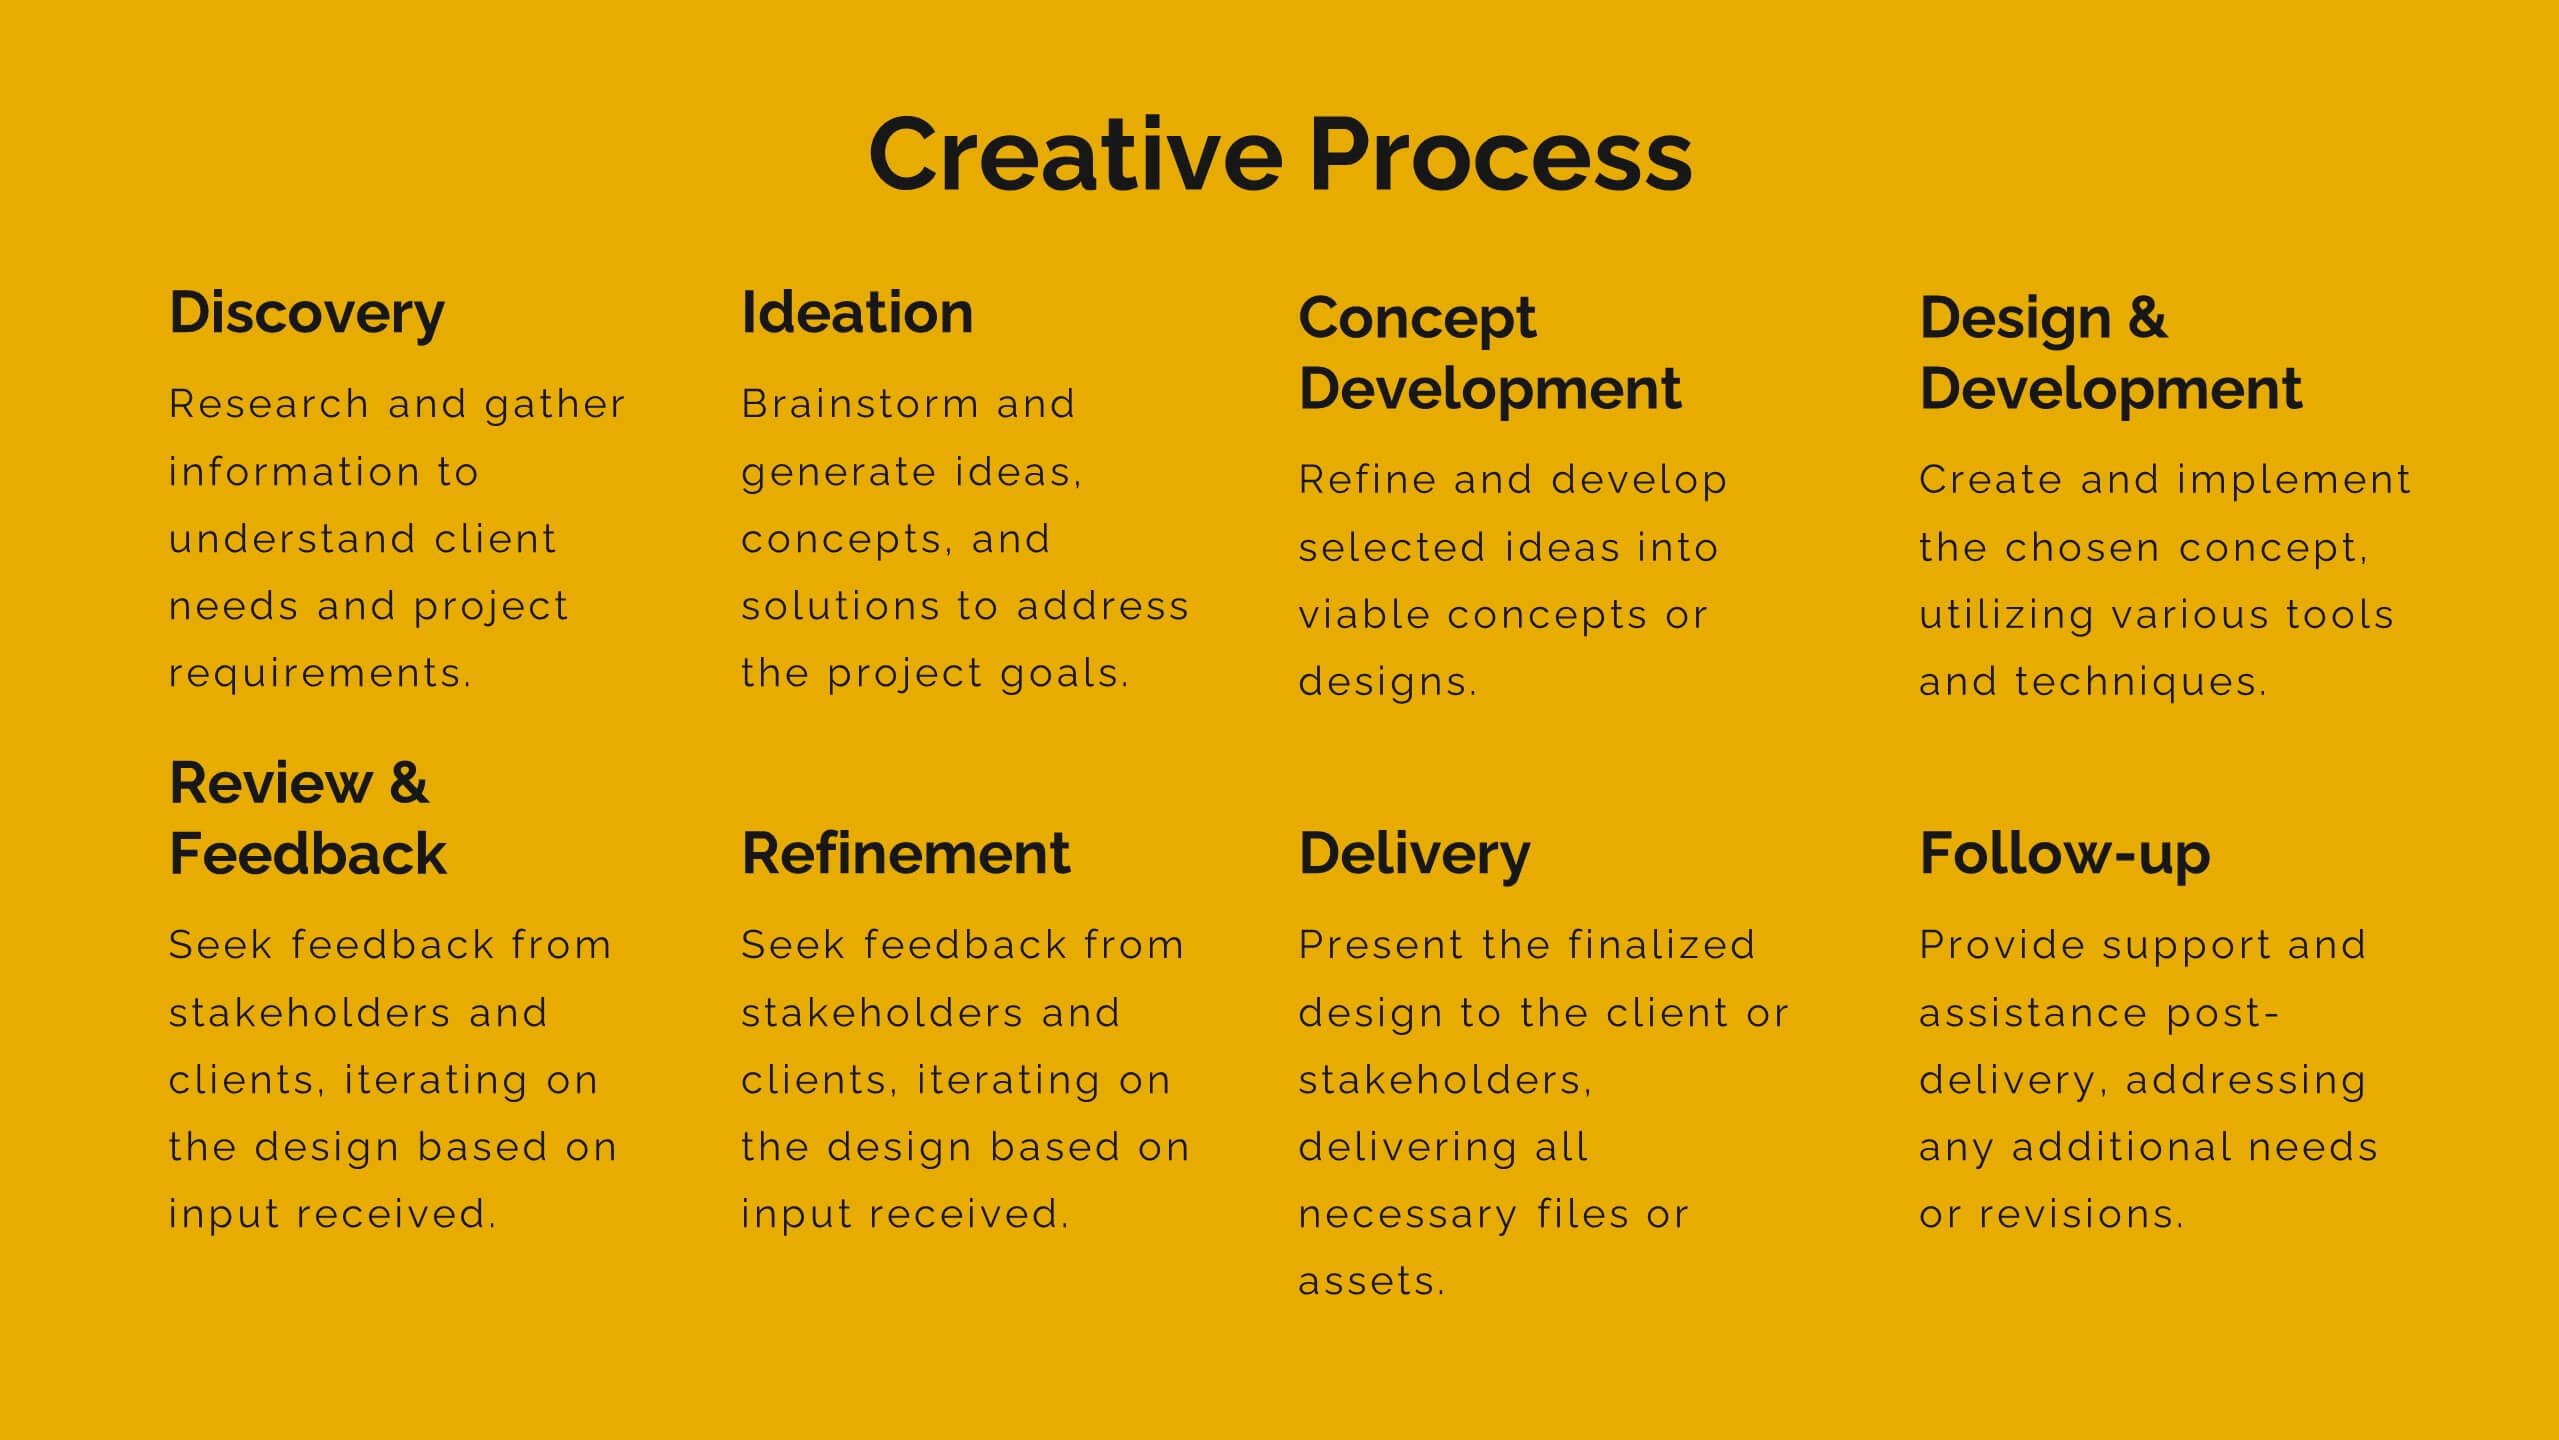
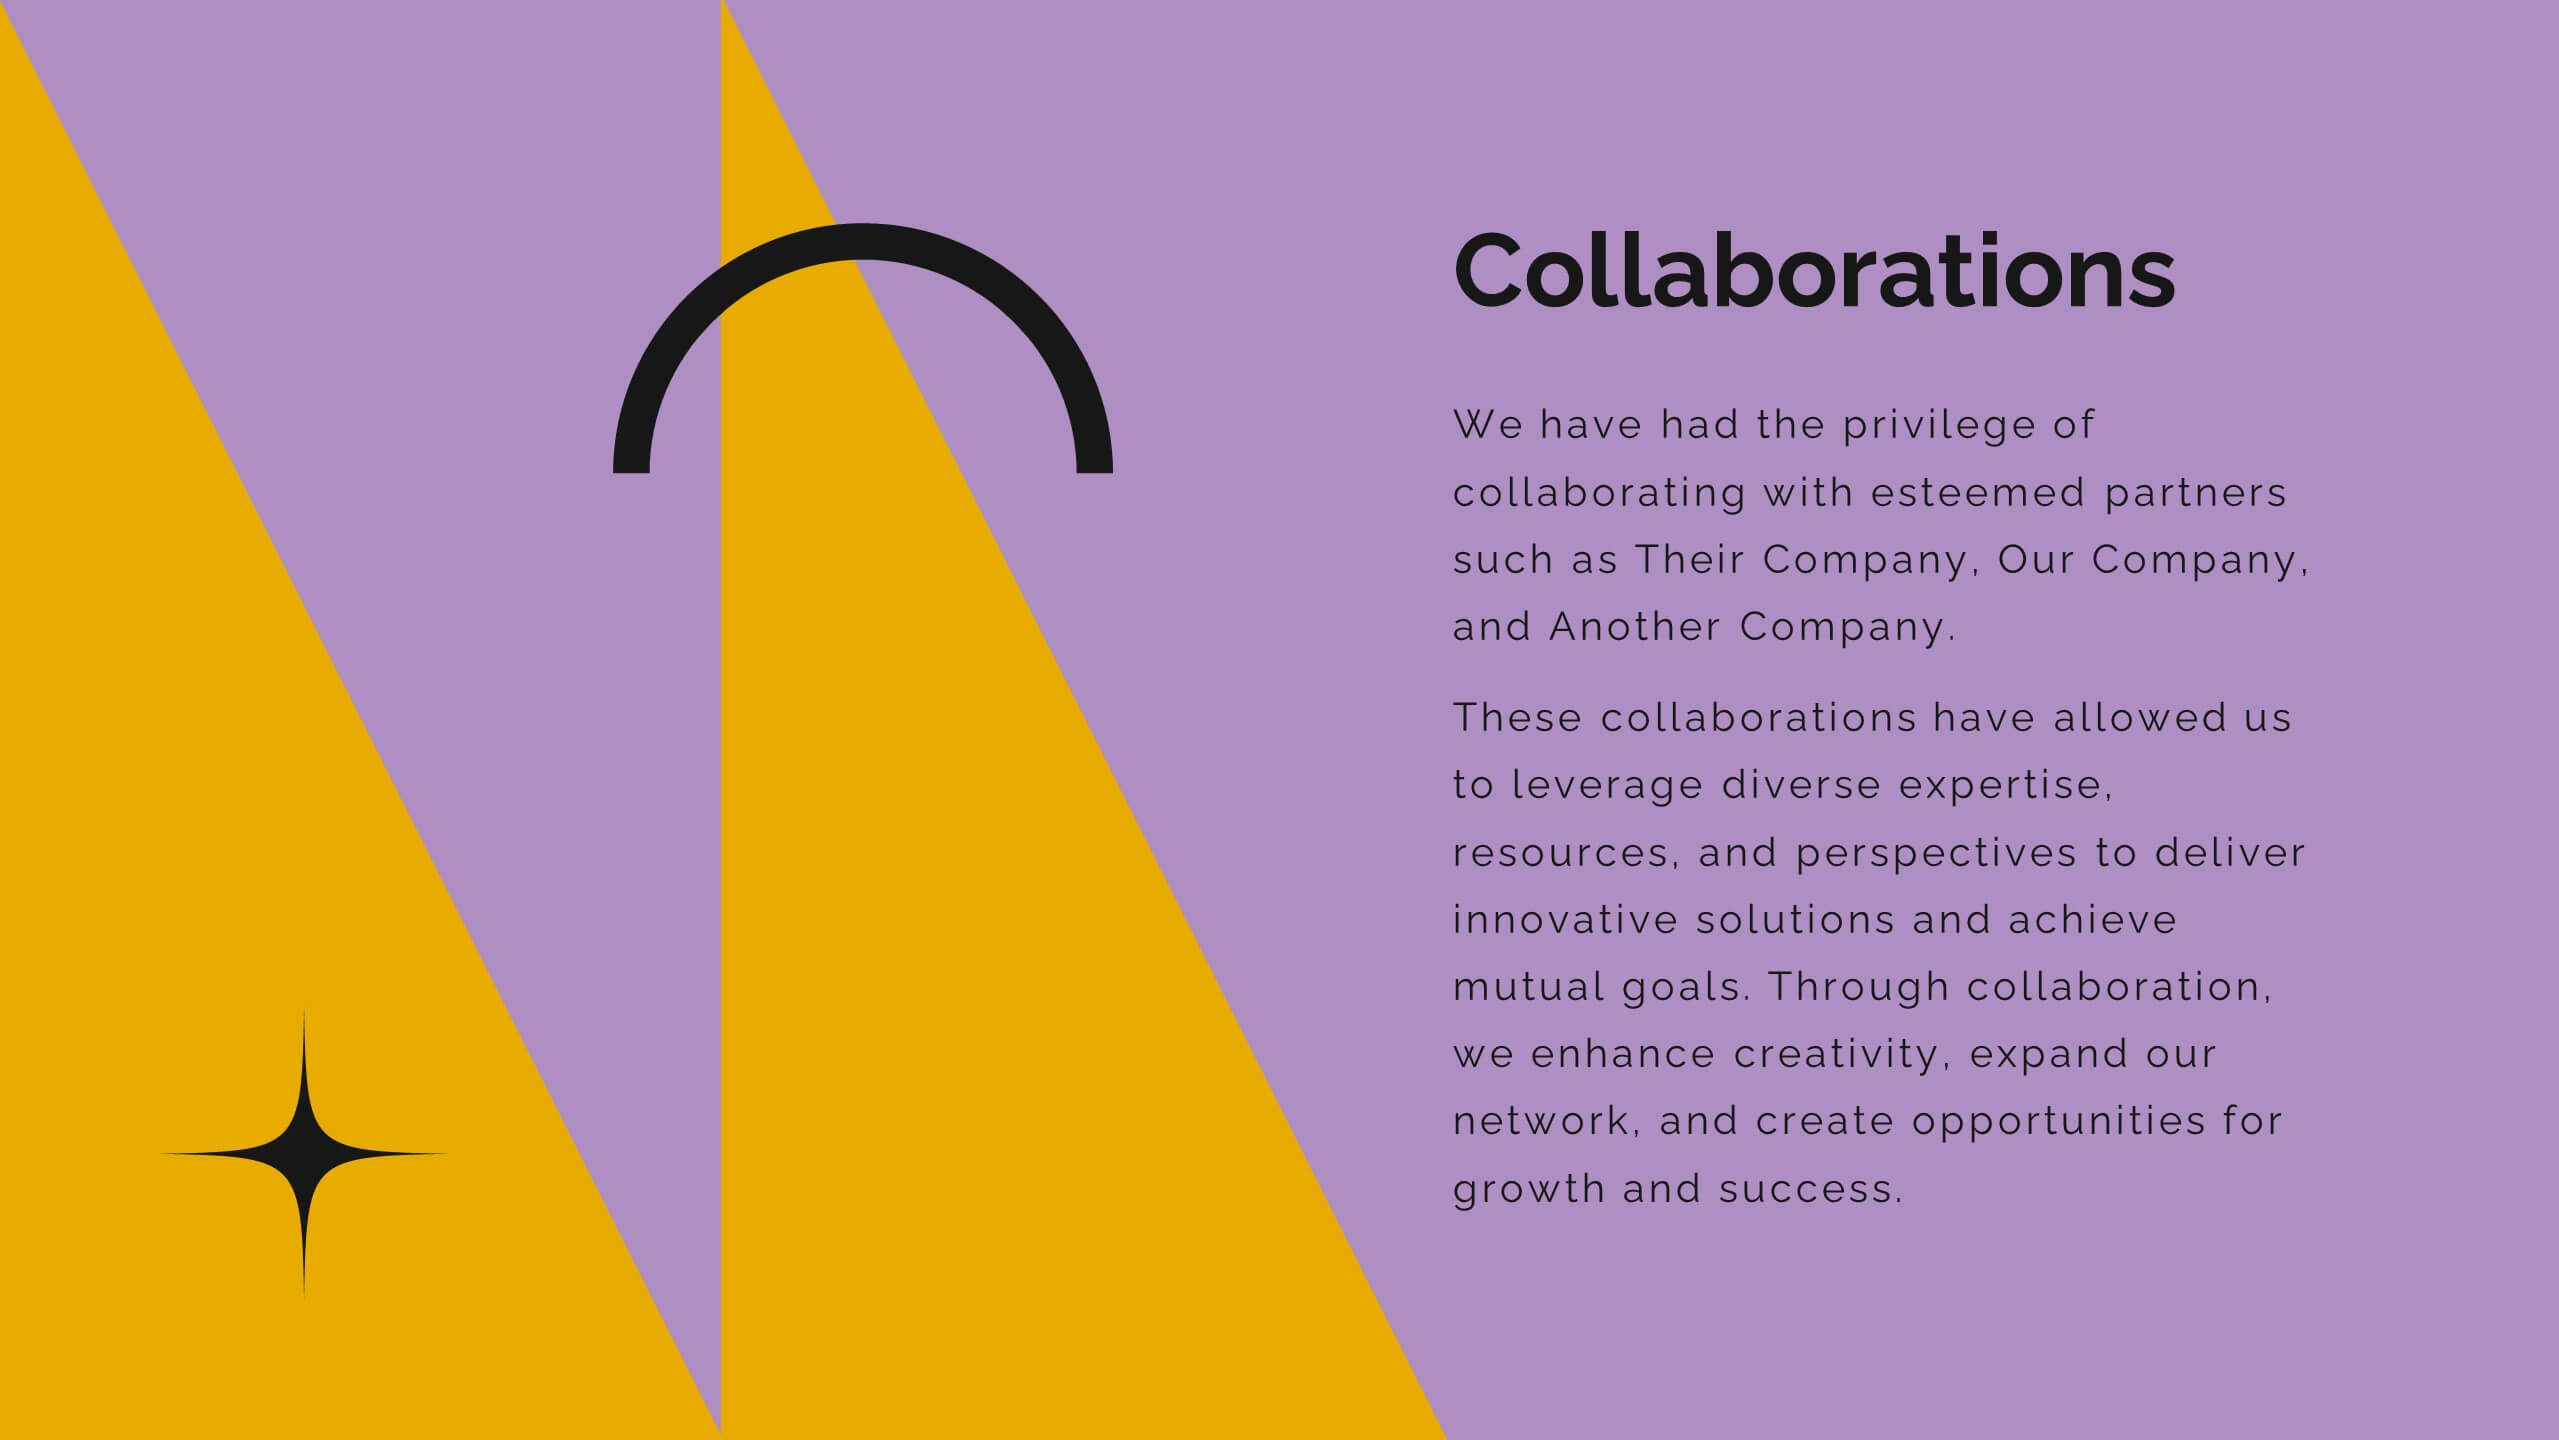
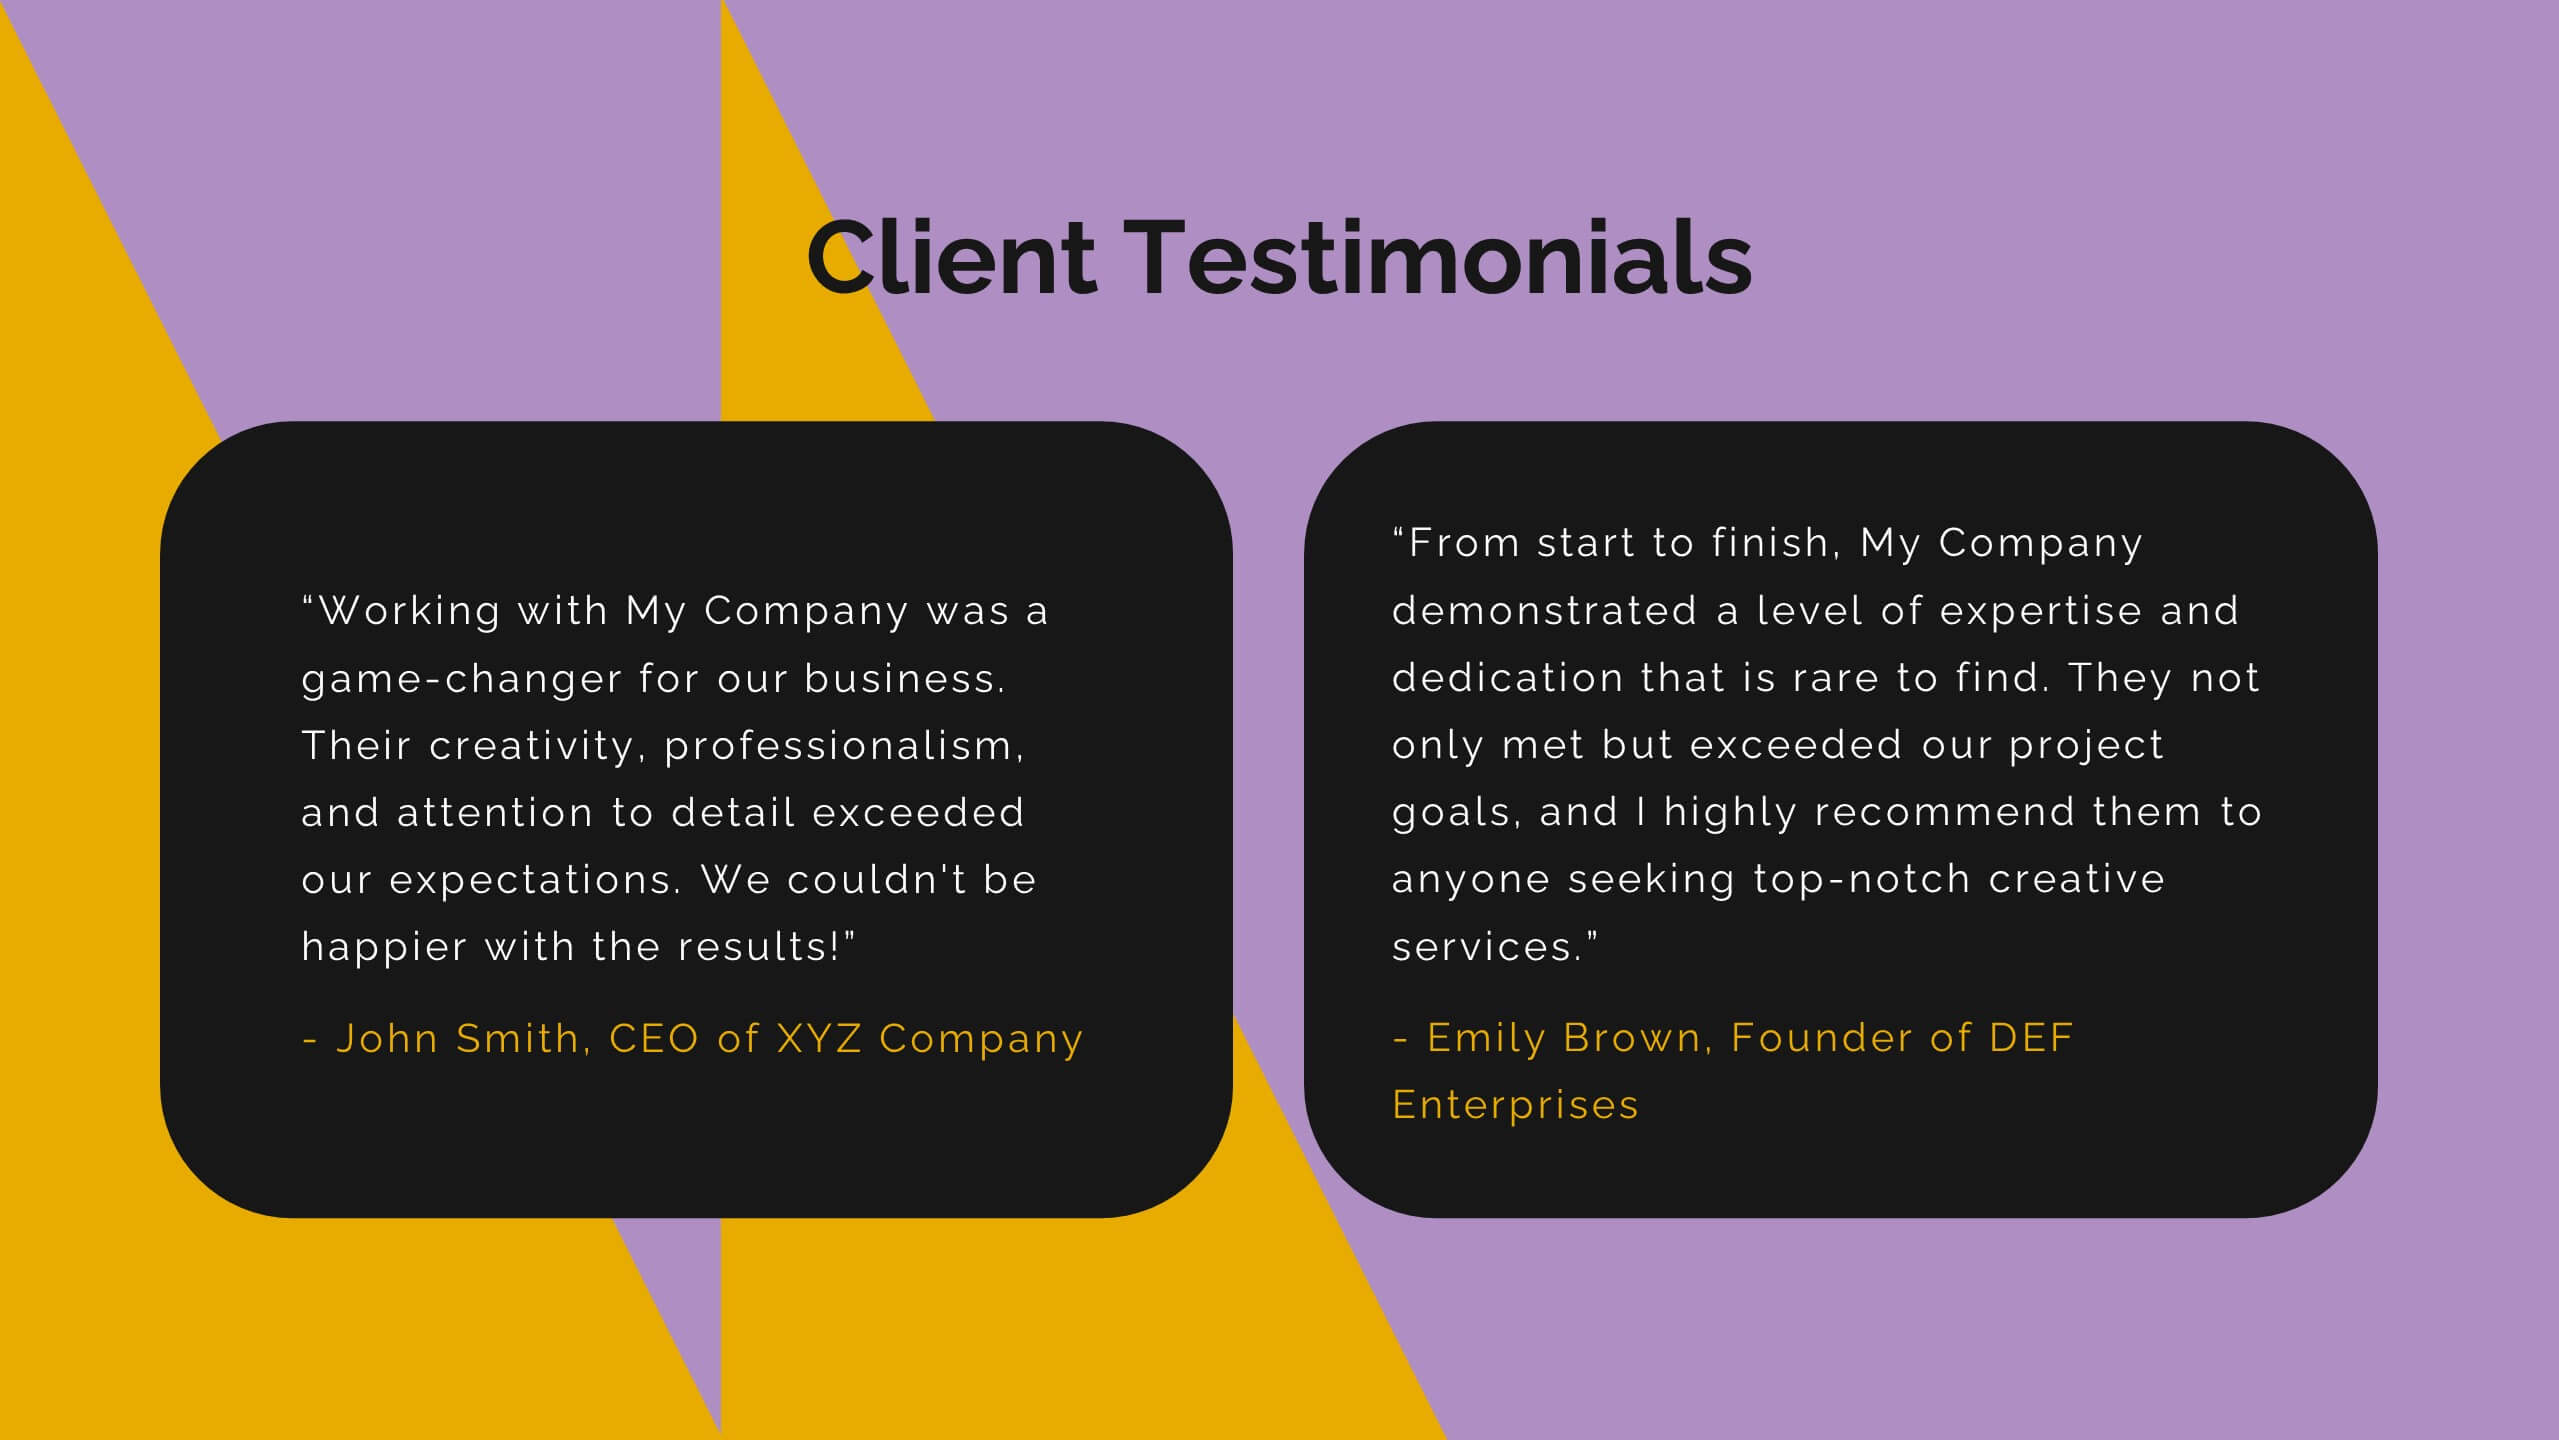
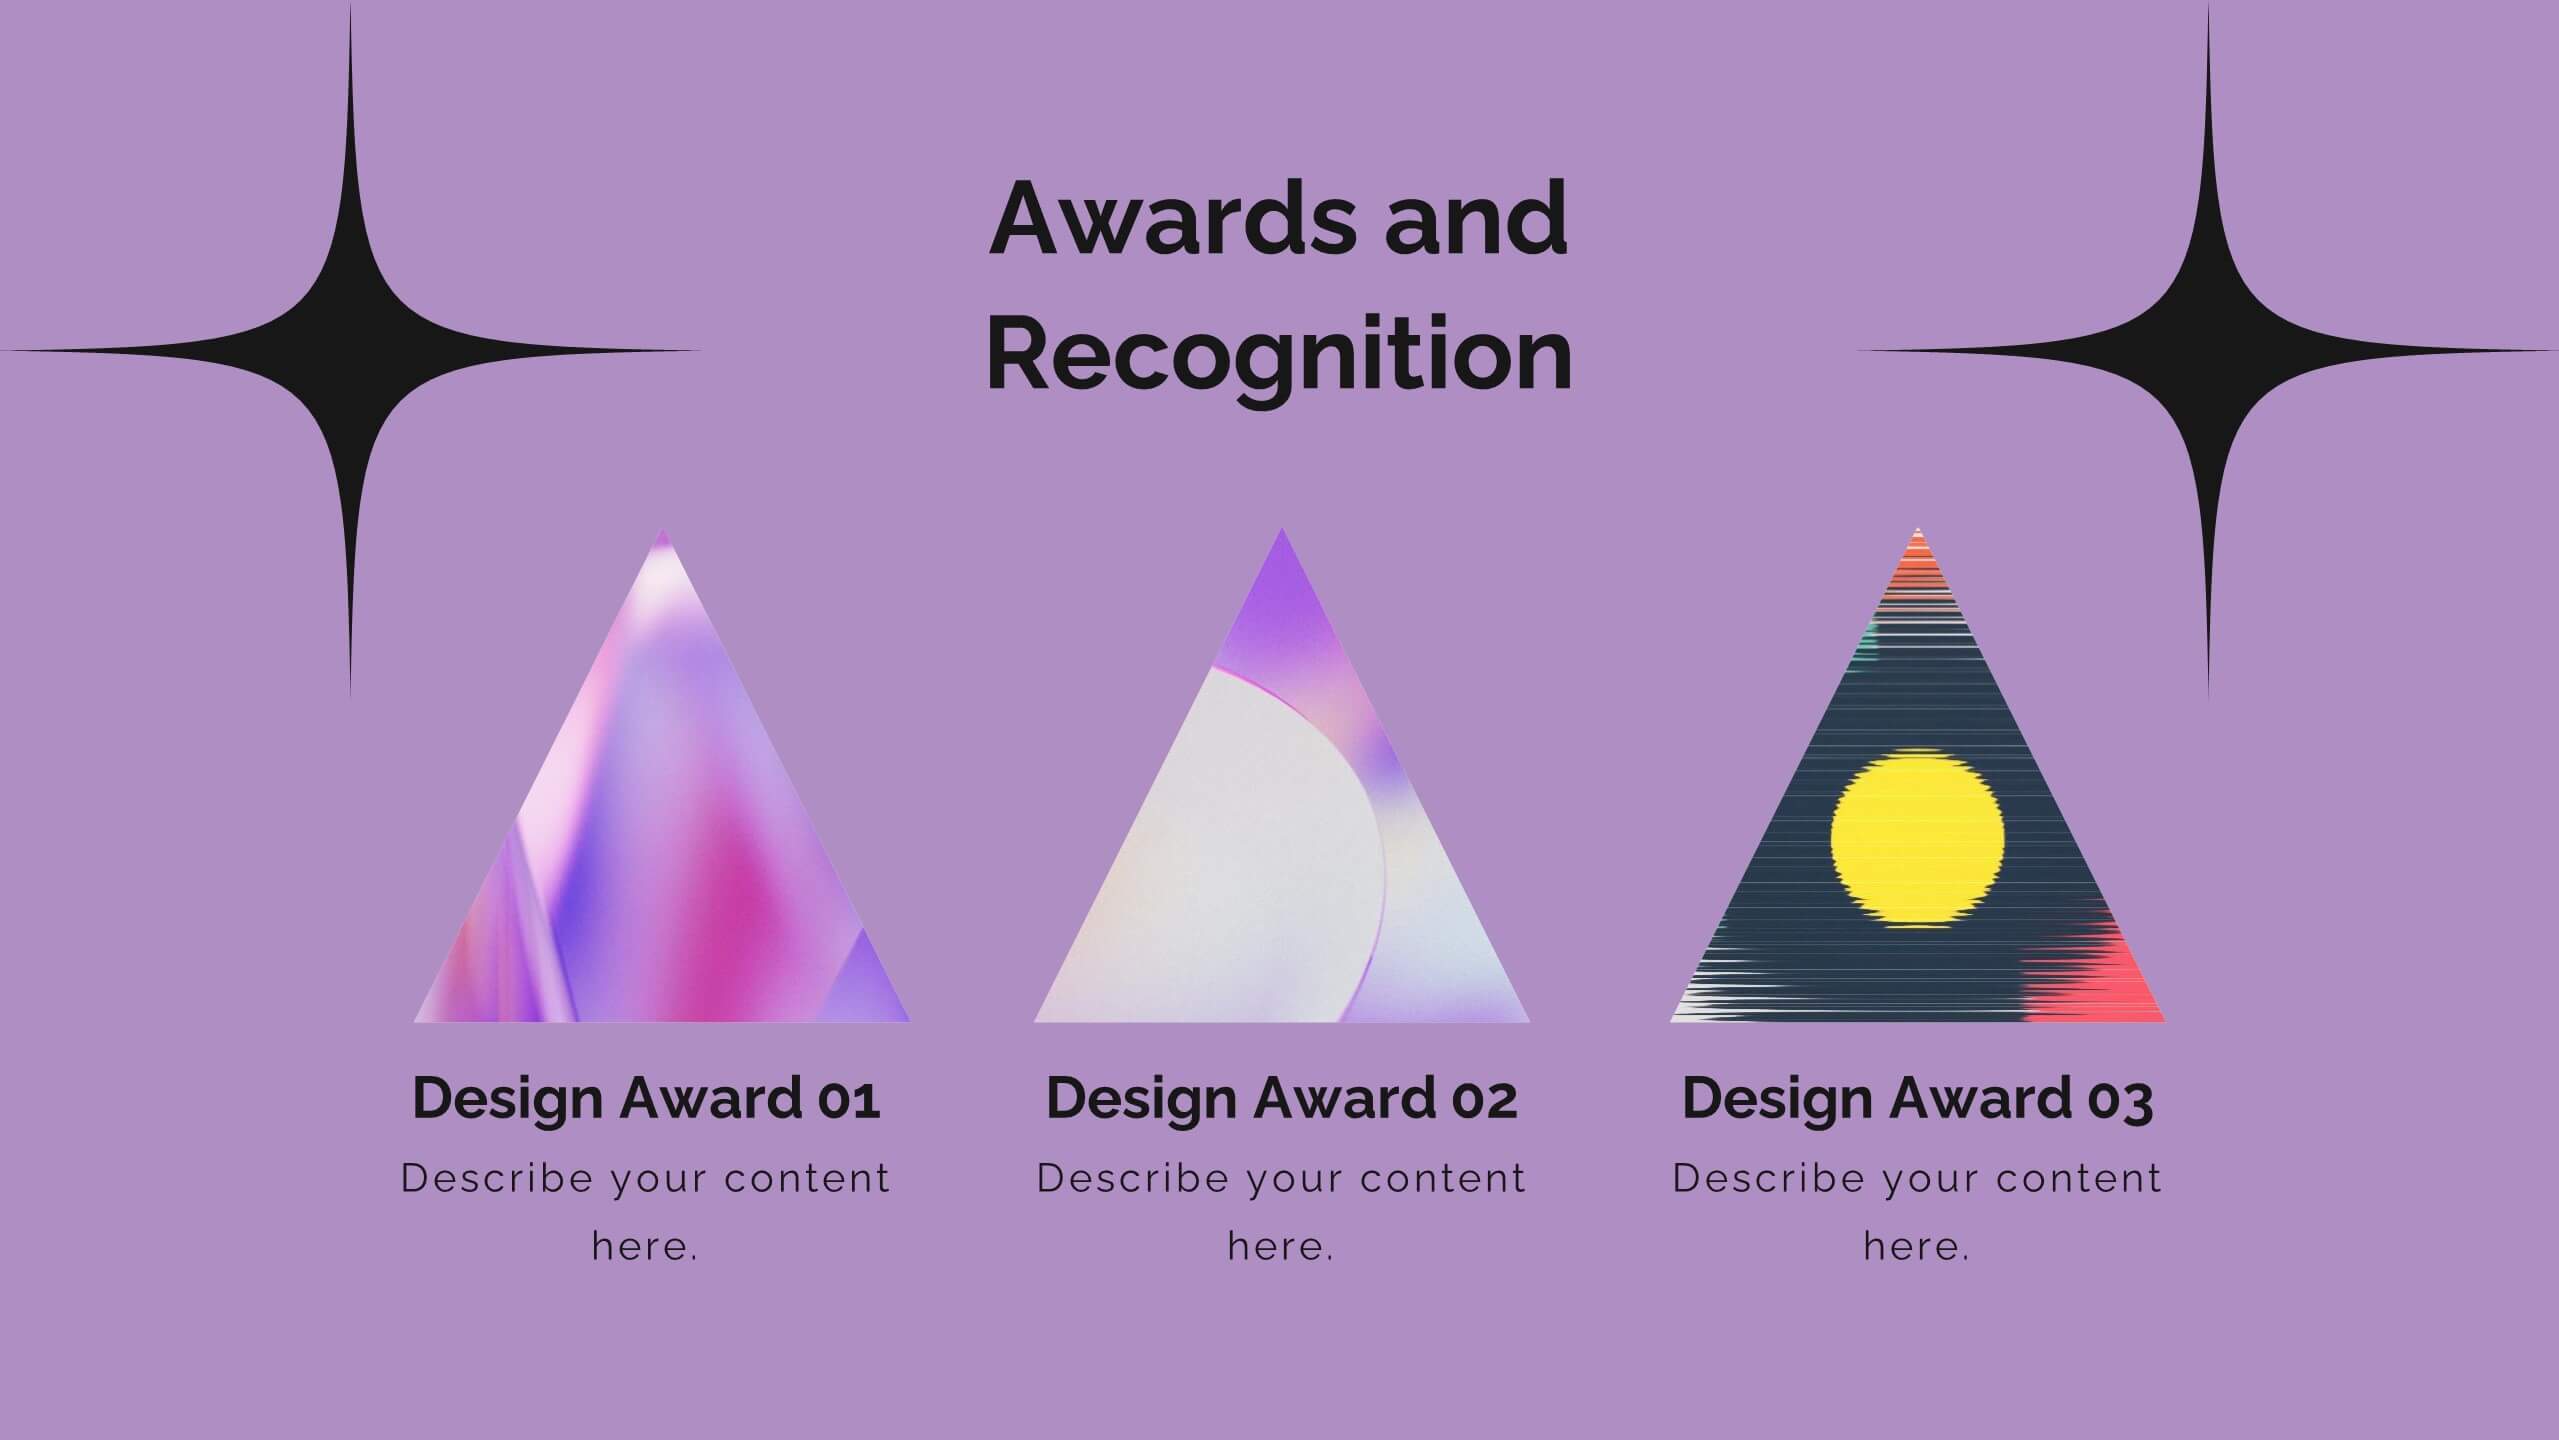
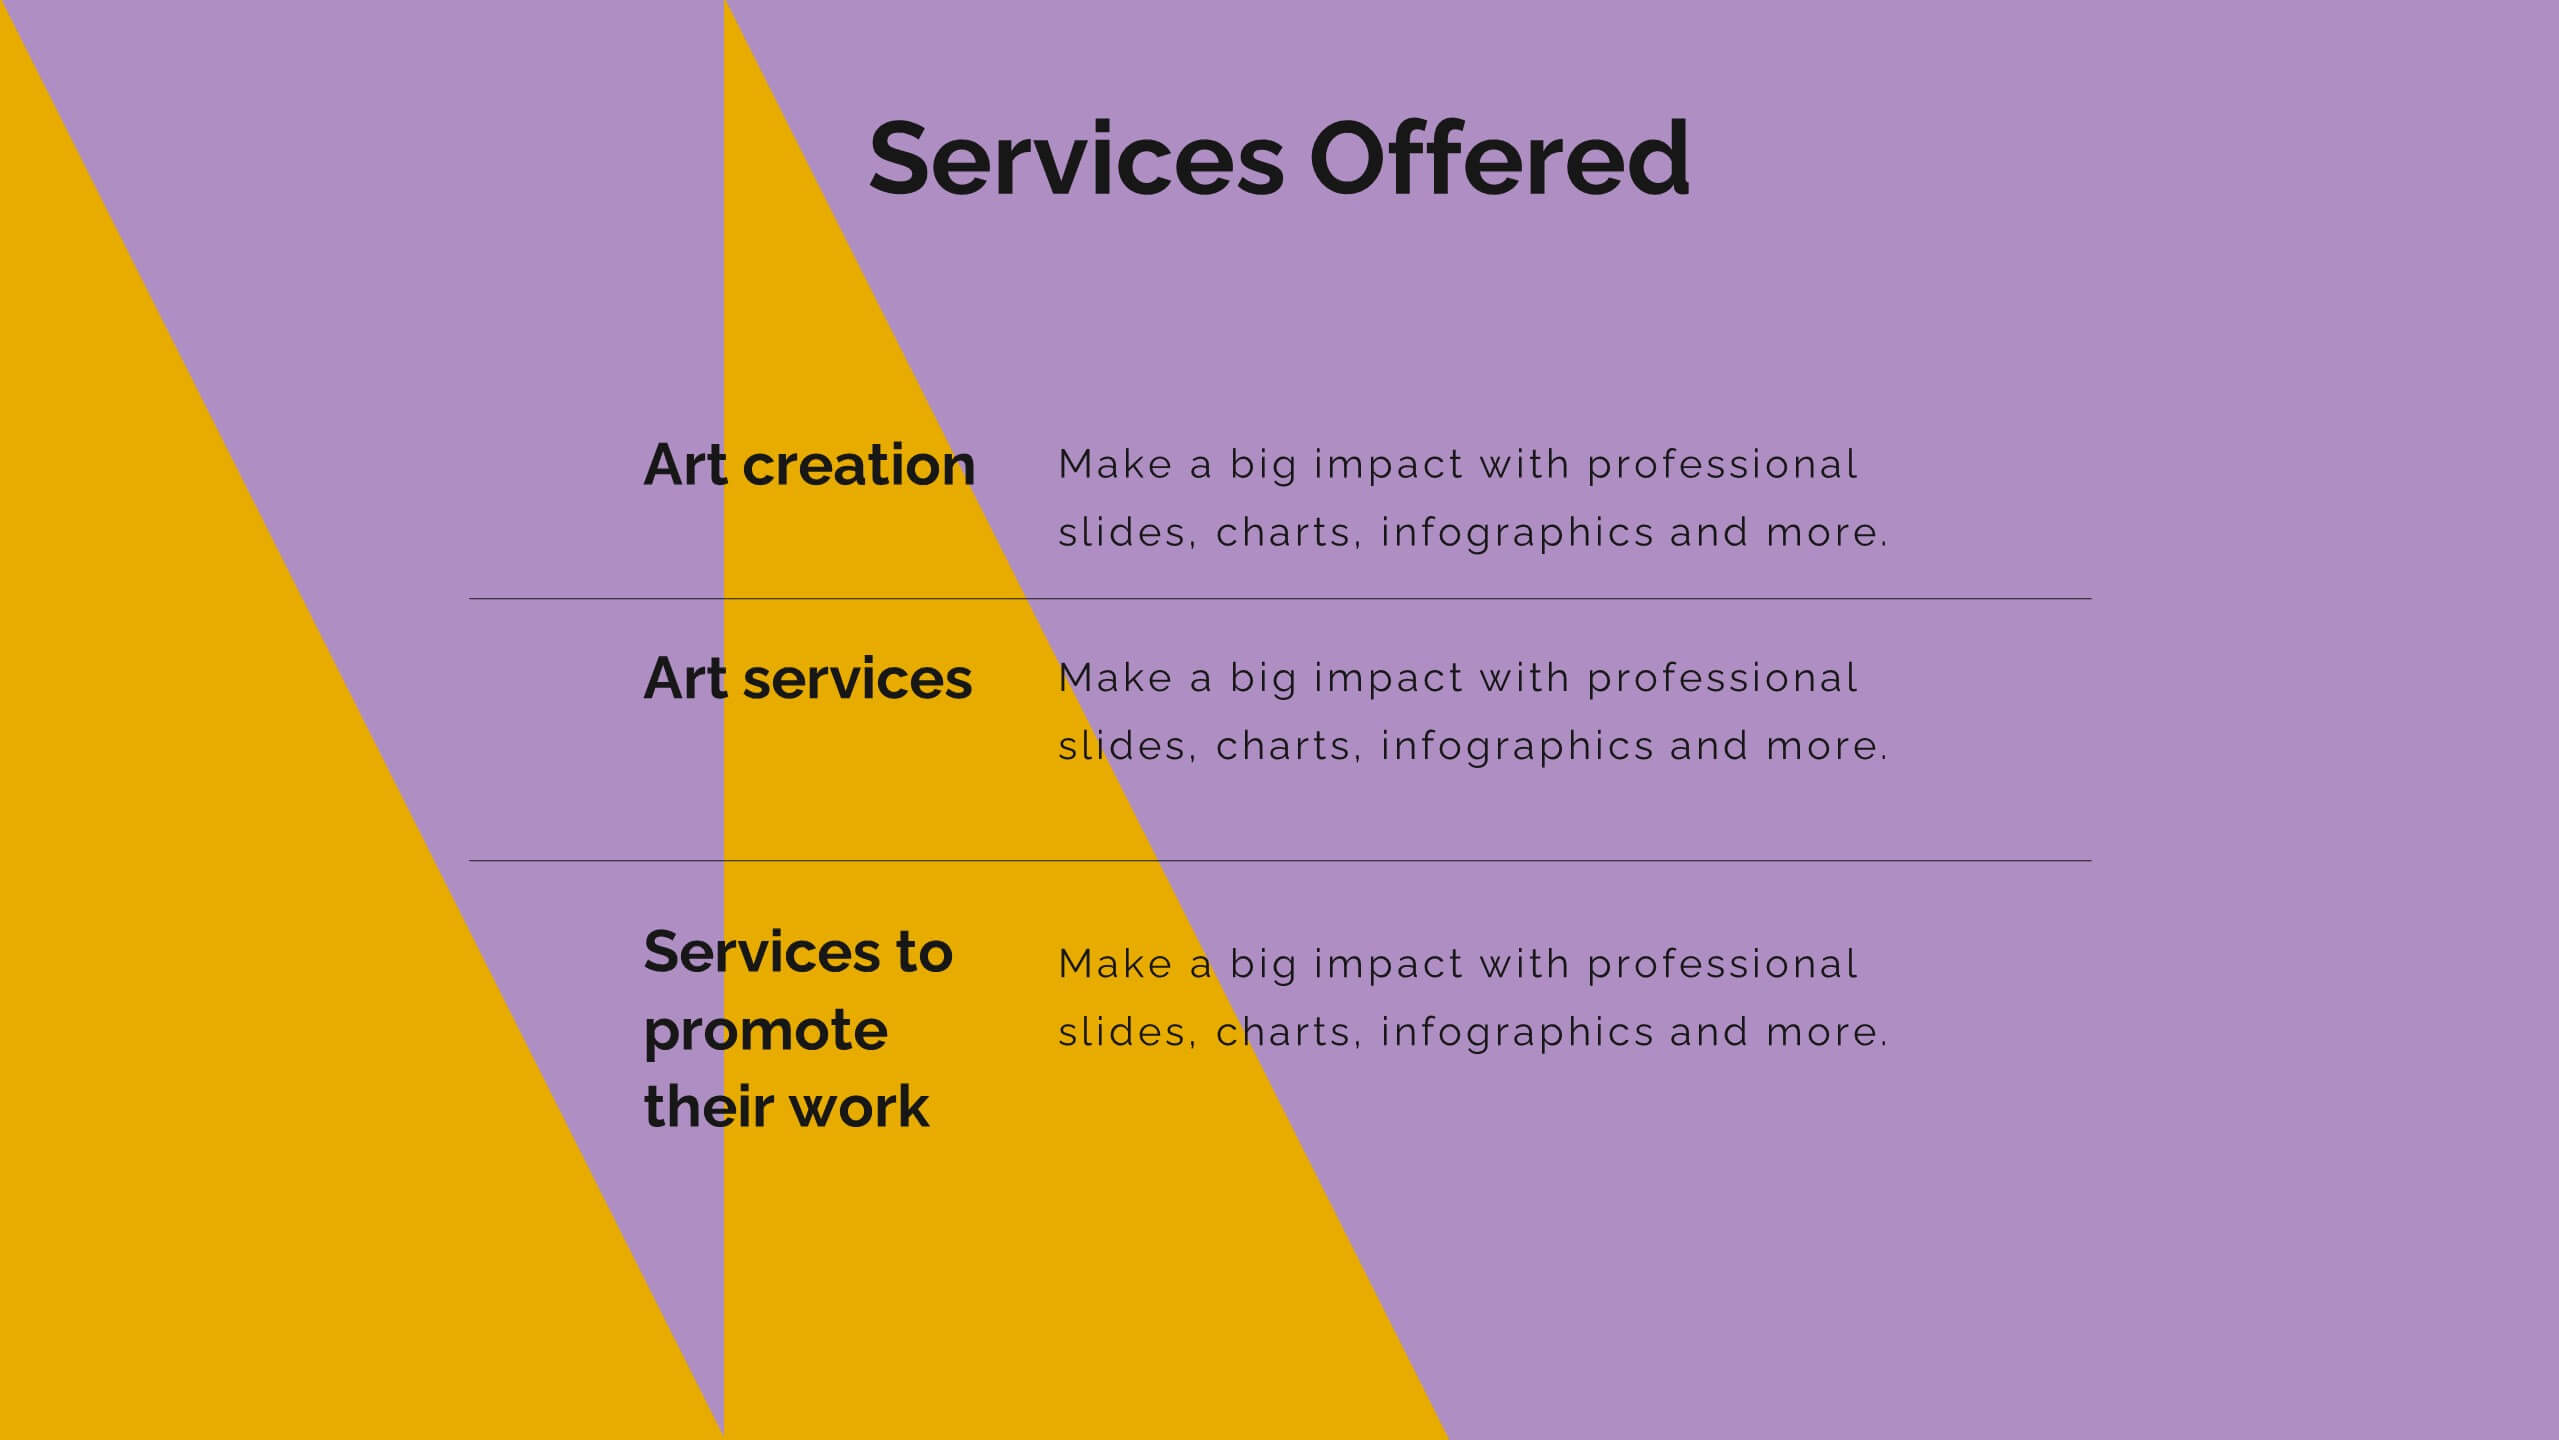
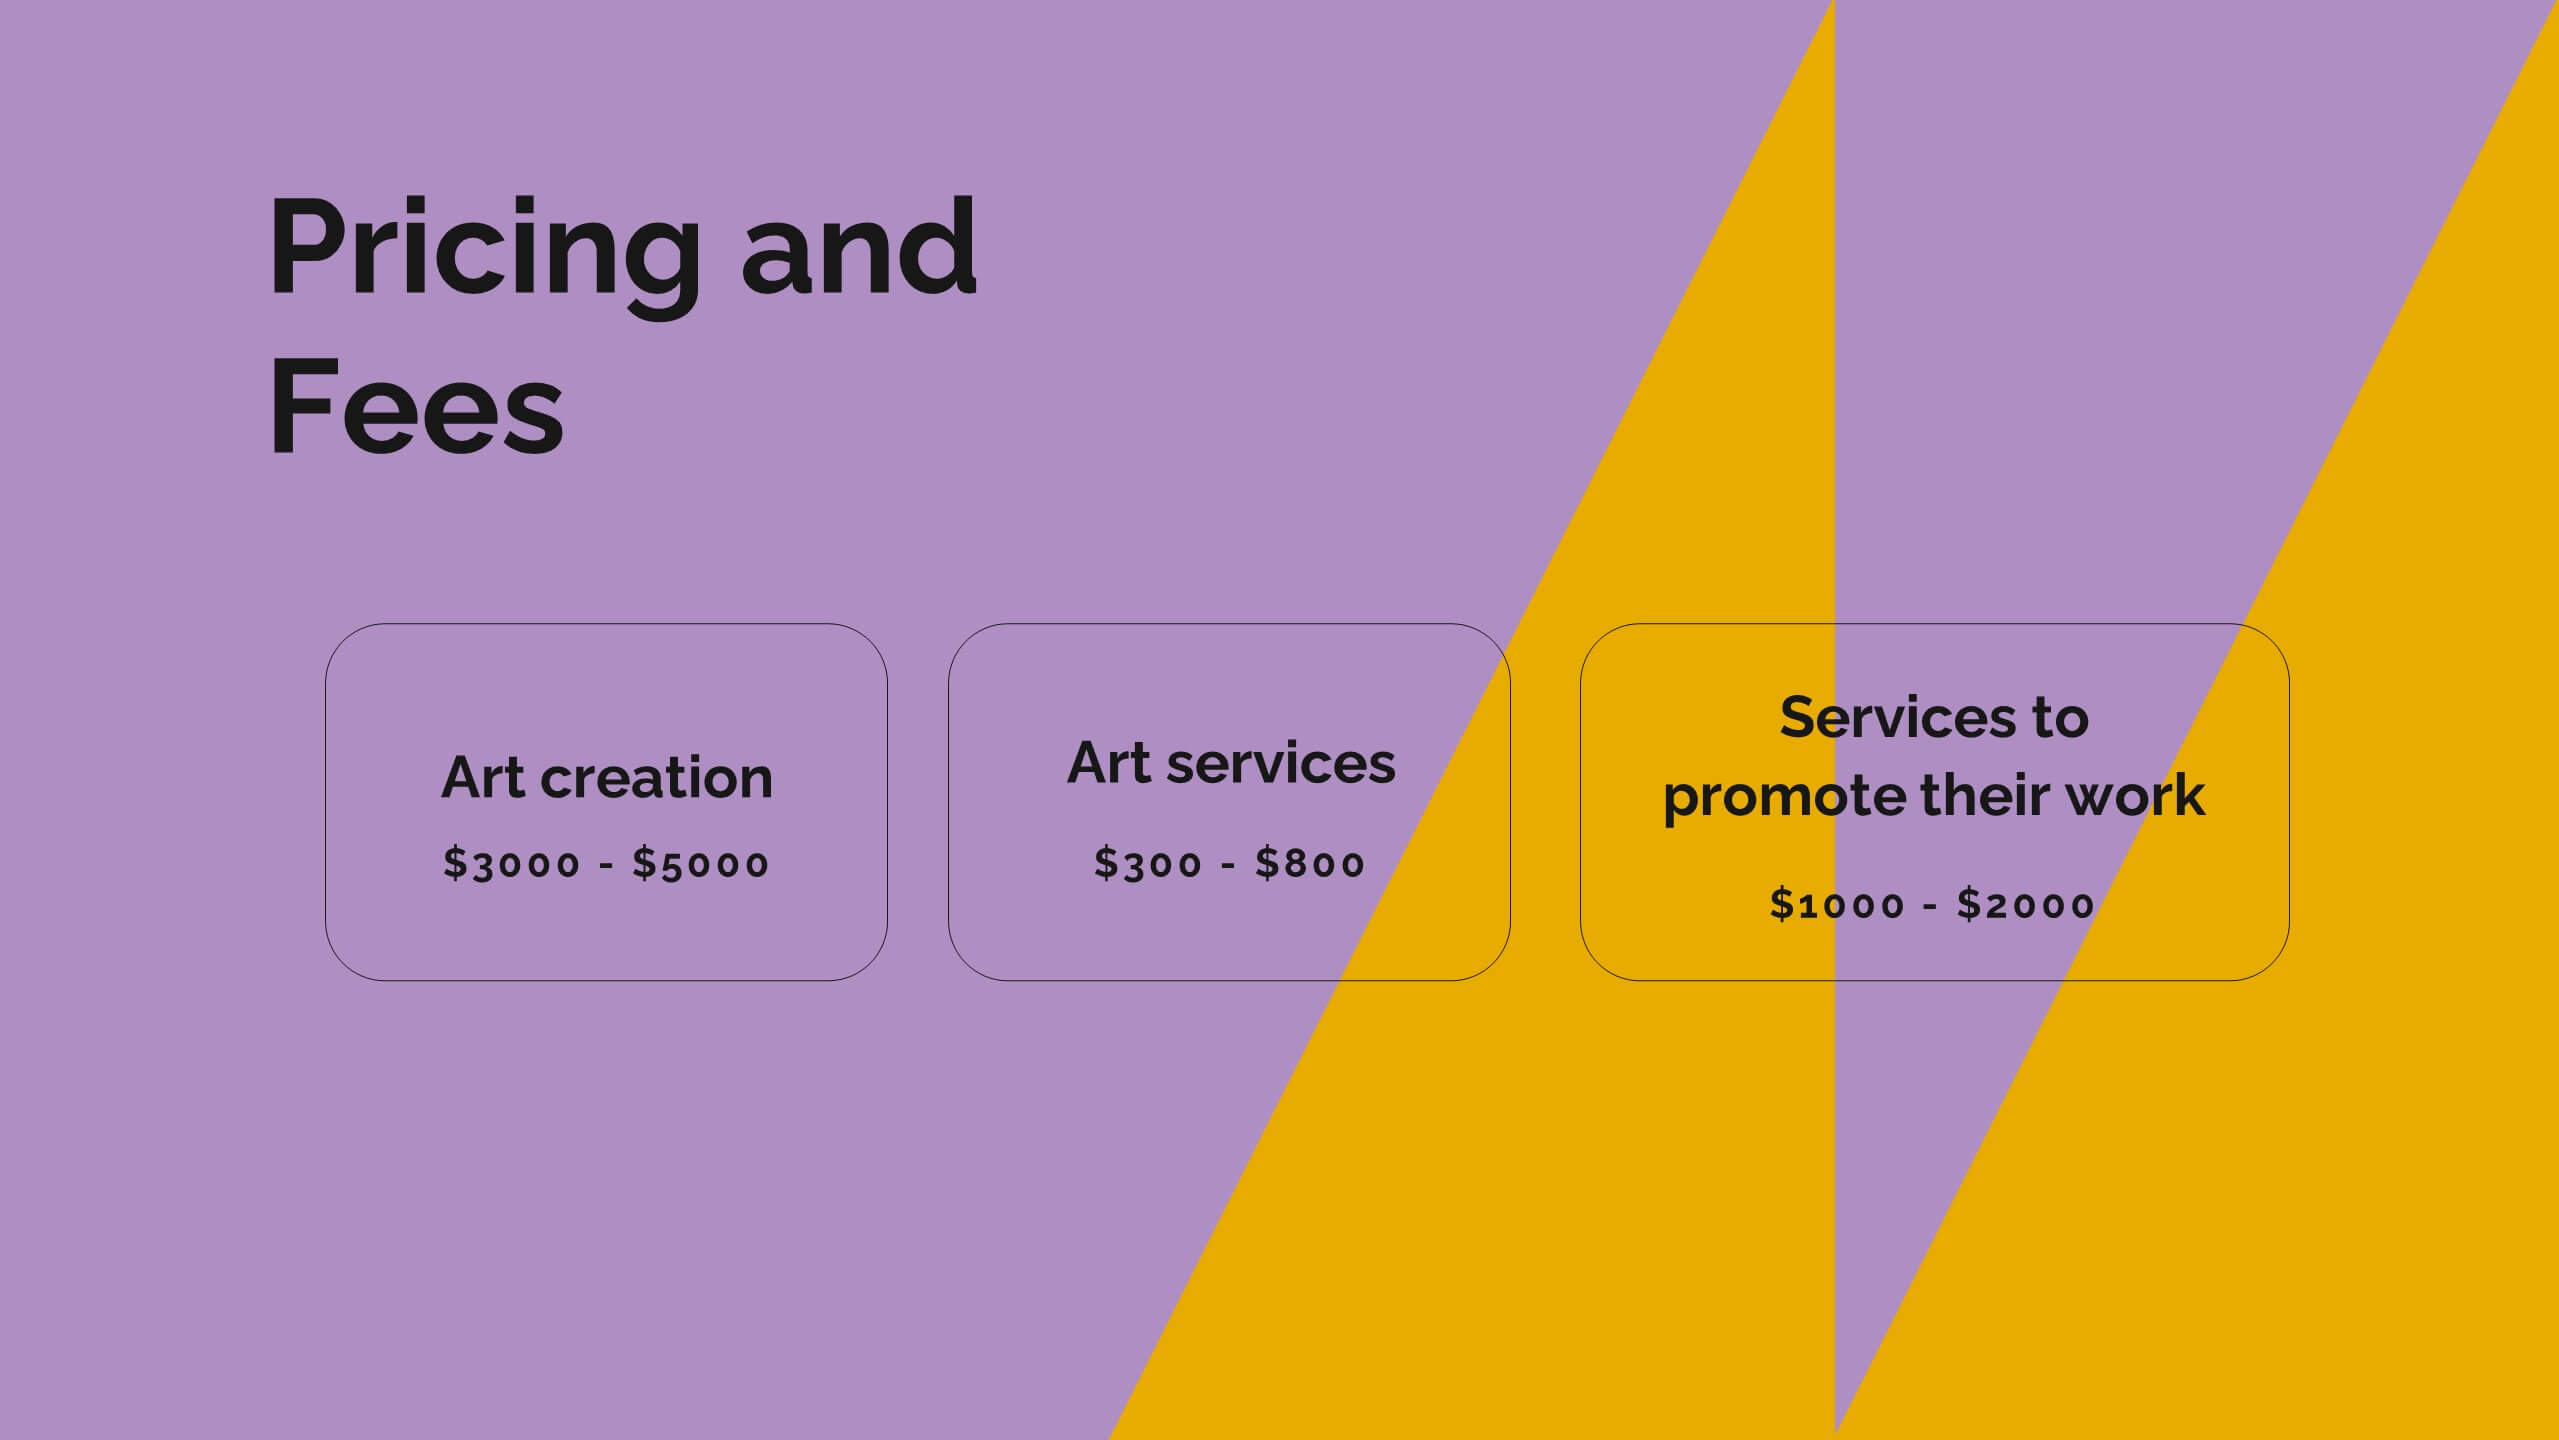
Vortex Artist Portfolio Template Presentation
Showcase your artistic brilliance with this eye-catching portfolio presentation template! Perfect for highlighting your projects, creative process, and awards, it features vibrant slides for your philosophy, collaborations, and client testimonials. Impress potential clients and collaborators with a stunning, well-organized portfolio. Compatible with PowerPoint, Keynote, and Google Slides for seamless presentations on any platform.


5 diapositivas
Cryptocurrency Investment Overview Presentation
Capture the excitement of digital investing with this clean, modern layout designed to visualize market performance, asset insights, and portfolio trends. Perfect for financial analysts, startups, and educators, it simplifies complex data into engaging visuals. Fully compatible with PowerPoint, Keynote, and Google Slides for seamless editing and presentation delivery.


6 diapositivas
Bubble Diagram for Idea Development Presentation
Visualize your creative process with this Bubble Diagram for Idea Development template. Ideal for brainstorming sessions, project planning, and innovation strategies, this slide uses color-coded lightbulbs and numbered bubbles to illustrate key ideas and their relationships. Perfect for entrepreneurs, teams, and educators, it simplifies complex concepts into a clear, engaging format. Fully editable and compatible with PowerPoint, Keynote, and Google Slides for seamless customization.


5 diapositivas
North America Business Landscape Map Presentation
Explore the business terrain with the "North America Business Landscape Map" template, which delivers a comprehensive visualization of business data across various regions. Designed for strategic presentations, it enables clear communication of market insights and data points, crucial for decision-making. This template is compatible with PowerPoint, Keynote, and Google Slides, enhancing its utility for professionals in diverse fields.


4 diapositivas
Onboarding 30-60-90 Roadmap Presentation
Simplify your onboarding strategy with the Onboarding 30–60–90 Roadmap Presentation. This clean, visual layout breaks down employee integration into three distinct timeframes—30, 60, and 90 days—each with space for goals, tasks, or milestones. Perfect for HR teams, managers, and trainers. Fully editable in Canva, PowerPoint, Keynote, and Google Slides.


4 diapositivas
Workflow Phases and Team Coordination Presentation
Clarify responsibilities and sequence with the Workflow Phases and Team Coordination Presentation. This structured diagram template helps visualize how tasks move through different phases and how teams interact at each step. Perfect for project managers, team leads, and operations specialists looking to streamline collaboration. Compatible with PowerPoint, Keynote, and Google Slides.


8 diapositivas
Quarterly Sales Report Presentation
Streamline your quarterly sales review with our "Quarterly Sales Report Presentation" template. This infographic is expertly designed to display sales data across various categories, using a series of shopping cart icons that represent different products or services. Each cart is labeled with a title and associated with a percentage, clearly illustrating sales performance metrics. The color-coded elements help distinguish between different data points, making complex information easily digestible. Ideal for sales managers and teams, this template aids in analyzing trends, identifying growth opportunities, and planning future sales strategies. Compatible with PowerPoint, Keynote, and Google Slides, it's a vital tool for effective sales presentations.


6 diapositivas
Vision Statement Development Guide
Craft a powerful company vision with this eye-catching layout—literally. Centered around a bold visual icon, this slide helps you organize six core ideas or values that shape your future direction. It’s perfect for strategy workshops, leadership meetings, or branding sessions. Fully compatible with PowerPoint, Keynote, and Google Slides.