


Características


¿Tienes alguna pregunta?
Recomendar


7 diapositivas
5G Infographic Presentation Template
A 5G infographic is data related to the 5th generation of mobile telecommunications technology. This infographic template is an engaging way to display facts and figures, and attract attention from a wide audience. The main purpose of our 5G infographic template is to help you educate others about the new technology and its capabilities, and to help promote understanding of 5G. The information presented in this infographic can range from details, such as the differences between 5G and previous generations of mobile networks, and the benefits and potential applications of 5G.


6 diapositivas
Leadership Development Infographics
Foster leadership growth with our Leadership Development infographic template. This template is fully compatible with popular presentation software like PowerPoint, Keynote, and Google Slides, allowing you to easily customize it to illustrate and communicate various aspects of leadership development. The Leadership Development infographic template offers a visually engaging platform to explore and explain the principles, strategies, and practices related to nurturing leadership skills within individuals and organizations. Whether you're an HR professional, business leader, educator, or aspiring leader, this template provides a user-friendly canvas to create informative presentations and educational materials. Enhance your knowledge of Leadership Development with this SEO-optimized infographic template, thoughtfully designed for clarity and ease of use. Customize it to highlight key leadership competencies, training methods, coaching approaches, and the impact of effective leadership on organizational success. Ensure that your audience gains valuable insights into the world of leadership development. Start crafting your personalized infographic today to empower leadership growth.


20 diapositivas
Emerald Sales Forecast Presentation
Shine bright with this emerald-inspired presentation, perfect for sharing your sales forecast! Designed to showcase revenue projections, market trends, and sales strategies, this template keeps your data organized and visually impactful. Its vibrant, clean design ensures your forecast captures attention. Compatible with PowerPoint, Keynote, and Google Slides.


4 diapositivas
Survey Response Data Visuals Presentation
Present your survey data clearly with this radial icon-based layout. Show response percentages alongside descriptive titles and modern visuals. Ideal for feedback analysis or research summaries. Fully editable in Canva, PowerPoint, or Google Slides, this template offers a clean, professional look to highlight key insights with ease.


6 diapositivas
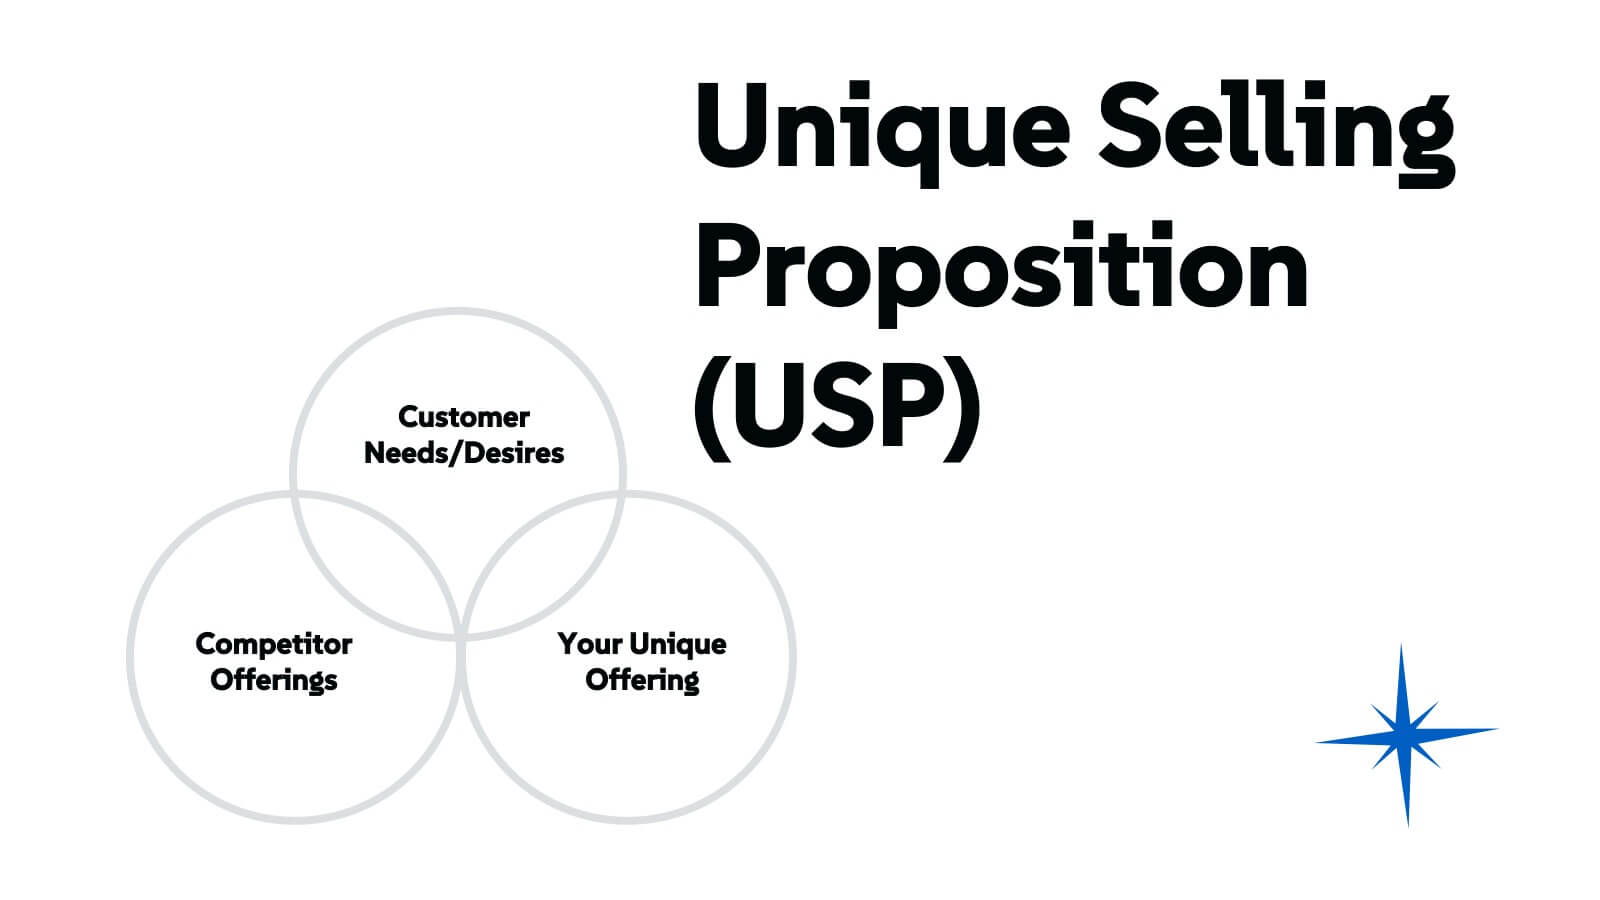
Venn Diagram
A Venn diagram is a visual representation of the relationships between different sets or groups. This infographic template consists of overlapping circles, each representing a specific set, and the overlapping parts indicates the elements that belong to multiple sets. Use this infographic to illustrate the relationships between different sets of data or concepts. The main components of the infographic are the circles or ellipses that represent the sets being compared. The size and position of the circles can be adjusted to reflect the data accurately. This infographic is fully customizable and compatible with Powerpoint, Keynote, and Google Slides.


3 diapositivas
Company Mission Overview Presentation
Bring your message to life with a bright, modern slide that highlights purpose, direction, and organizational goals in a clean, engaging layout. This presentation helps you communicate mission-driven insights with clarity and visual impact, making it ideal for internal teams or stakeholders. Fully compatible with PowerPoint, Keynote, and Google Slides.


8 diapositivas
Tourism Strategy and Location Guide Presentation
Planning a strategy that inspires wanderlust? This sleek presentation template helps organize global tourism goals with location-based insights, iconic visuals, and easy-to-edit layout sections. Perfect for destination marketing, regional analysis, or travel business pitches. Fully compatible with PowerPoint, Keynote, and Google Slides for effortless editing and impactful delivery.


23 diapositivas
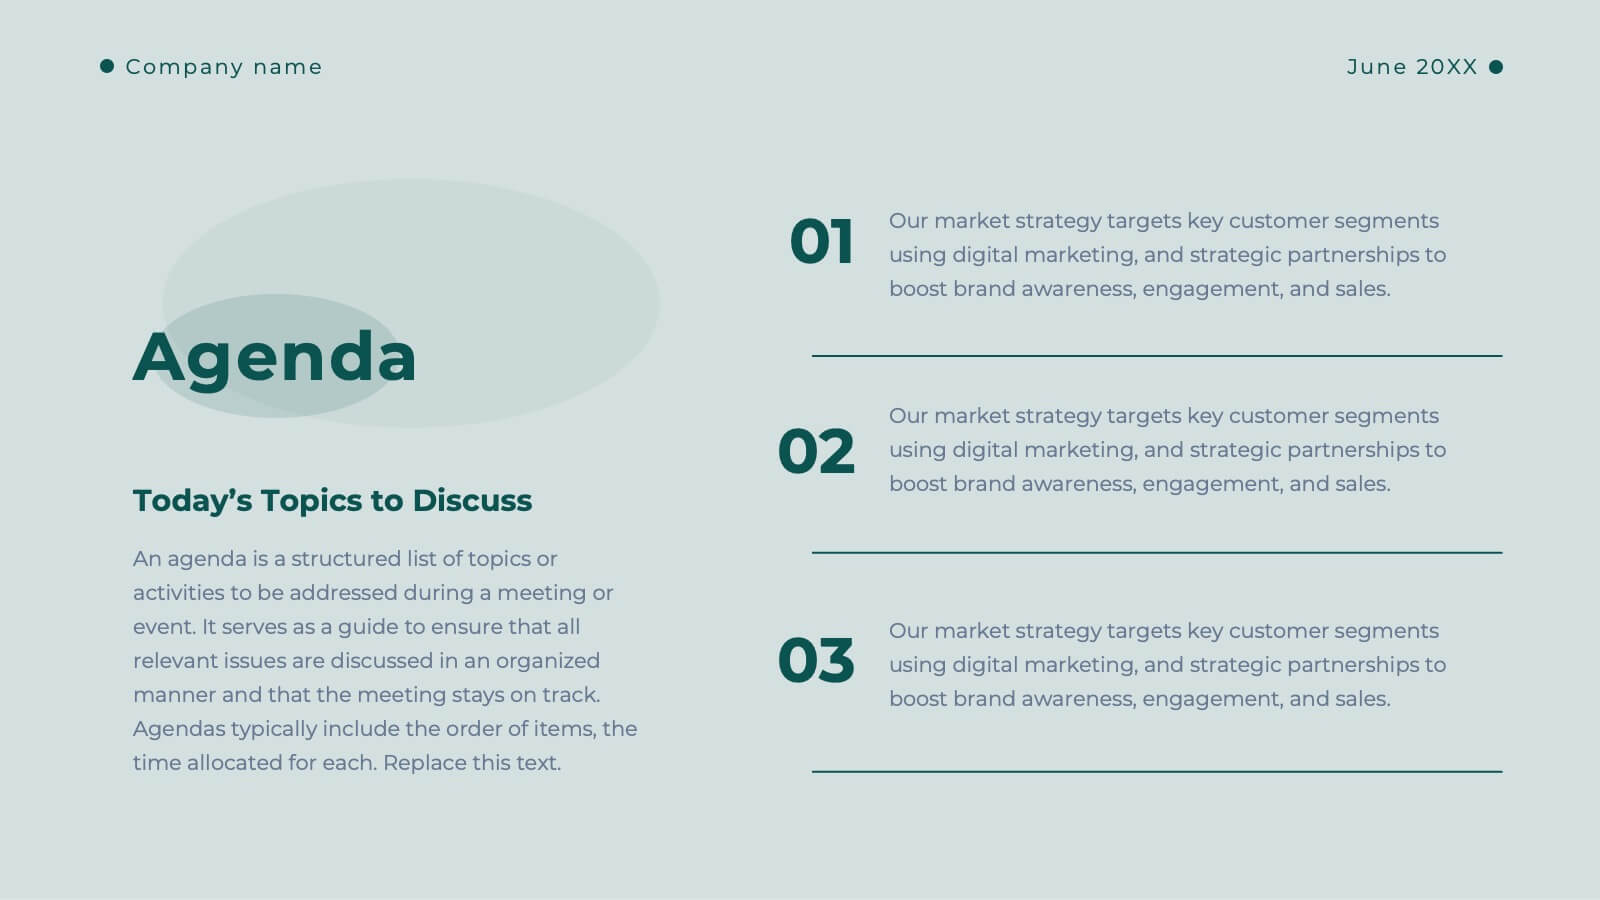
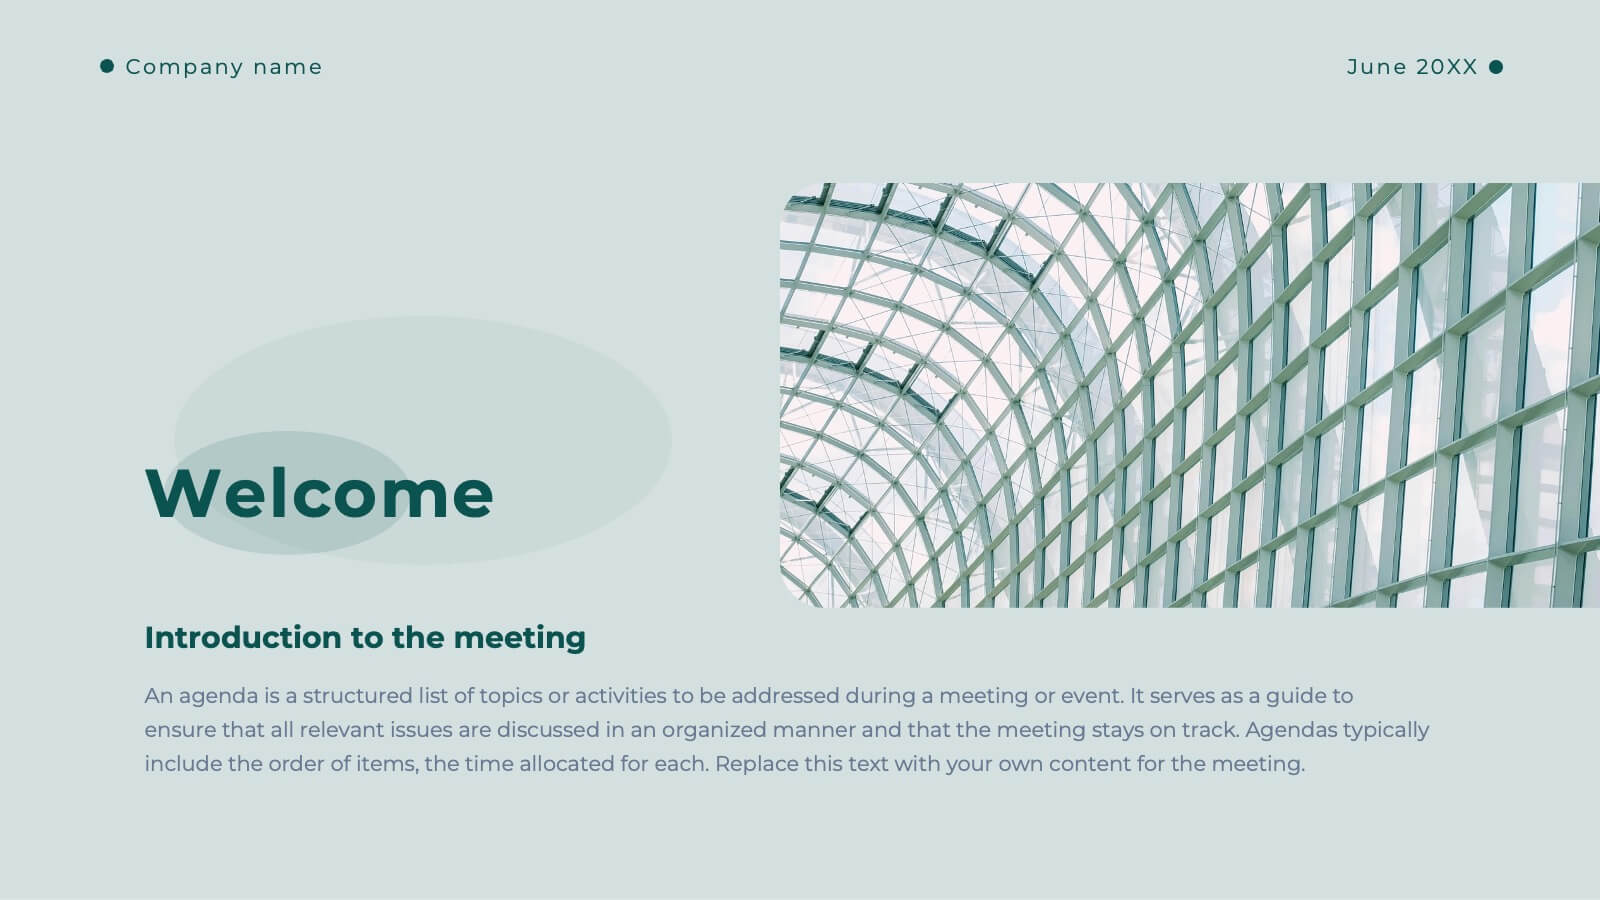
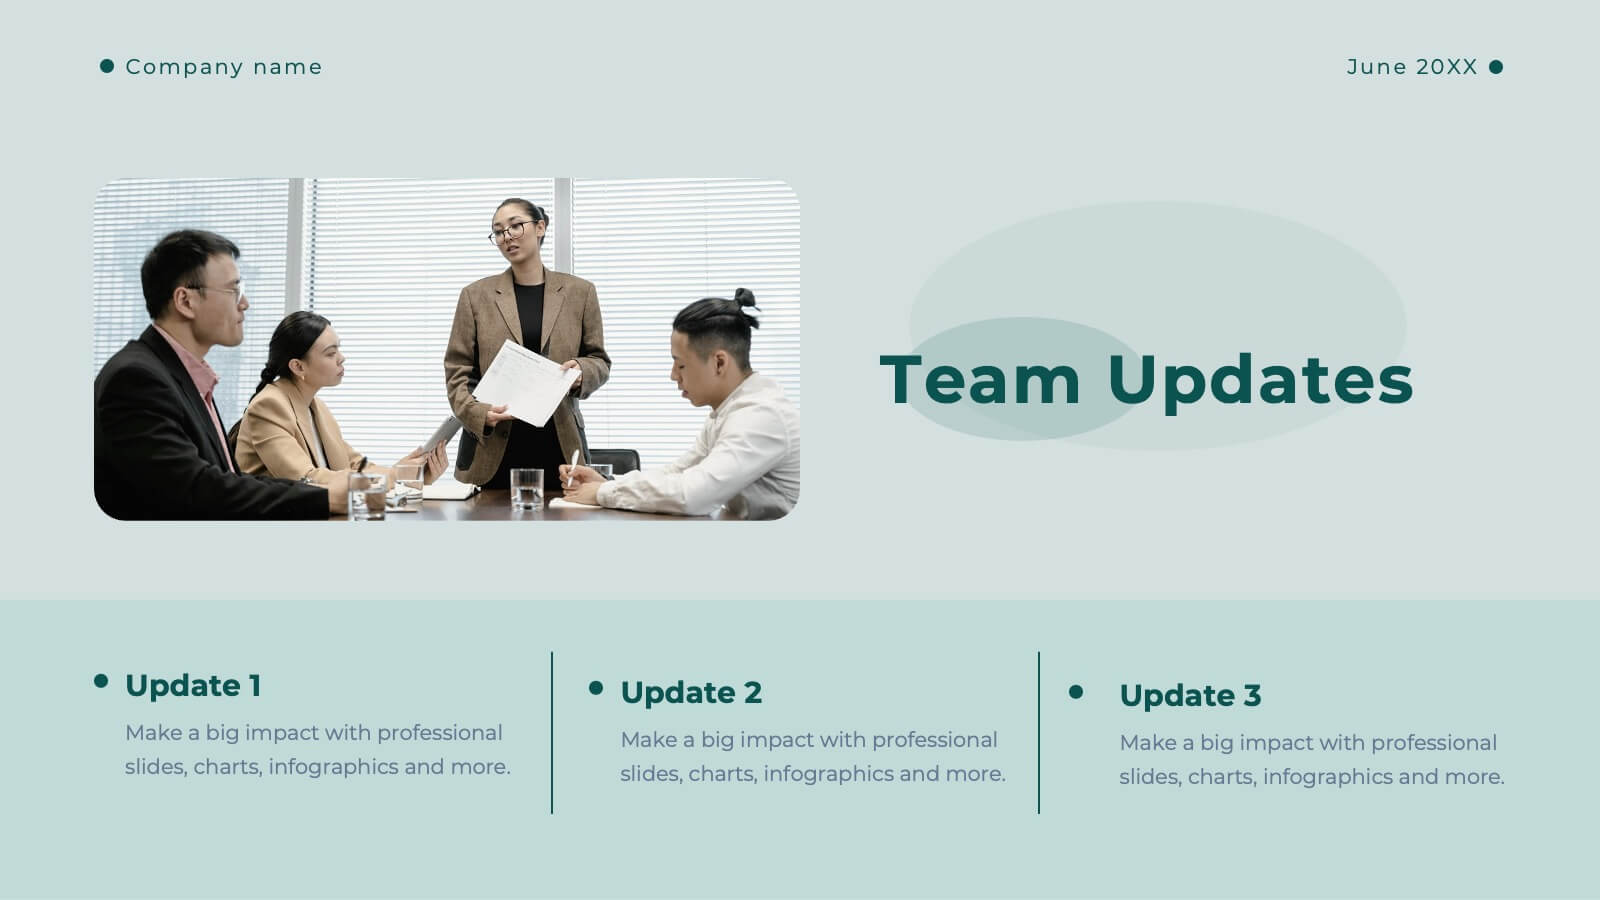
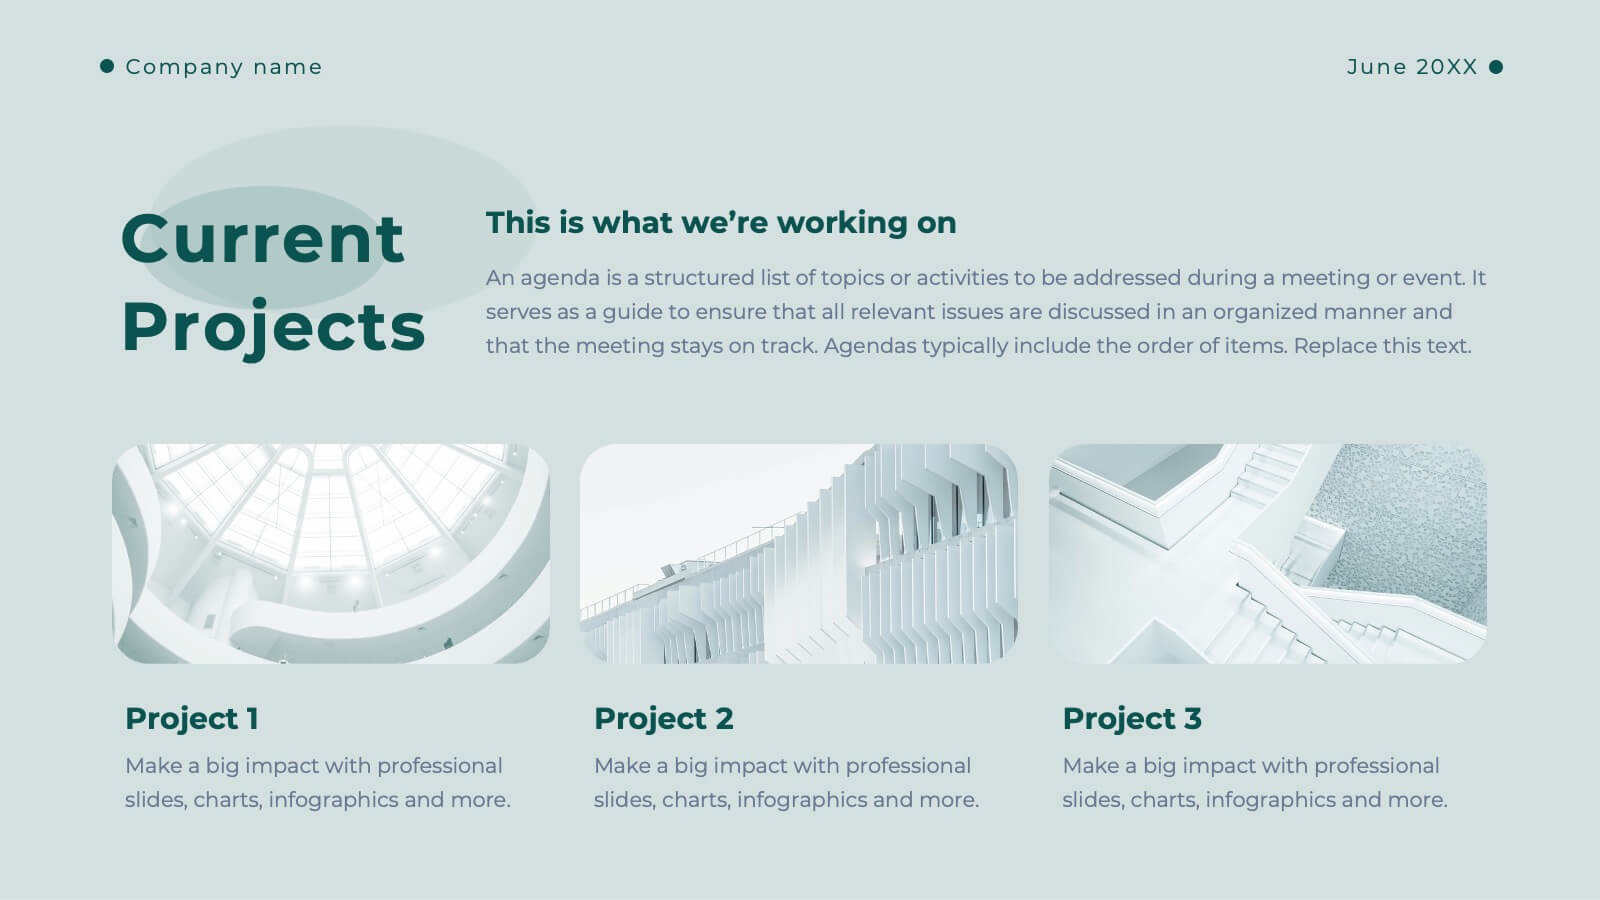
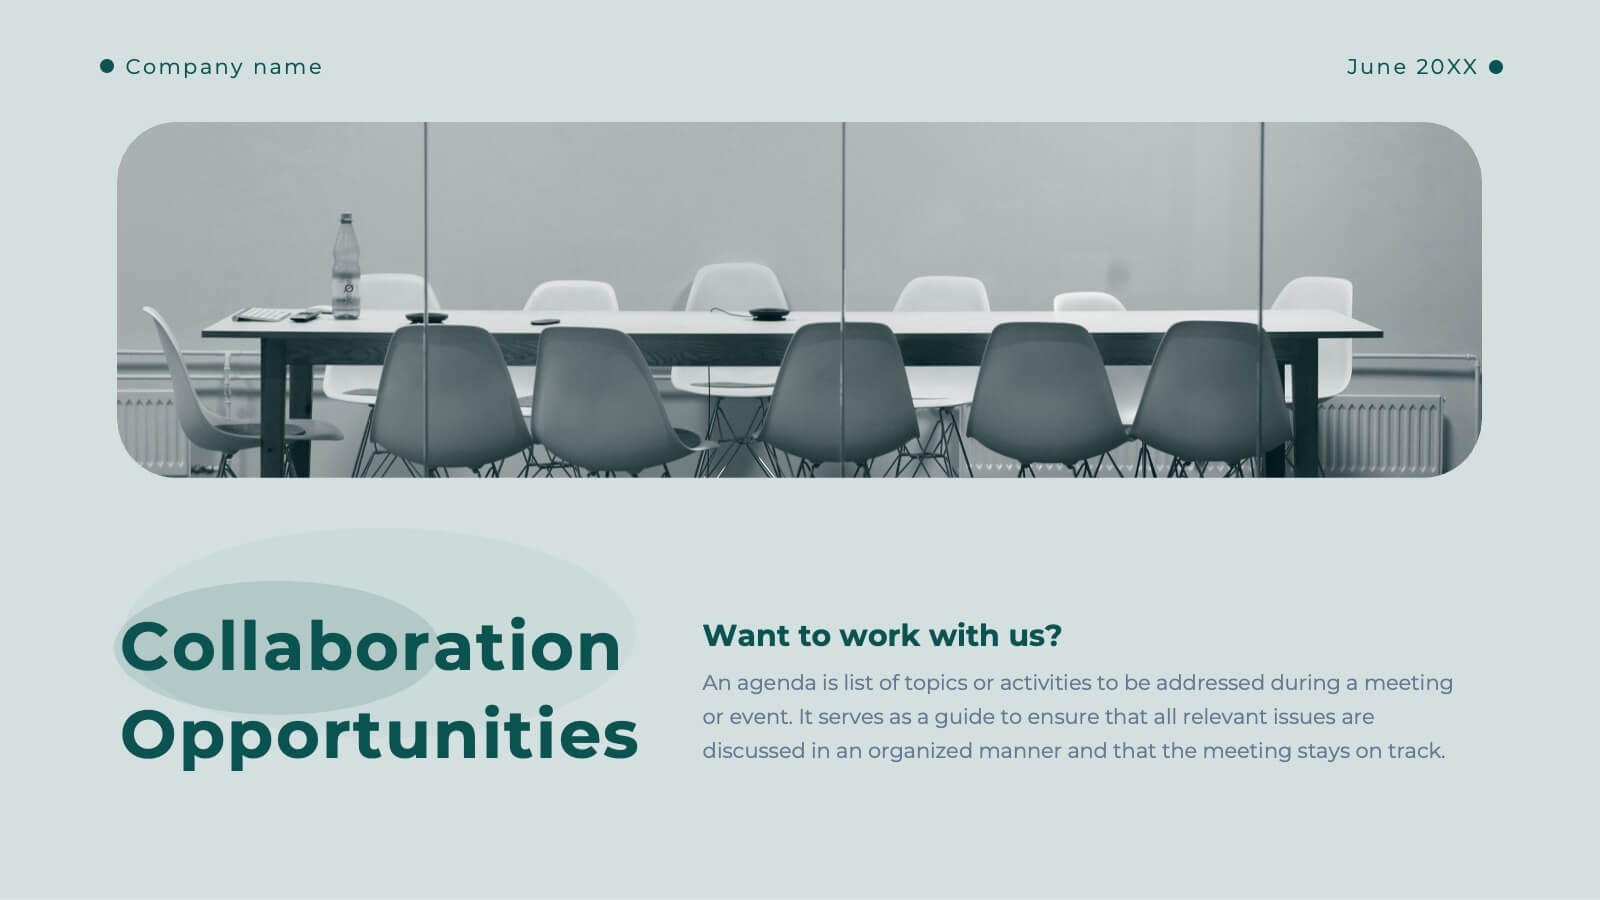
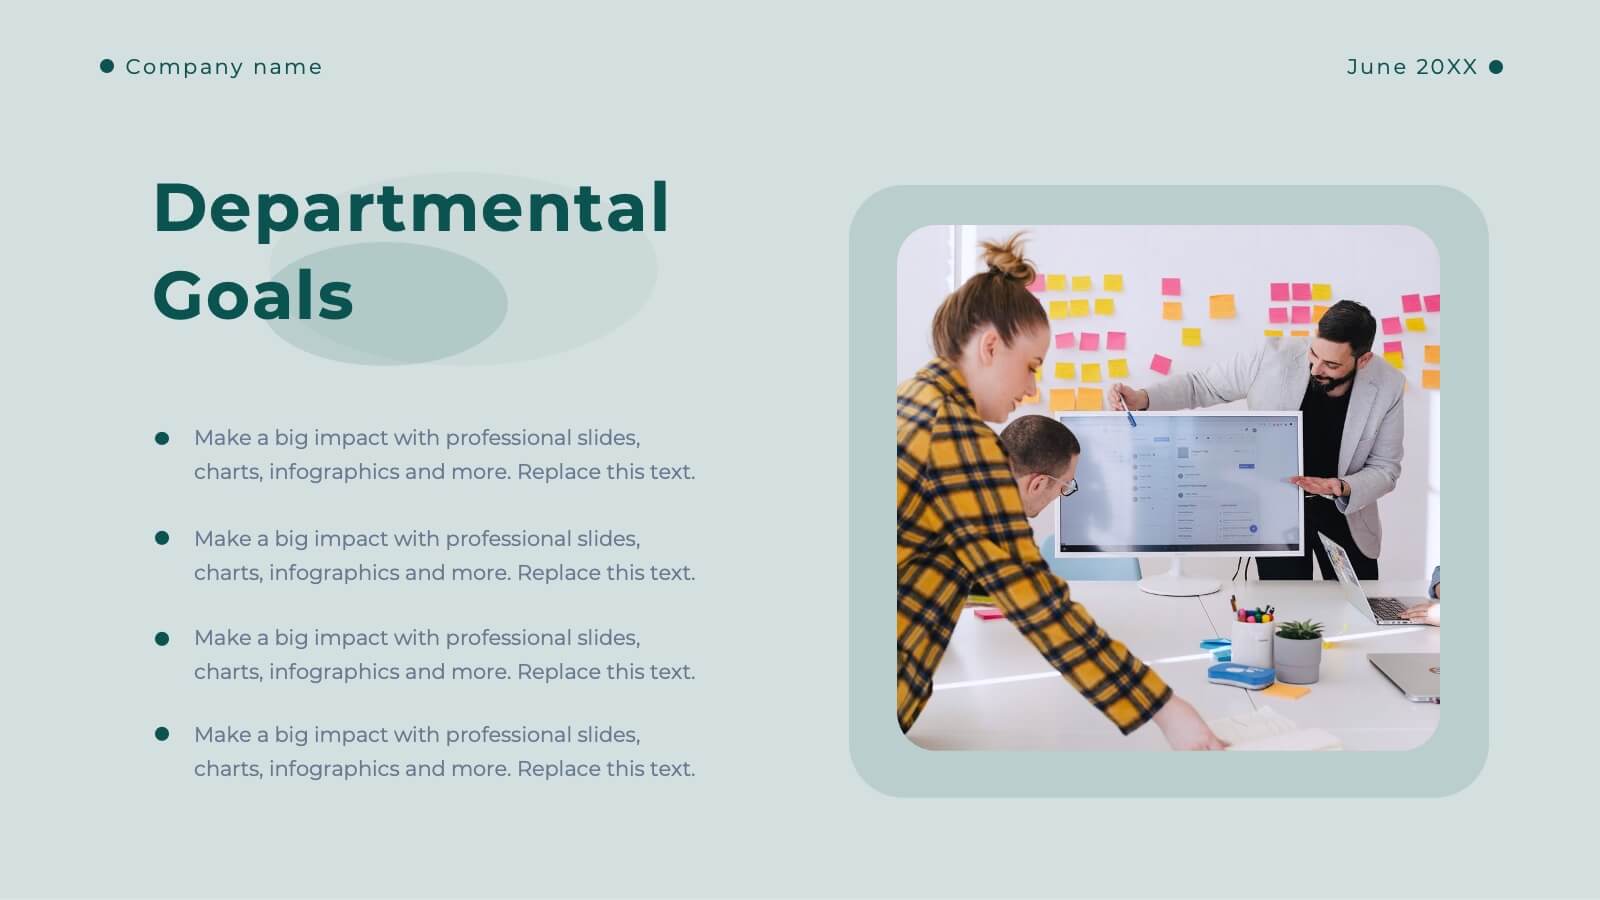
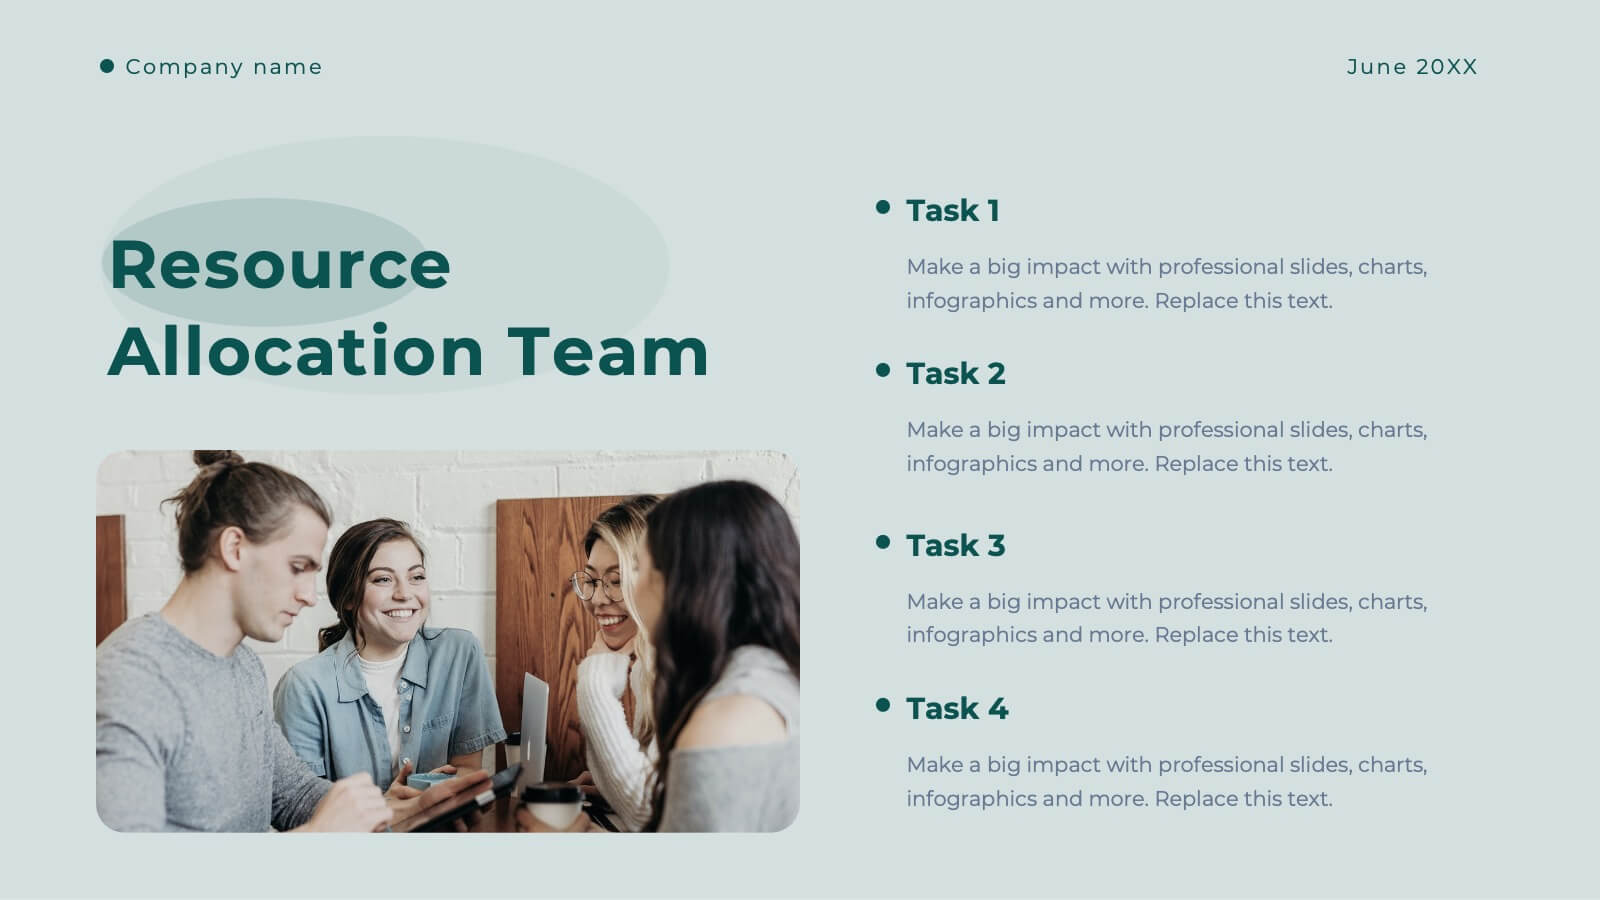
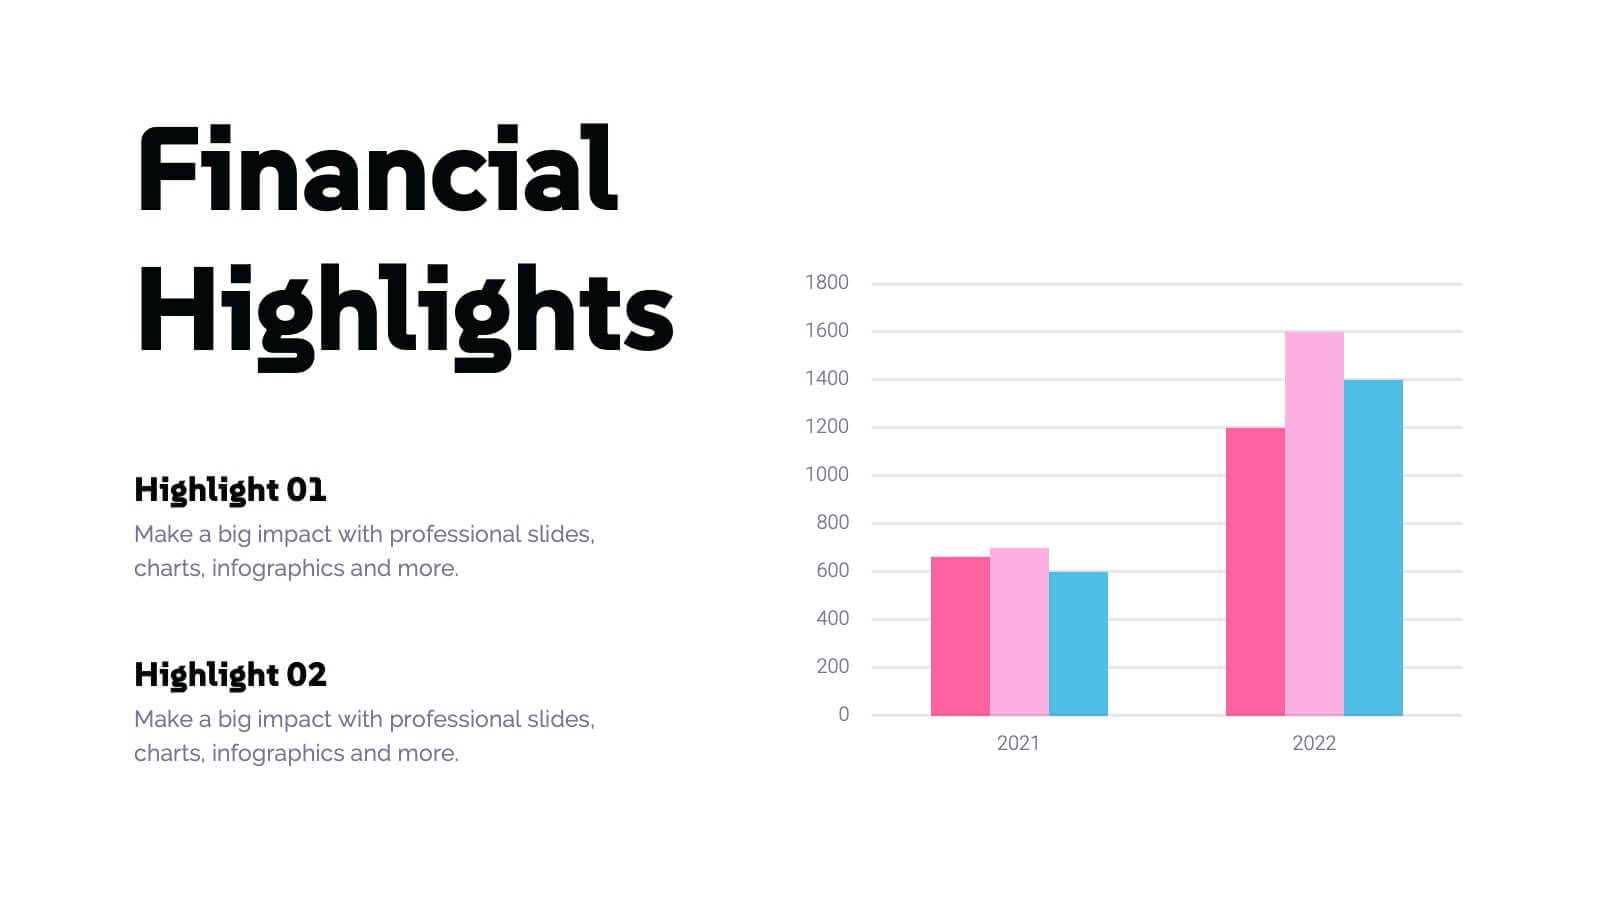
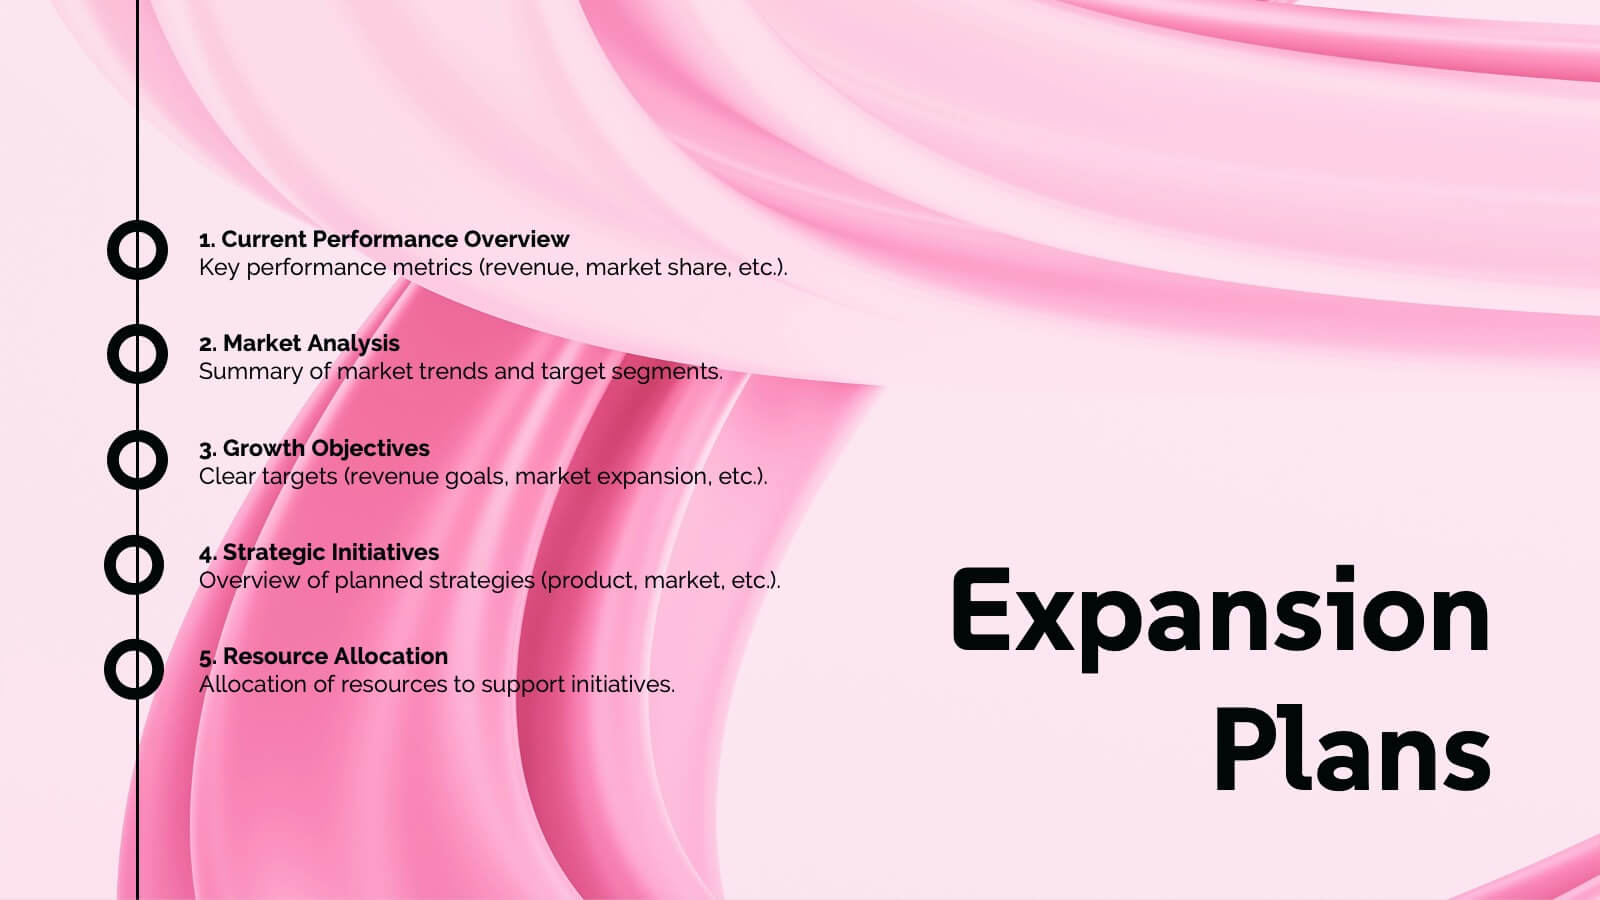
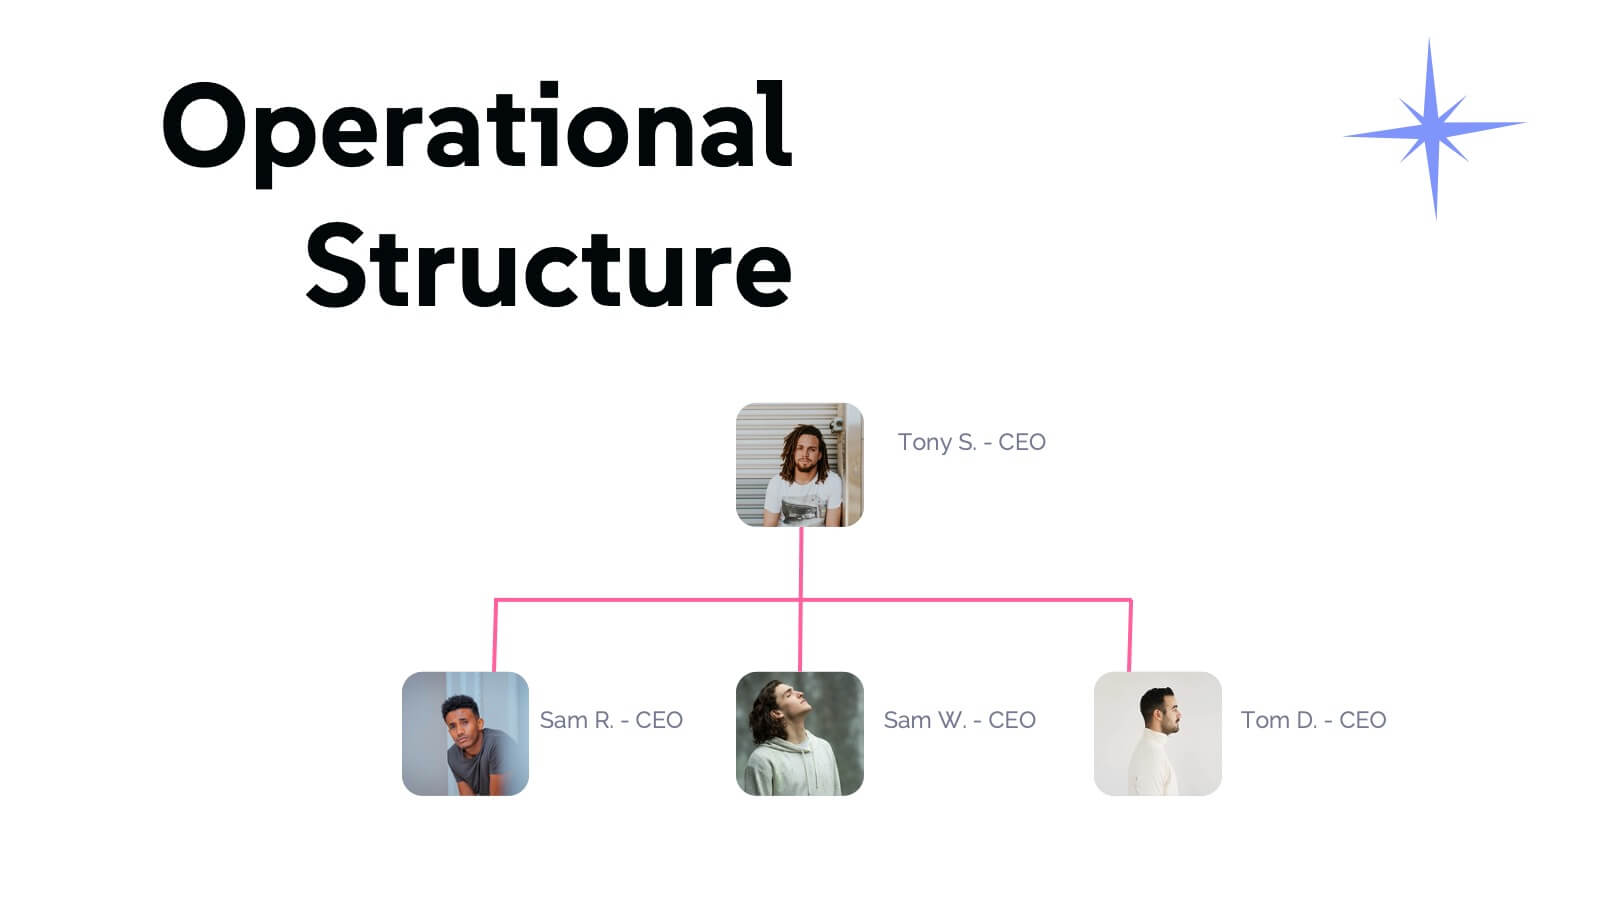
Clarity Business Operations Plan Presentation
Optimize your business operations with this sleek presentation template! Perfect for outlining team updates, key achievements, and performance metrics, it includes slides for departmental goals, process improvements, and upcoming events. Engage your team with clear visuals and detailed content. Compatible with PowerPoint, Keynote, and Google Slides for seamless presentations on any platform.


20 diapositivas
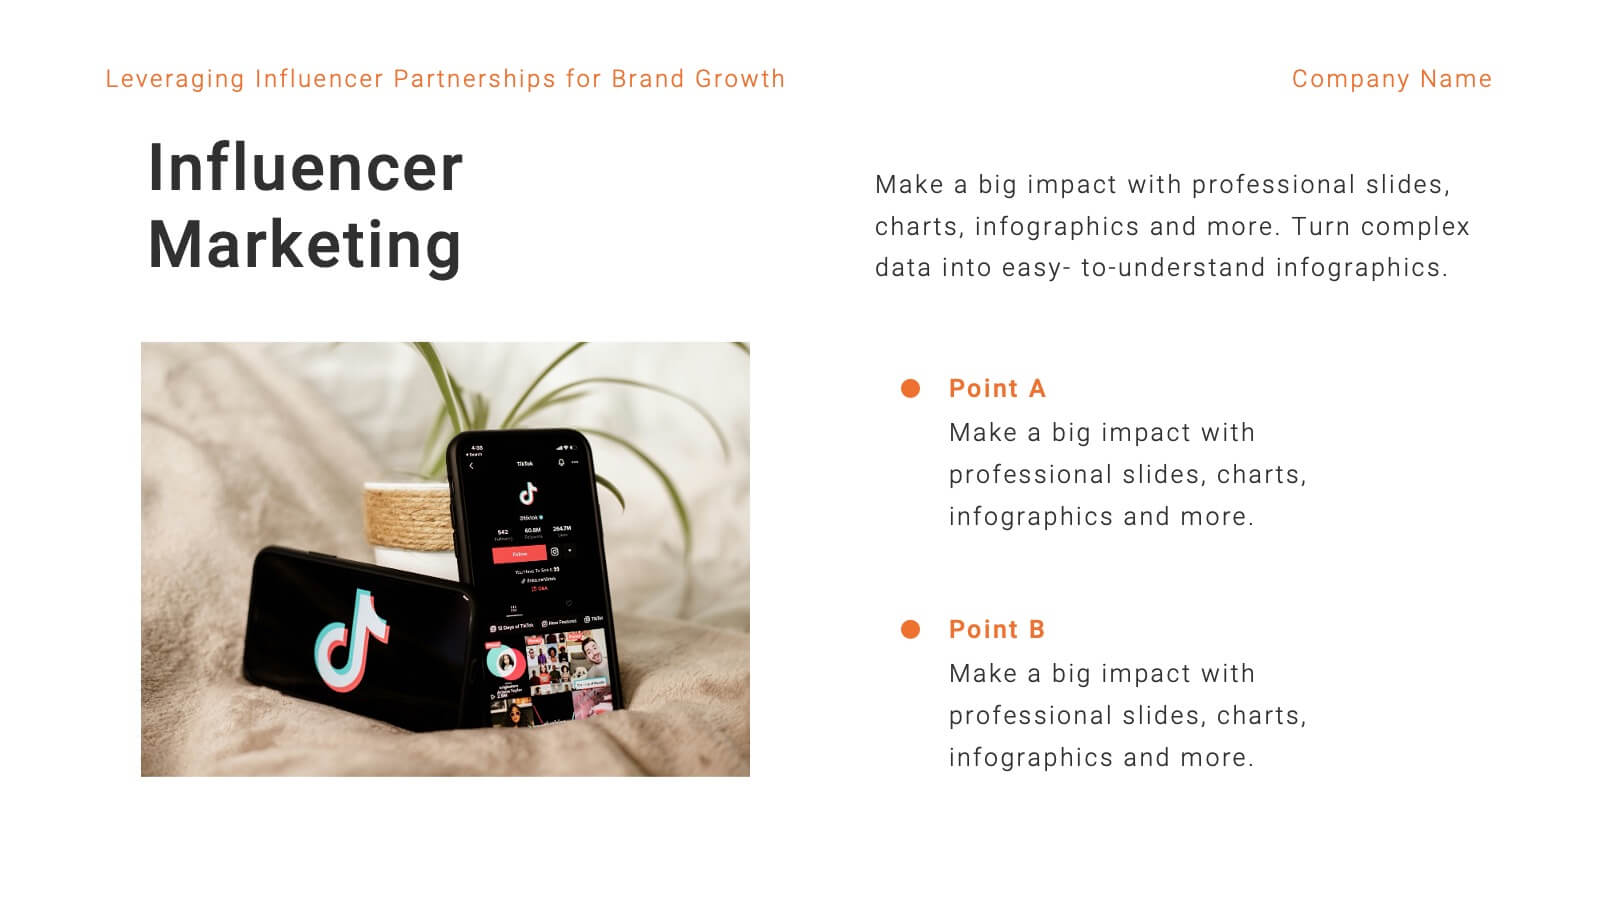
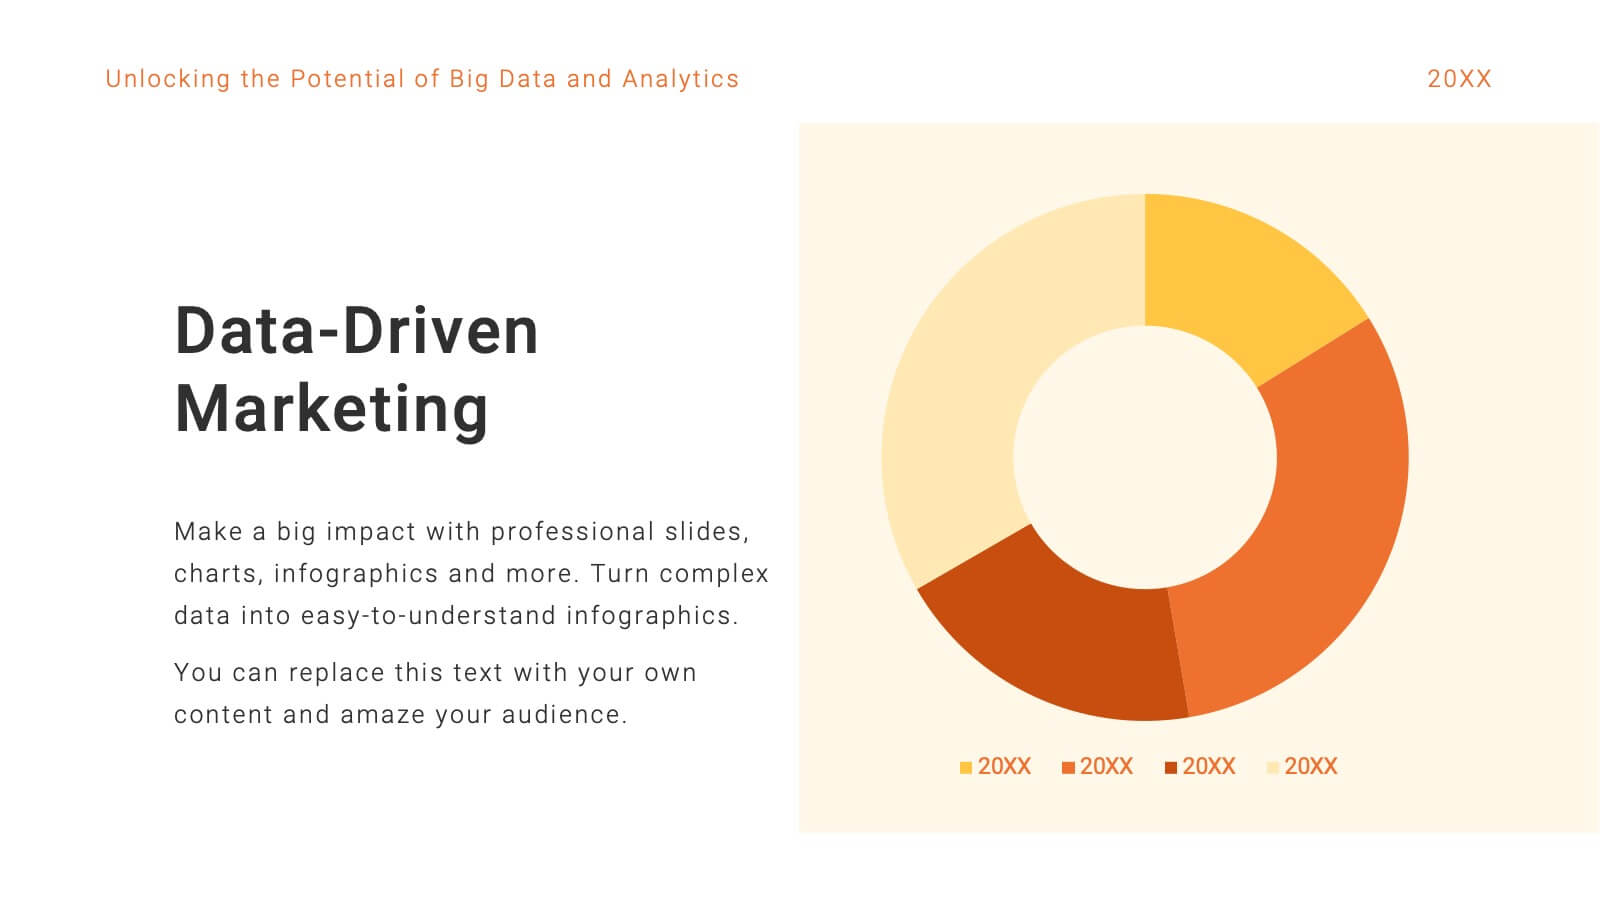
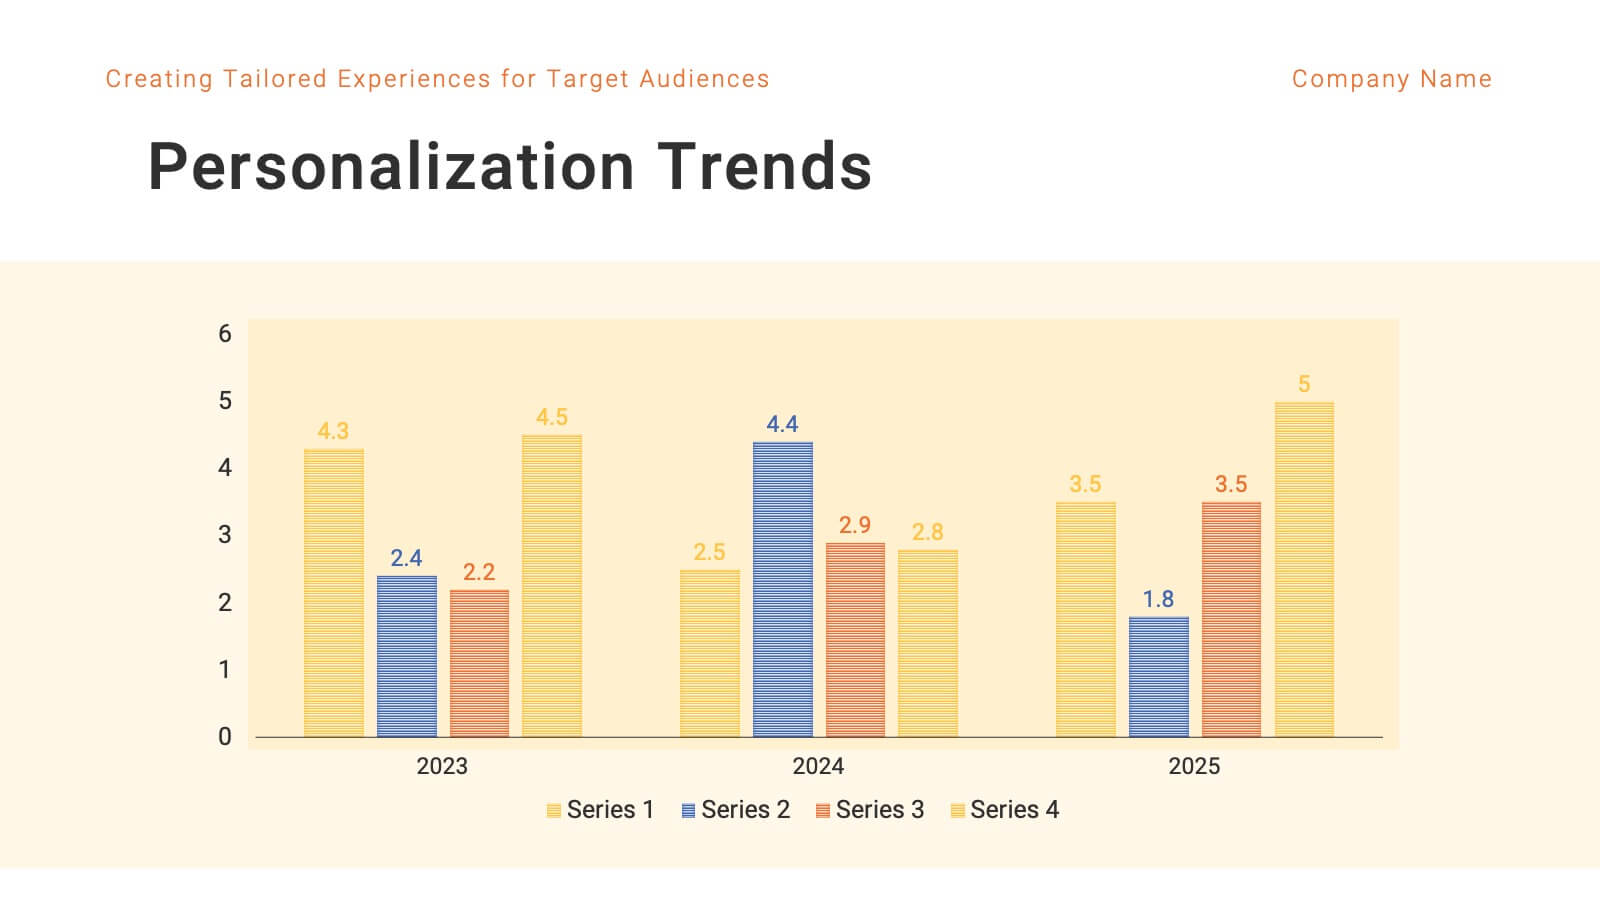
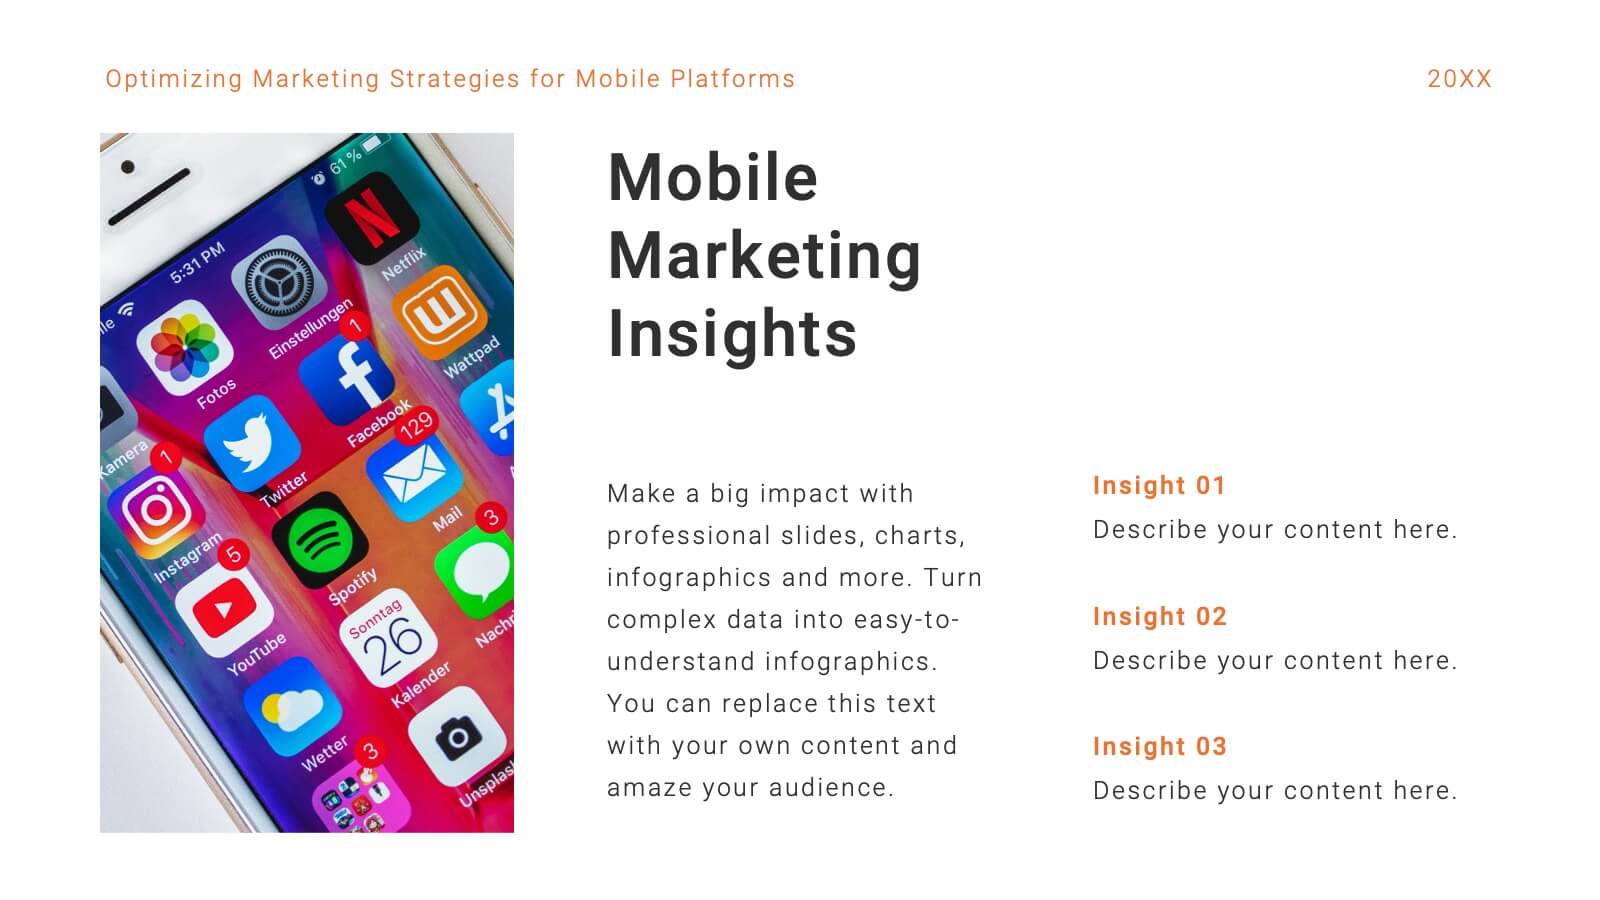
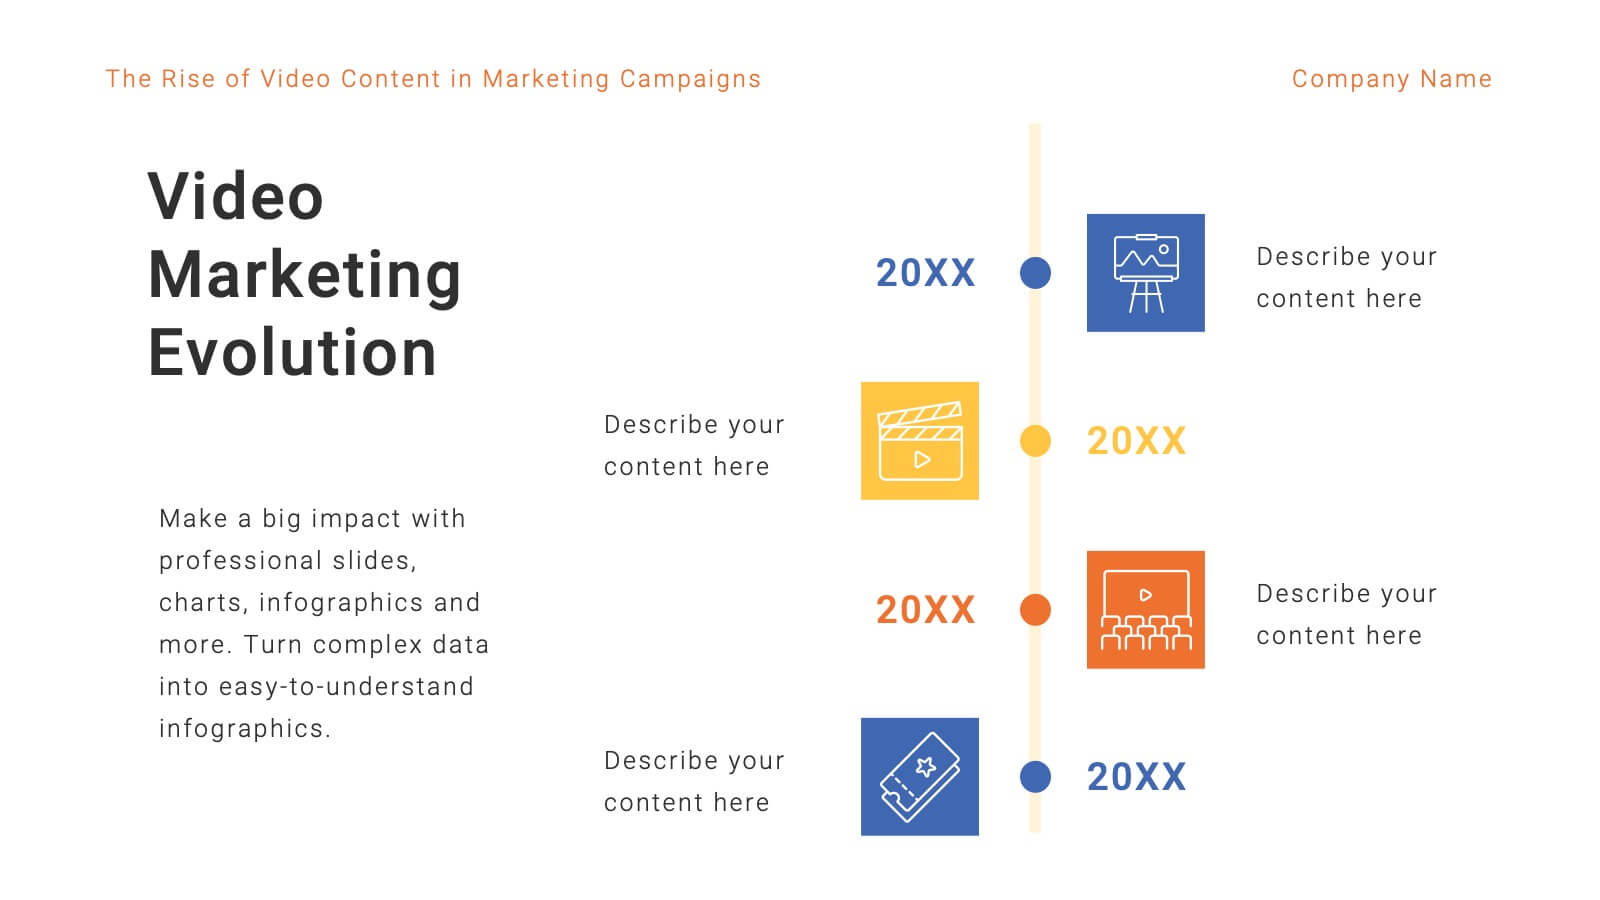
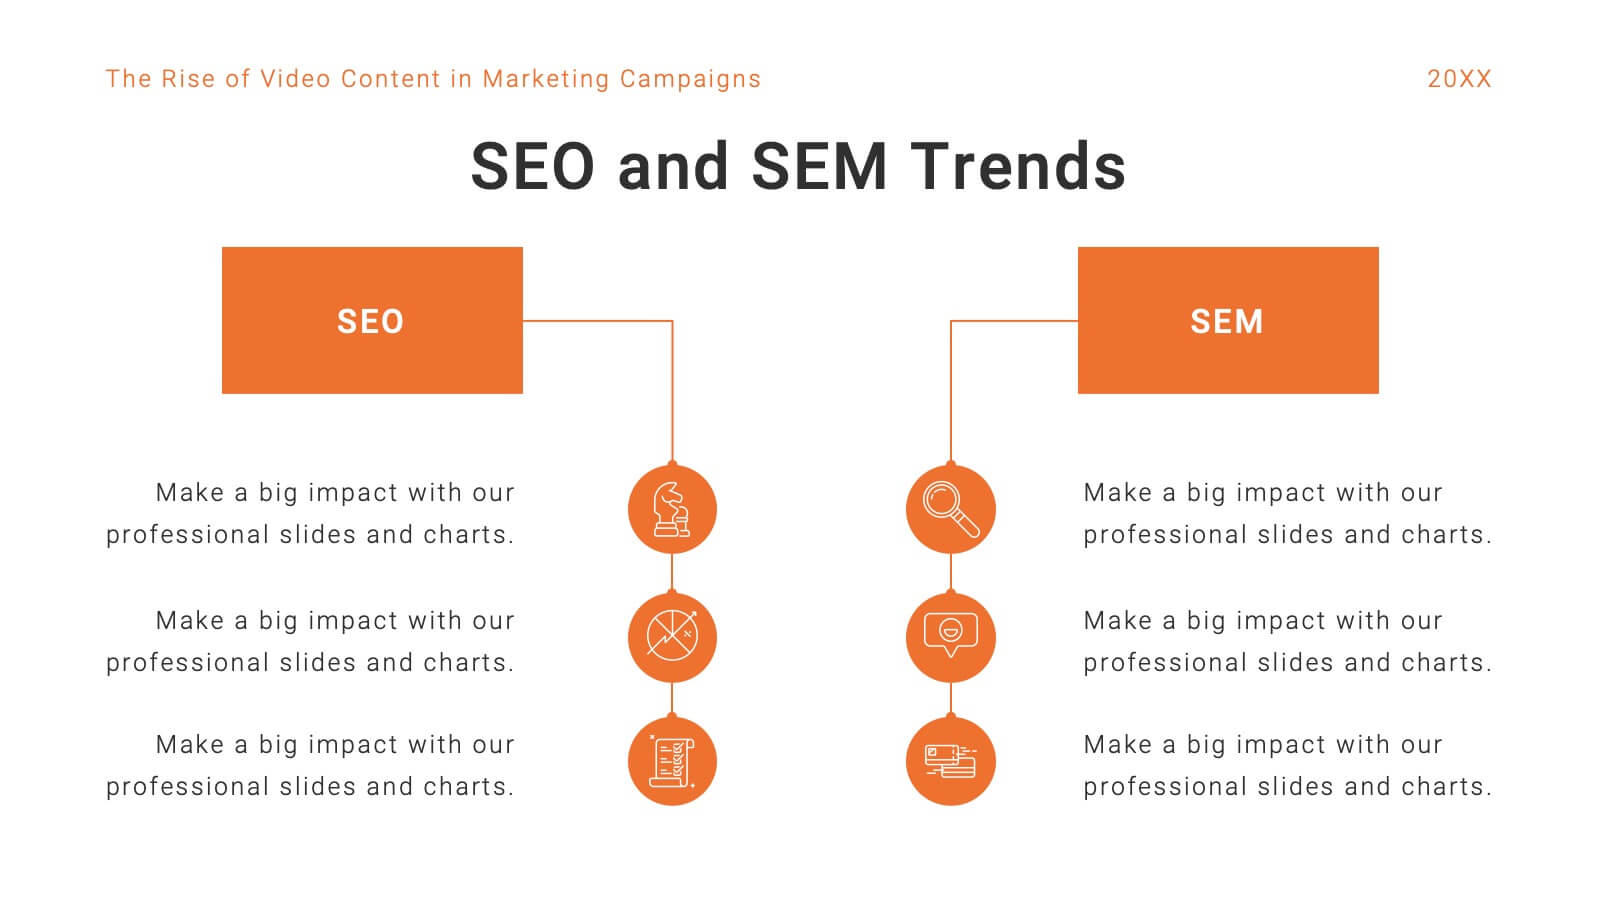
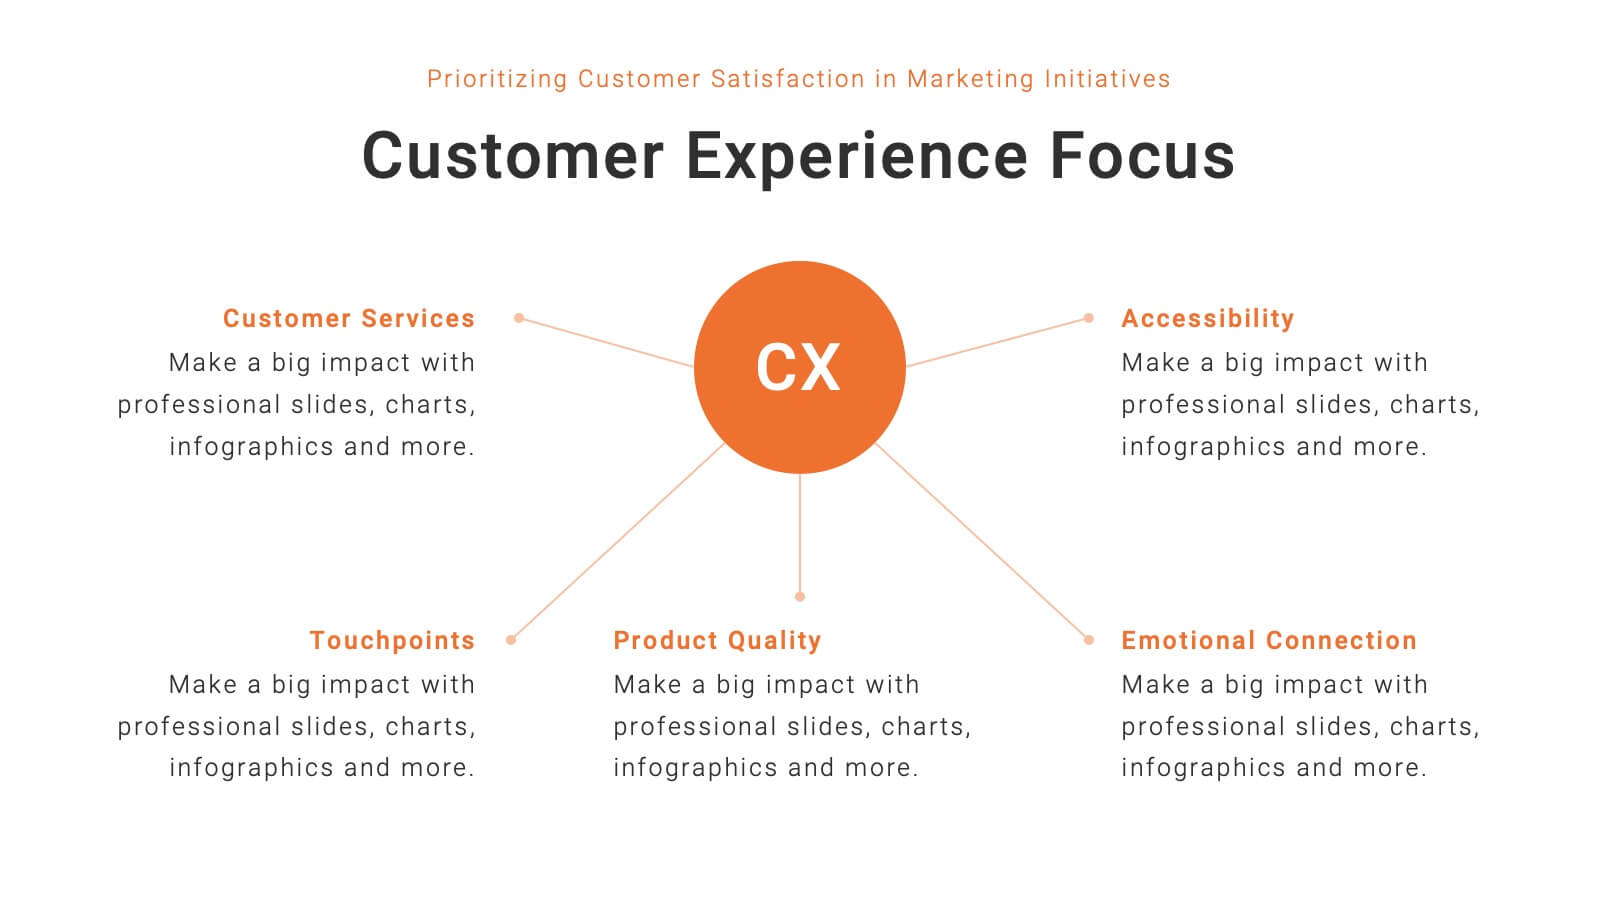
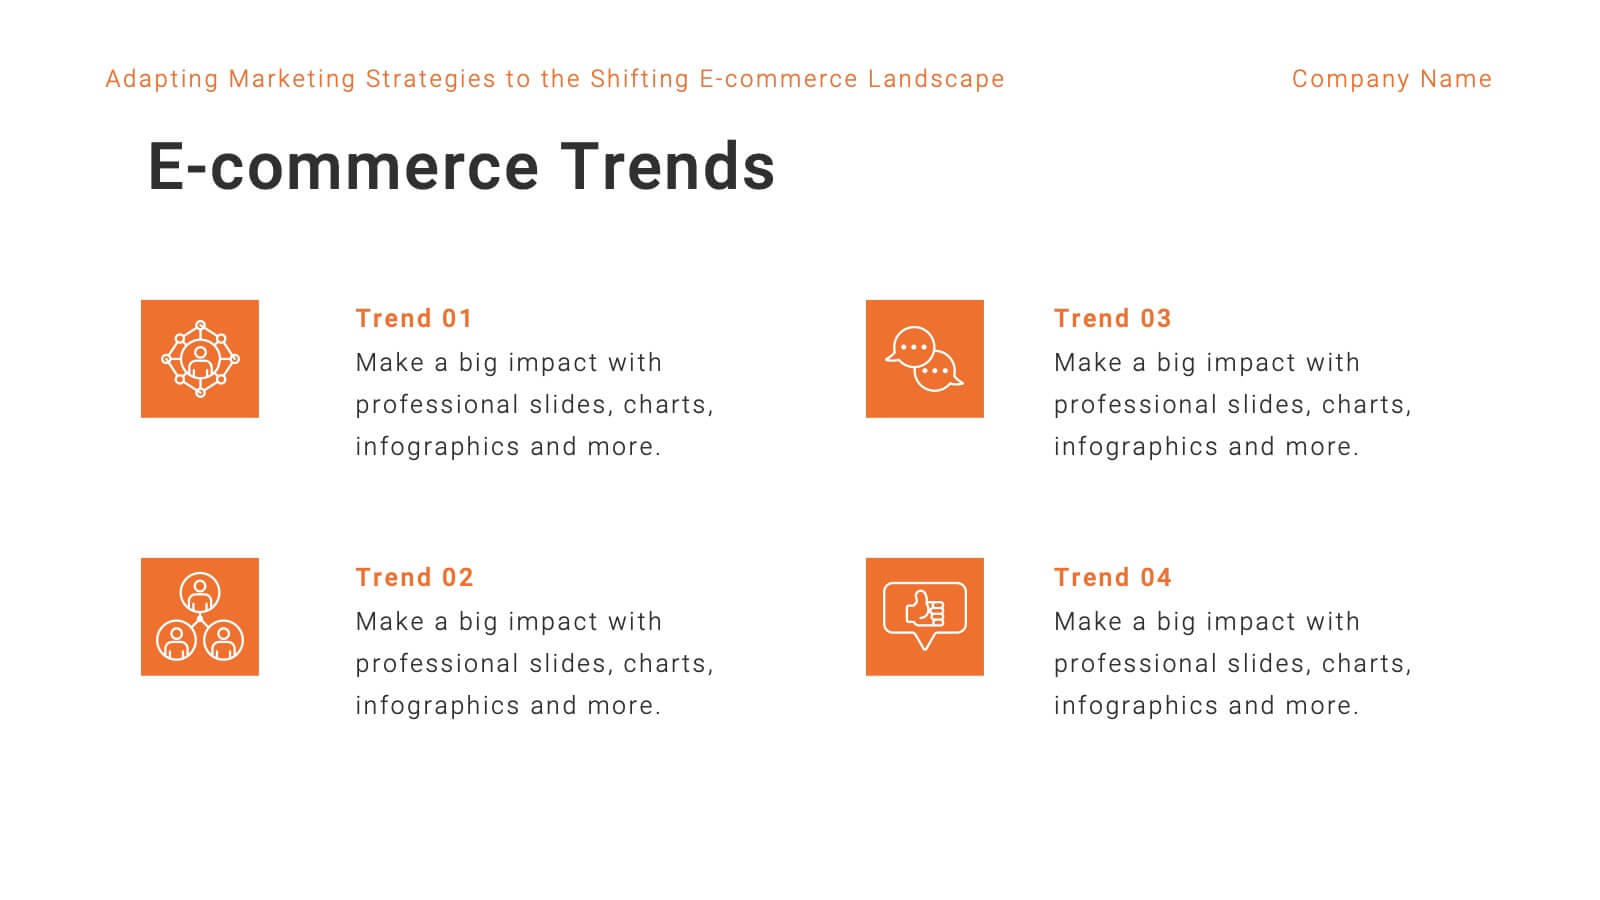
Aurabliss Content Marketing Pitch Deck Presentation
This Content Marketing Pitch Deck Template provides a professional and engaging layout to showcase your marketing strategies, trends, and insights. Featuring key sections such as industry overview, influencer marketing, SEO/SEM trends, and customer experience focus, it helps communicate your marketing plans effectively. The template includes charts, graphs, and visual elements to support data-driven storytelling. Fully customizable in PowerPoint, Keynote, and Google Slides, making it an ideal choice for marketing professionals, agencies, and business presentations.


5 diapositivas
Budget Planning Finance Presentation
Visualize your financial strategy with this Budget Planning Finance Presentation. Featuring four plant pot icons representing different funding stages, this design helps highlight growth potential and budget allocation. Ideal for financial planning, investment proposals, and expense reports. Customize the text, colors, and icons easily in PowerPoint, Keynote, or Google Slides. Perfect for finance teams, consultants, and business managers.


21 diapositivas
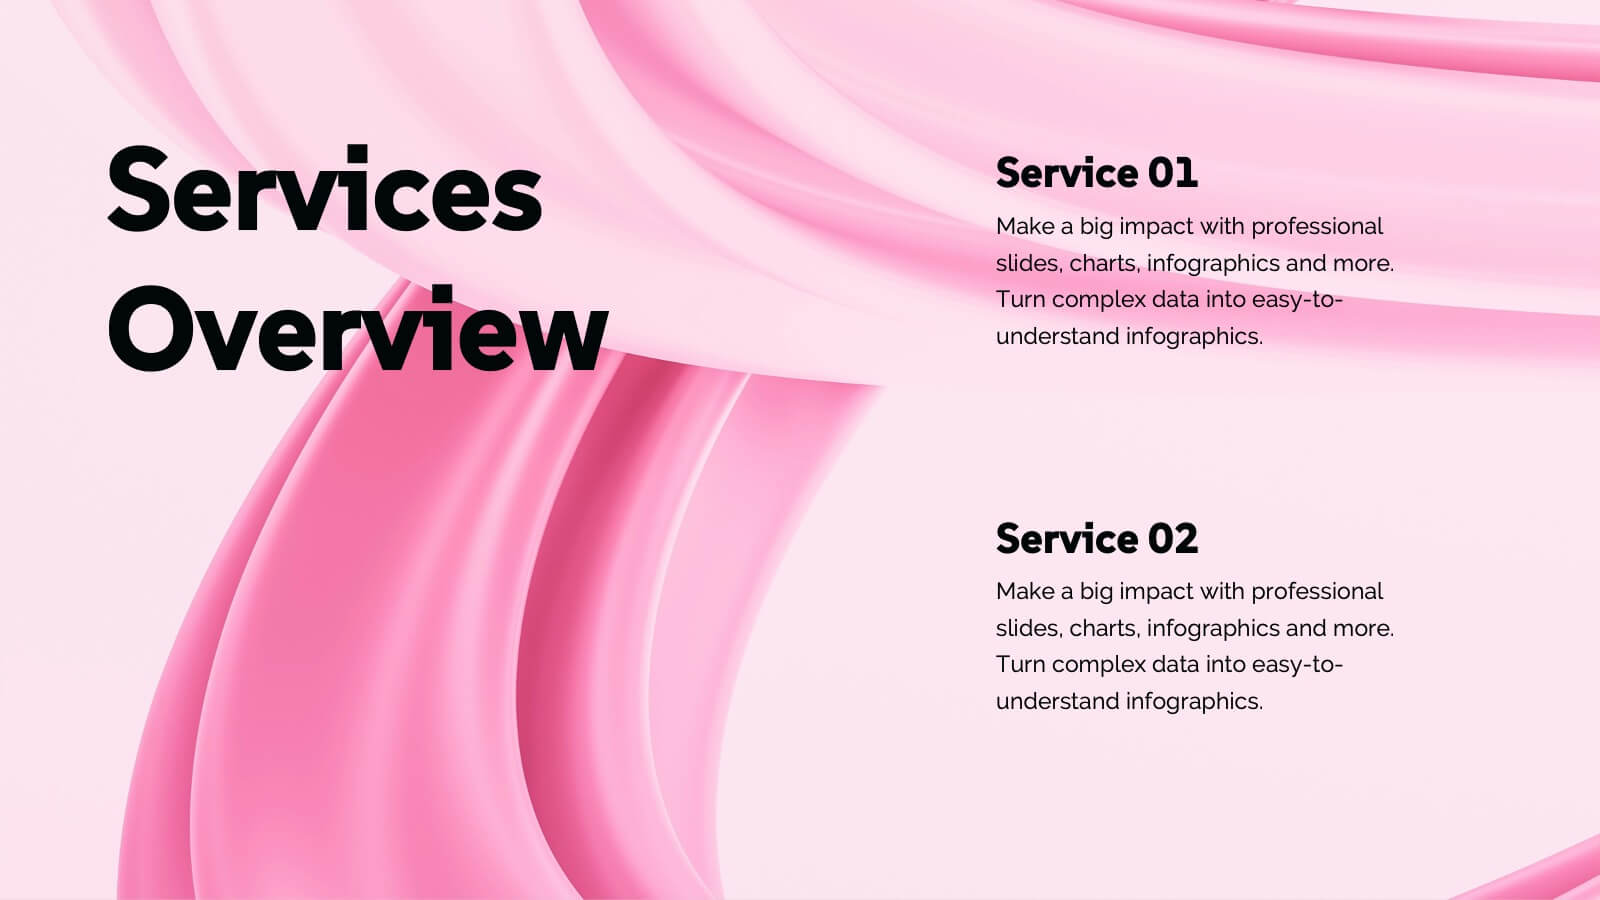
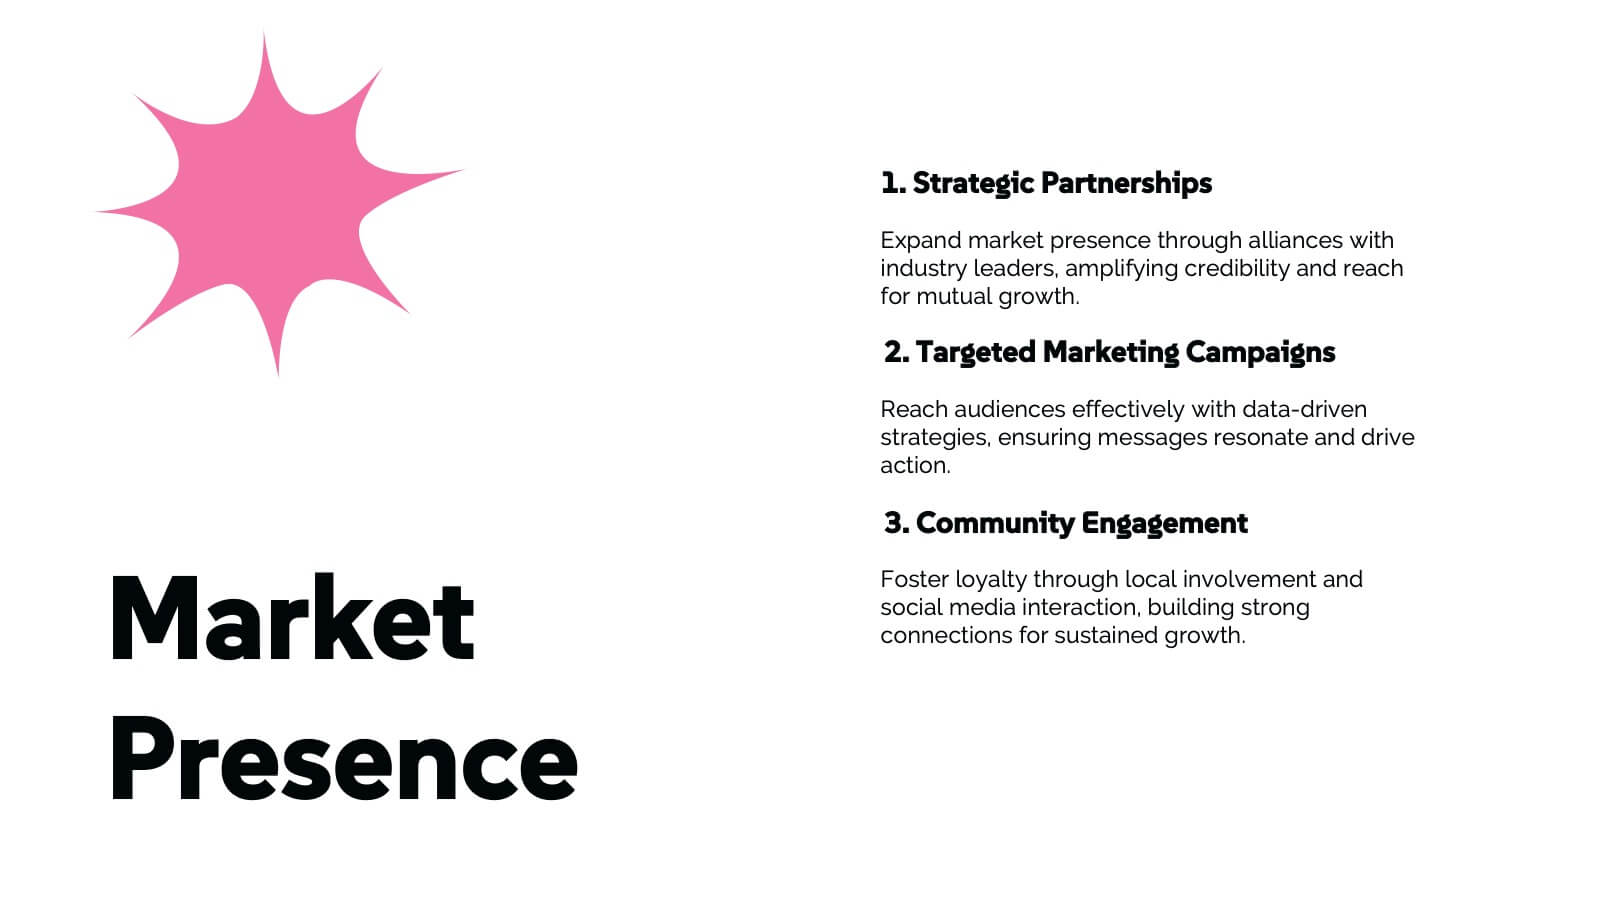
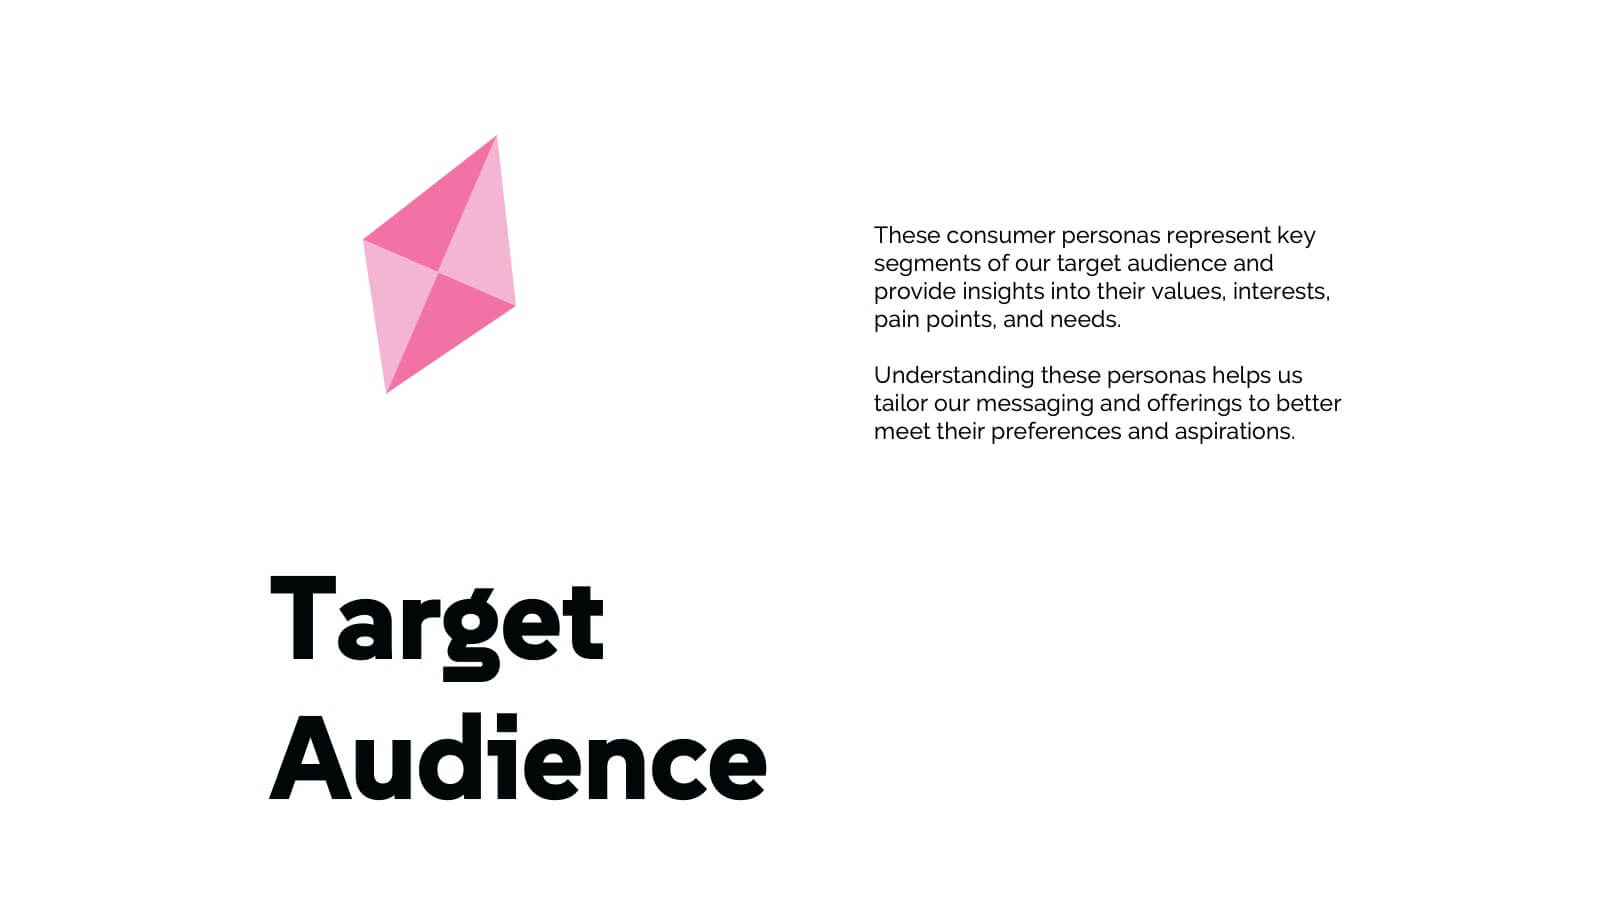
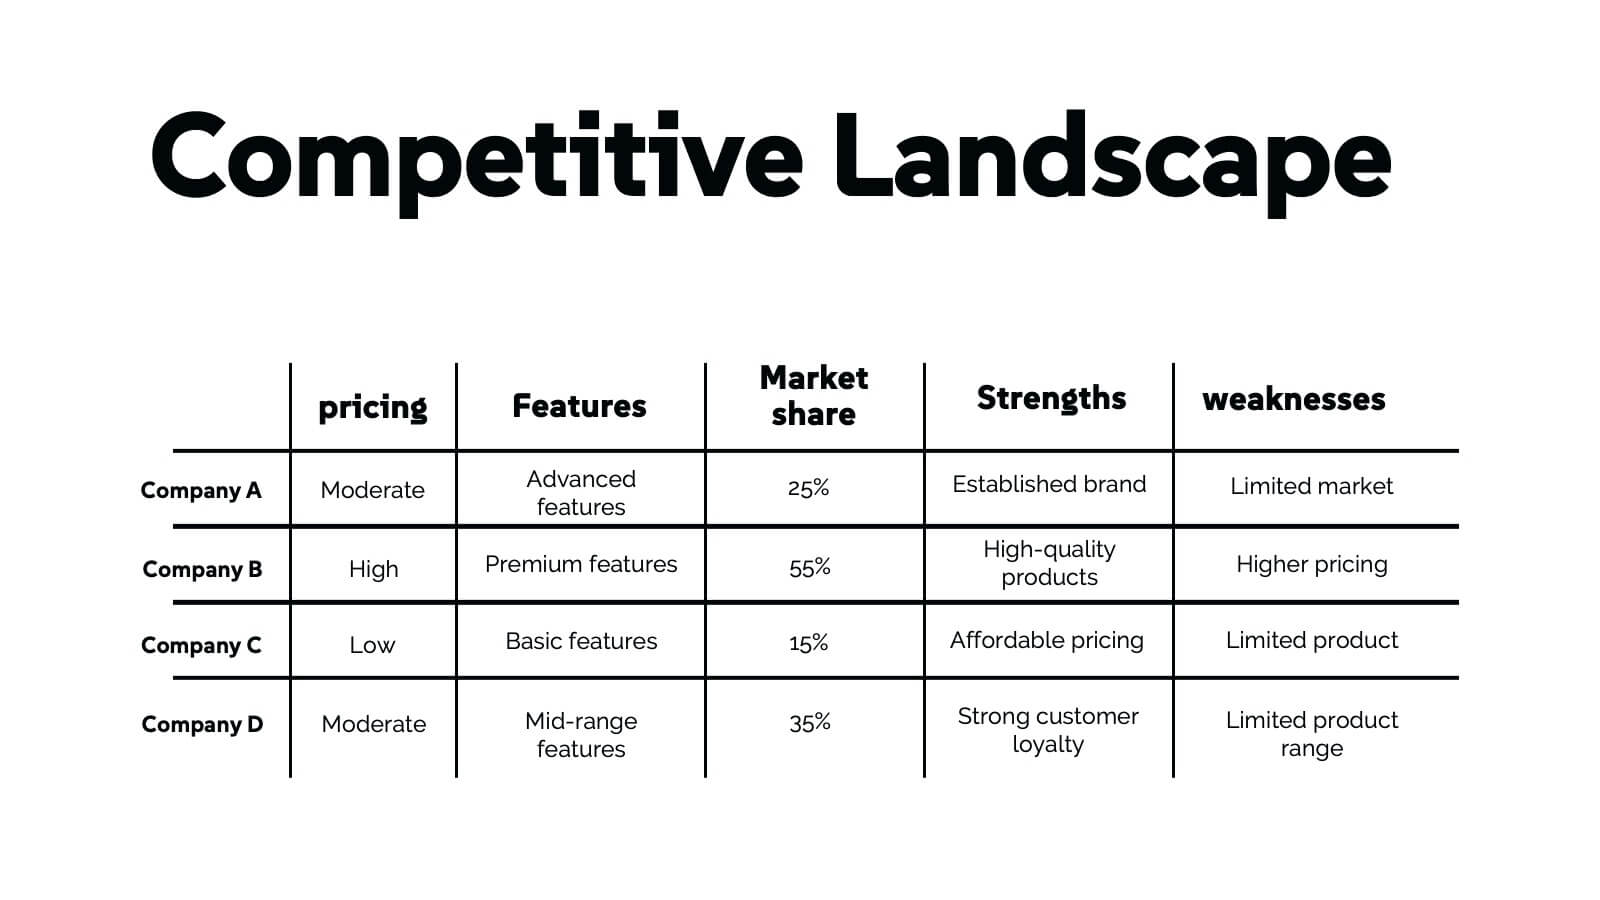
Chimera Marketing Campaign Presentation
Create a visually engaging digital marketing presentation with this modern template! Covering essential topics like company history, market presence, target audience, and competitive landscape, this template helps you showcase your marketing strategies effectively. Fully customizable, it works seamlessly with PowerPoint, Keynote, and Google Slides for professional presentations every time.


5 diapositivas
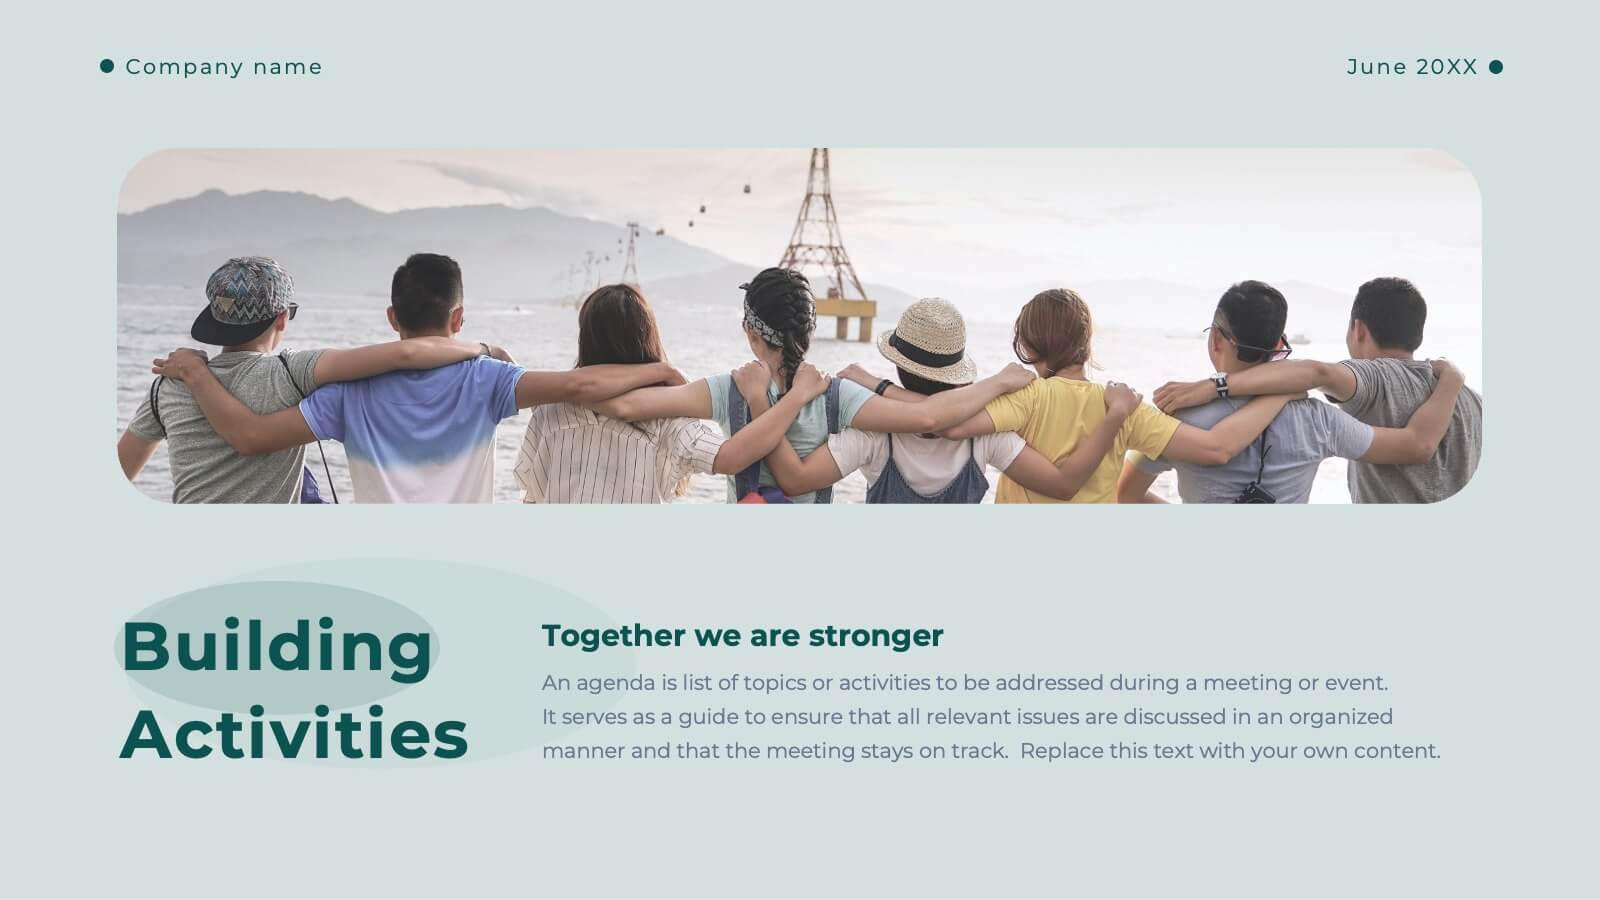
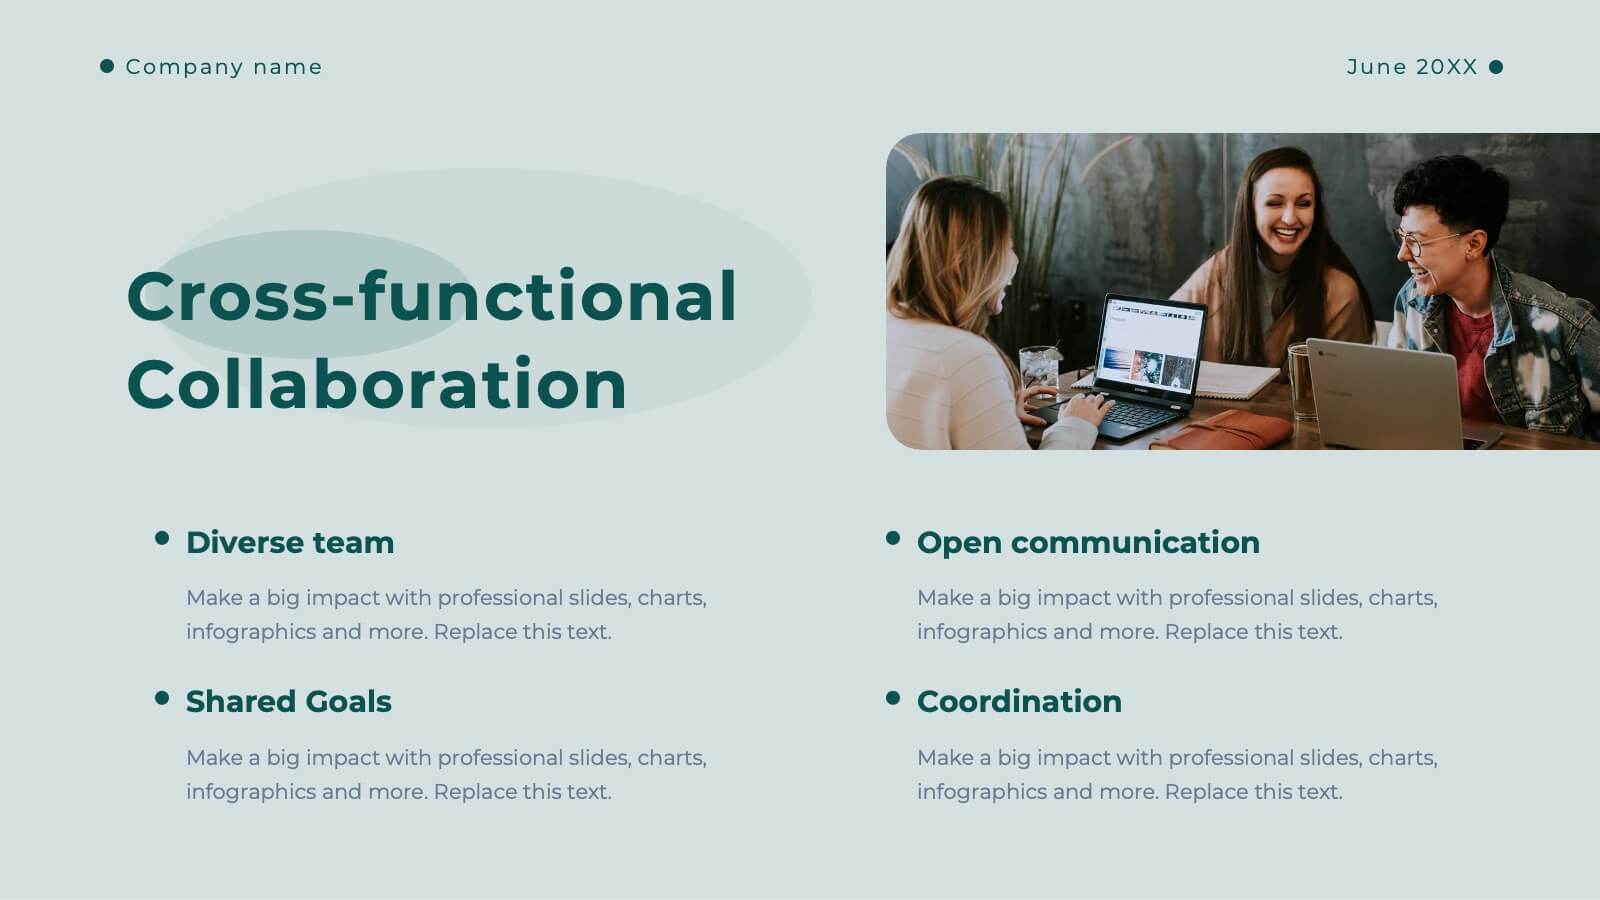
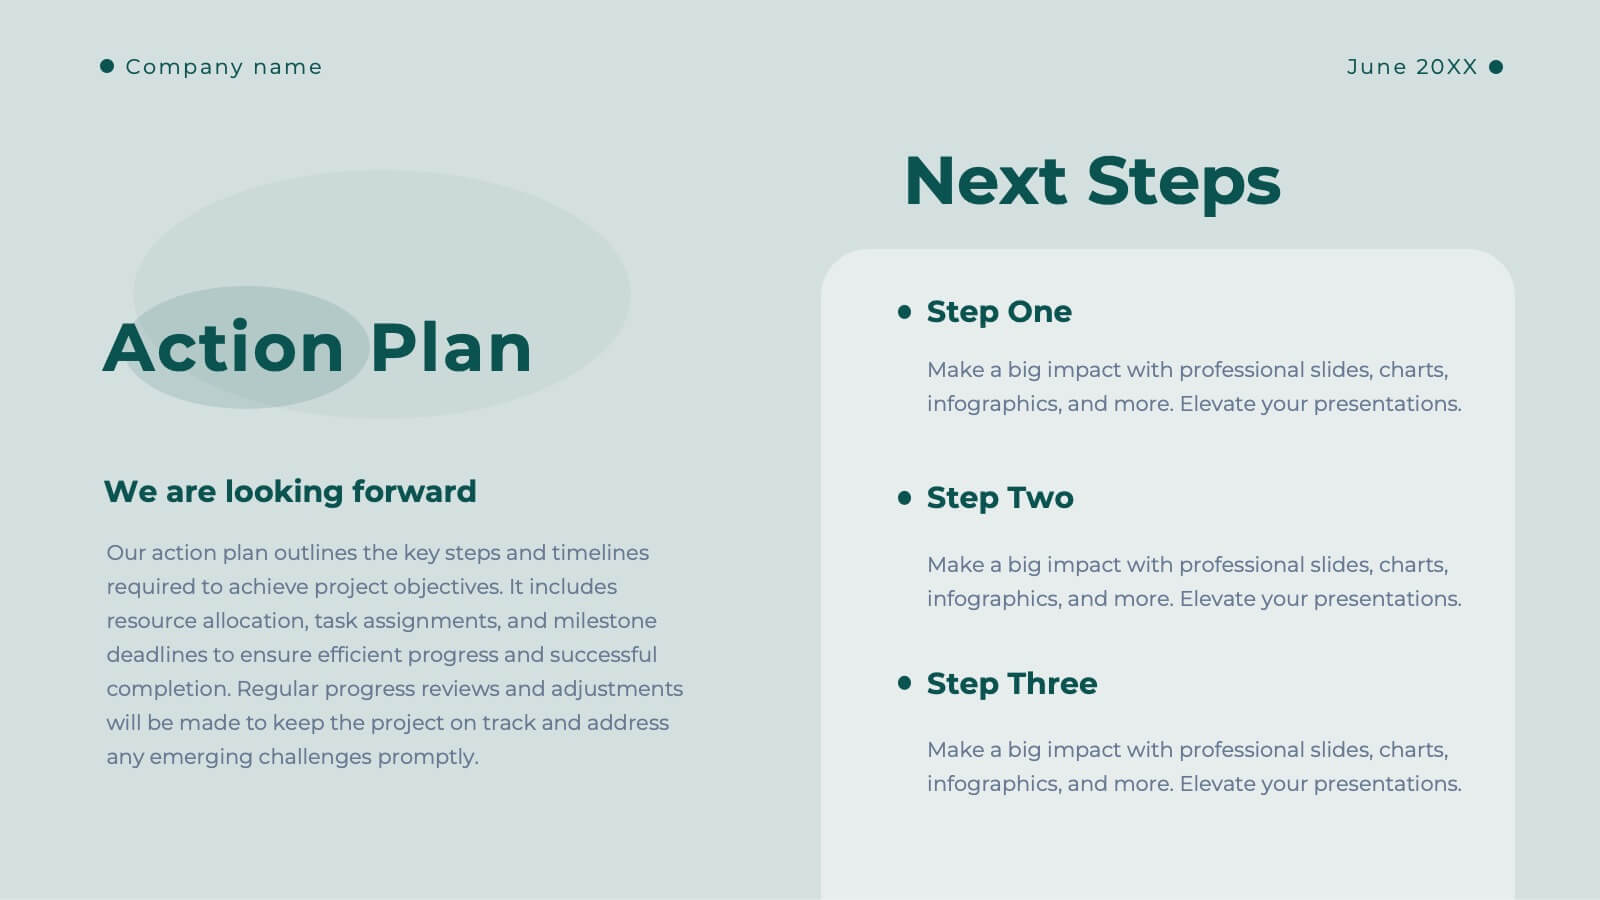
Building Strong Business Relationships
Create lasting partnerships with this structured business relationship infographic. Ideal for outlining trust-building strategies, collaboration frameworks, and stakeholder engagement plans. Fully editable in PowerPoint, Keynote, and Google Slides, making it simple to align the design with your company’s branding and professional goals.


20 diapositivas
Aurumix Agency Portfolio Presentation
Make a lasting impression with this bold and creative agency portfolio presentation. Designed to showcase your services, case studies, client success stories, and campaign strategies, this template helps highlight your agency’s expertise with confidence. Fully customizable and compatible with PowerPoint, Keynote, and Google Slides for a seamless, professional presentation experience.


20 diapositivas
Wonderis Design Proposal Presentation
Deliver an impeccable pitch with this minimalistic and professional design proposal template. Crafted for designers, agencies, and creative professionals, this presentation allows you to seamlessly showcase your expertise, methodology, and deliverables. Walk your audience through a polished narrative that includes a project summary, proposed solutions, objectives, methodology, and timeline. Highlight your expertise with dedicated slides for team introductions, budget breakdowns, and pricing structures. Ensure confidence with risk mitigation strategies, references, and clear next steps to solidify trust in your approach. This template is fully editable and works flawlessly with PowerPoint, Google Slides, and Keynote, providing the flexibility you need to tailor your proposal to specific client needs. Perfect for client pitches, project proposals, and business presentations that need a sophisticated and concise design.


6 diapositivas
Customer Journey Map Infographic
A customer journey map is a visual representation of the steps and touchpoints that a customer goes through when interacting with a product, service, or brand. This infographic template is designed to illustrate the customer journey and enhance understanding of the customer's experience with a product or service. It offers a comprehensive visualization of the various touchpoints and emotions experienced by customers throughout their interaction. This template illustrates the entire end-to-end experience from the customer's perspective. Each stage is visually represented with icons and brief descriptions to provide a clear understanding of the customer's progression.


6 diapositivas
Internal Communication Framework Presentation
Foster stronger collaboration with this visual internal communication framework template. Ideal for showcasing how information flows within departments, this layout helps clarify messaging channels, responsibilities, and feedback loops. Whether you're streamlining communication strategies or presenting team structures, it’s fully editable and works seamlessly with PowerPoint, Keynote, and Google Slides.

21 diapositivas
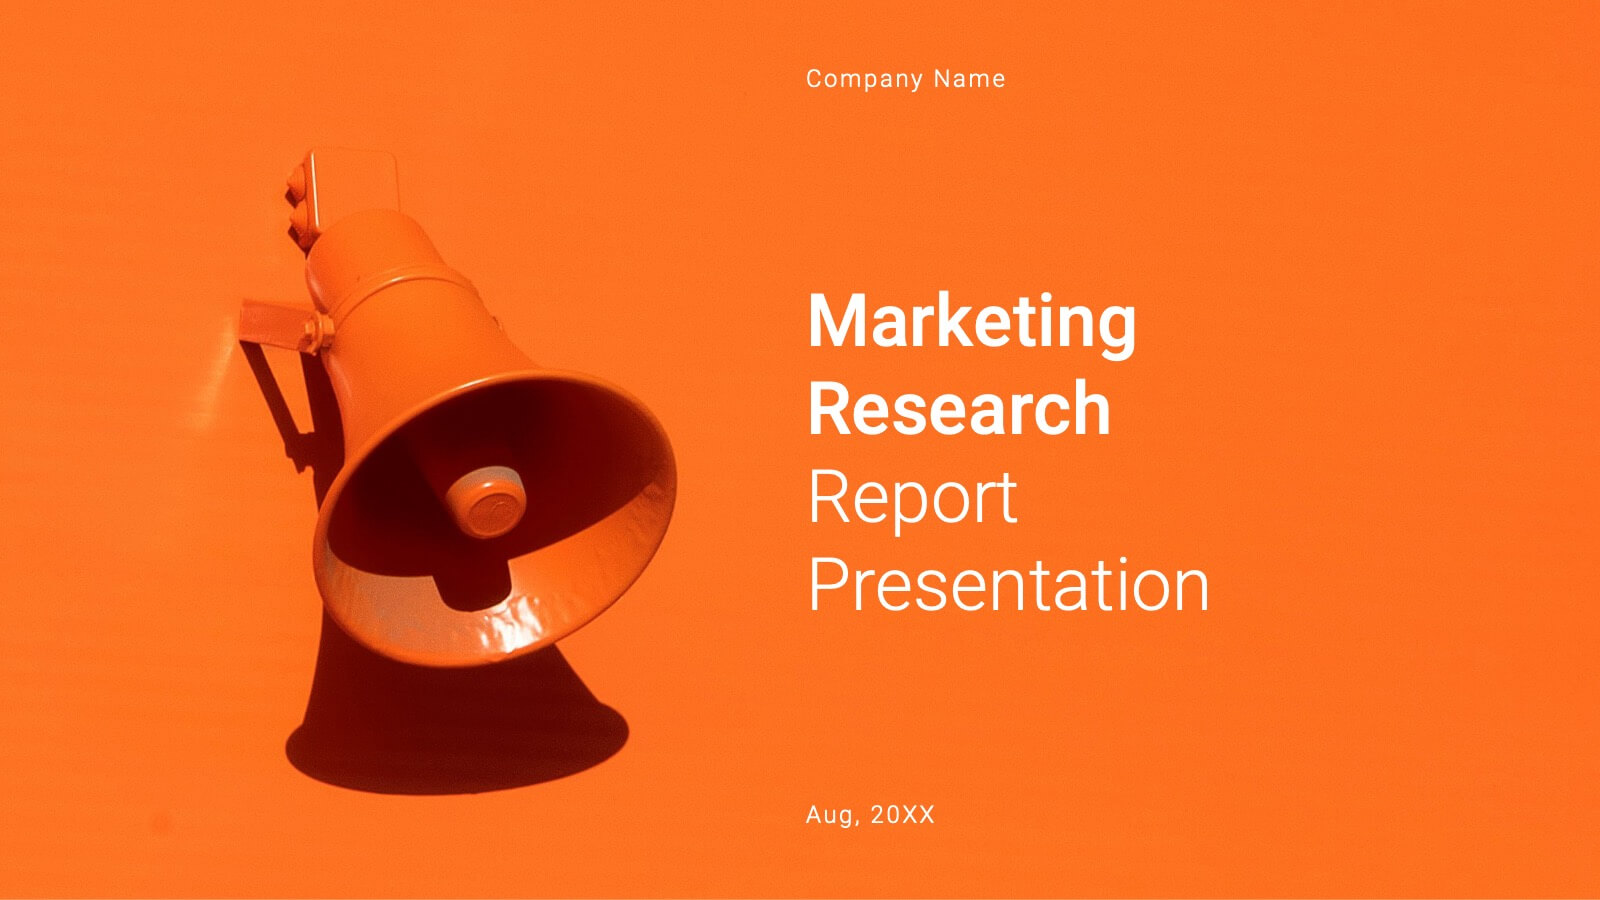
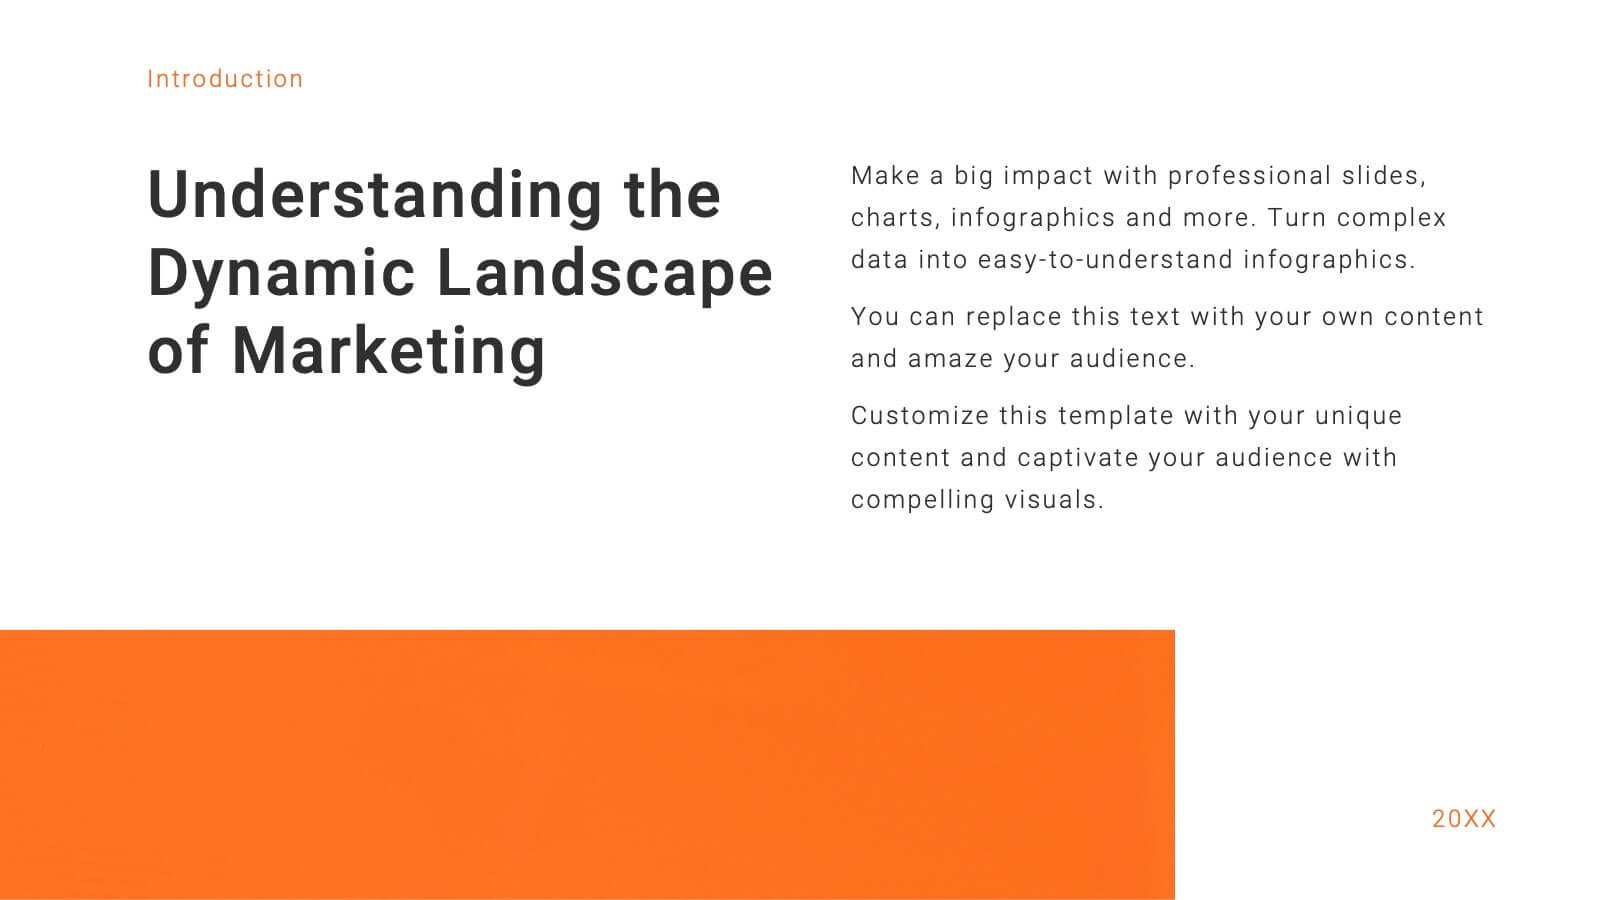
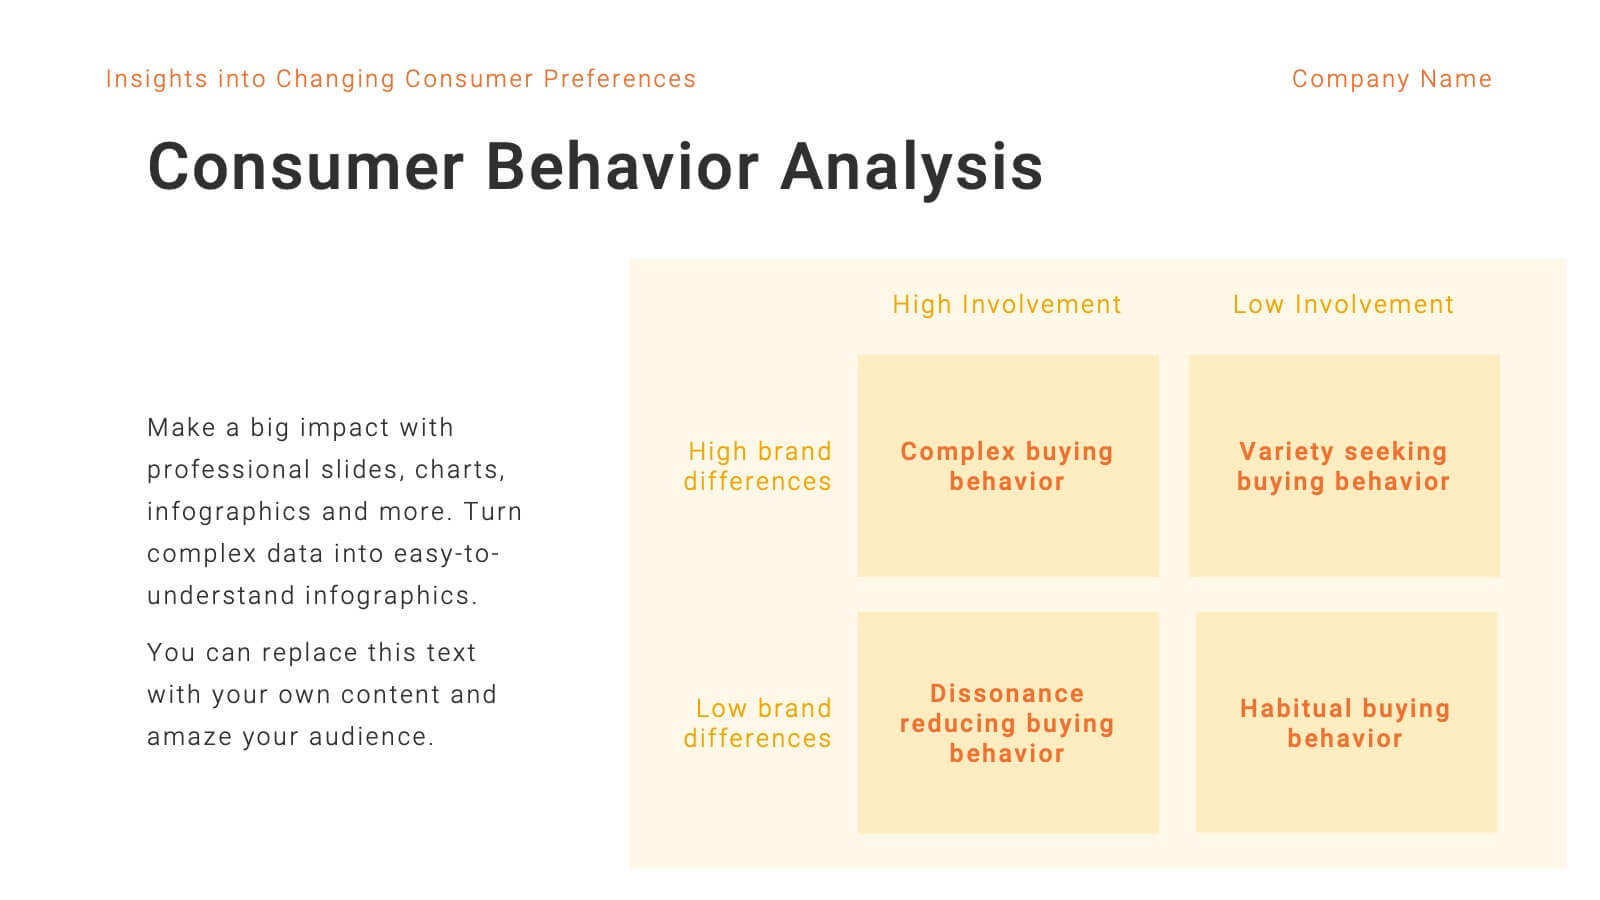
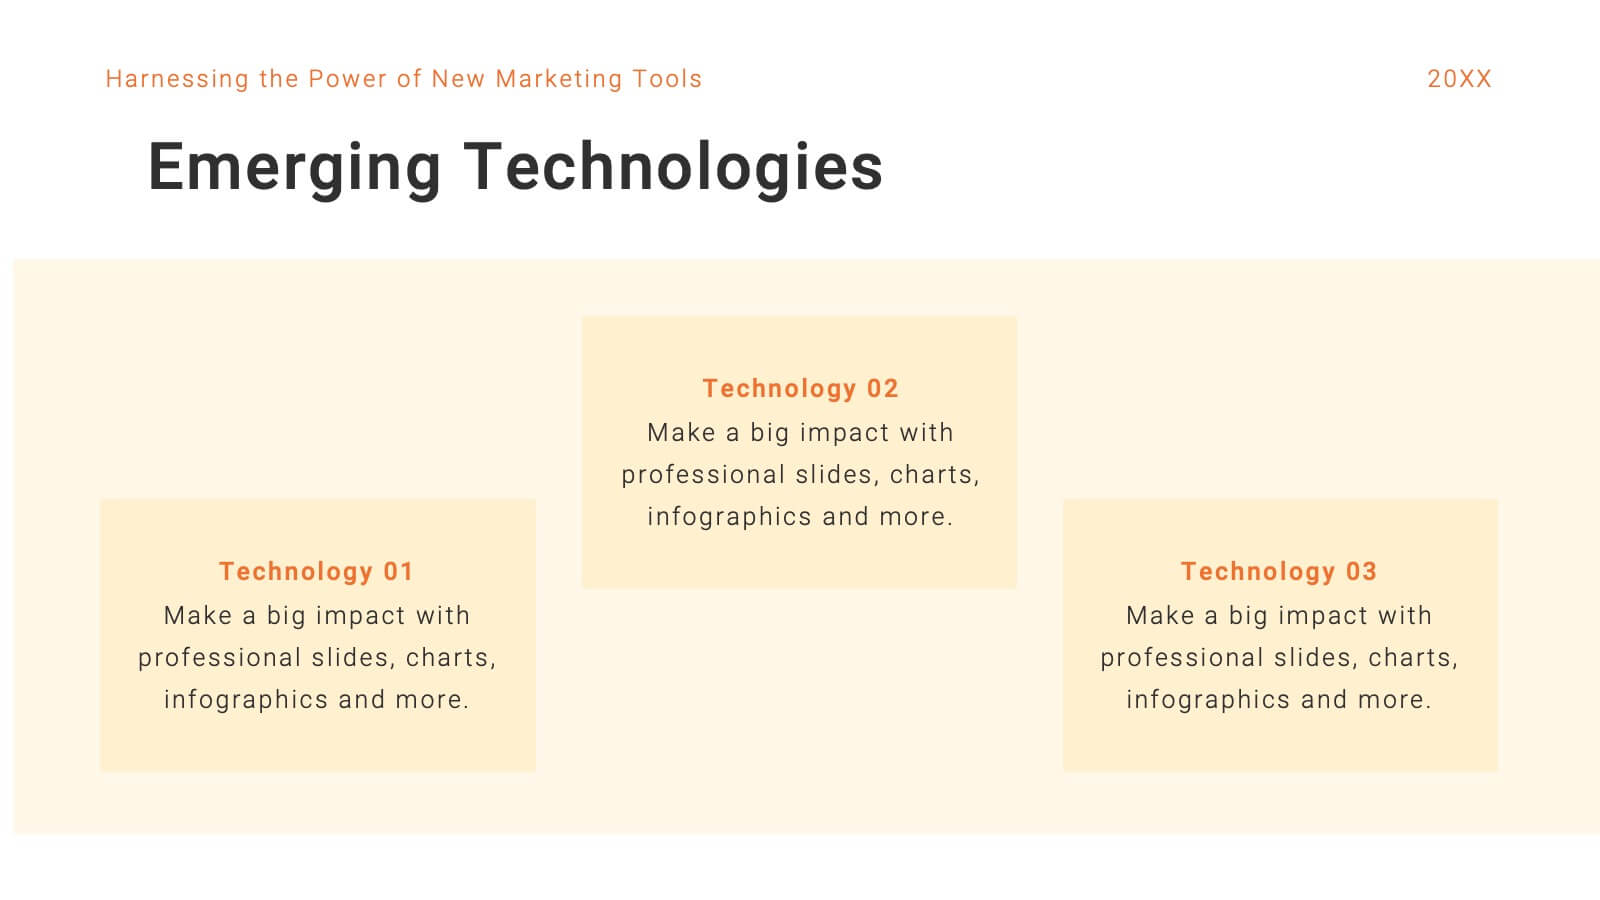
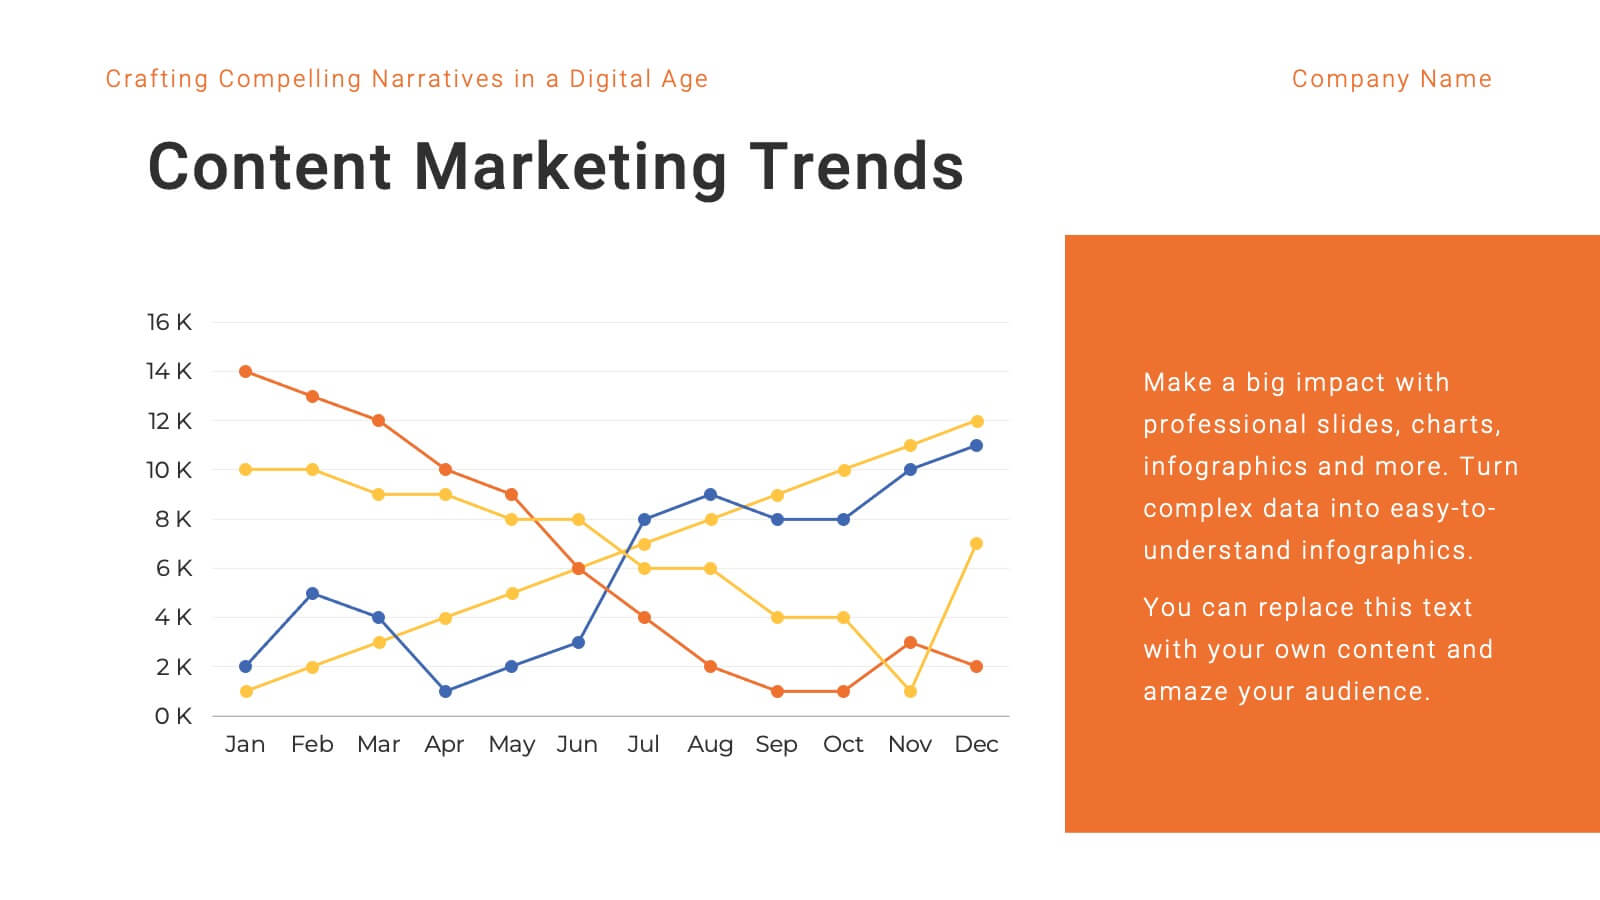
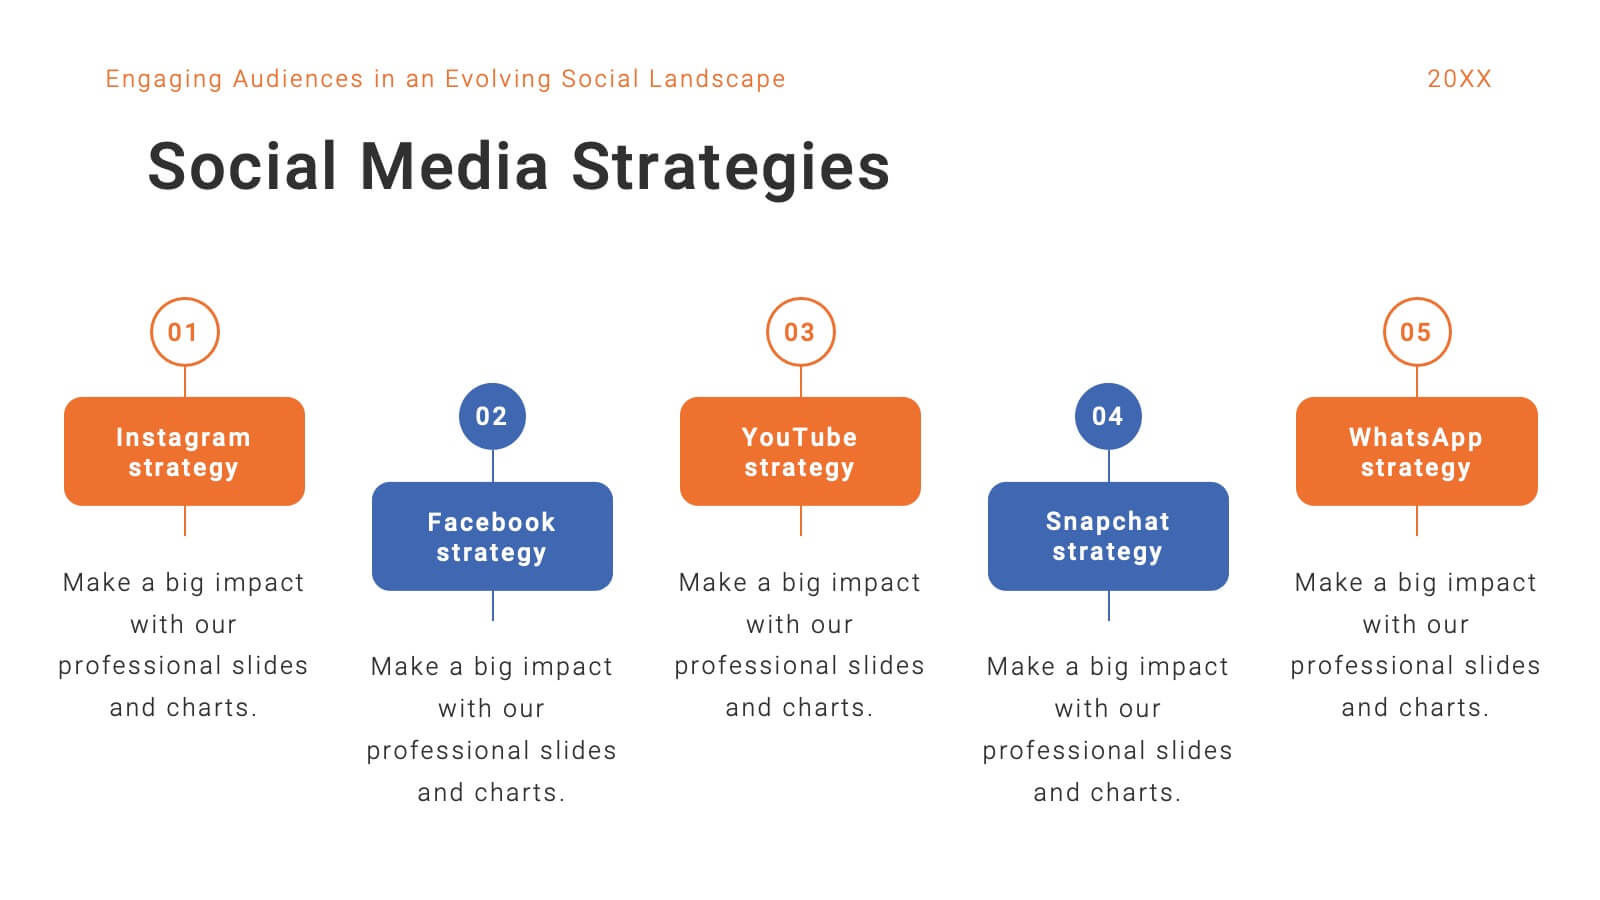
Mercury Marketing Research Report Presentation
Elevate your marketing strategy with this insightful and data-driven presentation template! Perfect for analyzing trends, consumer behavior, and emerging technologies, this template provides a thorough overview of today’s marketing landscape. From social media strategies to e-commerce trends, it covers all key areas. Fully customizable and compatible with PowerPoint, Keynote, and Google Slides for easy use.