


Características


¿Tienes alguna pregunta?
Recomendar


2 diapositivas
Jobs to Work From Home Illustrations
Empower your remote workforce with our jobs to work from home illustrations pack. These are designed to ignite the spark of remote work possibilities and bring a burst of energy to your presentations! Fully compatible with PowerPoint, Google Slides, and Keynote, they're easy to add to any presentation. Step into the world of remote work with these dynamic illustrations that capture the essence of modern work trends. Download the jobs to work from home illustrations today!


4 diapositivas
Culinary Business Branding Deck Presentation
Visualize your culinary identity with the Culinary Business Branding Deck Presentation. Designed with a segmented chef hat illustration, this slide helps you showcase four brand pillars—perfect for restaurants, food startups, and culinary consultants. Use it to highlight your cuisine focus, customer experience, service style, and ambiance. Fully editable in PowerPoint, Keynote, Google Slides, and Canva.

21 diapositivas
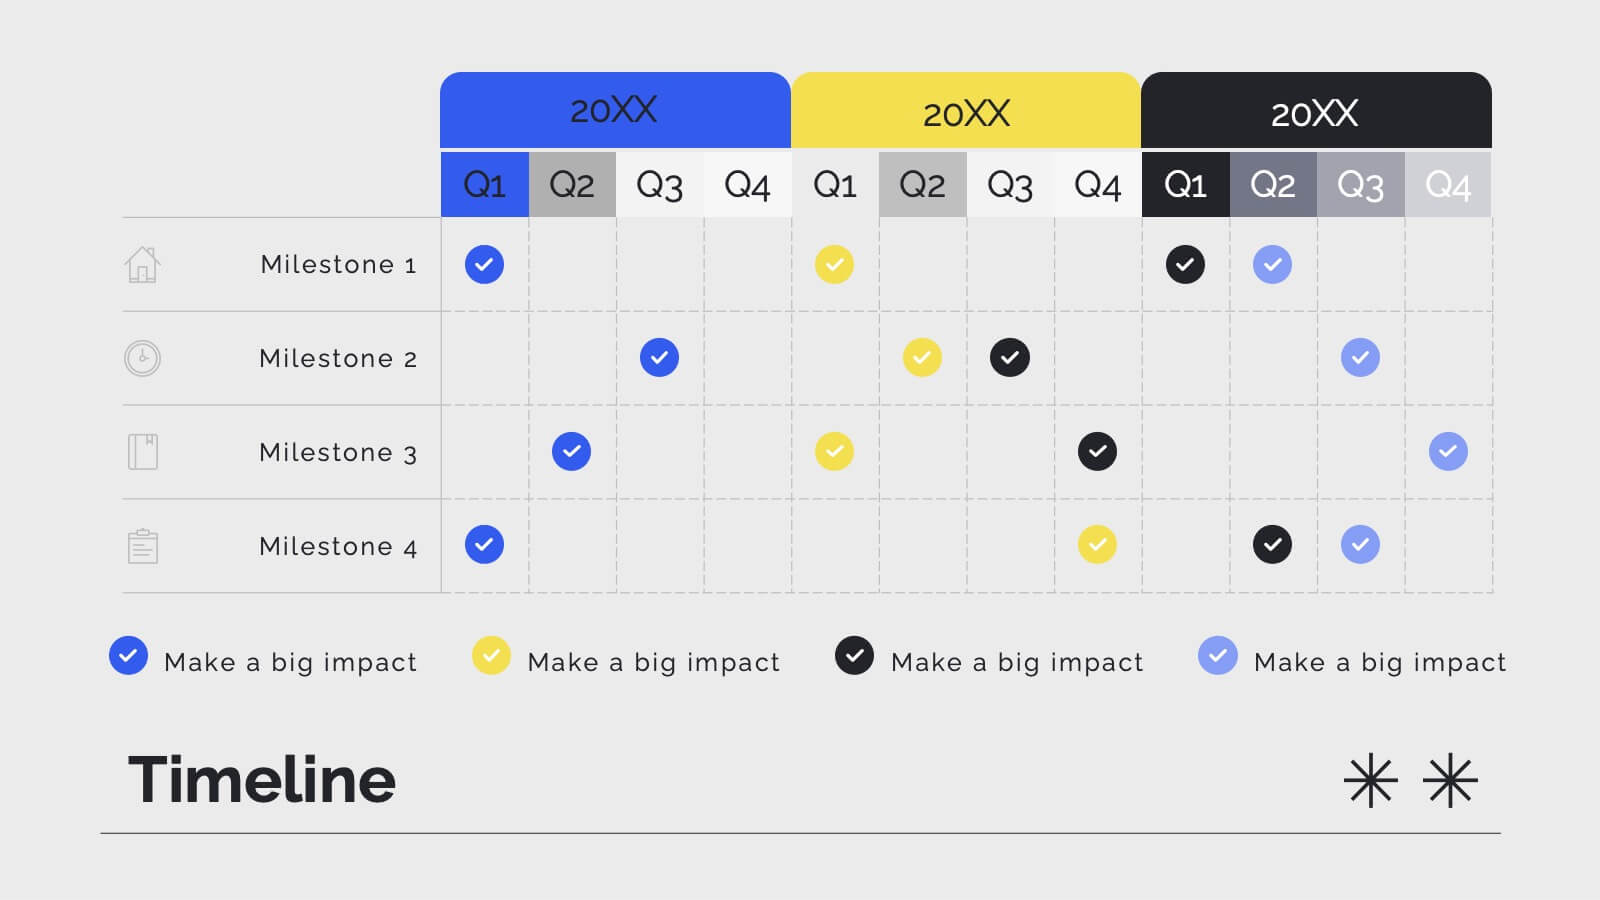
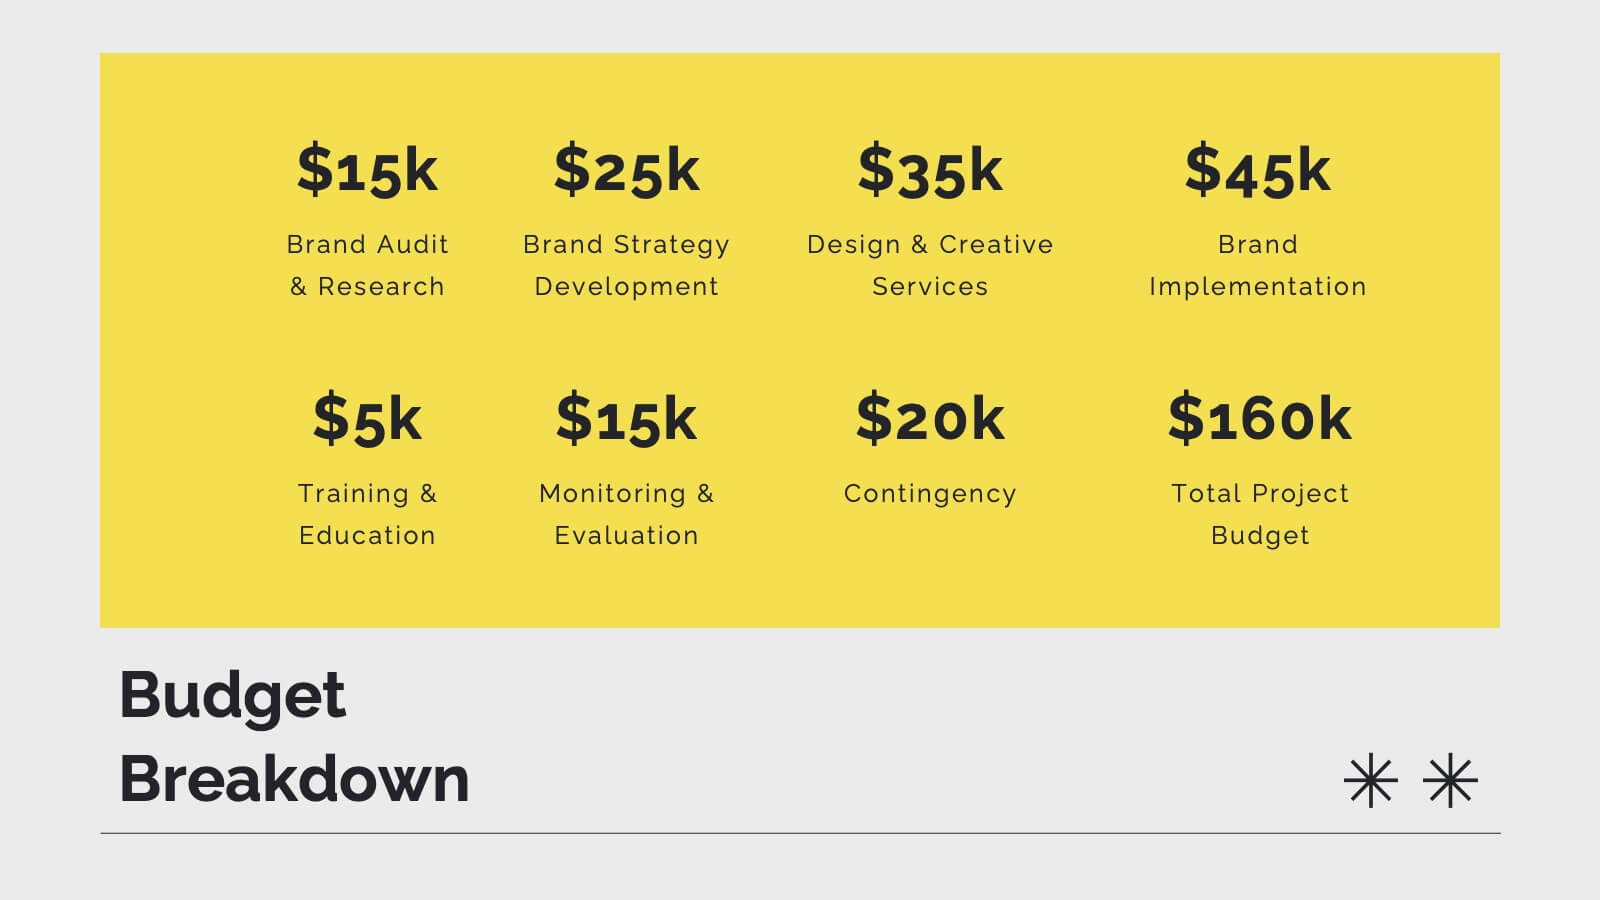
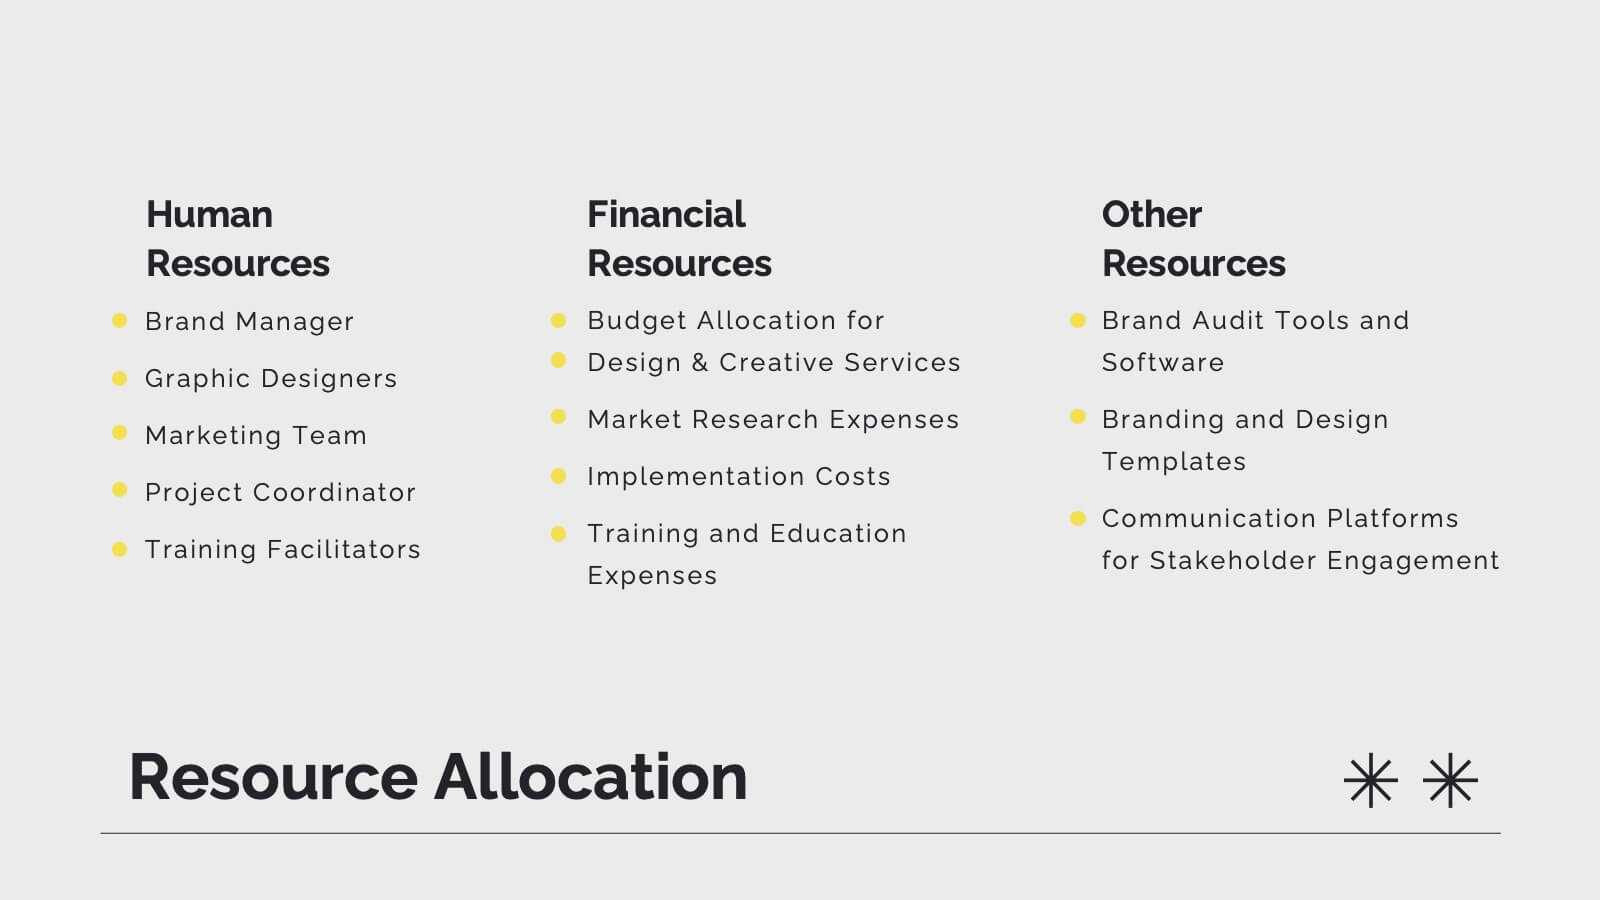
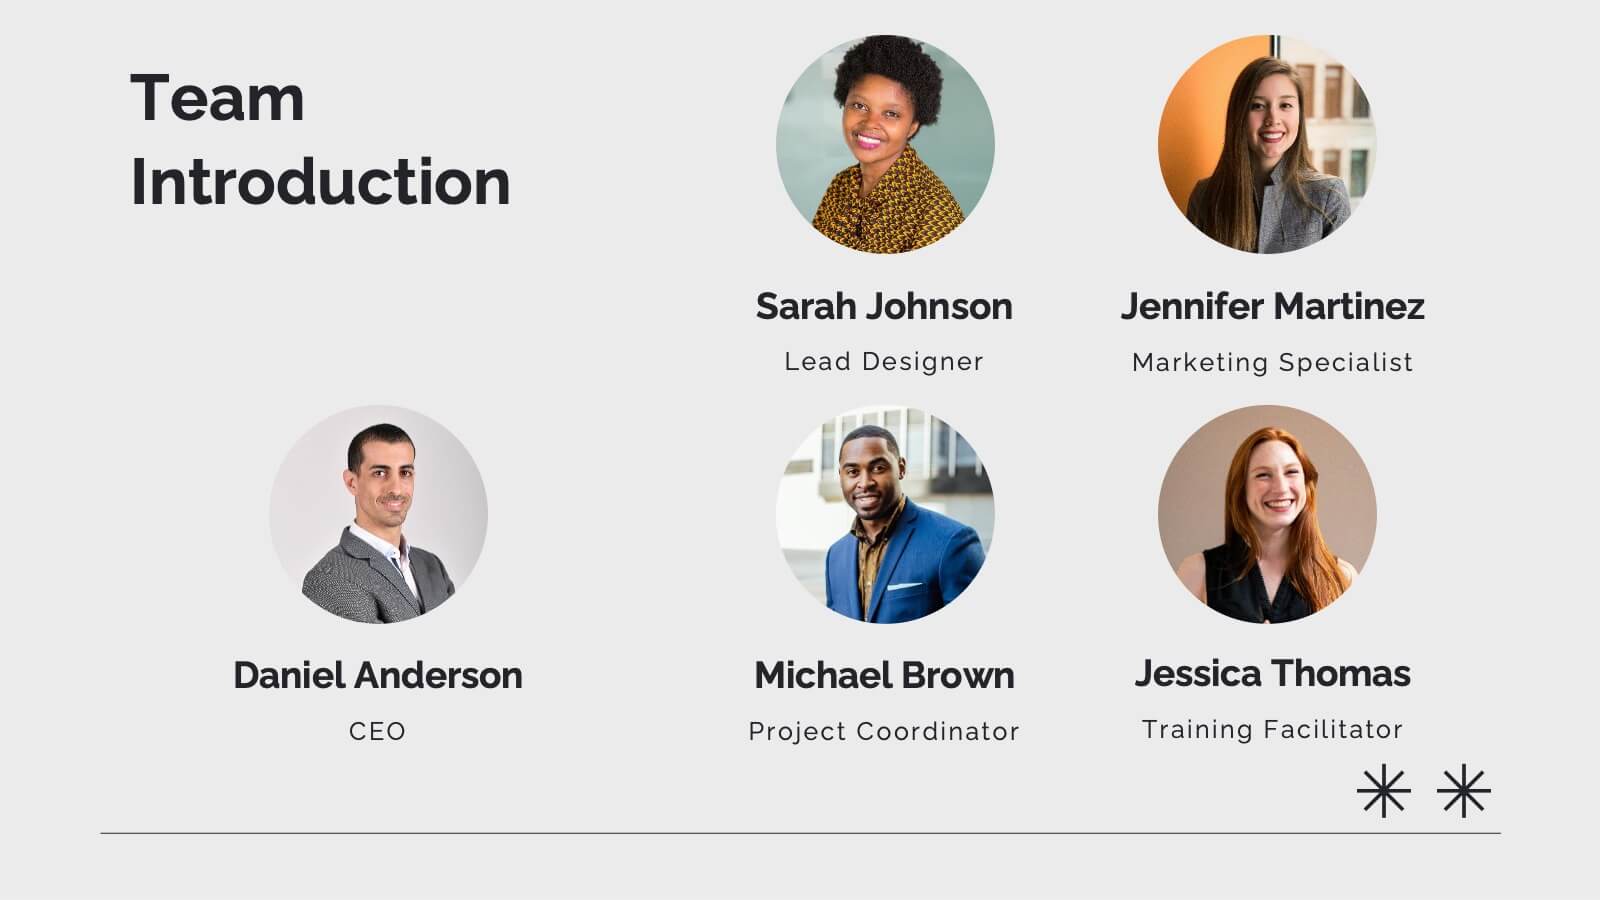
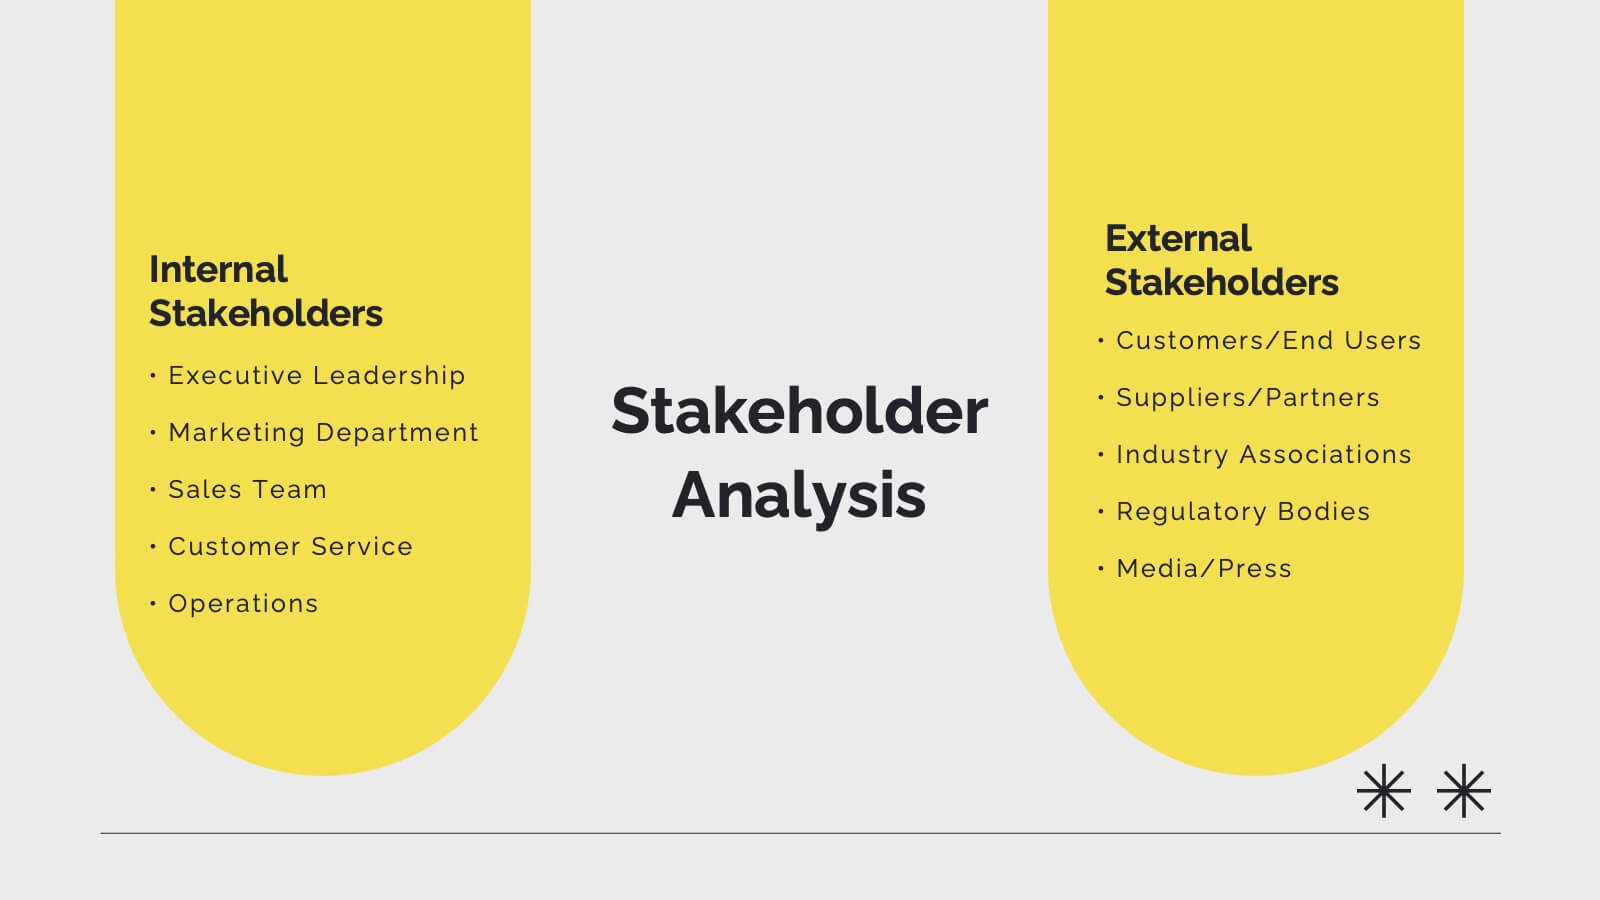
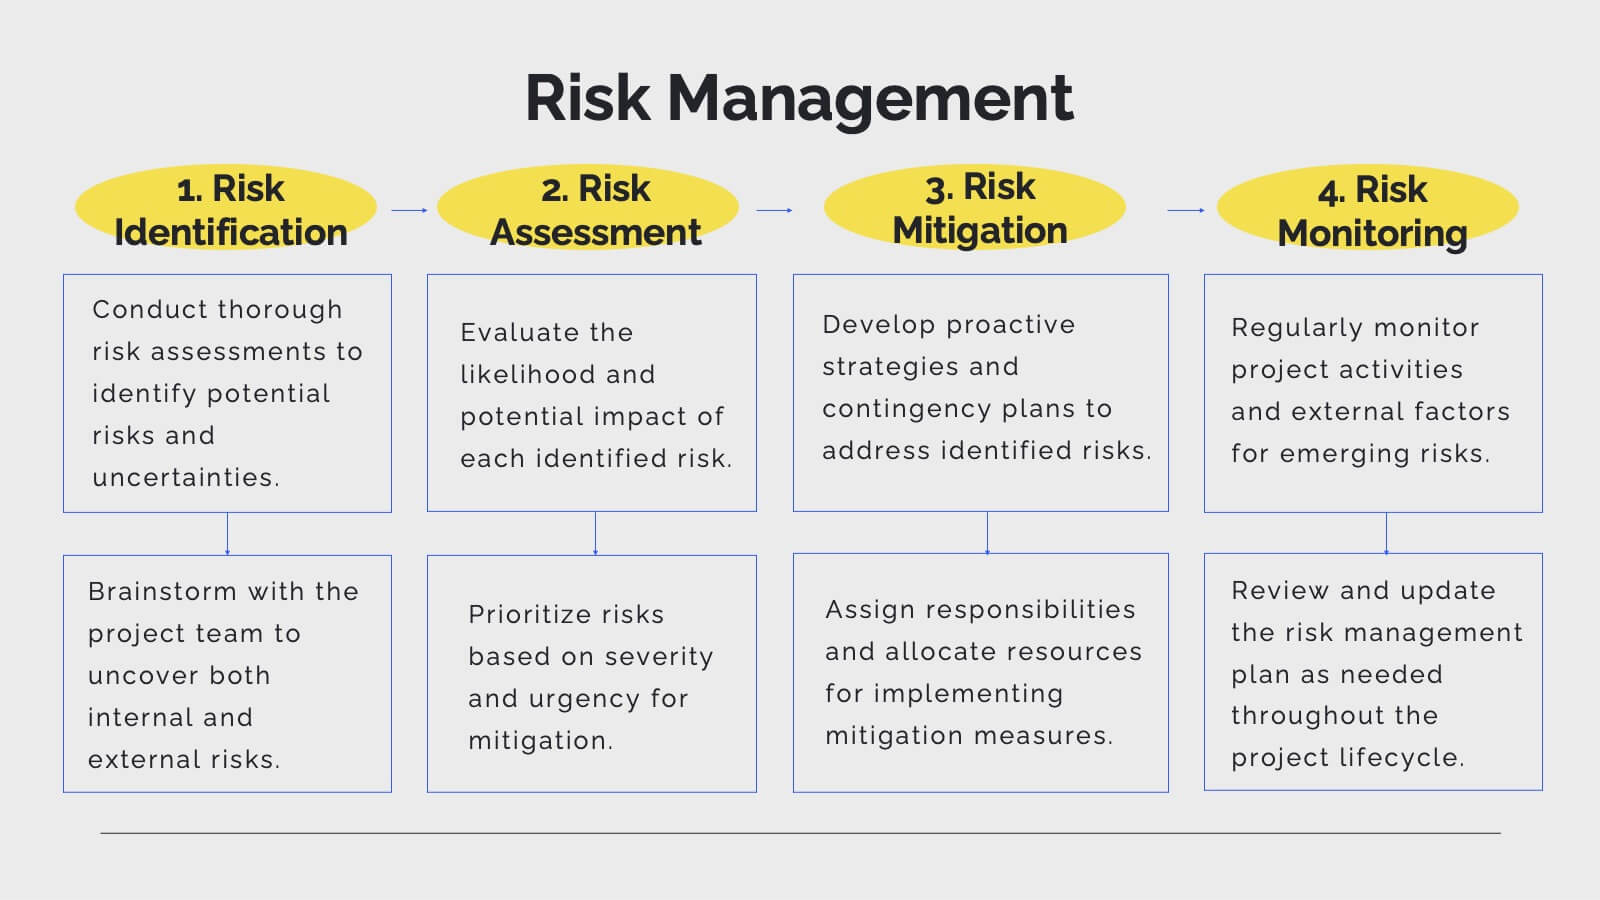
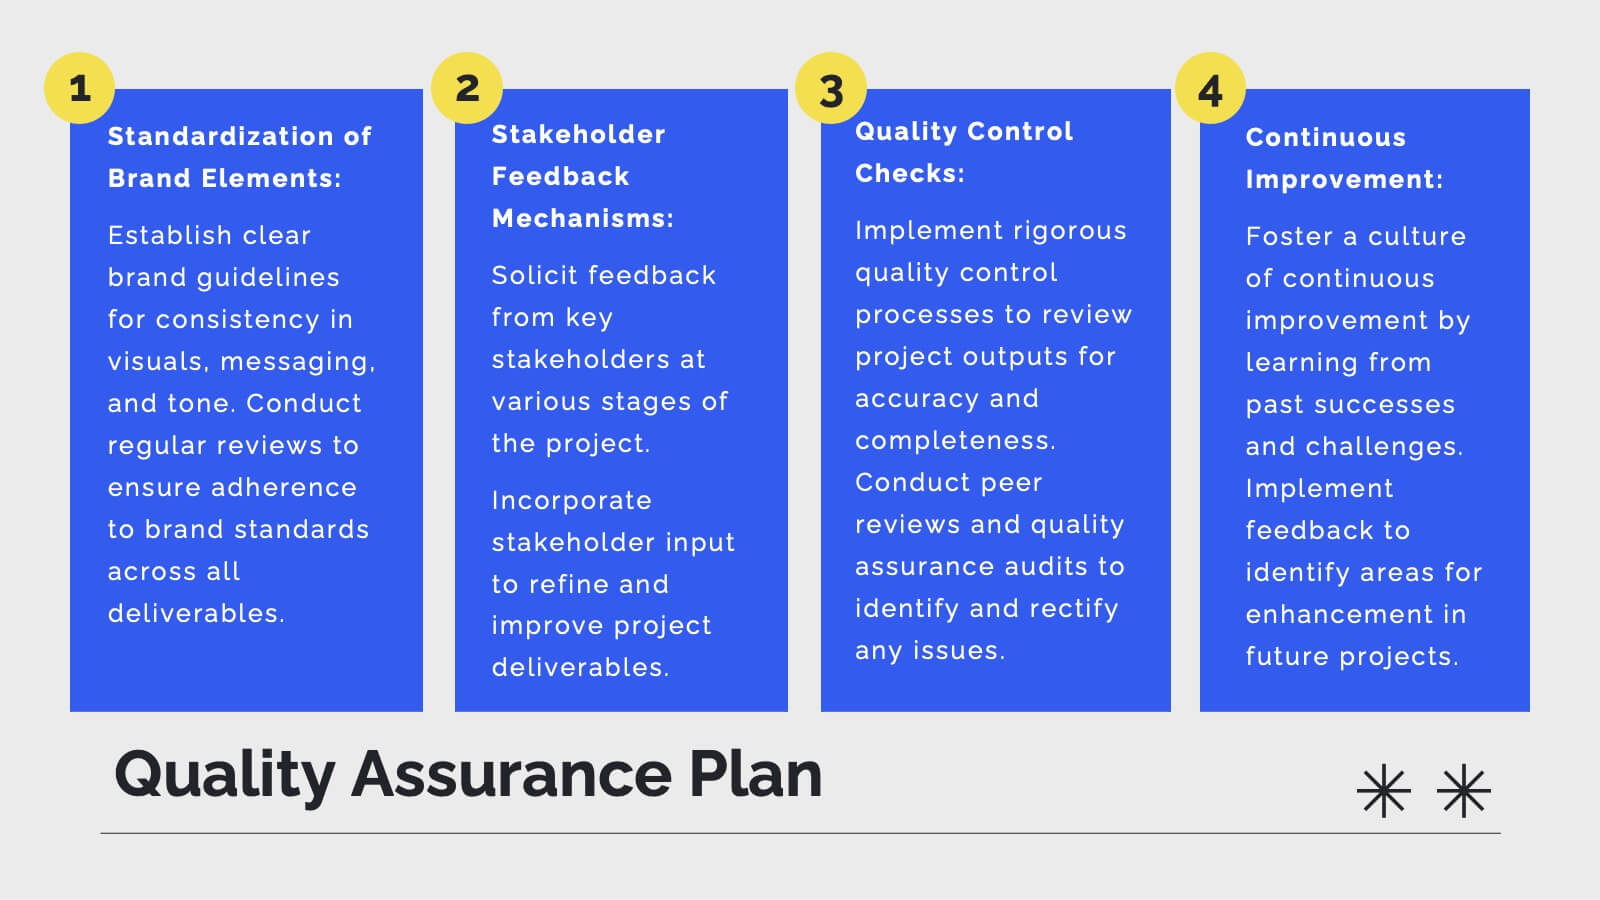
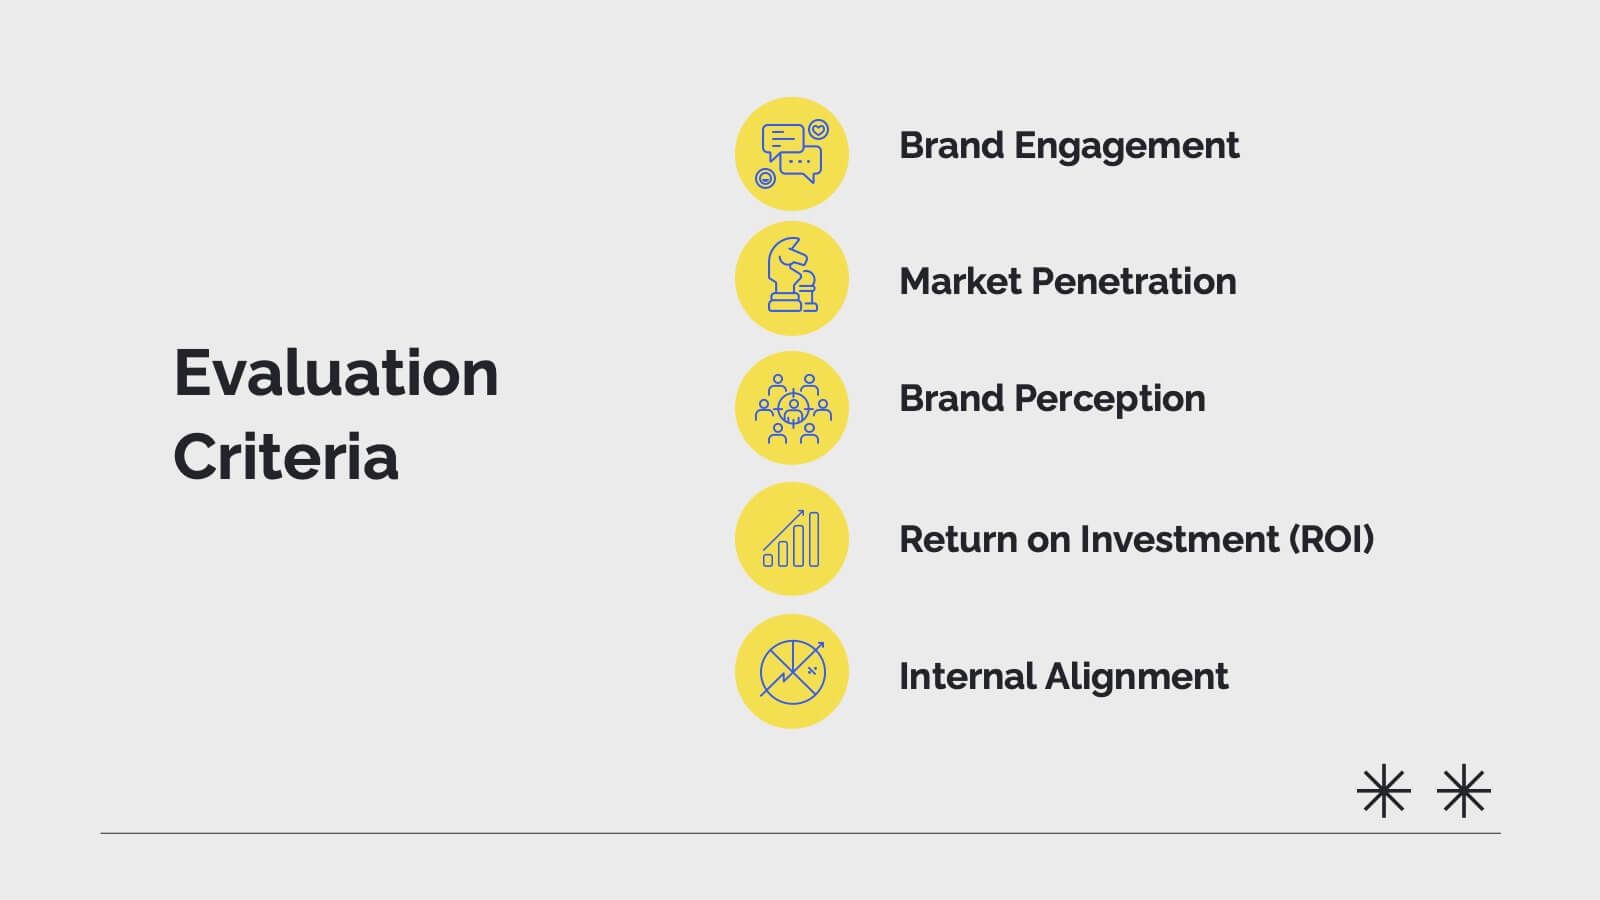
Pulse Project Management Plan Presentation
Streamline your project management with this vibrant template. It covers project overview, objectives, deliverables, methodology, timeline, budget, and risk management. Perfect for clear and engaging presentations. Compatible with PowerPoint, Keynote, and Google Slides for seamless customization.


7 diapositivas
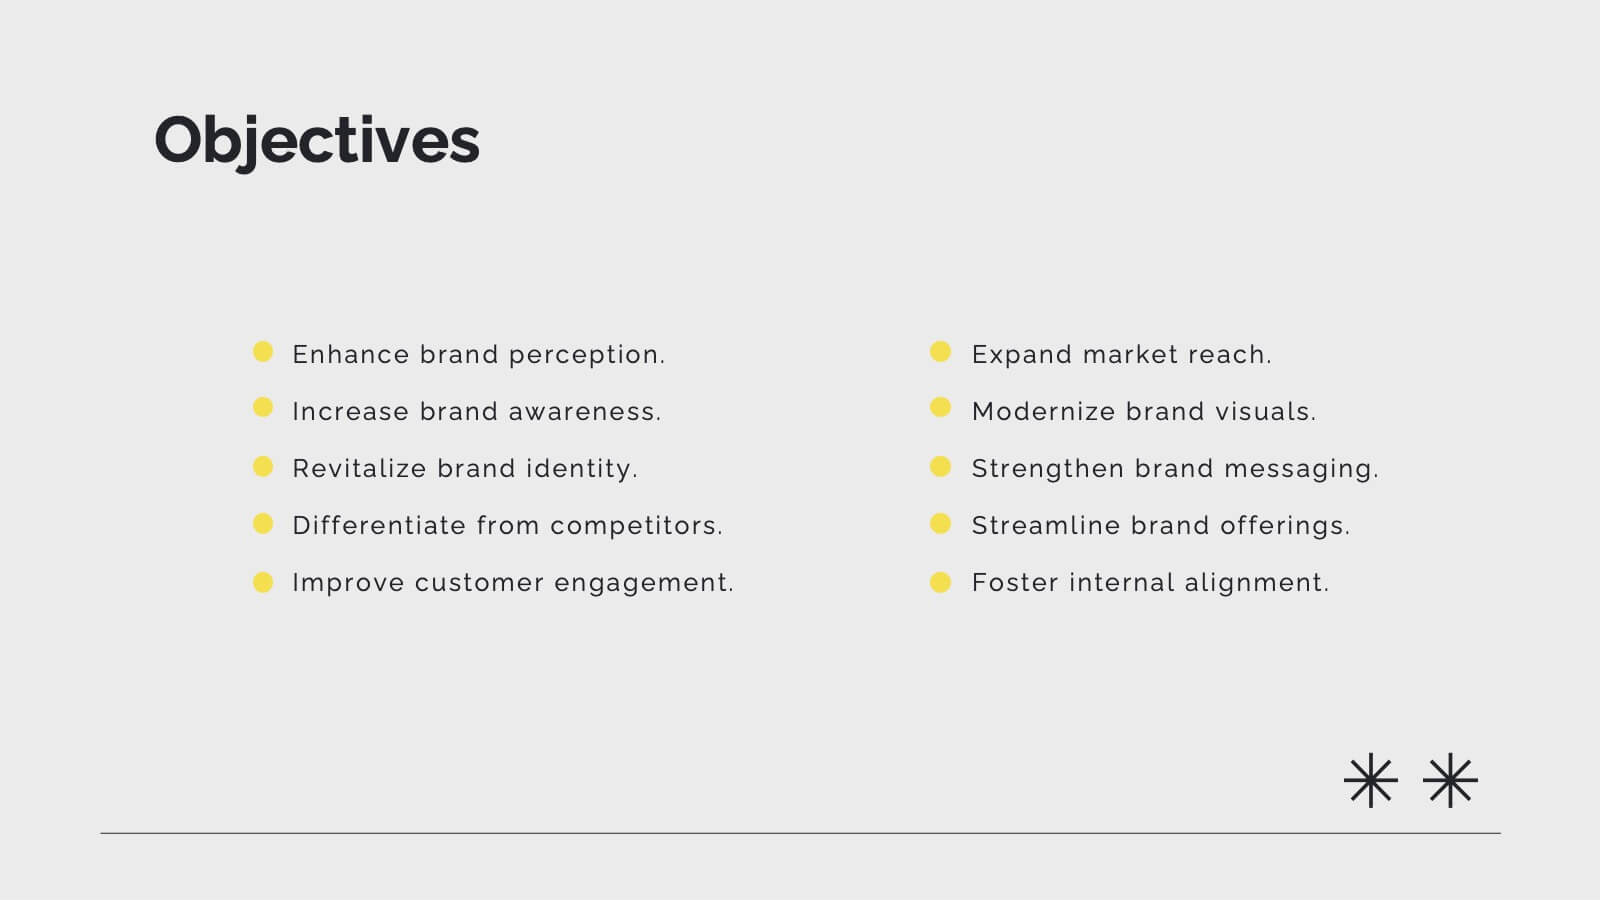
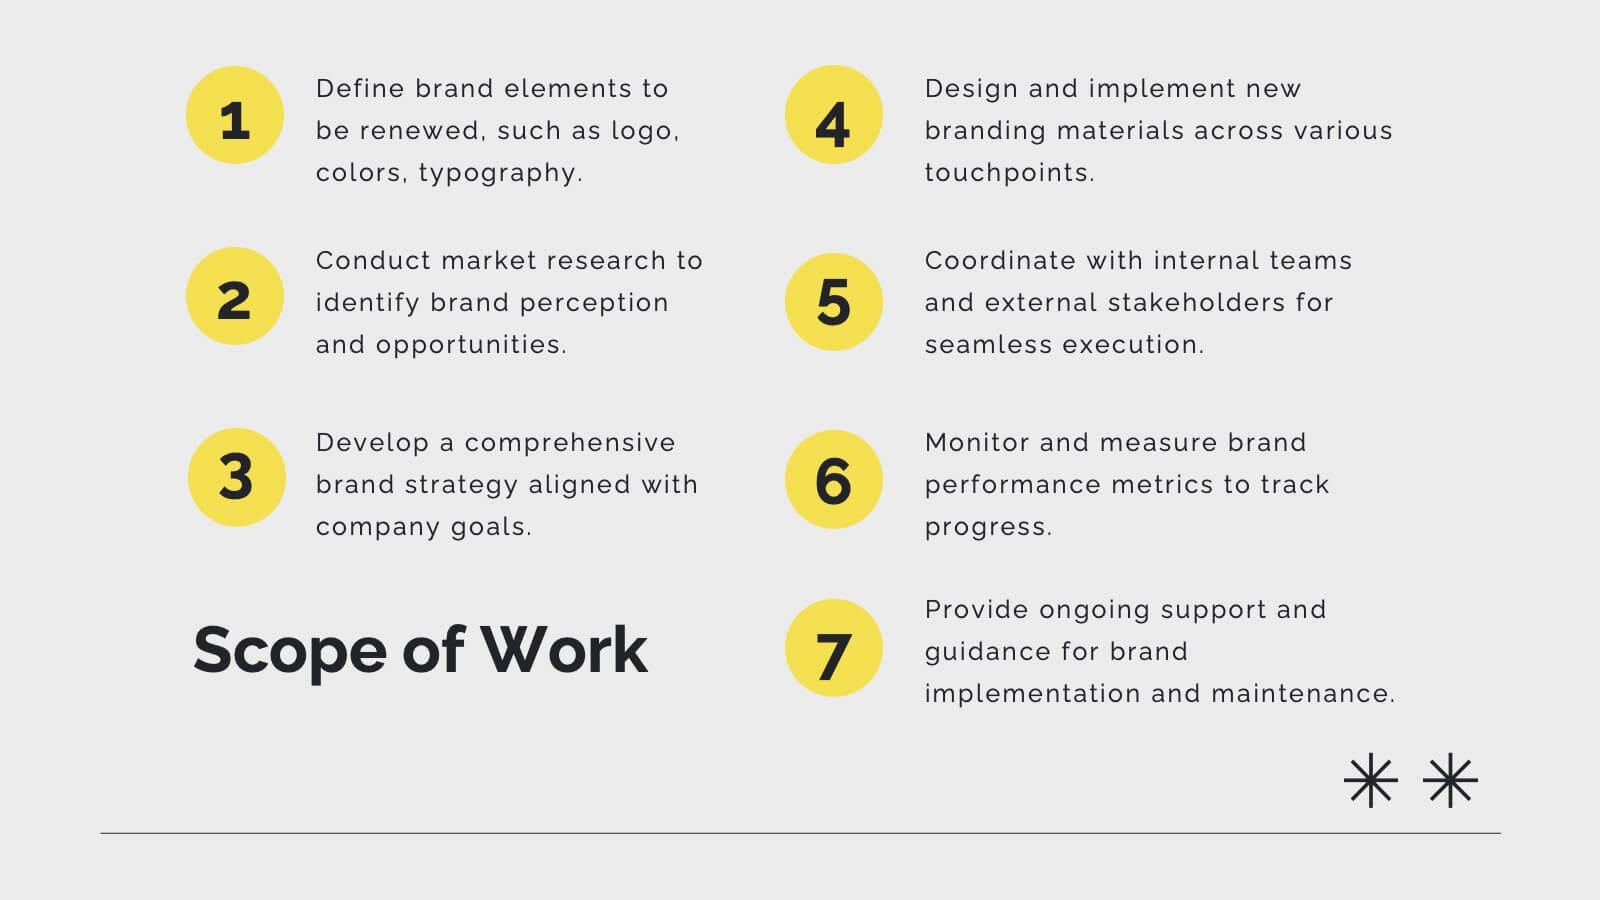
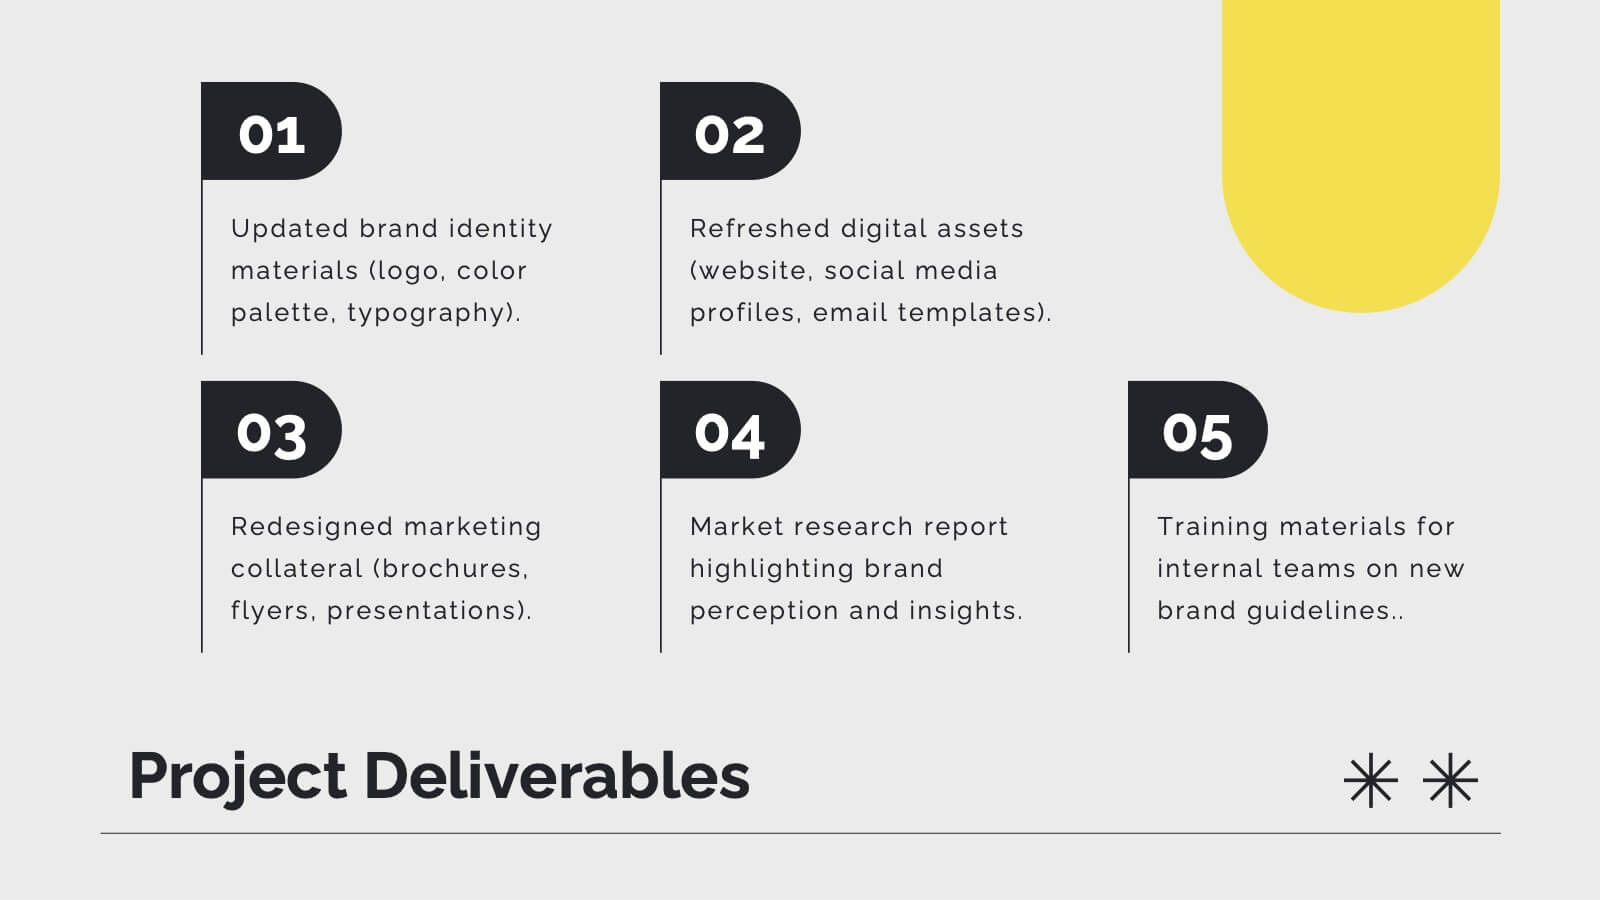
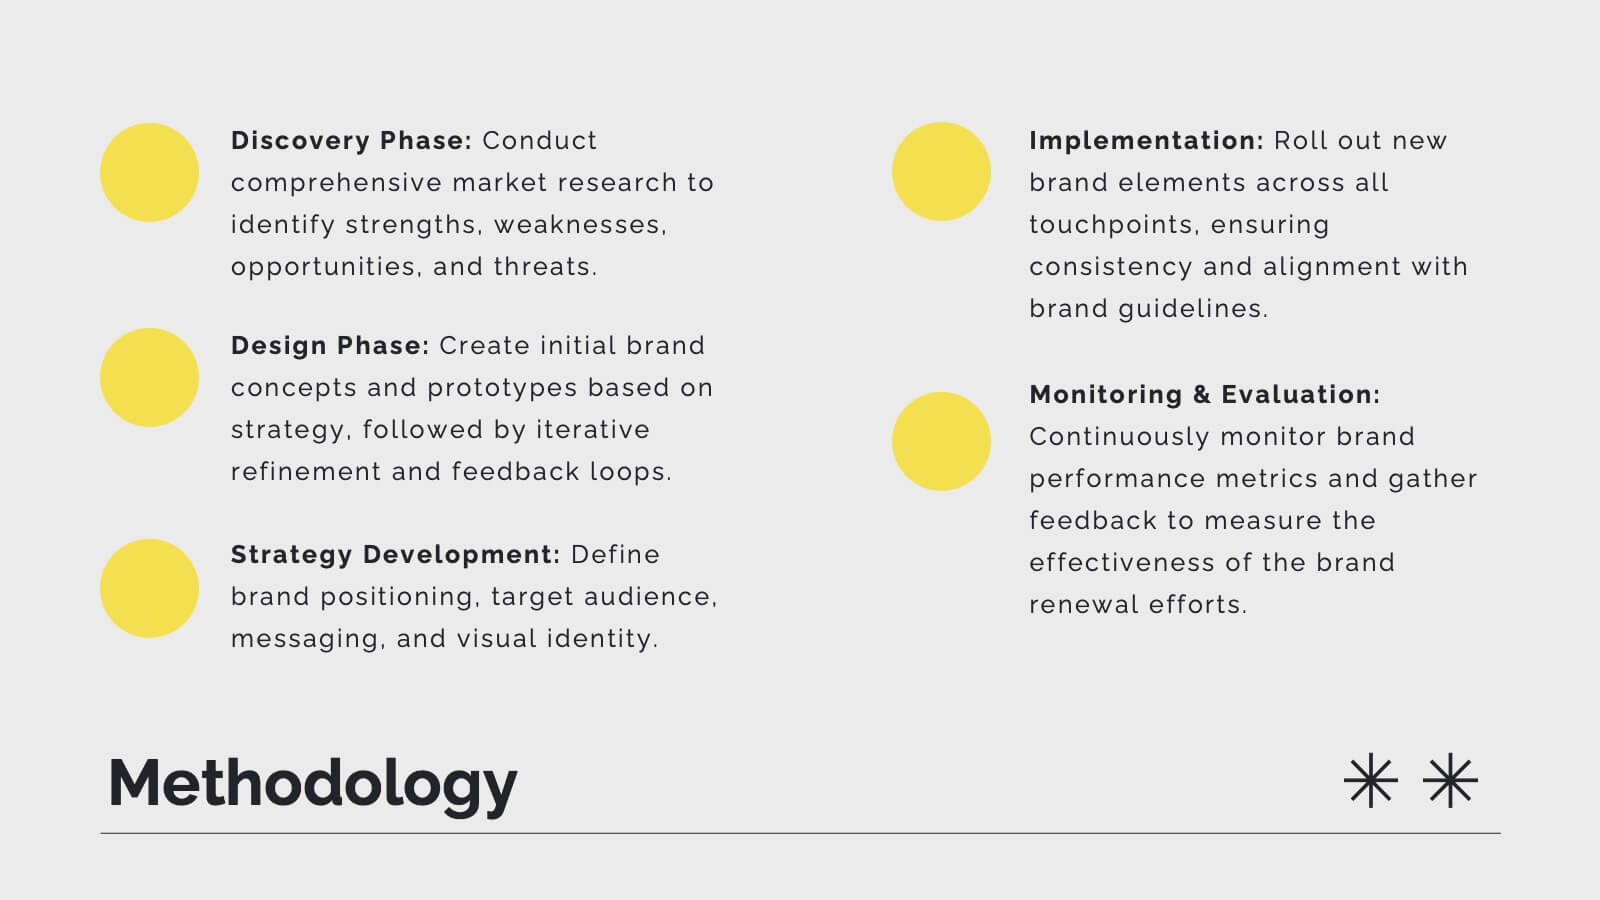
Goals Infographic Presentation Template
A goals infographic is a set of goals, objectives, or plans, often used for personal or organizational planning and development. This template allows you to include information about your specific goals, the steps required to achieve them, the timeline for completion, and any relevant metrics or targets. The purpose of our goals infographic is to help you provide a clear and concise overview of what is to be accomplished, and help you keep focus on achieving those goals. This well-designed infographic can help you prioritize and track progress, and can serve as a visual reminder.


4 diapositivas
Simple Daily Checklist Presentation
Stay organized and motivated with a clear, structured layout that helps you track tasks, goals, and priorities with ease. Perfect for daily planning, progress tracking, or productivity meetings, this presentation keeps everything simple and focused. Fully compatible with PowerPoint, Keynote, and Google Slides for smooth, customizable editing.


5 diapositivas
Population Segmentation by Demographic Factors Presentation
Break down audience demographics with this segmented infographic slide. Featuring a vertical figure illustration divided into color-coded percentage bars, it’s ideal for showcasing traits like age, gender, or location. This layout offers a clear visual summary, making it perfect for reports, marketing briefs, or investor presentations. Fully editable in Canva.


5 diapositivas
Enterprise IT System Design Presentation
Create a professional Enterprise IT System Design presentation with this structured diagram. Ideal for showcasing IT infrastructure, system architecture, data flow, and integration strategies, this fully customizable template is compatible with PowerPoint, Keynote, and Google Slides.


6 diapositivas
Safety Equipment Infographic
Safety equipment refers to various tools, devices, and gear that are designed to protect individuals from potential hazards and accidents in various environments and situations. This infographic involves presenting essential safety equipment, their uses, and benefits. With this template you can encourage your audience to prioritize the use of appropriate safety equipment. The combination of clear text, icons, and visuals will help viewers understand the significance of safety equipment and its role in preventing accidents and injuries. Compatible with Powerpoint, Keynote, and Google Slides. Choose a color scheme that aligns with safety and caution.


6 diapositivas
Project Scope and Deliverables Overview Presentation
Make your project presentations flow effortlessly with a clear, structured layout that highlights goals, milestones, and deliverables. Ideal for tracking progress and aligning teams, this professional design balances clarity and style. Fully compatible with PowerPoint, Keynote, and Google Slides for smooth editing and presentation flexibility.


4 diapositivas
Business Development Roadmap Presentation
Visualize your growth journey with this Business Development Roadmap Presentation. Featuring a winding road design with four milestones, it’s perfect for showcasing project phases, strategic goals, or quarterly plans. Each checkpoint is color-coded and icon-based for easy comprehension. Fully editable in PowerPoint, Keynote, and Google Slides.


4 diapositivas
Leadership Development and Growth Presentation
Explore the dynamics of effective leadership with our Leadership Development and Growth Presentation. This template illustrates the progressive stages of leadership maturity with unique, visually appealing graphics, making it ideal for workshops and seminars. Compatible with major presentation software to ensure accessibility and ease of use.


21 diapositivas
Mystara Project Status Report Presentation
Keep stakeholders informed with this clean and professional project status report template. Cover key areas such as performance metrics, financial summaries, team productivity, and future priorities. Perfect for tracking progress and making data-driven decisions. Fully customizable for PowerPoint, Keynote, and Google Slides.


6 diapositivas
Weekly Task Schedule Presentation
Stay on top of your week with this clean and efficient layout designed to organize daily priorities and action plans. Perfect for tracking goals, meetings, or team deliverables, it keeps productivity front and center. Fully customizable and compatible with PowerPoint, Keynote, and Google Slides for easy professional presentation use.


6 diapositivas
Change Management Process Infographic
Change management is a structured approach used by organizations to transition from their current state to a desired future state. This infographic template is designed to showcase the steps and components involved in managing organizational changes effectively. This template helps viewers understand the process and key elements required for successful change management. This informative infographic can be shared with employees, managers, or students to provide a clear understanding of the steps and strategies involved in successfully implementing organizational changes. Compatible with Powerpoint, Keynote, and Google Slides.


6 diapositivas
Discussion Starter and Inquiry Prompt Presentation
Kick off meaningful conversations with style and clarity. This discussion prompt slide uses a flowing layout and droplet-shaped icons to guide teams through key questions or ideas—ideal for brainstorming sessions, workshops, and meeting agendas. It’s a great way to visually organize dialogue. Fully compatible with PowerPoint, Keynote, and Google Slides.


6 diapositivas
SMART Goal Setting Process Presentation
Clearly define and communicate your business goals with the SMART Goal Setting Process slide. This layout visually breaks down the SMART framework—Specific, Measurable, Achievable, Relevant, and Time-bound—using icons, headers, and editable descriptions for each section. Ideal for strategy planning, goal tracking, and team alignment. Easily customizable in PowerPoint, Keynote, and Google Slides to suit any industry or project.


6 diapositivas
Website Optimization and Traffic Insights Presentation
This infographic set helps break down complex analytics into bite-sized, visually engaging pieces. Use these slides to highlight traffic sources, performance metrics, user journeys, and conversion flows in a circular format that keeps viewers focused. These templates are fully customizable and compatible with PowerPoint, Keynote, and Google Slides.